Infrared Absorption Spectrum of KN3 Crystal: Selection Rules and Analysis of Internal ± Internal...
10
Infrared Absorption Spectrum of KN3 Crystal: Selection Rules and Analysis of Internal ± Internal and Internal ±External Mode Absorptions Zafar Iqbal Citation: J. Chem. Phys. 57, 2422 (1972); doi: 10.1063/1.1678605 View online: http://dx.doi.org/10.1063/1.1678605 View Table of Contents: http://jcp.aip.org/resource/1/JCPSA6/v57/i6 Published by the American Institute of Physics. Additional information on J. Chem. Phys. Journal Homepage: http://jcp.aip.org/ Journal Information: http://jcp.aip.org/about/about_the_journal Top downloads: http://jcp.aip.org/features/most_downloaded Information for Authors: http://jcp.aip.org/authors Downloaded 08 Mar 2013 to 131.211.208.19. Redistribution subject to AIP license or copyright; see http://jcp.aip.org/about/rights_and_permissions
Transcript of Infrared Absorption Spectrum of KN3 Crystal: Selection Rules and Analysis of Internal ± Internal...

Infrared Absorption Spectrum of KN3 Crystal: Selection Rules and Analysisof Internal ± Internal and Internal ±External Mode AbsorptionsZafar Iqbal Citation: J. Chem. Phys. 57, 2422 (1972); doi: 10.1063/1.1678605 View online: http://dx.doi.org/10.1063/1.1678605 View Table of Contents: http://jcp.aip.org/resource/1/JCPSA6/v57/i6 Published by the American Institute of Physics. Additional information on J. Chem. Phys.Journal Homepage: http://jcp.aip.org/ Journal Information: http://jcp.aip.org/about/about_the_journal Top downloads: http://jcp.aip.org/features/most_downloaded Information for Authors: http://jcp.aip.org/authors
Downloaded 08 Mar 2013 to 131.211.208.19. Redistribution subject to AIP license or copyright; see http://jcp.aip.org/about/rights_and_permissions
THE JOURNAL OF CHEMICAL PHYSICS VOLUME 57, NUMBER 6 15 SEPTEMBER 1972
Infrared Absorption Spectrum of KN a Crystal: Selection Rules and Analysis of Internal ± Internal and Internal ±External Mode Absorptions
ZAFAR IQBAL
Explosives Division, Feltman Research Laboratory, Picatinny Arsenal, Dover, Nmv Jersey 07801 (Received 3 April 1972)
In this paper we report the measurement of the polarized infrared spectrum between 400 and 5000 cm-1
of single crystal KNa, at 80° and 298°K. A large number of absorptions due to internal, internal± internal, and internal±external mode transitions were observed. Selection rules for internal±internal and internal±external phonon pairs along different symmt!try sections of the Brillouin zone have been worked out. The observed band structure is assigned in many cases to critical points along symmetry lines and at points in the Brillouin zone, in terms of these selection rules. In the r, 2:, M, A, and H regions of the zone the spectral observations concerning the external translatory modes are compared with the rigid ion model calculation and neutron data of Rao e/ al.
I. INTRODUCTION
The infrared absorption spectrum of single crystal KNa was first reported by Bryant.1 The polarization data reported, however, were poorly resolved and the assignments of the internal±external side bands were made without a knowledge of the k"-'O external mode spectrum and without taking the space group selection rules and the dispersion of the phonon branches into consideration. Since then data on the Raman and infrared active external phonons have become available,2-5 while recently Rao et al.6 have calculated the dispersion of the translatory phonons and determined the acoustic phonon energies in the (001) and (110) directions by neutron spectroscopy. In view of these advances and the current interest in the lattice dynamics of KN 3 and related molecular type ionic crystals, a detailed measurement and analysis of the polarized infrared absorption spectrum of KN a between 400 and 5000 cm-1 was undertaken. In this work the spectral analysis will be given in terms of the group theoretical selection rules of pairs of internal±internal and internal±external phonons at different points and lines of the Brillouin zone, together with a comparison of the mode energies with the translatory mode surfaces computed by Rao et al.6
The results can form a starting point for the elucidation of the optical phonon frequencies by neutron spectroscopy. Similar studies in general can provide lattice dynamical information on crystals which are more complex in structure and difficult to grow in sizes which are large enough for neutron spectroscopy. Previous attempts at analyzing the numerous internal±internal and internal±external absorptions of such crystals in terms of the space group selection rules have been made by Oehler and Gtinthard7 for Ca(OHh and Hellwege et at.8 for NaNOa.
II. THEORETICAL
A. Crystal Structure and Brillouin Zone of KN a
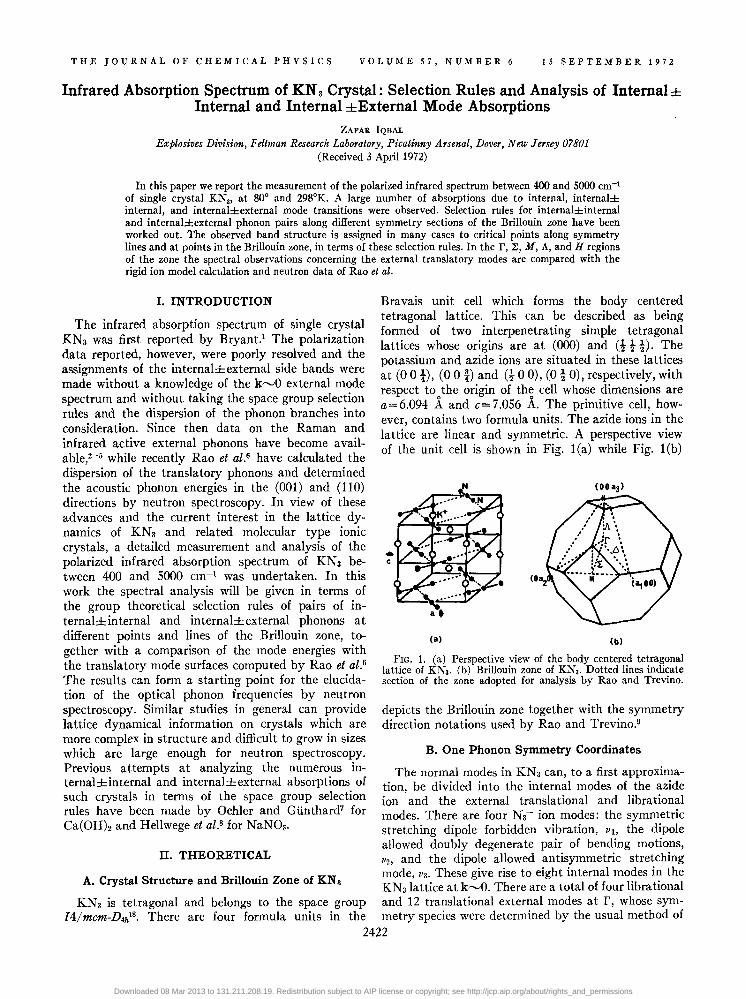
Bravais unit cell which forms the body centered tetragonal lattice. This can be described as being formed of two interpenetrating simple tetragonal lattices whose origins are at (000) and (t t t). The potassium and azide ions are situated in these lattices at (00 t), (00 !) and (t 0 0), (0 to), respectively, with respect to the origin of the cell whose dimensions are a=6.094 A and c=7.056 A. The primitive cell, however, contains two formula units. The azide ions in the lattice are linear and symmetric. A perspective view of the unit cell is shown in Fig. l(a) while Fig. l(b)
(a) (b)
FIG. 1. (a) Perspective view of the body centered tetragonal lattice of KNa• (b) Brillouin zone of KNa. Dotted lines indicate section of the zone adopted for analysis by Rao and Trevino.
depicts the Brillouin zone together with the symmetry direction notations used by Rao and Trevino.9
B. One Phonon Symmetry Coordinates
The normal modes in KN3 can, to a first approximation, be divided into the internal modes of the azide ion and the external translational and librational modes. There are four N3- ion modes: the symmetric stretching dipole forbidden vibration, /11, the dipole allowed doubly degenerate pair of bending motions, /12, and the dipole allowed antisymmetric stretching mode, /13. These give rise to eight internal modes in the KNalattice at k"-'O. There are a total of four librational
KNa is tetragonal and belongs to the space group and 12 translational external modes at r, whose sym-14/mcm-D4hI8. There are four formula units in the metry species were determined by the usual method of
2422
Downloaded 08 Mar 2013 to 131.211.208.19. Redistribution subject to AIP license or copyright; see http://jcp.aip.org/about/rights_and_permissions

INFRARED ABSORPTION OF KNa CRYSTAL 2423
Bhagavantam and· Venkatarayudu. lO It must be pointed out that only the optical modes of Eu and A2u
symmetry are infrared active. The notation adopted for the k",O external modes of KN 3 for the purpose of this paper is given in Table r. The correlation of the modes at r with those along the symmetry directions ~ and A and the zone boundary point M were determined using the compatibility relations set up by Rao and Trevino.9 This is shown in Table II. The infrared activity of the irreducible representations are also indicated in Table II with respect to the fourfold c aXls.
c. Internal±Internal and Internal±External Mode Selection Rules
Second order spectra due to anharmonic and/or charge deformation are observed usually when one or more photons interact with two or more neighboring atomic or molecular units in a crystal. Since the incident photon wave vector in an infrared experiment is nearly zero, the conservation of momentum in a two phonon process is satisfied if the two phonons have equal and opposite wave vectors k and -k. This condition allows the phonon wave vectors in such a transition to range throughout the Brillouin zone.
Following Born it can be assumed that only those phonons in each branch participate in optical processes which arise from regions where there is a high density of phonon states per wave vector interval. These regions at which the wave vector function has a vanishing slope (~kV=O) or an analytic saddle point are known as critical points (CP). Each CP phonon must be assigned to one of the irreducible representations of the crystal space group and usually occur at symmetry points at the center or edge of the Brillouin zone, and in some cases along symmetry lines within the zone.
In the case of a two phonon pair in KNa involving an internal and an external mode, one can assume to a first approximation that the higher energy internal mode branches would show negligible dispersion in k
TABLE 1. Notation adopted for r point external modes in KNa.
Mode type Symmetry Notation
Optic translatory A •• Tl Optic translatory A.u T. Optic translatory B lu Ta Optic translatory E. T, Optic translatory Eu T5 Optic translatory Eu T6 Acoustic E. T7 Acoustic A •• Ts Librational A •• Rl Librational B l• R. Librational E. Ra
l00·-.~ .... _. 'r· .... j I \
700 Energy, cm-l
600
100
Energy, cm-1
FIG. 2. (a) Transmission infrared spectra at 29SoK in the parallel c (dotted line) and perpendicular c (full line) polarization, of sing~e ~rys~al KN3 ("" 100 ~m thick) in th~ V2 region. (b) TransmissIOn mfrared spectra at SOaK in the parallel c (dotted line) and perpendicular c (full line) polarization of a single crystal KN3 . ("" 100 ~m thick) in the VI +V3 and 2vz+va region. The peaks which arise due to beam convergence are marked by the letter C, while the peaks which could arise due to impurities are marked with asterisks.
space and hence the CP involved would be those of the external modes. The method used in writing down the selection rules is illustrated for the vl±external mode, in Table III(a). Using the compatibility relations given in Table II, one determines the representations to which the,internal and external modes belong within the particular little group. The direct product representation gives rise to an infrared active transition if it belongs to the representation of a translational group polarized either perpendicular or parallel to the unique c axis of the crystal. This is shown in Column 5 of Table III (a) while Column 6 shows the k--O notation of the external mode branches. The latter are collected together for all the directions and the three sets of combination modes in Table III, while the
Downloaded 08 Mar 2013 to 131.211.208.19. Redistribution subject to AIP license or copyright; see http://jcp.aip.org/about/rights_and_permissions

2424 ZAFAR IQBAL
TABLE II. Breakdown into one phonon mode types at r point, ~ and 11 lines and M point in KNa Brillouin zone, together with compatibility relations.
Little Zone" IR Rep. Compatibility group Gk direction activity of Gk ~ Ta T R 1Jib with k",O rep.
DfA r AI.(T,)" 1 0 0 0 A, .. (T2) 0 0 0 0 0 A,. (Ta) 2 0 1 0
c A'u(T,) 3 1 0 1 BI.(TS) 1 0 0 1 0 Blu (T6) 2 0 1 0 1 B .. (T7) 0 0 0 B'v(TS) 0 0 0 0 0 E.(T9) 2 0 1 1 0
a, b E,,(no) 5 2 0 2 C •• 11 c AI(n) 4 1 0 2 A,.+A 2u
A,(T2) 2 0 1 0 A,,,+A2• B,(TS) 1 0 0 1 0 B I.+B2"
B,(n) 3 0 1 0 2 B I,,+B2• a, b E(TS) 7 1 3 1 2 E.+Eu
C2v a AI(Td 7 1 2 0 4 AI.+B,.+E., A 2(n) 2 0 1 0 A I .. +B2,.+E.
b BI(TS) 8 3 2 2 A,.+BI.+E.. c B,(T,) 7 1 3 1 2 A 2., +B,.,+E.
D21J M A.h) 2 0 0 0 2 A I.+B2• A I,. (T2) 0 0 0 0 0 A I.,+B2,. BI.(TS) 2 0 1 0 E.
a B,.,(T,) 5 1 2 0 2 E .. B2.h) 2 0 1 0 Eo
b B2.,(T6) 5 2 0 2 E .. Bs.h) 3 0 2 0 A 2.+B,.
c Bs., (TS) 5 2 0 2 A 2,.+BI,.
• Notation used by Rao and Trevino (Ref. 9). b~, total number of modes. T a, acoustic modes. T, translatory optic modes. R, librational modes. ni, internal modes.
expected splittings for the internal±internal modes are given in Table IV. The observed number of splittings for the r, M, and H points will not be as large as predicted since the correlation field splittings of the component internal modes in KNa are usually less than 5 cm-l,n The selection rules for the ~ and A directions would be followed only if there are CP within the Brillouin zone.
III. EXPERIMENTAL DETAILS AND RESULTS
The KNa crystals used were either grown by slow evaporation of an aqueous solution of the salt or from the melt by the method due to Sharma and Appleton.12
The melt grown crystals used were grown in this laboratory by R. Uhrin. Crystals of known orientation were cut to form thin platelets in the (100) direction. The crystallographic axes were determined using polarized optical microscopic and Raman spectroscopic techniques. For measurements in the strongly absorbing regions of the spectrum, a crystal was thinned down to 100 ~m by polishing on a jeweller's cloth moistened with a 80% solution of alcohol in water.
The spectral measurements were made using a double beam Perkin Elmer 621 grating spectrometer with an AgCI wire grid polarizer placed at the entrance slit of the monochromator. The spectra were recorded with the unique c axis of the crystal oriented perpendicular or parallel to the incident photon electric vector. The low temperature measurements were made with the crystal mounted on the brass cold finger of a conventional Hofman low temperature Dewar with a modified microtail section and alkali halide windows. The spectrometer readings were calibrated throughout the spectral range using thin films of polystyrene and the values quoted are accurate to about ±1 em-I. The resolution is approximately between 1 and 2 cm-l
throughout the spectral region. Since most of the thinned down crystals used in the
measurements were ,.....,.,2 mm2 in area, most of the spectra were recorded with the sample mounted at the focal point of a dual mirror beam condensing arrangement. Measurements were also made without the beam condenser using larger crystals, in order to determine features in the spectra which might result due to beam convergence. It was found that sharp
Downloaded 08 Mar 2013 to 131.211.208.19. Redistribution subject to AIP license or copyright; see http://jcp.aip.org/about/rights_and_permissions
INFRARED ABSORPTION OF KNa CRYSTAL 2425
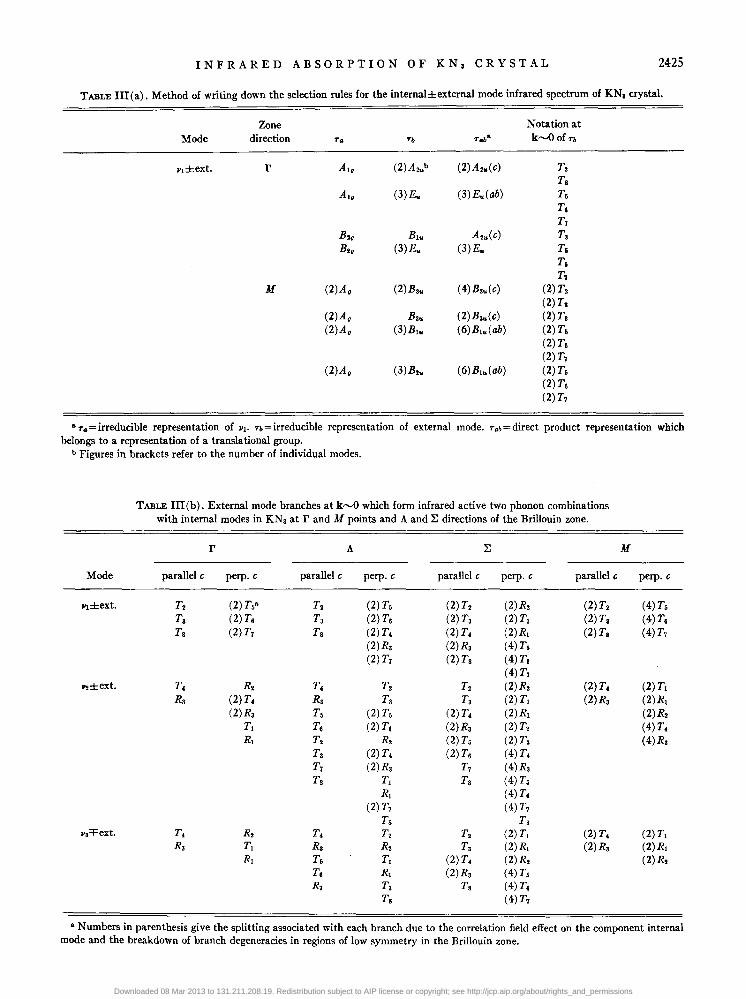
TABLE III (a) . Method of writing down the selection rules for the internal±external mode infrared spectrum of KNa crystal.
Mode Zone
direction
r
M
'TG
AI.
AI.
B,• BI •
(2)A.
(2)A. (2)A.
(2)A.
'Tb
(2)Azub
(3)&
BI" (3)&
(2)Bau
Bau (3)Blu
(3)B2u
Notation at 'TGb& k~of'Tb
(2)A 2.(c) Tz Ts
(3)&(ab) T6 T,
T7 A.u(c) Ta
(3)E" Tr. T,
Tl ( 4)Bau(c) (2)T.
(2) Ts (2)Bau(c) (2) Ts (6)Blu(ab) (2) T6
(2) T6 (2)T7
(6)Blu(ab) (2) Ts (2) Ts (2) T7
a'T .. =irreducible representation of Pl. 'Tb=irreducible representation of external mode. 'Tab=direct product representation which helongs to a representation of a translational group.
b Figures in brackets refer to the number of individual modes.
TABLE III (b) . External mode branches at k~ which form infrared active two phonon combinations with internal modes in KNa at rand M points and A and l: directions of the Brillouin zone.
r A l: M
Mode parallel c perp. c parallel c perp. c parallel c perp. c parallel c perp. c
l'I±ext. T. (2) T6& T. (2) Ts (2) T. (2)R. (2) Tz (4)T6 Ta (2)Ts T3 (2) T6 (2)Ta (2) TI (2) Ta (4)Ta Ts (2) T7 Tg (2) T. (2)T, (2)R, (2)Ts (4) T7
(2)Ra (2)Rs (4)T6 (2) T7 (2) Ts (4)Ta
(4)T7 pz±ext. T, Rz T, T. T. (2)R. (2)T. (2)T,
Rs (2)T, R. Ts Ts (2) T, (2)& (2)R, (2)Rs T6 (2) T6 (2)T, (2)RI (2)R.
T, Ta (2)T6 (2)Rs (2)T. (4) T, R, T. R. (2) Ts (2) T3 (4)R.
Ts (2) T, (2) T6 (4) T. T7 (2)R3 T7 (4)R3 Tg TI Ts (4) Ts
R, (4) T6 (2) T7 (4)T7
Ts Ts p,'f'ext. T. R. T, T. T. (2) T, (2)T. (2) T,
Ra T, Ra R. Ta (2)R, (2)Ra (2)R, R, T6 T, (2)T, (2)R. (2)R2
T6 RI (2)Ra (4) T6 R7 Ta Ts (4)T6
Ts (4) T7
• Numbers in parenthesis give the splitting associated with each branch due to the correlation field effect on the component internal mode and the breakdown of branch degeneracies in regions of low symmetry in the Brillouin zone.
Downloaded 08 Mar 2013 to 131.211.208.19. Redistribution subject to AIP license or copyright; see http://jcp.aip.org/about/rights_and_permissions

2426 ZAFAR IQBAL
TABLE IV. Number of infrared active components of internal±internal modes at rand M points and l: and A lines in KNa.
r A l: M
Mode parallel c perp. c parallel c perp. c parallel c perp. c parallel c perp. c
1'1+l'a 0 2 0 21'2 0 0 3 21'2+l'a 0 4 0 21'2-1'2 4 4 4 1'1±1'2 2 2 2
and relatively weak peaks at 2087 cm-l due to Va and at 3280 and 3358 cm-l due to 2V2+va and vl+va respectively (see Discussion) were observed in the parallel c polarized spectrum, although these bands are forbidden in this polarization. The fundamental band at 2080 cm- l was shifted to a higher value by 7 cm-l in the parallel c polarized spectrum. This observation agrees with the work of Wood and Mitral3
on the effect of beam convergence on the polarized infrared spectrum of calcite. Other features in the spectrum of KNa do not appear to be affected by the beam condensing optics.
Weak bands at 1250 and 1300 cm-l due to N02-
and NOa- ion impurities in KNa were observed in the infrared spectra. These bands have been subtracted out from the spectra presented in this paper. Other peaks which are thought to be associated with impurities are marked with asterisks in the appropriate figures.
The infrared absorption spectra of the internal± internal multiphonon regions between 600 and 800 cm-l and 3000 and 3500 cm-1 are shown in Fig. 2(a)
(a) (b)
800
Energy, cm-1
Ilc
.,.. ...
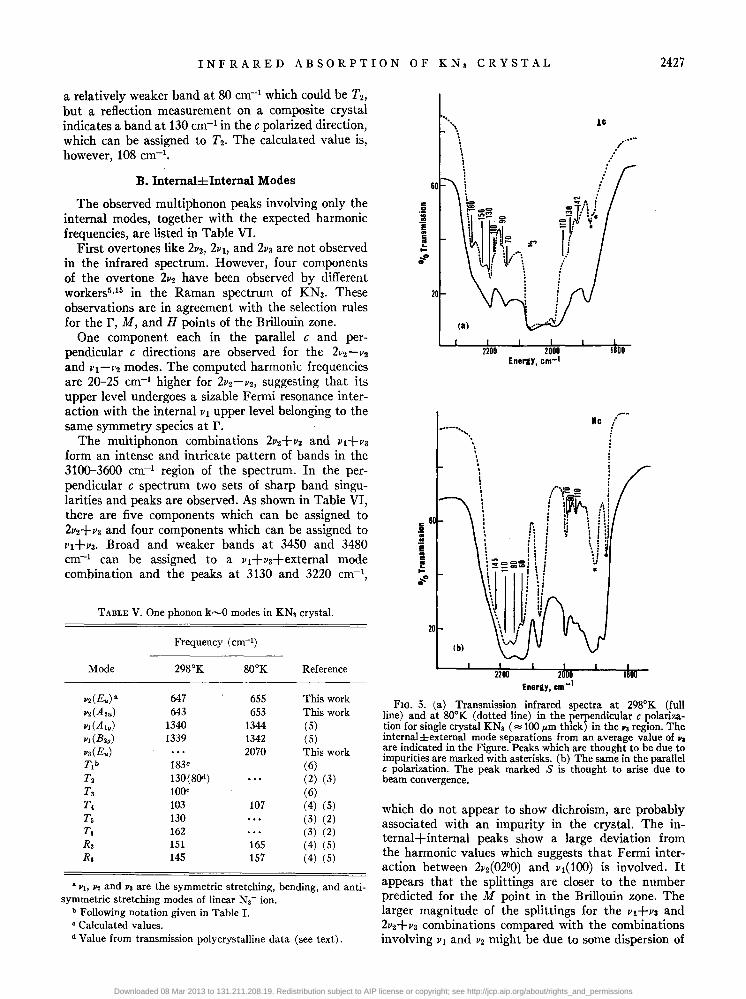
FIG. 3. (a) Transmission infrared spectra at 298°K (full line) and at 800 K (dotted line) in the perpendicular c polarization for a single crystal of KNa (",,200 J.<m thick), in the 1'2 region. The internal±external mode separations from an average value of 1'2
are indicated in the Figure. (b) The same in the parallel c polarization.
2 0 4 0 4 0 0 4 0 0 4 0 8 0 8 4 8 8 8 8 2 4 4 4 4
. and 2(b). Figure 3 shows the v2±external spectra between 600 and 800 cm-1 while Figs. 4 and 5 show similar data for the I'I±external and I'a±external regions respectively.
IV. DISCUSSION
A. One Phonon k'""O Spectrum
The experimental values of the infrared and Raman active k'""O internal and external phonons in KNa are listed in Table V. The values for the silent Tl and Ta modes included in this table have been taken from the calculated frequencies of Rao et at. at r. Among the translational modes there is good agreement between the calculated and experimental values, except for T2•
Transmission2 and reflection far infrareda measurements agree quite well for the modes at 130 and 162 em-I, which have been assigned to T5 and Ta respectively.I4 Transmission measurements, however, indicate
c: o
-= ·e .. c: ~ ... ~
1600 1400 1200
Energy,.cM-1
FIG. 4. Transmission infrared spectra at 298°K (full line) and at 800 K (dotted line) in the perpendicular c (curves A) and parallel c (curves B) polarization for single crystal KNa (""200 J.<m thick), in the PI region. The internal±external mode separations from an average value of PI are indicated in the Figure. Peaks which are thought to be due to impurities are marked with asterisks.
Downloaded 08 Mar 2013 to 131.211.208.19. Redistribution subject to AIP license or copyright; see http://jcp.aip.org/about/rights_and_permissions
INFRARED ABSORPTION OF KNa CRYSTAL 2427
a relatively weaker band at 80 cm-1 which could be T2,
but a reflection measurement on a composite crystal indicates a band at 130 cm-1 in the c polarized direction, which can be assigned to T2• The calculated value is, however, 108 em-I.
B. Internal±Internal Modes
The observed multiphonon peaks involving only the internal modes, together with the expected harmonic frequencies, are listed in Table VI.
First overtones like 2V2, 2V1, and 2va are not observed in the infrared spectrum. However, four components of the overtone 2V2 have been observed by different workers5,15 in the Raman spectrum of KNa. These observations are in agreement with the selection rules for the r, M, and H points of the Brillouin zone.
One component each in the parallel c and perpendicular c directions are observed for the 2V2-V2 and 1"1-1'2 modes. The computed harmonic frequencies are 20-25 cm-1 higher for 2V2-V2, suggesting that its upper level undergoes a sizable Fermi resonance interaction with the internal VI upper level belonging to the same symmetry species at r.
The multiphonon combinations 2v2+va and 1'1+l'a form an intense and intricate pattern of bands in the 3100-3600 cm-1 region of the spectrum. In the perpendicular c spectrum two sets of sharp band singularities and peaks are observed. As shown in Table VI, there are five components which can be assigned to 2V2+va and four components which can be assigned to l'l+l'a. Broad and weaker bands at 3450 and 3480 cm-1 can be assigned to a v1+va+external mode combination and the peaks at 3130 and 3220 cm-I,
TABLE V. One phonon k~O modes in KNa crystal.
Mode
112 (Eu) • 112 (A 2u) III (Ala) III (B2a) lIa(Eu) Tlb T2 Ta T4 T5 T. R2 Ra
Frequency (cm-l )
298°K
647 643
1340 1339
183· 130(8()d) 100· 103 130 162 151 145
Reference
655 This work 653 This work
1344 (5) 1342 (5) 2070 This work
(6) (2) (3) (6)
107 (4) (5) (3) (2) (3) (2)
165 (4) (5) 157 (4) (5)
• II" JI2 and I'a are the symmetric stretching, bending, and anti-symmetric stretching modes of linear N. - ion.
b Following notation given in Table 1. • Calculated values. d Value from transmission polycrystalline data (see text).
. .. --.......
20
(b)
'\,
· · · · ·
.--lie (
!
; , ill i H
• i:J '.. J j V •
FIG. 5. (a) Transmission infrared spectra at 298°K (full line) and at 800 K (dotted line) in the perpendicular c polarization for single crystal KNa ("" 100 ~m thick) in the lIa region. The internal±external mode separations from an average value of III
are indicated in the Figure. Peaks which are thought to be due to impurities are marked with asterisks. (b) The same in the parallel c polarization. The peak marked S is thought to arise due to beam convergence.
which do not appear to show dichroism, are probably associated with an impurity in the crystal. The internal+internal peaks show a large deviation from the harmonic values which suggests that Fermi interaction between 2V2(02°0) and v1(100) is involved. It appears that the splittings are closer to the number predicted for the M point in the Brillouin zone. The larger magnitude of the splittings for the 1'1+V3 and 21'2+1'3 combinations compared with the combinations involving VI and 1'2 might be due to some dispersion of
Downloaded 08 Mar 2013 to 131.211.208.19. Redistribution subject to AIP license or copyright; see http://jcp.aip.org/about/rights_and_permissions

2428 ZAFAR IQBAL
TABLE VI. Internal±internal multiphonon frequencies in KNa crystal.
Observed infrared peaks (em-I) Raman
peaks· perp. c parallel c (em-I)
624 628
694 697
1256 1272 1284 1293
1990 1987 3257 3272 3277 3297 3327
3355 3367 3387 3407
Harmonic freq uencies
(em-I)
649 651 693 697
1286) 1294
33M) 3377
3423)
• Raman data from Refs. (5) and (15).
Assignment
J.'1-'P2
the strongly dipole allowed /13 internal vibration in k space. Apart from the sharp peaks at 3280 and 3358 cm-I , which occur due to beam convergence (see Experimental Details and Results), some weak bands are observed in the parallel c spectrum. Since infrared activity in the parallel c polarization is not expected for the /11+/13 and 2112+Jl3 modes in r, ~, A, M, and H sections of the Brillouin zone, it is likely that these peaks are due to combinations of these modes with external phonons.
C. Internal±External Modes
In the assignment of the internal±external modes the selection rules for the two phonon transitions given in Table III and the translatory mode dispersion curves along the ~ and A directions will be used as guidelines. Probable CP frequencies and the dispersion surface computed by Rao et al. are shown in Fig. 6. It must be pointed out that the assignments have neglected the dispersions along the symmetry direction .1, which are not known at present and the possibility that the dispersions of phonons of A 2g and Eo symmetry could involve a sizable librational-translational coupling. This feature was not included in the rigid ion model of Rao et at.
From the observed spectra it is evident that the two phonon modes are rather intense only in the case of combinations involving the strongly dipole allowed Va
internal vibration. In the case of the dipole forbidden ~·1 mode and the dipole allowed bending /12 mode the two phonon side bands are comparatively weak and in many cases the difference modes whose intensities are limited by the Boltzmann factor are not resolved. The summation bands are more clearly resolved at 80°. The assignments are made on the basis of the band positions estimated from the low temperature spectra. The difference modes, including those which have been assigned to internal-internal combinations, can be identified by the fact that the peaks show a large decrease in intensity at 800 K. The assignments which will be discussed below and the side band peak frequencies, are collected together in Table VII.
1. v2±External Modes
Five main singularities in the perpendicular c and two main singularities in the parallel c direction are expected at symmetry points r, M, and H, involving the even parity Tl and T4 translatory modes and the four lib rational modes. Seven peaks are observed in the perpendicular c spectrum and three in the parallel c spectrum. One would, therefore, expect that CP in the interior of the Brillouin zone, along ~, A, and .1 directions, would also contribute to the structure observed in the spectra.
The peaks at separations of 81 (perpendicular c), 90 (parallel c), and 96 (perpendicular c) cm-I are assigned as shown in Table VII to Tl and T4 phonons at zone boundary points. The peak at 156 cm-I (perpendicular c) separation can be assigned to the lib rational modes
'E u
200
,.;100 ___ ~~""
~ .. c: ...
0.8 k1kmax
FIG. 6. Dispersion curves for the translatory modes in the 2:: and A directions of the Brillouin zone after the results of Rao et ai. The r point phonons are marked according to the notation adopted in this paper while the branches in the interior of the zone are marked according to the notation of Rao and Trevino. Some extremal point frequencies are indicated by arrows in the Figure.
Downloaded 08 Mar 2013 to 131.211.208.19. Redistribution subject to AIP license or copyright; see http://jcp.aip.org/about/rights_and_permissions

INFRARED ABSORPTION OF KNa CRYSTAL 2429
TABLE VII. Phonon frequencies at critical points estimated from intemal±extemal two phonon infrared spectrum of KNa single crystal.
Perp. c Calc. or obs. Parallel c Calc. or obs. (em-I) Assignment (em-I) (em-I) Assignment (em-I)
v2+extemal
81 Tl atH 84 55 Ts at 1: 62 96 T, at H or M(T,) 90 71 T7 at 6.1
116 T. at A (near r) 107 90 T. at H or M(T.) 90 136 Ts or T6 at A 141
143 156 RI or R2 151 186 TI at 1: 184
vl+extemal
36 Ts at 6.? 65 Ts at 1: 62 91 T7 (Ta) at M 90 86 Ta at 1: (near r) 96
111 TS(Ta) at M 104 110 T2 at 1: (near r) 108a
121 TS(Tl) or T7(Tt) at ~ 125 121
136 Ts or Ts at A 141 143
156 Ts at r 162
va+extemal
70 ? 60 Ts at 1: 62 90 TlatH 84 90 T, at H or M(T,) 90
110 ? 110 T, at r 103 130 Ts{Tt) or T7 (Ti) at ~ 125 145 Ra 145 150 RI or R2 151 180 TI at 1: 184
a This assignment is in agreement with the calculated value of T2 (see Fig. 6) but not in good agreement with the r point experi-mental value of T2 (ef. Table V).
Rl or R2. R2 at r is 150 cm-1 while the silent Rl mode is expected to be close to this value at r. The remaining peaks can be assigned to extremal points within the zone, as shown in Table VII. Good agreement is obtained with the extremal point for Ts along ~ and for Ts and T6 along A from the calculated dispersion curves. The peak which is at a separation of 206 cm-1
has a rather high frequency and is likely to be a three phonon combination.
2. lIl±External Modes
Three main singularities in the r, M, and H points are expected in the perpendicular c direction involving the odd parity Ts, T6, and T7 translatory phonons and an equal number of main singularities involving the odd parity T2, Ta, and Ts translatory phonons are expected in the parallel c direction.
The peaks at separations of 91, 111, and 156 cm-1
in the perpendicular c spectrum can be assigned to T6, T6, and T7 modes at symmetry points, as shown in
Table VII. However, the peak at 156 cm-1 can also arise due to librational mode CP within the zone. The remaining peaks can be assigned to CP within the zone as shown in Table VII. These CP agree with the dispersion curves and are consistent with those observed in the lI2±external spectra. The peak observed at a separation of 36 cm-1 in the perpendicular c spectrum can be tentatively assigned to the Ts acoustic phonon branch in the interior of the zone along directions other than ~ and A.
3. lIa±External Modes
It has been pointed out previously that some dispersion of "a in k space can be expected. Hence the values of the CP phonons estimated from the lIa± external mode spectra are somewhat approximate. According to the selection rules for r, M, and H points, three sets of singularities in the perpendicular c spectra, involving R1, R2, and T 1 modes, would be expected. Six peaks are observed. The peaks at separations of
Downloaded 08 Mar 2013 to 131.211.208.19. Redistribution subject to AIP license or copyright; see http://jcp.aip.org/about/rights_and_permissions

2430 ZAFAR IQBAL
150 and 180 em-I, which correspond to the peaks observed in the P2±external spectra, can be assigned to Rl or R2 and Tl along 2:. The other peaks are assigned as shown in Table VII. The peaks at separations of 70 and 110 em-I do not correspond to any of the indicated extremal or zone boundary points. It is likely, therefore, that these peaks are associated with phonons in symmetry directions other than 2: or A.
Two main singularities involving the Ra and T4 phonons are expected for the parallel c spectra at r, M, and H points. Four peaks are observed and the assignments are given in Table VII. An extremal point at 60 em-I is indicated on the Ts branch along 2:, consistent with observations in the Pl±external and P2±external spectra.
V. SUMMARY
The internal V2 and 1'3 mode energies in KN3 have been determined from the infrared absorption spectra and the known k"""{) internal and external mode energies of this crystal have been collected together.
The selection rules for the internal±internal and internal±external mode transitions in KNa, along important directions of the Brillouin zone, have been worked out. The spectrum due to 2V2-V2, VI-V2, and 2V2 modes essentially follow the r point selection rules. The vl+ra and 2~2+va combinations give rise to a more complex band pattern with splittings of the order of 20-30 em-I. This is probably due to some dispersion of Va in k space and the involvement of phonons at points of lower symmetry in the Brillouin zone. The Vl+V3, 2V2+V3, and 2V2-V2 modes appear to be perturbed by Fermi resonance.
The observed internal±external mode spectra appear to be generally compatible with the dispersion curves of Rao et at. and the existence of critical points at r, M, and H points and in some cases within the Brillouin zone. Possible critical point phonons are indicated in symmetry directions other than 2: and A.
ACKNOWLEDGMENT
I would like to thank S. F. Trevino for valuable comments on the manuscript and for providing me a copy of the dispersion curves prior to publication.
1 J. 1. Bryant, J. Chern. Phys. 38, 2845 (1963). 2 M. L. Malhotra, K. D. Moller, and Z. Iqbal, Phys. Letters
A 31, 73 (1970). 3 S. S. Mitra, private communication. 4 Z. Iqbal, ]. Chern. Phys. 53, 3763 (1970). 6 C. E. Hathaway and P. A. Temple, Phys. Rev. B3, 3497
(1971). 6 K. R. Rao, S. F. Trevino, H. Prask, and R. D. Mical, Phys.
Rev. B 4, 4551 (1971). 10. Oehler and Hs. H. Giinthard, J. Chern. Phys. 48, 2036
(1968) . 8 K. H. Hellwege, W. Lesch, M. Phihal, and G. Schaack, Z.
Physik 232, 61 (1970). 9 K. R. Rao and S. F. Trevino, J. Chern. Phys. 53, 4661 (1970). 10 S. Bhagavantam and T. Venkatarayudu, Theory of Groups
and its Application to Physical Problems (Academic, New York, 1969) .
11 Experimental values of this magnitude have been obtained by Hathaway and Temple6 and in this work (cf. Table V).
12 J. N. Appleton and J. Sharma, Mater. Res. Bull. 5, 227 (1970) .
13 D. L. Wood and S. S. Mitra, J. Opt. Soc. Am. 48,537 (1958). 14 Z. Iqbal, in Structure and Bonding-Inorganic Chemistry,
edited by P. Hemmerich et al. (Springer, Berlin, 1972), p. 25. 16 J. I. Bryant and R. L. Brooks III, J. Chern. Phys. 43, 880
(1965) .
Downloaded 08 Mar 2013 to 131.211.208.19. Redistribution subject to AIP license or copyright; see http://jcp.aip.org/about/rights_and_permissions


![PRESENTATION TITLE REGULATIONS ON … meter to measure abstraction from a borehole – 28 August 2017 [NV] Questions Groundwater fed spring,KN3 –4 September 2017 [NV] •Contacts](https://static.fdocuments.us/doc/165x107/5b007ece7f8b9a84338cb2ac/presentation-title-regulations-on-meter-to-measure-abstraction-from-a-borehole.jpg)