Informing dugong conservation at several spatial and ... · July 2015 “A husband and wife were...
229
This file is part of the following reference: Cleguer, Christophe (2015) Informing dugong conservation at several spatial and temporal scales in New Caledonia. PhD thesis, James Cook University. Access to this file is available from: http://researchonline.jcu.edu.au/48174/ The author has certified to JCU that they have made a reasonable effort to gain permission and acknowledge the owner of any third party copyright material included in this document. If you believe that this is not the case, please contact [email protected] and quote http://researchonline.jcu.edu.au/48174/ ResearchOnline@JCU
Transcript of Informing dugong conservation at several spatial and ... · July 2015 “A husband and wife were...
This file is part of the following reference:
Cleguer, Christophe (2015) Informing dugong
conservation at several spatial and temporal scales in New
Caledonia. PhD thesis, James Cook University.
Access to this file is available from:
http://researchonline.jcu.edu.au/48174/
The author has certified to JCU that they have made a reasonable effort to gain
permission and acknowledge the owner of any third party copyright material
included in this document. If you believe that this is not the case, please contact
[email protected] and quote
http://researchonline.jcu.edu.au/48174/
ResearchOnline@JCU
Informing dugong conservation at several spatial and temporal scales in New Caledonia
Thesis submitted by
Christophe Cleguer
For the degree of Doctor of Philosophy
in the College of Marine and Environmental Sciences, James Cook University
Under a co-tutelle agreement with
Université Pierre et Marie Curie, Sorbonne Universités
July 2015
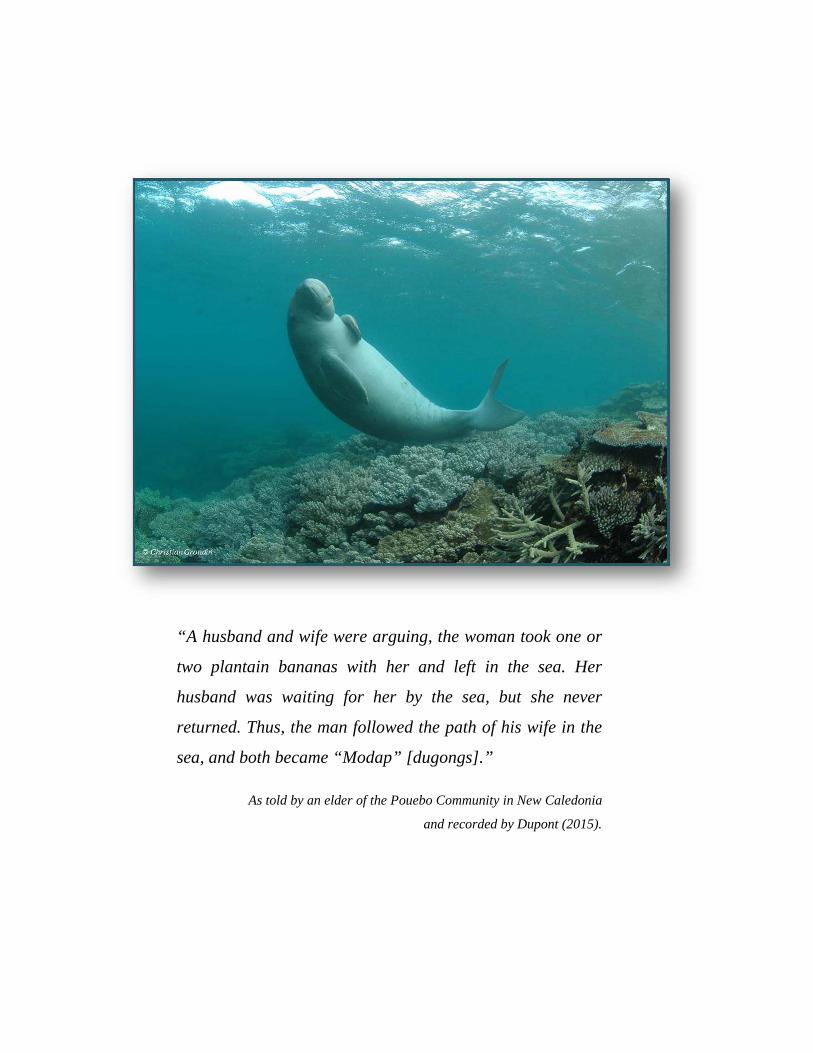
“A husband and wife were arguing, the woman took one or
two plantain bananas with her and left in the sea. Her
husband was waiting for her by the sea, but she never
returned. Thus, the man followed the path of his wife in the
sea, and both became “Modap” [dugongs].”
As told by an elder of the Pouebo Community in New Caledonia
and recorded by Dupont (2015).
i
Acknowledgements
During the time of my candidature I received assistance from many people and organisations.
First and foremost I am indebted to my advisory committee: Helene Marsh, Claude Payri, Claire
Garrigue, Mariana Fuentes, Alana Grech, Mark Hamann and Lionel Gardes. I thank Helene,
Claire and Claude for supporting me prior to the start of my PhD project and for always being
accessible and willing to help throughout my candidature. Helene, I am very proud to have had
the chance to be one of your PhD students. Your dedication to good science and to the
conservation of sirenians is an inspiration. I am forever grateful for the trust you have put in me,
for all the things that you have taught me, and for making me a better scientist. Claude, despite
the distance you have managed to ensure that my project was conducted with as little
disturbance as possible. You facilitated exchanges between members of the advisory committee
and with local stakeholders in New Caledonia, and provided valuable moral support when I
needed it. Thank you Claire for introducing me to the world of marine mammals. This project
clearly would never have started without your help. Despite the many obstacles, your passion
for the ecology and conservation of marine mammals never weakens. I am grateful to Mariana,
Alana and Mark for their guidance, moral support and constant accessibility. As I said in many
of my emails to you all, I have been a very lucky student to have you as advisors.
I am extremely grateful to the Dugong Technical Committee coordinated by the French Marine
Protected Area Agency, which includes local environmental managers from the Province Nord,
Sud and Province des Iles Loyauté of New Caledonia, the French and New Caledonian
governments, WWF-New Caledonia and the local environmental NGO Opération Cétacés.
Thanks to your generous support, our knowledge of dugongs in New Caledonia has vastly
improved. I truly hope the work I have achieved during my PhD will help you to enhance the
conservation of dugongs in New Caledonia, and I look forward to assist you to achieve this goal
in the future.
This project entailed a huge field component. Thanks to my aerial survey buddies Aline
Schaffar, Claire Garrigue and Marc Oremus. Despite the challenges in conducting surveys in
New Caledonia we had a great time in the plane together. Thanks to the pilots Federic Ducros,
Paul Ganga and Robert Durand for their patience, flexibility and for bringing us home safe and
sound after each flight. Conducting aerial surveys in remote parts of New Caledonia is
challenging but the team always kept a great spirit and helped me through what were sometimes
tough decisions.

ii
The dugong satellite tracking fieldwork in New Caledonia was an amazing experience, both in
terms of interacting with the animals and because it involved a wide range of participants. I like
to think that it helped to fill the gap between local communities and scientists in New
Caledonia. Thanks to my dugong catching buddies, (1) at sea – Shane Preston, Nikolai Liebsch,
Peter Kraft, Marc Oremus, Rémi Dodemont, Thomas Paquereau, Julien Freyer, Yoran Chanene,
Hugues Ducreux, Anicée Lombal, Morgan Poupon, Tyffen Read, Claire Garrigue, Willy Tidjite,
Raymond Wabealo, ZicoTidjite, Gérard Diela, René Bull and his son, Lucky Fogliani – and (2)
from the air – Aline Schaffar, Guy Kane, Marc Holt, Fabien Perotto, Gérard Bourdinat. I am
also grateful for the logistical and human support from Province Nord (SMRA and BGN) and
Province Sud. Thanks to the members of the Dugong Action Plan Committee for helping me to
coordinate the retrieval of the satellite tags. Thanks to Locajet for providing the Personal
Watercraft during the 2013 project. Thanks to the ‘Gite du Cap’ accommodation for making our
stay in Cap Goulvain an unforgettable moment!
I am grateful to Marc Holt, Fabien Perotto and Romain Laigle who conducted the ultra-light
surveys. I am very much looking forward to meeting you again in Poe, and to discussing the
results of the great work we have accomplished together. I would also like to express my
gratitude to Jean-Louis Menou, who deployed the water temperature loggers in Cap Goulvain,
and Martial Dosdane and Romain Laigle for sharing their amazing dugong footages!
I would like to express my gratitude to Susan Sobtzick and Shannon Hogan who copy-edited
my thesis.
I am grateful for the administrative assistance provided to me by the IRD staff. Thanks to
Juliette Lelong, Catherine Hartmann, Marie-Noelle Segura, Catherine Verleye, Veronique
Perrin, Martial Darman, Jenny Carso, Miguel Clarque, Julien Chiaramonti. Many thanks for the
constructive conversations with and advice from Jean Louis Menou, Jerome Lefevre and Jerome
Aucan.
I am appreciative of the academic and administrative assistance provided to me by the staff of
the Graduate Research School and the College of Marine and Environmental Sciences at James
Cook University, especially Glen Connolly, Melissa Crawford, Shannon Hogan and Beth
Moore. Special thanks to Paul Givney and Andrew Norton for their excellent technical support.
Thanks to my friends: Phil Bright, Valerie Allain, Joe Scut Phillips and the IRD-CPS ‘crew’ in
Nouméa! My dear “Townsvillian” friends, or shall I say family! Takahiro Shimada, Peter Yates,
Kimberly Riskas, Rie Hagihara, Coralie D’Lima, Milena Kim, Justin Smith, Kay Critchell,
Sarah Ballard, Emma Ryan, Sandra and Mael, Natalie and Hector, Fe, Rory and Shane, Mari
and Leo, Kirsty and Paul, Alana and Tom, Karen and Tom, Susan and Matt, the Adrians, the

iii
Richos, Cindy and Steve!! I am looking forward to living more adventures with you all! This
PhD really has given me the opportunity to develop some amazing relationships in the Pacific
region.
Special thanks to Melanie Hamel for all her love. Thank you for sharing the good, the bad and
the ugly days. This thesis would have never been completed without your support.
Thanks to my family, my parents Henri and Annamaria and my brothers Cédric and Sebastien
for their permanent support and love, and Frederic and Colette for their love and
encouragement.
I dedicate this thesis to my Breton and Hungarian grandparents, my dad Henri, my mum
Annamaria and my brothers Cédric and Sebastien. With all my love.
iv
Statement on the Contribution of Others
Research funding
New Caledonian Dugong Technical Committee, established under the 2010-2015 Dugong
Action Plan in New Caledonia. This committee is coordinated by the French Marine
Protected Area Agency and includes local environmental managers from the Province Nord,
Sud and Province des Iles Loyauté of New Caledonia, the French and New Caledonian
governments, WWF-New Caledonia, the local environmental NGO Operation Cétacés.
James Cook University (JCU) Graduate Research School and College of Marine and
Environmental Sciences
Stipend scholarship
Agence des Aires Marines Protégées (AAMP)
Institut de Recherche pour le Développement (IRD)
JCU Graduate Research School
Fee subsidy scholarship
James Cook University
v
Travel and conferences
Agence des Aires Marines Protégées (AAMP)
Institut de Recherche pour le Développement (IRD)
JCU College of Marine and Environmental Sciences
Research in-kind support
Opération Cétacés
Météo-France
Greenseas
Infrastructure external to JCU
Institut de Recherche pour le Développement (IRD)
Opération Cétacés
Supervision
Primary advisors
Professor Helene Marsh, JCU College of Marine and Environmental Sciences, Australia
Professor Claude Payri, UMR ENTROPIE (IRD-Université de La réunion-CNRS) -
Laboratoire d'Excellence LabEx -CORAIL, IRD New Caledonia
Secondary advisors and members of the thesis committee
Dr. Claire Garrigue, UMR ENTROPIE (IRD-Université de La réunion-CNRS) -Laboratoire
d'Excellence LabEx -CORAIL, IRD New Caledonia / Opération cétacés BP 12827 98802
Nouméa, New Caledonia
Dr. Mariana M.P.B. Fuentes, Earth, Ocean and Atmospheric Science, Florida State
University, Tallahassee, FL 32306, United States
Dr. Alana Grech, Department of Environmental Sciences, Macquarie University, New South
Wales 2109, Australia
Dr. Mark Hamann, JCU College of Marine and Environmental Sciences, Australia
vi
External member of PhD committee
Mr. Lionel Gardes, Agence des Aires Marines Protégées, New Caledonia
Statistical and analytical support
Professor Helene Marsh
Dr. Alana Grech
Dr. Yvette Everingham, JCU
Dr. Murray Logan, AIMS@JCU
Professor Emeritus Rhondda Jones, JCU
Editorial support
Professor Helene Marsh
Professor Claude Payri
Dr. Claire Garrigue
Dr. Mariana Fuentes
Dr. Alana Grech
Dr. Mark Hamann
Dr. Susan Sobtzick
Shannon Hogan
vii
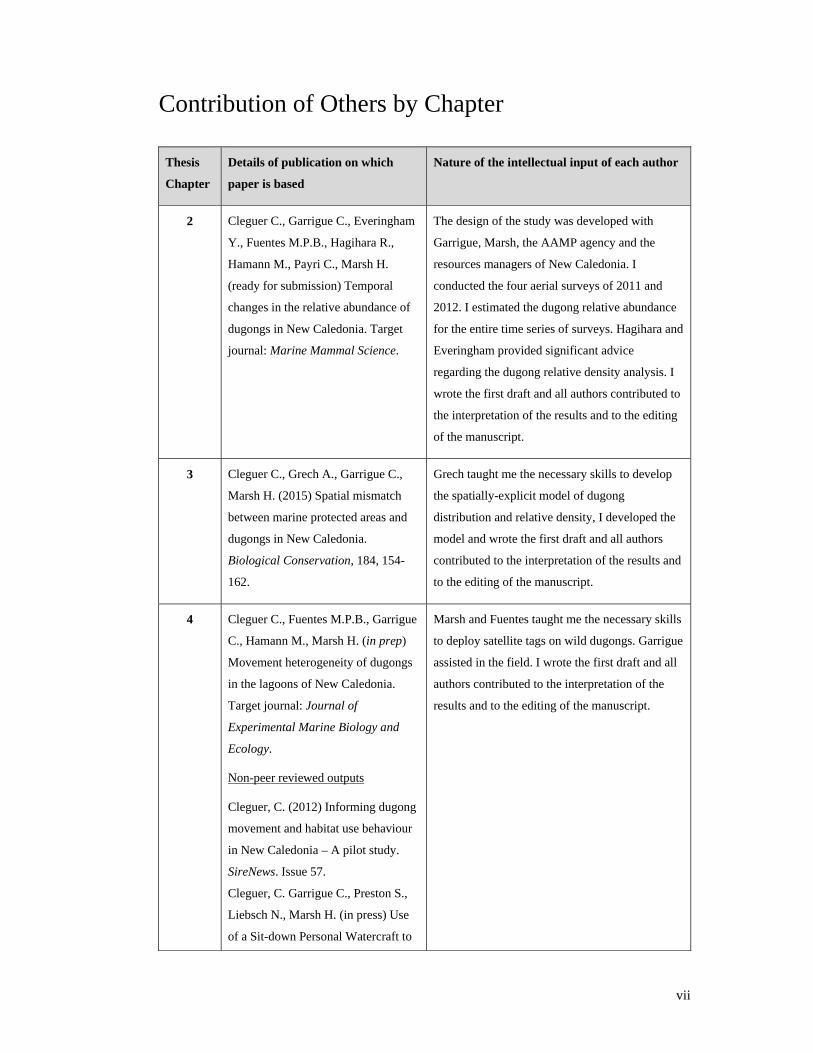
Contribution of Others by Chapter
Thesis
Chapter
Details of publication on which
paper is based
Nature of the intellectual input of each author
2 Cleguer C., Garrigue C., Everingham
Y., Fuentes M.P.B., Hagihara R.,
Hamann M., Payri C., Marsh H.
(ready for submission) Temporal
changes in the relative abundance of
dugongs in New Caledonia. Target
journal: Marine Mammal Science.
The design of the study was developed with
Garrigue, Marsh, the AAMP agency and the
resources managers of New Caledonia. I
conducted the four aerial surveys of 2011 and
2012. I estimated the dugong relative abundance
for the entire time series of surveys. Hagihara and
Everingham provided significant advice
regarding the dugong relative density analysis. I
wrote the first draft and all authors contributed to
the interpretation of the results and to the editing
of the manuscript.
3 Cleguer C., Grech A., Garrigue C.,
Marsh H. (2015) Spatial mismatch
between marine protected areas and
dugongs in New Caledonia.
Biological Conservation, 184, 154-
162.
Grech taught me the necessary skills to develop
the spatially-explicit model of dugong
distribution and relative density, I developed the
model and wrote the first draft and all authors
contributed to the interpretation of the results and
to the editing of the manuscript.
4 Cleguer C., Fuentes M.P.B., Garrigue
C., Hamann M., Marsh H. (in prep)
Movement heterogeneity of dugongs
in the lagoons of New Caledonia.
Target journal: Journal of
Experimental Marine Biology and
Ecology.
Non-peer reviewed outputs
Cleguer, C. (2012) Informing dugong
movement and habitat use behaviour
in New Caledonia – A pilot study.
SireNews. Issue 57.
Cleguer, C. Garrigue C., Preston S.,
Liebsch N., Marsh H. (in press) Use
of a Sit-down Personal Watercraft to
Marsh and Fuentes taught me the necessary skills
to deploy satellite tags on wild dugongs. Garrigue
assisted in the field. I wrote the first draft and all
authors contributed to the interpretation of the
results and to the editing of the manuscript.
viii
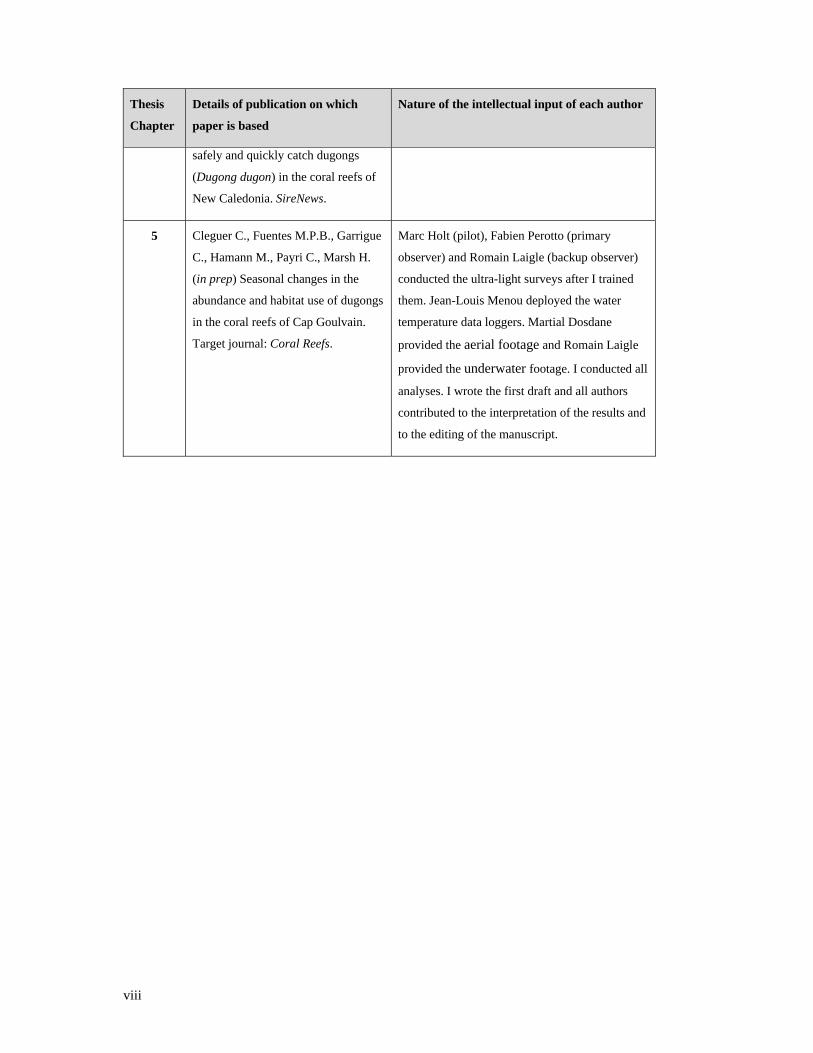
Thesis
Chapter
Details of publication on which
paper is based
Nature of the intellectual input of each author
safely and quickly catch dugongs
(Dugong dugon) in the coral reefs of
New Caledonia. SireNews.
5 Cleguer C., Fuentes M.P.B., Garrigue
C., Hamann M., Payri C., Marsh H.
(in prep) Seasonal changes in the
abundance and habitat use of dugongs
in the coral reefs of Cap Goulvain.
Target journal: Coral Reefs.
Marc Holt (pilot), Fabien Perotto (primary
observer) and Romain Laigle (backup observer)
conducted the ultra-light surveys after I trained
them. Jean-Louis Menou deployed the water
temperature data loggers. Martial Dosdane
provided the aerial footage and Romain Laigle
provided the underwater footage. I conducted all
analyses. I wrote the first draft and all authors
contributed to the interpretation of the results and
to the editing of the manuscript.
ix
Ethics Statement
All necessary permits required to capture and satellite-track dugongs were obtained from the
James Cook University Animal Ethics Committee (Permits A1735 and A1936) and the North
(60912155-2013/JJC) and South (3157-2012/ARR/DENV) Provinces of New Caledonia.
Captured dugongs were handled in strict accordance with local and international regulations and
using veterinary guidelines available in Appendix C, in this thesis.
x
Publications produced during my PhD candidature
Peer Reviewed Journal Articles
Chapter 2 Cleguer C., Garrigue C., Everingham Y., Fuentes M.P.B., Hagihara R.,
Hamann M., Payri C., Marsh H. (ready for submission) Temporal changes
in the relative abundance of dugongs in New Caledonia. Target journal:
Marine Mammal Science.
Chapter 3 Cleguer C., Grech A., Garrigue C., Marsh H. (2015) Spatial mismatch
between marine protected areas and dugongs in New Caledonia.
Biological Conservation, 184, 154-162.
Chapter 4 Cleguer C., Fuentes M.P.B., Garrigue C., Hamann M., Marsh H. (in prep)
Movement heterogeneity of dugongs in the lagoons of New Caledonia.
Target journal: Journal of Experimental Marine Biology and Ecology.
Chapter 5 Cleguer C., Fuentes M.P.B., Garrigue C., Hamann M., Payri C., Marsh H.
(in prep) Seasonal changes in the abundance and habitat use of dugongs in
the coral reefs of Cap Goulvain. Target journal: Coral Reefs.
Reports
Garrigue C. & Cleguer C. (2013) Dugong movements in the Nouméa and the Bourail-Poya
regions. Rapport non publié pour l’Agence des Aires Marines Protégées. 28p
Cleguer C., Oremus M., Garrigue C. (2012) Pilot study on dugong satellite tagging in New
Caledonia. Rapport non publié pour l’Agence des Aires Marines Protégées. 33p + annexes
Garrigue C., Cleguer C., Schaffar A. (2012a) Distribution and abundance of dugongs in New
Caledonia, 2012. Rapport de mission de la campagne de juin 2012. 27p + annexes.
Garrigue C., Cleguer C., Schaffar A., Oremus M. (2012b) Distribution and abundance of
dugongs in New Caledonia, 2012. Rapport de mission de la campagne de juin 2012. 27p +
annexes.
Garrigue C., Cleguer C., Schaffar A. (2011a) Distribution and abundance of dugongs in New
Caledonia, 2011. Rapport de mission de la campagne de juin 2011. 25p + annexes.

xi
Garrigue C., Cleguer C., Schaffar A., Oremus M. (2011b) Distribution and abundance of
dugongs in New Caledonia, 2011. Rapport de mission de la campagne de novembre 2011. 25p
+ annexes.
Oremus M., Garrigue C., Cleguer C. (2011) Dugong genetic diversity in New Caledonia.
Rapport final.
Oremus M., Garrigue C., Cleguer C. (2015) Dugong genetic diversity in New Caledonia.
Rapport final.
Progress Reports to the Dugong Technical Committee
Dugong Action Plan 2010-2015
Cleguer C. (2012a) Conservation du dugong en Nouvelle-Calédoniec: une étude à plusieurs
échelles spatio-temporelles. Compte rendu d’étape N°1. 29p
Cleguer C. (2012b) Conservation du dugong en Nouvelle-Calédonie : une étude à plusieurs
échelles spatio-temporelles. Compte rendu d’étape N°2. 18p
Cleguer C. (2013a) Conservation du dugong en Nouvelle-Calédonie : une étude à plusieurs
échelles spatio-temporelles. Compte rendu d’étape N°3. 54p + Annexes
Cleguer C. (2013b) Conservation du dugong en Nouvelle-Calédonie : une étude à plusieurs
échelles spatio-temporelles. Compte rendu d’étape N°4. 53p. + Annexes
Cleguer C. (2014) Conservation du dugong en Nouvelle-Calédonie : une étude à plusieurs
échelles spatio-temporelles. Compte rendu d’étape N°5. 19p. + Annexes
IUCN Sirenia Specialist Group newsletters
Cleguer C. (2012) Informing dugong movement and habitat use behaviour in New Caledonia –
A pilot study. SireNews. 57-13.
Cleguer C., Garrigue C., Preston S., Liebsch N., Marsh H. (2015) Use of a Personal Watercraft
to Safely and Quickly Catch Dugongs (Dugong dugon) in the coral reef lagoons of New
Caledonia. SireNews.
xii
Educational Book
Cleguer C. & Pusineri C. (in press) The dugong. Marine Mammal Atlas. Museum of Natural
History of Paris.
Conference Presentations
Cleguer C. (2012) Dugong conservation in New Caledonia, past, present and future. Quelles
recherches scientifiques en Province Nord. Poindimié, New Caledonia.
Cleguer C., Grech A., Garrigue C., Marsh H. (2013) Spatially-explicit modelling of dugong
distribution and relative density in New Caledonia as a tool for prioritizing local conservation
initiatives. 20th Biennial conference on the Biology of Marine Mammals, Dunedin, New
Zealand.
Cleguer C., (2014) Aerial surveys as a tool to support the conservation of Sirenia. Society for
conservation biology, Suva, Fiji. (Co-convened symposium).
Cleguer C., Fuentes M.P.B., Garrigue C., Grech A., Hamann M., Payri C., Marsh H.
(December 2015-Abstract in review) Heterogeneous habitat use by dugongs in tropical coral
reef lagoons. 21st Biennial conference on the Biology of Marine Mammals, San Francisco,
United States of America.
xiii
Abstract
Comprehensive, up-to-date spatial information on species distributions and threatening
processes can enhance the identification of sites for conservation and management action. Such
information is often incomplete or simply unavailable at a scale that can inform real-world
decision making because the cost and capacity needed for collecting reliable information are
high especially when targeting species that occupy large ranges.
Obtaining data to inform conservation at the appropriate spatial scale is of particular importance
for species that occupy large ranges. The dugong (Dugong dugon) is a seagrass specialist and
marine mammal that occurs over 130,000km of coastline in the Indo-West-Pacific. The dugong
attracts global conservation attention because it is listed as vulnerable (IUCN Red List) and is
increasingly exposed to multiple anthropogenic hazards in most of its range. There are many
regions within the dugong’s range where the likelihood of survival of the species is unknown.
Collecting spatial-ecological information on the dugong in these regions can inform and
optimize the effectiveness of regional and national conservation and management initiatives.
The island-archipelago of New Caledonia is located in the Oceania region at the eastern edge of
the dugong’s range. The conservation status of the dugong in this region is unknown. The
presence of the charismatic dugong in the lagoons of New Caledonia was an explicit reason for
the World Heritage listing of some of the lagoons. No conservation actions have been
implemented in New Caledonia to ensure the maintenance of the dugong stock except for the
legislation that restricts dugong harvesting despite the species’ high biodiversity, cultural and
traditional value.
The goal of my thesis was to build an evidence-base to enhance the conservation and
management of dugongs in New Caledonia at several spatial and temporal scales and enhance
understanding of dugong ecology in tropical coral reef environments by:
1. Assessing the temporal changes in the dugong population size and the capacity of the current
marine protected areas (MPAs) to protect dugongs at the scale of New Caledonia.
2. Investigating the spatial ecology of dugongs in the coral reef lagoons of New Caledonia by
studying their movement patterns and habitat use at local scales.
3. Integrating scientific research conducted on dugongs as part of this thesis to inform decisions
relating to dugong conservation and management regionally and internationally.
A single baseline aerial survey of dugongs in New Caledonia in 2003 estimated a population of
2026 (± SE = 553) individuals. A second similar survey in 2008 produced a lower estimate of
xiv
606 (± SE = 200) individuals, leading to concerns that the dugong population was experiencing
a decline. I conducted four additional surveys in 2011 and 2012 with the objectives of updating
information on the current size of the dugong population in New Caledonia and investigating
evidence of decline in the population. The abundance estimates obtained from my four surveys
ranged from 649 (± SE = 195) to 1227 (± SE = 296) dugongs. These results were not
significantly different to the 2008 estimate but were significantly lower than the 2003 estimate. I
concluded that the confounding effects of variation in environmental conditions, animal
behaviour and sampling biases likely played a key role in the variation of the dugong population
size estimates as I could not find any evidence external to the surveys that the dugong
population had declined between 2003 and 2008 or that temporary migration was likely to have
occurred.
I used the data obtained from the time series of aerial surveys to develop a spatially-explicit
model of dugong distribution and relative density. This model enabled me to determine the
distribution of dugongs at the scale of the main island of New Caledonia over nearly a decade of
monitoring, and to detect key dugong habitats.
Dugongs were not explicitly considered in the design of the network of marine protected areas
(MPAs) in New Caledonia. Thus any representation of important dugong areas in the MPA
network is incidental. I used the spatially-explicit model of dugong distribution and relative
density to retrospectively assess the capacity of the New Caledonia MPA network to protect
dugongs from anthropogenic hazards. I quantified the amount of overlap between dugong
relative density units and each type of MPA that was managed at the time of the study. I found
that most of the important dugong areas in New Caledonia had a low coverage from the MPAs
that provide high levels of restriction of anthropogenic activities. I identified several important
dugong areas along the west and the north-east coast that were not covered by MPAs and should
be considered in future conservation and management plans. The spatial mismatch between
MPAs and dugong distribution was likely caused by weaknesses in the planning process. I
provided guidance on how these shortcomings can be overcome for marine species of
conservation concern in New Caledonia and other regions.
The lack of consideration of marine mammals in conservation tools such as MPAs often stems
from their highly mobile nature and dynamic movement patterns and the difficulty of defining
their specific habitat needs due to lack of knowledge. Information on the dugong’s use of space
among key habitats and the scale of these movements has been comprehensively studied only in
Australian waters where the environment differs from the lagoons of New Caledonia. I used
satellite tracking technology to document the use of space by dugongs in the lagoons of New
Caledonia. I developed a method of safely and quickly capturing dugongs in coral reef habitats
xv
and satellite–tracked 12 adult dugongs in three different regions of the west coast of New
Caledonia. Animals displayed individualistic movement patterns. Their extent of movement was
large relative to the size of the main island, and some individuals crossed jurisdictional
boundaries. Three dugongs exited the lagoon and used the fore reef shelf (i.e., flattened coral
reef area, located between the fore reef crest and deep open ocean waters) as corridor to transit
from one bay to another. All tracked dugongs returned to their capture location. Home-range
analyses showed that the range and core areas used by dugongs reflected the width of the
lagoons. The home-range and core areas of dugongs did not differ between day and night.
I investigated the habitat use of dugongs at a local scale at Cap Goulvain to enhance
understanding of seasonal changes in abundance and habitat use of dugongs in coral reef
environments and to provide spatially-explicit data to help local conservation decisions in a key
dugong conservation value area. Access to seagrass resources is restricted by tides and the
geomorphology of habitats and small size of the lagoon restrict dugongs’ space use. I used data
obtained from fine-scale dedicated dugong aerial surveys conducted every two weeks over 18
months at low and high tide to determine the seasonal and tidal changes in the number of
dugongs and their use of a range of habitats in Cap Goulvain. I then compared the resultant
dataset with the temporal changes in water temperature inside and outside the lagoon in this
region.
I found that more dugongs were sighted during the cool season than during the warm season in
Cap Goulvain. At high tide, dugongs were expectedly sighted over the intertidal seagrass
meadows in higher proportion than in any other monitored habitats during both seasons. As
tides restricted access to the intertidal seagrass meadows there was a seasonal change in the use
of other non-seagrass coral reef habitats: during the cool season, a higher proportion of dugongs
was sighted outside the lagoon on the fore reef shelf than in any other habitat inside the lagoon;
during the warm season the use of the fore reef shelf was less pronounced and dugongs were
sighted in higher proportion inside the lagoon in the channels surrounding the intertidal
seagrasses. Behavioural thermoregulation is a plausible explanation for the changes in the
number of dugongs and the use of the fore reef shelf in Cap Goulvain during the cool season.
Further investigation is required to assess the effect of other external factors including the
temporal changes in the availability and quality of seagrass and abundance of sharks.
Dugong aggregations (i.e., group of ≥ 10 animals) were observed inside the lagoon of Cap
Goulvain during the warm season and outside the lagoon during the cool season. I used aerial
and underwater footage of the dugong herds located outside the lagoon to explore the behaviour
of dugongs in the herds. I found that the dugongs forming the aggregations were resting and no
social behaviour other than calves feeding from their mother’s teats was identified. The likely
xvi
causes of dugong aggregations in this habitat include access to warm water, the number of
dugongs present in the region at the time, the size of the fore reef shelf, the distance to inshore
seagrass resources, and the risk of predation from sharks. These results demonstrated that both
seagrass and non-seagrass habitats are important for dugongs and need to be included in future
conservation and management programs in New Caledonia as well as other tropical coral reef
regions.
My thesis provided opportunities to enhance the conservation and management of dugongs in
New Caledonia and new insights into the spatial ecology of dugongs in coral reef environments.
Future management would be enhanced by considering the important dugong habitats and
corridors identified in my research and should be coordinated at an ecological scale relevant to
the dugong to be effective. Given the high cultural value of the dugong to the peoples of New
Caledonia, communities should be consulted about their desire to participate in community-
based management. In addition, ongoing education and communication programs should be
continued especially in regions where illegal hunting may occur. Future research should be
directed at understanding why illegal hunting occurs in New Caledonia and how compliance
with the law could be increased. Further investigating the fine-scale interaction between
seagrasses and dugongs in New Caledonia would also greatly enhance our understanding of
dugong and seagrass ecology in tropical lagoons and coral reefs more generically.
xvii
Contents
Acknowledgements ........................................................................................................................ i
Statement on the Contribution of Others ..................................................................................... iv
Contribution of Others by Chapter .............................................................................................. vii
Ethics Statement ........................................................................................................................... ix
Publications produced during my PhD candidature ....................................................................... x
Abstract ...................................................................................................................................... xiii
List of Figures .............................................................................................................................. xx
List of Tables ........................................................................................................................... xxvi
Chapter 1: General Introduction ................................................................... 1
1.1 Introduction .......................................................................................................................... 2
1.2 The dugong .......................................................................................................................... 4
1.3 The dugong in New Caledonia ............................................................................................ 7
1.4 Research aim, objectives and thesis structure .................................................................... 14
Chapter 2: Temporal changes in the relative abundance of dugongs
in New Caledonia ........................................................................................ 17
2.1 Introduction ........................................................................................................................ 18
2.2 Methods ............................................................................................................................. 19
2.3 Results ................................................................................................................................ 25
2.4 Discussion .......................................................................................................................... 35
2.5 Conclusion ......................................................................................................................... 40
2.6 A critical evaluation of my approach ................................................................................. 41
2.7 Chapter summary ............................................................................................................... 42
Chapter 3: The spatial coverage of dugongs by marine protected
areas ............................................................................................................. 43
3.1 Introduction ........................................................................................................................ 44
xviii
3.2 Study area and species ...................................................................................................... 45
3.3 Methods ............................................................................................................................. 46
3.4 Results ............................................................................................................................... 47
3.5 Discussion ......................................................................................................................... 53
3.6 Conclusion ........................................................................................................................ 57
3.7 Chapter summary .............................................................................................................. 58
Chapter 4: Movement heterogeneity of dugongs in the lagoons of
New Caledonia ............................................................................................ 59
4.1 Introduction ....................................................................................................................... 60
4.2 Methods ............................................................................................................................. 62
4.3 Results ............................................................................................................................... 71
4.4 Discussion ......................................................................................................................... 89
4.5 Conclusion ........................................................................................................................ 94
4.6 A critical evaluation of my approach ................................................................................ 94
4.7 Chapter summary .............................................................................................................. 95
Chapter 5: Seasonal changes in the abundance and habitat use of
dugongs in the coral reefs of Cap Goulvain ................................................ 97
5.1 Introduction ....................................................................................................................... 98
5.2 Methods ........................................................................................................................... 102
5.3 Results ............................................................................................................................. 108
5.4 Discussion ....................................................................................................................... 115
5.5 Conclusion ...................................................................................................................... 121
5.6 Chapter summary ............................................................................................................ 122
Chapter 6: General Discussion .................................................................. 123
6.1 Opportunities to enhance the conservation and management of dugongs in New
Caledonia ........................................................................................................................ 124
6.2 Review of findings .......................................................................................................... 125
xix
6.3 Management considerations ............................................................................................ 127
6.4 Future research on dugong and seagrass ecology ............................................................ 136
6.5 Collaborative research ..................................................................................................... 138
6.6 Concluding remarks ......................................................................................................... 139
References ................................................................................................. 141
Appendix A ............................................................................................... 169
Appendix B ............................................................................................... 177
Appendix C ............................................................................................... 181
Appendix D ............................................................................................... 187
Appendix E ................................................................................................ 195
Appendix F ................................................................................................ 197
xx
List of Figures
Figure 1.1: Map of the three Provinces of New Caledonia. Note the barrier reef
represented by the grey lines. .............................................................................................. 8
Figure 1.2: Schematic diagram of the structure of this thesis. The position of the
chapter within the thesis is indicated by the red frame. .................................................... 16
Figure 2.1: Aerial survey blocks and transects used in 2011 and 2012 for the analysis
of dugong relative abundance and density. ....................................................................... 20
Figure 2.2: Photograph of the Cessna 206 used for the dugong aerial surveys in New
Caledonia. ......................................................................................................................... 20
Figure 2.3: Fiberglass rods attached to the structure of the aircraft to delineate
transects 400m wide on the water surface on each side of the aircraft. Note the
colour bands on the wing strut that were used to delineate zones within the
transect. ............................................................................................................................. 22
Figure 2.4: Details of the counts of (A) groups of dugongs, (B) individuals, and (C)
individuals per transect for individual blocks across the time series of
systematic aerial surveys in New Caledonia. The column shading varies
according to the survey. Note that this figure excludes a sighting of a herd of 69
dugongs (including 5 calves) in block 2 in June 2011. The herd was added to
the final population estimate. ............................................................................................ 27
Figure 2.5: Time series of estimates of relative abundance of dugongs (+ SE); (A)
across surveys, and (B) for individual blocks from the standardized aerial
surveys in New Caledonia. ................................................................................................ 28
Figure 2.6: Log e dugong relative density (per km2) based on dugongs observed in the
aerial surveys in New Caledonia between 2003 and 2012. Error bars represent
95% credible intervals and lines in the boxes represent the mean. Circles
represent estimated values of dugong relative density for each survey transect
included in the analysis. .................................................................................................... 29
Figure 2.7: Log e dugong relative density (per km2) plotted for each block and year.
Error bars represent 95% credible intervals and lines in the boxes represent the
mean. Black dots represent estimated values of dugong relative density for each
survey transect included in the analysis. ........................................................................... 32
xxi
Figure 2.8: Proportions of dugong calves (A) across blocks within surveys, and (B)
within blocks in each survey. Lines in the boxes in (A) represent the mean. .................... 33
Figure 2.9: Frequency distribution of dugong sightings with respect to bathymetry
during the dugong aerial surveys in New Caledonia. ........................................................ 34
Figure 3.1: The spatially-explicit model of dugong distribution and relative density
(number of dugongs sighted per km2, grid cell size = 2.56km2) in New
Caledonia (A), on the north-east coast (B), the west coast (C), and in the south
of New Caledonia (D). Most of the important dugong areas were distributed on
the west and north east coast of the mainland. Note that: (1) the UNESCO zones
of the Province des Iles Loyauté and one at the Entrecasteaux reefs are not
shown in this figure; (2) maps of dugong sightings for all survey years are
shown in Appendix A Figure A.1. ..................................................................................... 48
Figure 3.2: The relative frequency of each category of modeled dugong density units
in each type of marine protected area (MPA) in New Caledonia. Most (84%) of
the very high dugong relative density units occur in Province Parks (IUCN II),
which are absent from Integral reserves (IUCN Ia). The sum of percentages
within each density category does not equal 100% because MPA types overlap. ............. 49
Figure 4.1: Locations of the three dugong satellite tagging sites. Boxes in the map
provide details about the dugongs tagged in each study region. This map shows
also the extent of movements of dugongs from the three study regions. Note the
letter assigned to each dugong tracked. These letters were then used in the text
of this Chapter to simplify identification of individuals. ................................................... 63
Figure 4.2: Use of a Personal Watercraft (PWC) to approach and catch dugongs in
New Caledonia: (A) primary catchers pursuing a dugong in a shallow coral reef
environment, the primary catcher is pointing at the animal; (B and C) PWC
approaching the dugong at a catchable distance –note the safety boat in the
background in (B); (D) primary catcher jumping from the back of the PWC onto
the dugong’s fluke to restrain the animal. .......................................................................... 65
Figure 4.3: A dugong with a harness assembly to attach a GPS satellite transmitter
(A); (adapted from Marsh and Rathbun 1990) and photograph of the apparatus
(B). See Appendix B for more details on the design of the attachment
apparatus). .......................................................................................................................... 67
Figure 4.4: Details of the movement patterns and use of space by dugongs captured in
Cap Goulvain using the total tracking period of each tracked individual. Figures
A, B and C show the movement patterns of the seven dugongs tracked in the
xxii
Cap Goulvain region. The maps were separated to aid visual representation.
Triangles display the capture location of each individual. Figure D shows the
GPS-QFP location fixes of individual L that moved from Cap Goulvain to
Bourail Bay using the fore reef shelf outside the lagoon. Figure E shows the
combined 50% core areas and 95% home-ranges of six of the seven dugongs
captured in Cap Goulvain (Individual G’s tracking duration was regarded as a
too short tracking period to undertake meaningful analysis of home-range).
These 50% core areas and 95% home-ranges were not weighted for the tracking
period of each tracked dugong as the aim of the figure was to provide an
indication of the combined area used by dugongs in the region. Note that light
brown represents the land, dark grey represents the barrier reef, and light grey
represents reefs inside the lagoons. ................................................................................... 78
Figure 4.5: Details of the movement patterns and use of space by dugongs captured in
Ouano using the total tracking period of each tracked individual. Figure A
shows the movement patterns of the two dugongs tracked in the Ouano region.
Triangles display the capture location of each individual. Figure B shows the
combined 50% core areas and 95% home-ranges of the two dugongs captured in
the Ouano region. These 50% core areas and 95% home-ranges were not
weighted for the tracking period of each tracked dugong as the aim of the figure
was to provide an indication of the combined area used by dugongs in the
region. Note that light brown represents the land, dark grey represents the
barrier reef, and light grey represents any reef within the lagoons. .................................. 80
Figure 4.6: Details of the movement patterns and use of space by dugongs captured in
Nouméa using the total tracking period of each tracked individual. Figure A
shows the movement patterns of the three dugongs tracked in the Nouméa
region. Triangles display the capture location of each individual. Figure B
shows the combined 50% core areas and 95% home-ranges of two dugongs
captured in the Nouméa region (Individual C’s tracking period was regarded as
a too short for meaningful analysis of its home-range). These 50% core areas
and 95% home-ranges were not weighted for the tracking period of each tracked
dugong as the aim of the figure was to provide an indication of the combined
area used by dugongs in the region. Note that light brown represents the land,
dark grey represents the barrier reef, and light grey represents any reef within
the lagoons. ....................................................................................................................... 82
Figure 4.7: Difference between capture locations in the home-range and core area
sizes of dugongs tracked in New Caledonia. The lines within boxes represent

xxiii
the median, boxes represent interquartile range, whiskers represent the
minimum and maximum values, and dots indicate values for each individual.
Note differences in scale of y axes between the two figures. Black dots
represent the values of home-range and core area sizes for each tracked dugong. ............ 83
Figure 4.8: Relationship between the activity spaces of dugongs captured in the (A)
Cap Goulvain, (B) Ouano, and (C) Nouméa regions and the known seagrass
habitats (Andréfouët et al. 2010). The three figures show the combined 50%
core areas and 95% home-ranges of dugongs captured in each study region. Pie
charts represent the proportions of 95% home-ranges (outer ring) and 50% core
areas (inner ring) of dugong areas where: (1) the presence of seagrass has been
confirmed (in green) or (2) is unknown (in grey). ............................................................. 85
Figure 4.9: Proportion of the 95% home ranges and 50% core areas of dugongs across
depth zones in New Caledonia. .......................................................................................... 86
Figure 4.10: Presence of the tracked dugongs in each type of marine protected area
(MPA) in New Caledonia. A category merging natural reserves (IUCN IV) and
Province parks (IUCN II) was created because these two types of MPAs overlap
in some regions of New Caledonia and were used by the tracked dugongs.
Natural reserves that do not overlap with Province Parks were not represented
as they were only used for 0.2% of the time of one tracked dugong (E).
Wilderness Reserves (IUCN Ib) are not represented in this figure because no
location fix was recorded in these reserves. ....................................................................... 87
Figure 4.11: Visual comparison of diurnal differences in the locations of the 95%
home-range and 50% core areas of dugongs captured in the (A) Cap Goulvain
(e.g., individual J), (B) Ouano (e.g., individual A), and (C) Nouméa regions
(e.g., individual D). There was no overall trend in differences in the size of
dugong 95% home-ranges and 50% core areas between day and night in any of
the three study regions. ...................................................................................................... 88
Figure 5.1: Torres Strait, north of Australia (A) and Cap Goulvain on the mid-west
coast of the main island of New Caledonia (B), both important dugong areas
comprising seagrass communities associated with coral reefs with very different
environments. Torres Strait is a very important seagrass habitat that includes
intertidal seagrass meadows on top of reef flats and the largest single
continuous seagrass meadow in Australia (8,752km2; Taylor and Rasheed 2010)
whereas in Cap Goulvain the 17.4km2 intertidal seagrass meadow is distributed
over small coral reef plateaus and space is limited by a narrow lagoon. Note (1)
xxiv
differences in scale between the two figures; and (2) that the extent of the
seagrass communities in Torres Strait is vastly underestimated in Figure (A).
Satellite images source: in software ARCGIS 10.2 (ESRI 2013). .................................. 100
Figure 5.2: The design of the dugong aerial survey and water temperature sampling in
Cap Goulvain. Side figures show satellite images of: (A) seagrass meadows and
channels, (B) reticulated reef flats, and (C) the exit of the northern channel, the
barrier reef and the fore reef shelf. Satellite images source: in software ARCGIS
10.2 (ESRI 2013). ........................................................................................................... 104
Figure 5.3: Number of dugongs observed per aerial survey in each survey month at
high and low tide in Cap Goulvain. ................................................................................ 111
Figure 5.4: A herd of 69 dugongs over the fore reef shelf outside of the lagoon in Cap
Goulvain on 22 June 2011. Note high proportion of animals apparently basking
at the surface. .................................................................................................................. 112
Figure 5.5: Proportion of dugong herd sightings per month outside the lagoon (grey
columns) and inside the lagoon (white columns) in Cap Goulvain in relation to
the mean minimum monthly water temperature difference between the fore reef
shelf, outside the lagoon and the southern channel, inside the lagoon. The dotted
black line is a reference point to enable the reader to see when the water
temperature becomes warmer (positive temperatures) or cooler (negative
temperatures) on the fore reef shelf compared to the southern channel. ......................... 112
Figure 5.6: Percentage of dugong sightings in each habitat for each season-tide
category. Sampling intensity was constant within and across each season-tide
category. .......................................................................................................................... 114
Figure 6.1: Spatial assessment of the exposure of dugongs to hunting and fisheries
bycatch in fishing nets in Province Nord based on: (1) the spatially-explicit
model of dugong distribution and relative density obtained from the time series
of aerial surveys conducted in New Caledonia (Chapter 3); and (2) the layer of
fishing activity compiled by Pilcher et al. (2014). Note that this map shows
Province Nord only to assist in visual representation of the results. As explained
in this chapter, management of the risks to dugongs should be developed at
multiple spatial scales including cross-jurisdictional scale. ............................................ 131
Figure 6.2: Spatial assessment of the exposure of dugongs to hunting and fisheries
bycatch in fishing nets in Province Sud based on: (1) the spatially-explicit
model of dugong distribution and relative density obtained from the time series
of aerial surveys conducted in New Caledonia (Chapter 3); and (2) the layer of
xxv
fishing activity compiled by Pilcher et al. (2014). Note that this map shows
Province Sud only to assist in visual representation of the results. As explained
in this chapter, management of the risks to dugongs should be developed at
multiple spatial scales including cross-jurisdictional scale. ............................................. 132
Figure 6.3: Suggested candidate Go-Slow zones to reduce the risk to dugongs from
vessel collision in the Nouméa region based on: (1) the spatially-explicit model
of dugong distribution and relative density obtained from the time series of
aerial surveys conducted in New Caledonia (Chapter 3); and (2) bathymetry
(Lefevre et al. unpublished). ............................................................................................ 134
Figure A.1: Map of the raw dugong sightings from the (A) cool season of 2003, (B)
warm season of 2008, (C) cool season of 2011, (D) warm season of 2011, (E)
cool season of 2012, (F) warm season of 2012. ............................................................... 176
Figure B.1: Belt and silicone tube ............................................................................................. 178
Figure B.2: Stainless steel buckle and corrodible link. ............................................................. 179
Figure B.3: Joiners and tether ................................................................................................... 180
Figure F.1: Close-up of the Nouméa region in New Caledonia showing the spatially-
explicit model of dugong distribution and relative density based on aerial survey
data of nearly 10 years, overlaid with the 95% home range and 50% core area of
a dugong (individual D) satellite tracked over 13 days in this region. The space
used by the tracked dugong globally matched with the important dugong
habitats identified using the spatially-explicit model of dugong distribution and
relative density. ................................................................................................................ 197
Figure F.2: Fishing activity collected from interviews conducted throughout the main
island of New Caledonia by a local audit company and compiled by Pilcher et
al. (2014). Fishing activity was binned into three categories based on their
frequency distribution: low fishing (no fishing zones drawn), medium fishing
(1-3 overlaps in fishing zones), high fishing (4-10 overlaps in fishing zones). ............... 198

xxvi
List of Tables
Table 2.1: Survey interruption and period taken to complete surveying block 1. ...................... 26
Table 2.2: Pair-wise comparisons of dugong relative density across survey years in
New Caledonia. ................................................................................................................. 29
Table 2.3: Pair-wise comparisons of dugong relative density among blocks in New
Caledonia. ......................................................................................................................... 31
Table 3.1: Marine protected areas (MPAs) in New Caledonia and their relevance to
dugong protection (Bertaud 2011; Province Nord 2008; Province Sud 2009).
MPAs are listed in decreasing order of level of protection to dugongs. ........................... 50
Table 4.1: Details of the dugongs’ identification number and capture and tagging
event in New Caledonia. The mean following to release time of the 12 dugongs
captured was 16 min. The upper bound reflects the circumstances under which
individual D was captured. ................................................................................................ 73
Table 4.2: Tracking period and details for each dugong on the numbers (No) of total
and filtered location points and their 95% home-range and 50% core area sizes.
The number of location points was evenly distributed between day (48% of
locations obtained between 6am and 6pm) and night (52% of locations obtained
between 6pm and 6am). Values of the Utilisation Distribution Overlap Indexes
(UDOI) close to or ≥ 1 show that there was a high degree of overlap between
day and night 95% home-ranges and 50% core areas (also see Figure 4.11). The
95% home-range, 50% core areas and UDOI were not calculated for the
dugongs with short tracking periods (i.e., ≤ 7 days); (na). ................................................ 74
Table 4.3: Distance analysis and movement attributes of the 12 dugongs tracked in
New Caledonia. Each tracked individual except for individual C (tracked for
only three days) returned to its capture site after moving away from it. All
dugongs stayed within 8km from the shore. Dugongs J, K, and L used the fore
reef shelf to make short visits 20km south in Bourail Bay. .............................................. 75
Table 5.1: Details on the size, depth and presence/absence of seagrass in the four
habitats found at Cap Goulvain. ...................................................................................... 103
Table 5.2: Mean minimum monthly water temperature (°C, ± SD) on the fore reef
shelf, on the seagrass meadow and on the southern channel between mid-
August 2012 and mid-August 2013. ............................................................................... 109
xxvii
Table 5.3: Percentage of dugong sightings in each habitat for each season-tide
category. ........................................................................................................................... 114
Table A.1: Details of the survey design used for the dugong relative abundance and
density analysis. ............................................................................................................... 169
Table A.2: Availability probability estimates (SEs) for various strata of survey depths
and turbidities calculated from data on artificial dugong models and the
individual dive profiles of telemetered wild dugongs. (Extracted from Pollock et
al. 2006). .......................................................................................................................... 169
Table A.3: Details of the number and proportion of transects for which no dugongs
have been sighted in any surveys in New Caledonia for the four blocks used in
the dugong relative abundance and density analysis. ...................................................... 170
Table A.4: Comparison of the standardized estimates of dugong relative abundance
and standard errors (±SE) obtained using the Pollock et al. (2006) methodology
for the dugong aerial surveys conducted in New Caledonia between 2003 and
2012. Details of the counts of dugong groups, individual dugongs, dugong per
transect, and calf sightings are also included. .................................................................. 170
Table A.5: Details of group sizes of dugongs sighted during the aerial surveys
conducted between 2003 and 2012 in New Caledonia and used for the dugong
relative abundance and density analysis. ......................................................................... 171
Table A.6: Count (A) and zero-inflation (B) model coefficients with Negative
Binomial distribution of dugong relative density across survey years and blocks.
The reference level for year is 2003 and 1 for block. ...................................................... 172
Table A.7: Results of (A) log-linear analysis and (B) general linear hypotheses and
multiple comparisons to compare the interactions between blocks in the
proportion of dugong calves. ........................................................................................... 174
Table A.8: Results of log-linear model developed to analyze the relationship between
the proportion of dugong sightings and water depth categories and survey year
during the time series of dugong aerial surveys in New Caledonia. ................................ 175
Table A.9: Estimated sustainable levels of mortalities from anthropogenic sources for
dugongs in New Caledonia. ............................................................................................. 175
Table D.1: Number of dugongs observed per habitat, season and tide in Cap
Goulvain. Percentages are represented between brackets in the table. ............................ 187
xxviii
Table D.2: Aerial and underwater video footage of dugong herds over the fore reef
shelf in the Cap Goulvain region in New Caledonia. ...................................................... 187
Table D.3: Extract of the dugong behavioural focal follow protocol developed by
Hodgson (2004). Dugong behavioural category and specific behaviour
identified from the dugong herds filmed over the fore reef shelf in the Cap
Goulvain region are written in bold and italic................................................................. 188
Table D.4: Probability of seeing at least one dugong herd inside and outside the
lagoon in across tides in the Cap Goulvain region obtained directly from the
dugong sighting data. ...................................................................................................... 189
Table D.5: Details of dugong herd observations in the Cap Goulvain region in New
Caledonia. ....................................................................................................................... 190
Table D.6: Results of Analysis of Deviance for log-linear model with Poisson
distribution and log link function. Response was the total number of dugongs
counted per survey. ......................................................................................................... 193

Chapter 1: General Introduction
1
Chapter 1: General Introduction
Christophe Cleguer
2
1.1 Introduction
Wildlife and their natural environments are increasingly threatened, compromising the condition
of ecosystems and the benefits and services they provide to human communities (Butchart et al.
2010). As a result, there is a growing appreciation of the urgent need for conservation actions at
local, regional, national, and international levels (Rands et al. 2010). Conservation, defined here
as actions that are intended to establish, improve or maintain good relations with nature
(Sandbrook 2015), is often practised through the design and implementation of management
plans that have been developed for single species or sets of species, habitats or ecosystems.
These plans generally contain the following major components: conservation objectives, and
specific costed and prioritised strategies or actions to meet those objectives over specified time
frames (Groves et al. 2002; Sutherland 2008). Whether or not these plans are optimized to
protect the features of interest most cost-effectively is rarely addressed. Assessment of the
adequacy of conservation plans is often limited by a lack of knowledge about the features of
interest and the likely relative impact of chosen strategies. Conservation and legislative
imperatives often force conservation managers to develop conservation plans based on the
Precautionary Principle using anecdotal evidence (Sutherland 2008) and/or risk assessment
approaches.
In order for decision-makers to choose the best options and evaluate their practice, supporting
information about features of interest must be readily available in a useable format (Groves
2003). However, too often this information is incomplete, unreliable, missing, or unavailable at
a scale that is useful for informing real-world decision making (Di Minin and Toivonen 2015).
Failing to use relevant information on features of interest often results in allocating –often
limited- conservation resources and implementing conservation actions at the wrong time and/or
in the wrong place (Pressey and Bottrill 2009). In the last decades, evidence-based frameworks
have emerged as one of the tools to support decision-making in conservation management and
to limit this risk (Pullin and Knight 2003; Pullin et al. 2004; Sutherland et al. 2004). One of the
key components of evidence-based frameworks is to promote the objective identification of
knowledge gaps and, therefore, prioritisation of areas where evidence needs to be acquired
through appropriate research and monitoring practices. However, I do not advocate nations,
especially developing nations, postponing conservation measures in the face of scientific
uncertainties.
These problems are particularly challenging in the context of developing and implementing
plans for conserving marine mammals, which are becoming critical as human populations
continue to increase and cause modification to the natural environments of the coastal zone
Chapter 1: General Introduction
3
(Gales et al. 2003; Reynolds et al. 2009). Marine mammals are distributed throughout the
world’s coastal zones and oceans. Marine mammals include both top predators (e.g., orcas) and
important low trophic level consumers and grazers (e.g., dugongs); both groups play an
important role in the food webs of oceanic and coastal ecosystems (Bowen 1997; Ridgway
1998). Marine mammals have relatively large body sizes and long lifespans. They follow a K-
selection strategy with few offspring, long gestation, long parental care, and a long period until
sexual maturity (Boyd et al. 1999). As a result, most marine mammals take a relatively long
time to recover from disturbance, especially unusual mortality events. Marine mammals face an
array of hazards from human activities, including bycatch in fishing gear, collision with vessels,
depletion of prey resources, hunting, pollution, disease, and habitat degradation and loss, and
climate change (Marsh et al. 2003). Nearly 3% of the world’s marine mammal species have
become extinct due to human activities in the past 60 years (Marsh et al. 2003; Reynolds et al.
2009). The status of many species or populations of marine mammals has not been assessed
due, in part, to data deficiency (IUCN 2015). Thus, there is an urgent need to assess the status of
many marine mammal populations to inform conservation and management strategies.
The effective management of marine mammals is often constrained by the costs associated with
implementing conservation actions at appropriate temporal and spatial scales, partly because
marine mammals tend to occupy large ranges (Pompa et al. 2011). Spatially-explicit models of
marine mammal distribution can greatly inform the strategic deployment of conservation
resources over large spatial scales by identifying sites where species are most abundant, and
where conservation actions should provide the greatest positive impact over their entire
distributional range (Theobald 2003). Defining these critical habitats is the first step toward an
effective spatial placement (or marine spatial planning) of reserves more commonly called
marine protected areas that reduce hazards to species, while enhancing economically important
anthropogenic activities (Ingram and Rogan 2002; Bailey and Thompson 2009).
Even basic monitoring and research to identify critical marine mammal habitats has not been
carried out in many MPAs and few MPAs have developed adequate policy recommendations
and adaptive ecosystem-based management guidance to guarantee effective habitat protection
for marine mammals (Marsh et al. 2012; Hoyt 2012). Marine mammals, despite being iconic
and having the potential to be used as keystones including cultural keystone (i.e., critical to the
ecological function of a community or habitat), umbrella (i.e., their conservation will also
conserve other species) and flagship species (i.e., their charismatic profile can leverage support
for conservation), they are often overlooked in the design, establishment and management of
MPAs and subsequent monitoring for adaptive management (Zacharias and Roff 2001;
Schofield et al. 2013). The movement patterns of marine mammals are dynamic and their
Christophe Cleguer
4
habitat requirements are often unknown (Hoyt 2012). Nonetheless, advances in technologies
such as telemetry devices now have the potential to provide essential information on the spatial
and temporal movement patterns of individual marine mammals. This knowledge is
increasingly used to identify their core activity spaces as sites worth protecting or to drive
policy change (Bograd et al. 2010).
This thesis aims to inform the conservation and management of the dugong (Dugong dugon) in
New Caledonia, an important population at the eastern edge of its global range. The remainder
of this introduction provides a background on the issues associated with dugong conservation
and a brief overview of dugong ecology. I then outline the information available on dugongs in
New Caledonia and identify key information gaps required to enhance the conservation of
species in that region. Finally, I present the objectives of my research and explain the structure
of this thesis.
1.2 The dugong
Dugong conservation issues
The dugong is the only extant member of the family Dugongidae, and, together with the three
species of manatee, one of four living species of the order Sirenia, which is one of the three
mammalian orders considered to be most at risk of extinction (Purvis et al. 2000; Marsh et al.
2012). The other member of the Dugongidae, Stellers’ sea cow (Hydrodamalis gigas), was
exterminated within less than 30 years of its rediscovery in the middle of the eighteenth century
because its last remaining population was over-exploited for meat (Stejneger 1887; Marsh et al.
2012). The extinction of this species demonstrates the vulnerability of the order Sirenia and
provides justification for measures to proactively protect the four extant species.
The dugong is listed as vulnerable at a global scale on the IUCN Red List (Marsh 2008); and on
Appendix I (species threatened with extinction) of the Convention on International Trade in
Endangered Species of Wild Fauna and Flora (CITES). The dugong is also listed under
Appendix II of the Convention on Migratory Species of Wild Animals (CMS), which aims to
conserve species crossing international frontiers (CMS 2009).
The dugong is believed to be declining or extinct in one third of its range and of unknown status
in half of its range (Marsh 2008, 2011). Based on potential habitat (water <10m deep in the
possible range states of the species) the estimated extent of occurrence of the dugongs is
~860,000km2, spanning the coastal and island waters of at least 37, and to up to 44 countries
Chapter 1: General Introduction
5
and territories (Marsh et al. 2012). Over much of its global range, the dugong is represented by
relict populations (e.g., in Mayotte, Japan, Palau, etc.) and known only from incidental sightings
and retrieval of carcasses (Marsh et al. 2002, 2012). The dugong no longer exists in the waters
of several islands including the Maldives, the Mascarene Islands of Mauritius and Rodrigues,
and Taiwan (Husar 1978; Marsh 2008), illustrating the increased vulnerability of populations in
the isolated waters surrounding islands and archipelagos.
The need to address global dugong conservation and management issues was emphasized by the
Thailand and the Australian governments under the auspice of the CMS, intergovernmental
negotiation meetings held in 2005 and 2006 that led to the development of the CMS
Memorandum of Understanding (MoU) on Dugongs and their Seagrass Habitats throughout
their Range and the endorsement of its associated Conservation and Management Plan in
October 2007. The CMS Dugong MoU has been signed by 26 state signatories to date (CMS
2014). The aim of the Memorandum of Understanding is to facilitate national level and trans-
boundary actions that will lead to the conservation of dugong populations and their habitats.
One of the objectives to help achieve this aim is to improve the knowledge of dugongs and their
habitats through research and monitoring. France, the country that administers the territory of
New Caledonia, is a signatory to the CMS dugong MoU.
Dugong ecology – a brief overview
Dugong ecology has been extensively investigated, mainly over the last three decades. I briefly
describe some of the most important aspects that have been documented to date to provide a
context for this study. This information is largely based on data collected from dugongs in
Australia and in the Arabian Gulf. Marsh et al. (2012) provides an extensive synthesis of the
information available on the ecology and conservation of dugongs and other sirenians. This
synthesis has been augmented by more regionally-specific information in Hines et al. (2012).
Adult dugongs are usually 2-3m long (Marsh et al. 2012) and can live for up to 70 years (Marsh
1980; Marsh et al. 1984; Marsh 1995; Kwan 2002). The oldest wild dugong whose age has been
estimated using the growth layer groups in its tusk was a female estimated to be around 73 years
old when she died (Marsh 1995). Information on the reproductive biology of the dugong mostly
comes from the analysis of material from carcasses of more than 1,500 dugongs, including some
400 individuals whose ages have been estimated (Bertram and Bertram 1970; Marsh et al. 1980,
1984, Marsh 1986, 1995; Kwan 2002; Marsh and Kwan 2008). Females have a minimum pre-
reproductive period of 6-17 years (Marsh et al. 1984; Boyd et al. 1999; Kwan 2002; Marsh et
al. 2012). This parameter varies among individuals and populations. The age of sexual maturity
in males tends to be similar to that of females in the same population (Kwan 2002). The average
Christophe Cleguer
6
dugong calving interval is between 2.5 and 6.8 years in different populations (Marsh 1995).
Population simulations indicate that even with the most optimistic combinations of life-history
parameters (e.g., low natural mortality and no human-induced mortality) a dugong population is
unlikely to increase more than 5% per year (Marsh 1986). Species with such a life history
require very high and stable levels of adult survival to maintain their numbers and can sustain
only very limited levels of mortality from human causes (Marsh et al. 2012).
Dugongs are the only strictly marine herbivorous mammal. They are seagrass community
specialists feeding mostly on seagrass but also on other biota associated with seagrass
communities such as algae and invertebrates (Marsh et al. 2012). Dugongs have been reported
to feed on invertebrates at the subtropical limits of their range (Preen 1995). Dugongs closely
associated with algal-covered, rocky reefs in the Northern Territory in Australia, have been
documented by Whiting (2002, 2008) suggesting that dugongs may also subsist on algae.
Feeding on individual species of structurally small seagrass in a mixed-species seagrass
meadow may be difficult and individual dugongs often consume several seagrasses on a single
dive (Johnstone and Hudson 1981). I further discuss the selection of seagrass and non-seagrass
habitats by dugongs in Chapter 5.
As seagrass community specialists, dugongs are mostly distributed in shallow coastal habitats
(up to 35m deep). Their coastal distribution puts them at risk from anthropogenic activities
including: (1) direct hazards such as hunting, incidental and deliberate capture in nets, and
vessel strike; and (2) indirect hazards such as the disturbance or destruction of their habitat
(Marsh et al. 1999, 2002, 2012). The nature and level of hazards to dugongs varies across and
within countries and territories across their range. Hazards to dugongs can be grouped into three
main categories (Marsh et al. 2012): hazards experienced in the developing world; hazards more
prevalent in developed regions; and hazards that are more universal. Natural factors including
predation, severe climatic events, diseases, and parasites are generic hazards. In developed
regions, dugongs are typically impacted by anthropogenic coastal activities including boating
and shipping, coastal urbanization and industry that reflect the increasing human occupation of
coastal environments (Marsh et al. 2012). In developing regions, urbanisation and
industrialisation are likely to be less important but the dugong may still be a major food
resource and is essential to food security. Consequently, the conservation of dugongs will only
be effective if their hazards are investigated with regard to specific locations.
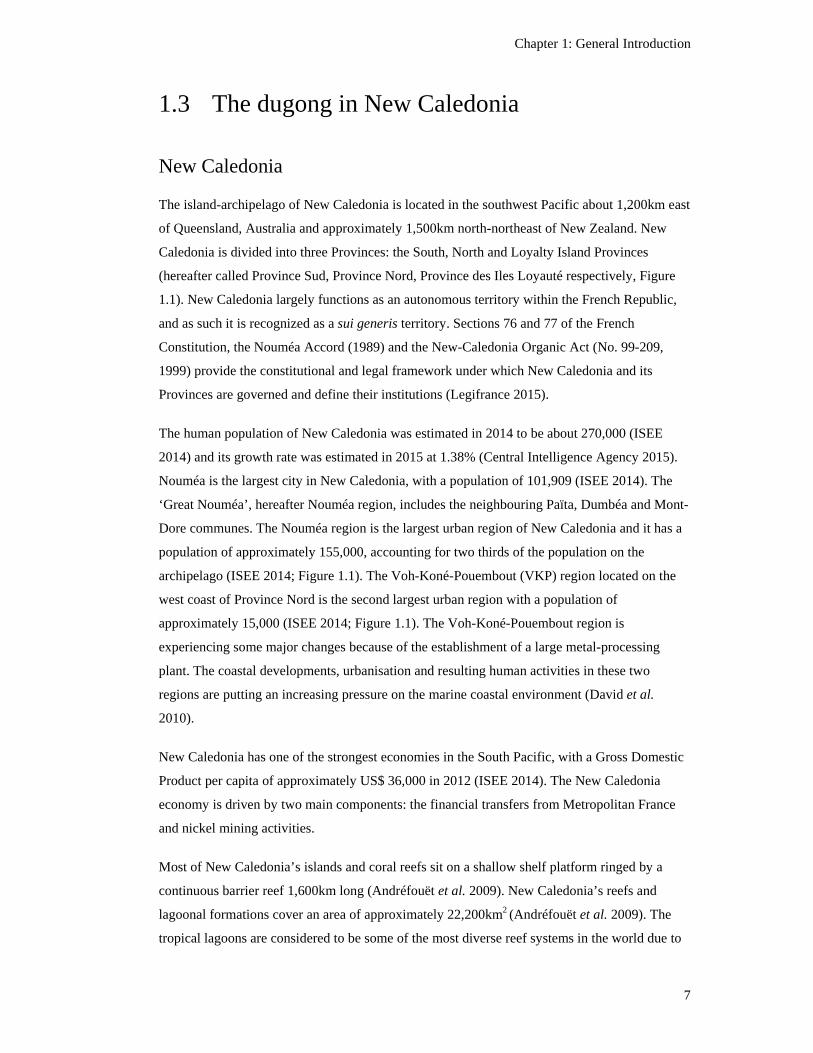
Chapter 1: General Introduction
7
1.3 The dugong in New Caledonia
New Caledonia
The island-archipelago of New Caledonia is located in the southwest Pacific about 1,200km east
of Queensland, Australia and approximately 1,500km north-northeast of New Zealand. New
Caledonia is divided into three Provinces: the South, North and Loyalty Island Provinces
(hereafter called Province Sud, Province Nord, Province des Iles Loyauté respectively, Figure
1.1). New Caledonia largely functions as an autonomous territory within the French Republic,
and as such it is recognized as a sui generis territory. Sections 76 and 77 of the French
Constitution, the Nouméa Accord (1989) and the New-Caledonia Organic Act (No. 99-209,
1999) provide the constitutional and legal framework under which New Caledonia and its
Provinces are governed and define their institutions (Legifrance 2015).
The human population of New Caledonia was estimated in 2014 to be about 270,000 (ISEE
2014) and its growth rate was estimated in 2015 at 1.38% (Central Intelligence Agency 2015).
Nouméa is the largest city in New Caledonia, with a population of 101,909 (ISEE 2014). The
‘Great Nouméa’, hereafter Nouméa region, includes the neighbouring Païta, Dumbéa and Mont-
Dore communes. The Nouméa region is the largest urban region of New Caledonia and it has a
population of approximately 155,000, accounting for two thirds of the population on the
archipelago (ISEE 2014; Figure 1.1). The Voh-Koné-Pouembout (VKP) region located on the
west coast of Province Nord is the second largest urban region with a population of
approximately 15,000 (ISEE 2014; Figure 1.1). The Voh-Koné-Pouembout region is
experiencing some major changes because of the establishment of a large metal-processing
plant. The coastal developments, urbanisation and resulting human activities in these two
regions are putting an increasing pressure on the marine coastal environment (David et al.
2010).
New Caledonia has one of the strongest economies in the South Pacific, with a Gross Domestic
Product per capita of approximately US$ 36,000 in 2012 (ISEE 2014). The New Caledonia
economy is driven by two main components: the financial transfers from Metropolitan France
and nickel mining activities.
Most of New Caledonia’s islands and coral reefs sit on a shallow shelf platform ringed by a
continuous barrier reef 1,600km long (Andréfouët et al. 2009). New Caledonia’s reefs and
lagoonal formations cover an area of approximately 22,200km2 (Andréfouët et al. 2009). The
tropical lagoons are considered to be some of the most diverse reef systems in the world due to
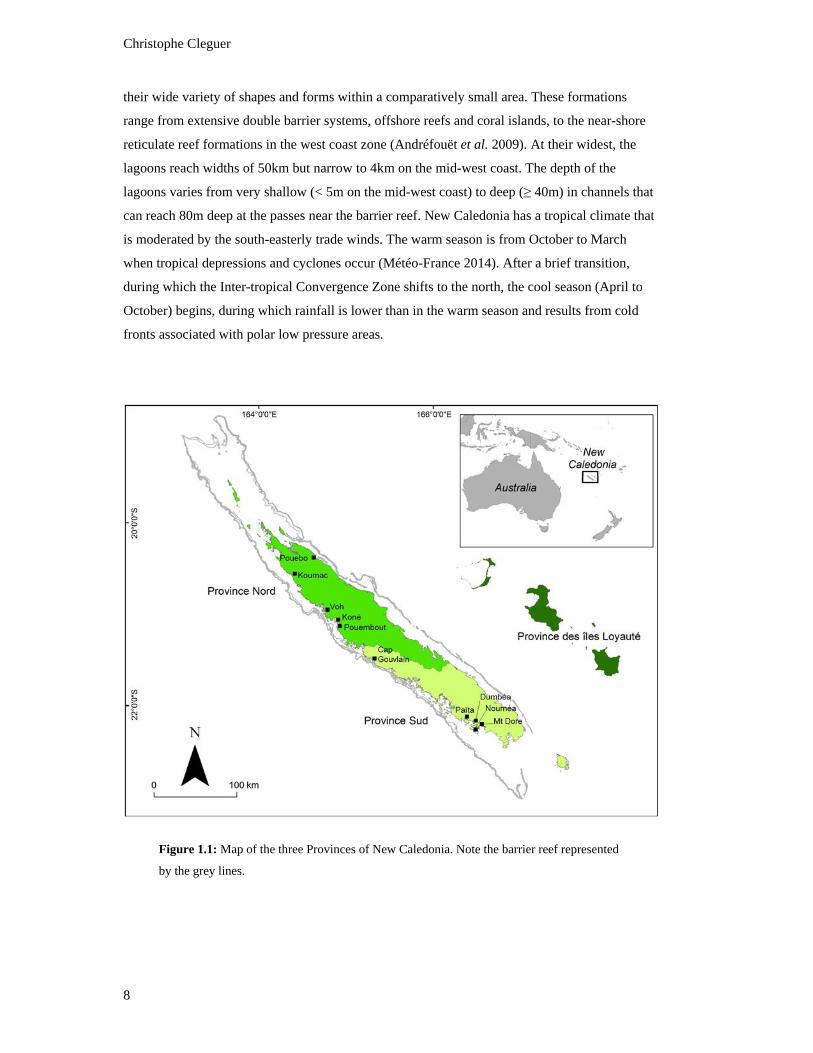
Christophe Cleguer
8
their wide variety of shapes and forms within a comparatively small area. These formations
range from extensive double barrier systems, offshore reefs and coral islands, to the near-shore
reticulate reef formations in the west coast zone (Andréfouët et al. 2009). At their widest, the
lagoons reach widths of 50km but narrow to 4km on the mid-west coast. The depth of the
lagoons varies from very shallow (< 5m on the mid-west coast) to deep (≥ 40m) in channels that
can reach 80m deep at the passes near the barrier reef. New Caledonia has a tropical climate that
is moderated by the south-easterly trade winds. The warm season is from October to March
when tropical depressions and cyclones occur (Météo-France 2014). After a brief transition,
during which the Inter-tropical Convergence Zone shifts to the north, the cool season (April to
October) begins, during which rainfall is lower than in the warm season and results from cold
fronts associated with polar low pressure areas.
Figure 1.1: Map of the three Provinces of New Caledonia. Note the barrier reef represented
by the grey lines.
Chapter 1: General Introduction
9
The statutory powers associated with environmental protection and management, including
MPAs, are shared between the French central government (international environmental law,
fundamental and human rights), the New Caledonia Congress and government (natural
resources of the Exclusive Economic Zone, mining activities, energy production, water
management, and health, fiscal, and land planning measures etc. that are related to the
environment) and the three Provinces (biodiversity, natural resources, maritime public domain
etc.). Thus, Provinces are able to establish marine protected areas (MPAs) in the maritime
public domain. Today, there are 33 MPAs in New Caledonia: seven in Province Nord and 26 in
Province Sud (see Chapter 3). In addition to MPAs, six marine zones (henceforth UNESCO
zones) representing major patterns in the diversity of coral reefs and associated ecosystems are
registered as a World Heritage Area (UNESCO 2009). There are two UNESCO zones in each
Province and each zone is managed by local management committees and the relevant Province
management authority. Overall, patrolling and law enforcement are very weak (David et al.
2010).
Dugong conservation in New Caledonia
New Caledonia is among the eight confirmed dugong range states and territories with a very
high Human Developed Index (UNDP 2010). It is located at the eastern edge of the dugong’s
range as explained above. France is signatory to the Dugong MoU under the Convention of
Migratory Species (Marsh et al. 2012) and dugongs were an explicit reason for some of the
lagoons’ World Heritage listing in 2008 (UNESCO 2009). As a stronghold (Chapter 2) of the
dugong in the Oceania region and a developed territory, New Caledonia has an international
obligation to ensure the dugong survival.
The dugong is culturally very important to the indigenous population of New Caledonia, the
Kanak people. It is an emblem of respect and care of marine wildlife in the territory and, as a
result, its conservation is of considerable societal value (Garrigue et al. 2008; Cleguer 2010;
Dupont 2015). Dugong hunting has been conducted for centuries in New Caledonia to meet the
needs of certain traditional ceremonies (Leblic 2008), including the ceremony of the New Yam,
weddings, bereavements and leaders’ inductions. The dugong is associated with kanak
chieftaincy because it is a prestige food, the "meat of the leaders" (Dupont 2015).
Regulations related to dugong take have evolved within the territory over the past 50 years.
Resolution 68, implemented in 1963, was the first regulation to prohibit dugong hunting in any
French territory. The most recent regulations for dugongs were implemented in 2004 in
Province Sud and in 2006 in Province Nord. Dugong hunting is now prohibited in Province Sud
and only allowed under special permit in the Province Nord (Province Nord 2008; Province Sud
Christophe Cleguer
10
2009). In Province des Iles Loyauté, dugong regulation remains under resolution 68 of 1963;
dugong hunting is forbidden unless a special permit is granted, generally for customary
purposes. Between 1962 and 1989, a total of 190 applications for special permits was received;
165 authorizations were granted (i.e., six authorizations per year) and 24 refused (Garrigue et al.
2008). Most permits were requested for hunting in the northeast region (46%) and along the
west coast (39%) of the main island (Garrigue et al. 2008). No permit has been granted in
Province Nord since 2004 (two permit applications were submitted to Province Nord, one in
2013 and one in 2014, but they were rejected; SMRA, DDEE, Province Nord pers. comm.).
In 2010, a Dugong Action Plan was developed and implemented jointly by the Marine Protected
Area Agency, Province Nord, Province Sud, and Province des Iles Loyauté, the French
Government, the Government of New Caledonia, the Customary Senate, the WWF and
Opération Cetacés (a local Marine Mammal Research NGO; Jacob and Gardes 2010). The
Dugong Action Plan follows the recommendations listed in the Dugong Memorandum of
Understanding developed under the Convention on Migratory Species (MoU 2007) and aims to
fulfil the objectives stated in the South Pacific Regional Environmental Program (SPREP)
Dugong Action Plan (Gillespie 2005; SPREP 2012). One of the aims of this Dugong Action
Plan is to obtain ecological information on dugongs to inform decisions relating to their
conservation and management in the Pacific Island region.
Dugong ecology in New Caledonia
Abundance, distribution
Various methods exist to estimate the abundance of populations. Visual surveys and mark-
recapture techniques are two methods that are often used. It is unusual for all individuals to be
available to observers, necessitating methods to estimate population size. Individual counts are
often interpreted as measures of relative abundance, and can be generated for a single species or
communities of species (Norton-Griffiths 1978).
A single baseline dugong aerial survey conducted during the cool season of 2003 resulted in a
population estimate of 2026 (± SE = 553) animals (Garrigue et al. 2008). A second similar
survey conducted during the warm season of 2008 to assess seasonal changes in the dugong
relative abundance produced a lower estimate of 606 (± SE = 200) individuals (Garrigue et al.
2009). The five year gap between these two surveys mainly resulted from a lack of funding to
conduct the second survey. The discrepancy in the 2003 and 2008 estimates of dugong relative
abundance prompted concerns among local resource managers who underwrote my PhD
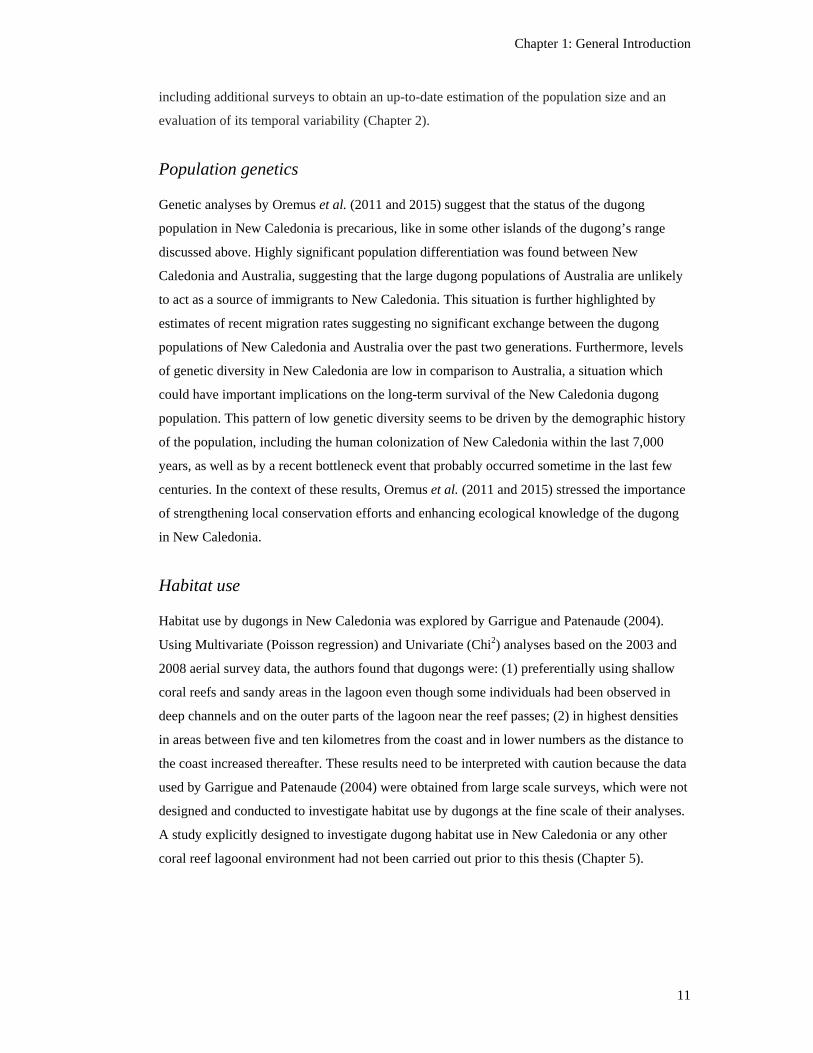
Chapter 1: General Introduction
11
including additional surveys to obtain an up-to-date estimation of the population size and an
evaluation of its temporal variability (Chapter 2).
Population genetics
Genetic analyses by Oremus et al. (2011 and 2015) suggest that the status of the dugong
population in New Caledonia is precarious, like in some other islands of the dugong’s range
discussed above. Highly significant population differentiation was found between New
Caledonia and Australia, suggesting that the large dugong populations of Australia are unlikely
to act as a source of immigrants to New Caledonia. This situation is further highlighted by
estimates of recent migration rates suggesting no significant exchange between the dugong
populations of New Caledonia and Australia over the past two generations. Furthermore, levels
of genetic diversity in New Caledonia are low in comparison to Australia, a situation which
could have important implications on the long-term survival of the New Caledonia dugong
population. This pattern of low genetic diversity seems to be driven by the demographic history
of the population, including the human colonization of New Caledonia within the last 7,000
years, as well as by a recent bottleneck event that probably occurred sometime in the last few
centuries. In the context of these results, Oremus et al. (2011 and 2015) stressed the importance
of strengthening local conservation efforts and enhancing ecological knowledge of the dugong
in New Caledonia.
Habitat use
Habitat use by dugongs in New Caledonia was explored by Garrigue and Patenaude (2004).
Using Multivariate (Poisson regression) and Univariate (Chi2) analyses based on the 2003 and
2008 aerial survey data, the authors found that dugongs were: (1) preferentially using shallow
coral reefs and sandy areas in the lagoon even though some individuals had been observed in
deep channels and on the outer parts of the lagoon near the reef passes; (2) in highest densities
in areas between five and ten kilometres from the coast and in lower numbers as the distance to
the coast increased thereafter. These results need to be interpreted with caution because the data
used by Garrigue and Patenaude (2004) were obtained from large scale surveys, which were not
designed and conducted to investigate habitat use by dugongs at the fine scale of their analyses.
A study explicitly designed to investigate dugong habitat use in New Caledonia or any other
coral reef lagoonal environment had not been carried out prior to this thesis (Chapter 5).
Christophe Cleguer
12
Food resources
The interaction between dugongs and their seagrass food has also not been studied in New
Caledonia. Studies of marine phanerogams in New Caledonia began with Garrigue’s work in
the 1980s (Garrigue 1987) investigating the macrophyte communities associated with soft
bottoms in the southwest lagoon of the main island. The most complete taxonomic list of the
marine flora of New Caledonia was published in 2006 (Payri 2006). Among the 65 known
species of exclusively marine phanerogams, 11 species are recorded in New Caledonia. These
are divided in six genera (Hily et al. 2010) belonging to the family of the Cymodoceaceae
(Cymodocea, Halodule, and Syringodium) and the Hydrocharitaceae (Enhalus, Halophila,
Thalassia). In situ observations and analyses of dugong stomach contents in other regions such
as Australia and Papua New Guinea confirm that the dugong feed on both seagrass leaves and
rhizomes of all of these genera (Johnstone and Hudson 1981; Marsh et al. 1982; Nietschmann
1984; Preen 1992; Masini et al. 2001; Sheppard et al. 2010). The marine vegetation of New
Caledonia was mapped using optical remote sensing performed with multispectral imagery
including several 30m resolution images obtained from Landsat 7 in 1999 and 2003. These
estimates are only for seagrass in relatively shallow water (< 5m Andréfouët et al. 2010) and are
thus likely to underestimate the spatial extent of the seagrass communities used by dugongs in
this region.
Hazards to dugongs and their habitats in New Caledonia
As I explained above, generic hazards to dugongs and to their habitat have been well
documented (Marsh et al. 2012). However, I believe that hazards to dugong need to be
investigated with regard to the specific locations to inform local conservation initiatives.
Hazards can be directly caused by humans or they can be natural. The line between these two
categories can be difficult to distinguish as some natural hazards are exacerbated by human
activities (Marsh et al. 2012).
A spatial assessment of the risks to dugongs from anthropogenic activities has been lacking (see
Chapter 6). Based on interviews with environmental managers from Province Nord and
Province Sud, Bordin (2009) suggested that interactions with vessels, illegal hunting and habitat
degradation were the most likely current hazards to dugongs and their habitat in New Caledonia.
Stranding information collected between 2004 and 2008 and interviews with local stakeholders
confirmed that collision between dugongs and boats occur in the urban region of Nouméa but
have been avoided in Voh-Koné-Pouembout (ESCAL and A2EP 2011; Claire Garrigue pers.
comm.). In remote regions of New Caledonia, illegal hunting still occurs despite the current
Chapter 1: General Introduction
13
quasi-ban on dugong take unless a special permit is granted in Province Nord (which has not
occurred since 2004).
Natural hazards to dugongs in New Caledonia have not been documented although it is believed
that major climatic events such as tropical cyclones represent a potential risk to the dugongs and
their habitats (Garrigue et al. 2008; Hily et al. 2010). Climatic events such as strong swells,
heavy rainfall and cyclones can lead to sediment displacement resulting in the uprooting of
rhizomes or the burial of seagrass (Hily et al. 2010). In February 2011, following several years
of severe storms and heavy rain, severe tropical cyclone Yasi resulted in a significant decrease
of food availability for dugongs on the east coast of Australia and hence a dramatic increase in
the number of carcasses salvaged (GBRMPA 2011). Given the much lower number of dugongs
occurring in New Caledonia compared with Queensland, and their much lower genetic
diversity, it is essential to consider the potential impact of severe climatic events on the species
and its habitat in that archipelago.
Information on predation by sharks on dugongs in New Caledonia is mainly limited to anecdotal
reports by sea users including sea-rangers, tourists on recreational boats, windsurfers and kite-
surfers (but see Garrigue et al., 2008 and unpublished data and Chapter 5).
What we need to know about dugongs in New Caledonia
Despite the discrepancy in the dugong population estimates obtained from the 2003 and 2008
surveys, New Caledonia is one of the few countries where dugongs still occur in large numbers.
Thus the conservation of the dugong population in New Caledonia at the eastern end of the
dugong’s global range, is critical for the maintenance of the species in the Oceania region and
globally. Understanding of the dugong population in New Caledonia and the current
conservation strategies is limited and requires further research. Information is needed on: (1) the
current size of the dugong population and its temporal variability, (2) the dugong distribution
and relative density in the region, and (3) the capacity of the current management tools to
protect important dugong habitats. Furthermore, very little is known about the spatial ecology of
dugongs in tropical lagoons and coral reefs. Information is needed on how dugongs use space
and habitats in the lagoons of New Caledonia. My thesis aims to address these gaps at several
spatial and temporal scales.
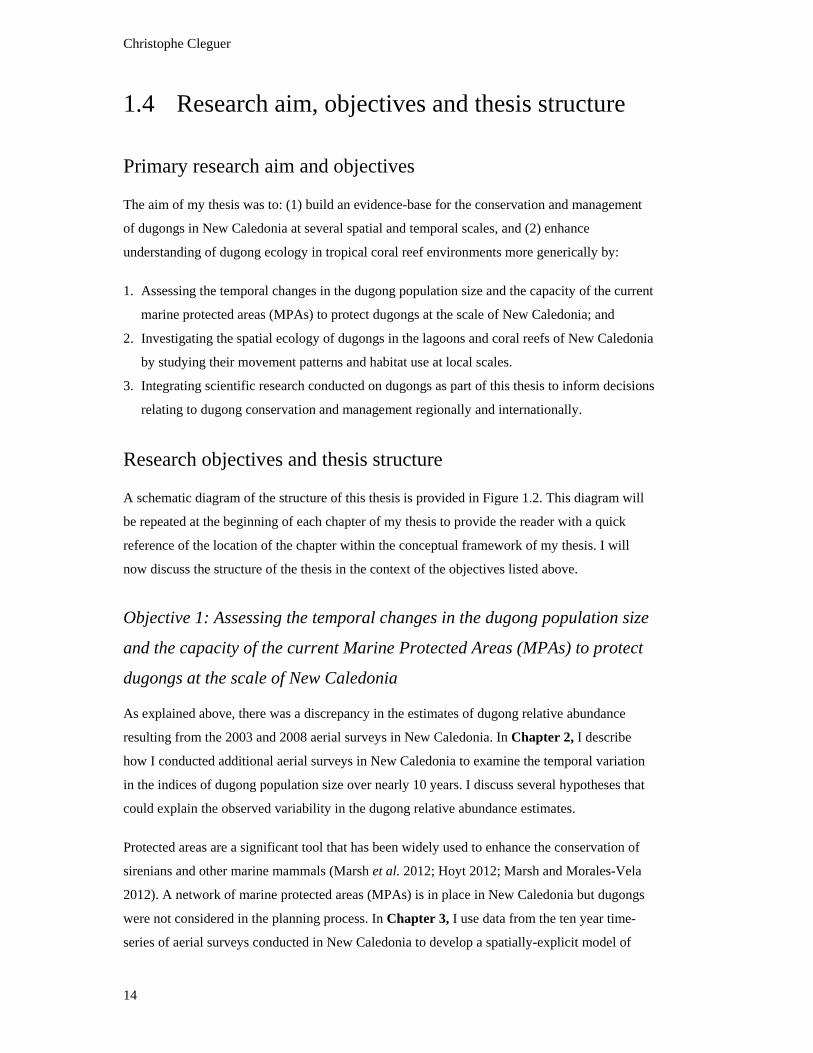
Christophe Cleguer
14
1.4 Research aim, objectives and thesis structure
Primary research aim and objectives
The aim of my thesis was to: (1) build an evidence-base for the conservation and management
of dugongs in New Caledonia at several spatial and temporal scales, and (2) enhance
understanding of dugong ecology in tropical coral reef environments more generically by:
1. Assessing the temporal changes in the dugong population size and the capacity of the current
marine protected areas (MPAs) to protect dugongs at the scale of New Caledonia; and
2. Investigating the spatial ecology of dugongs in the lagoons and coral reefs of New Caledonia
by studying their movement patterns and habitat use at local scales.
3. Integrating scientific research conducted on dugongs as part of this thesis to inform decisions
relating to dugong conservation and management regionally and internationally.
Research objectives and thesis structure
A schematic diagram of the structure of this thesis is provided in Figure 1.2. This diagram will
be repeated at the beginning of each chapter of my thesis to provide the reader with a quick
reference of the location of the chapter within the conceptual framework of my thesis. I will
now discuss the structure of the thesis in the context of the objectives listed above.
Objective 1: Assessing the temporal changes in the dugong population size
and the capacity of the current Marine Protected Areas (MPAs) to protect
dugongs at the scale of New Caledonia
As explained above, there was a discrepancy in the estimates of dugong relative abundance
resulting from the 2003 and 2008 aerial surveys in New Caledonia. In Chapter 2, I describe
how I conducted additional aerial surveys in New Caledonia to examine the temporal variation
in the indices of dugong population size over nearly 10 years. I discuss several hypotheses that
could explain the observed variability in the dugong relative abundance estimates.
Protected areas are a significant tool that has been widely used to enhance the conservation of
sirenians and other marine mammals (Marsh et al. 2012; Hoyt 2012; Marsh and Morales-Vela
2012). A network of marine protected areas (MPAs) is in place in New Caledonia but dugongs
were not considered in the planning process. In Chapter 3, I use data from the ten year time-
series of aerial surveys conducted in New Caledonia to develop a spatially-explicit model of
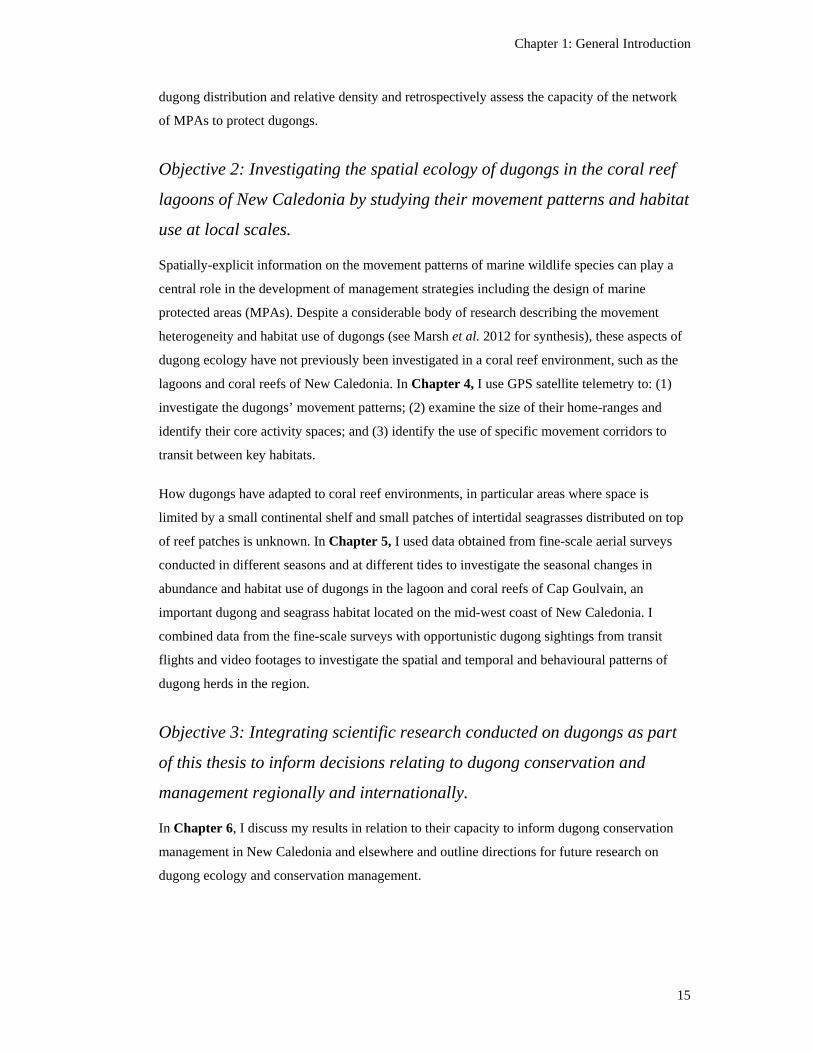
Chapter 1: General Introduction
15
dugong distribution and relative density and retrospectively assess the capacity of the network
of MPAs to protect dugongs.
Objective 2: Investigating the spatial ecology of dugongs in the coral reef
lagoons of New Caledonia by studying their movement patterns and habitat
use at local scales.
Spatially-explicit information on the movement patterns of marine wildlife species can play a
central role in the development of management strategies including the design of marine
protected areas (MPAs). Despite a considerable body of research describing the movement
heterogeneity and habitat use of dugongs (see Marsh et al. 2012 for synthesis), these aspects of
dugong ecology have not previously been investigated in a coral reef environment, such as the
lagoons and coral reefs of New Caledonia. In Chapter 4, I use GPS satellite telemetry to: (1)
investigate the dugongs’ movement patterns; (2) examine the size of their home-ranges and
identify their core activity spaces; and (3) identify the use of specific movement corridors to
transit between key habitats.
How dugongs have adapted to coral reef environments, in particular areas where space is
limited by a small continental shelf and small patches of intertidal seagrasses distributed on top
of reef patches is unknown. In Chapter 5, I used data obtained from fine-scale aerial surveys
conducted in different seasons and at different tides to investigate the seasonal changes in
abundance and habitat use of dugongs in the lagoon and coral reefs of Cap Goulvain, an
important dugong and seagrass habitat located on the mid-west coast of New Caledonia. I
combined data from the fine-scale surveys with opportunistic dugong sightings from transit
flights and video footages to investigate the spatial and temporal and behavioural patterns of
dugong herds in the region.
Objective 3: Integrating scientific research conducted on dugongs as part
of this thesis to inform decisions relating to dugong conservation and
management regionally and internationally.
In Chapter 6, I discuss my results in relation to their capacity to inform dugong conservation
management in New Caledonia and elsewhere and outline directions for future research on
dugong ecology and conservation management.
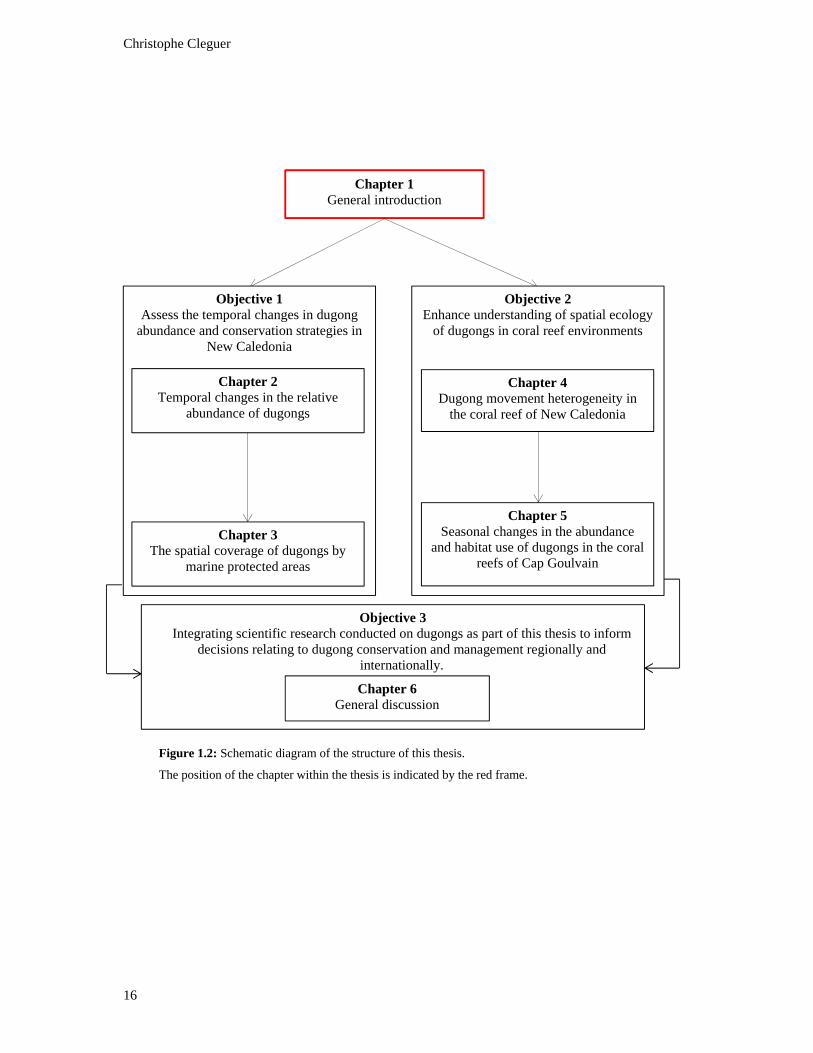
Christophe Cleguer
16
Figure 1.2: Schematic diagram of the structure of this thesis.
The position of the chapter within the thesis is indicated by the red frame.
Chapter 1 General introduction
Chapter 6 General discussion
Objective 2 Enhance understanding of spatial ecology
of dugongs in coral reef environments
Objective 1 Assess the temporal changes in dugong
abundance and conservation strategies in New Caledonia
Chapter 2 Temporal changes in the relative
abundance of dugongs
Chapter 3 The spatial coverage of dugongs by
marine protected areas
Chapter 4 Dugong movement heterogeneity in
the coral reef of New Caledonia
Chapter 5 Seasonal changes in the abundance
and habitat use of dugongs in the coral reefs of Cap Goulvain
Objective 3 Integrating scientific research conducted on dugongs as part of this thesis to inform
decisions relating to dugong conservation and management regionally and internationally.
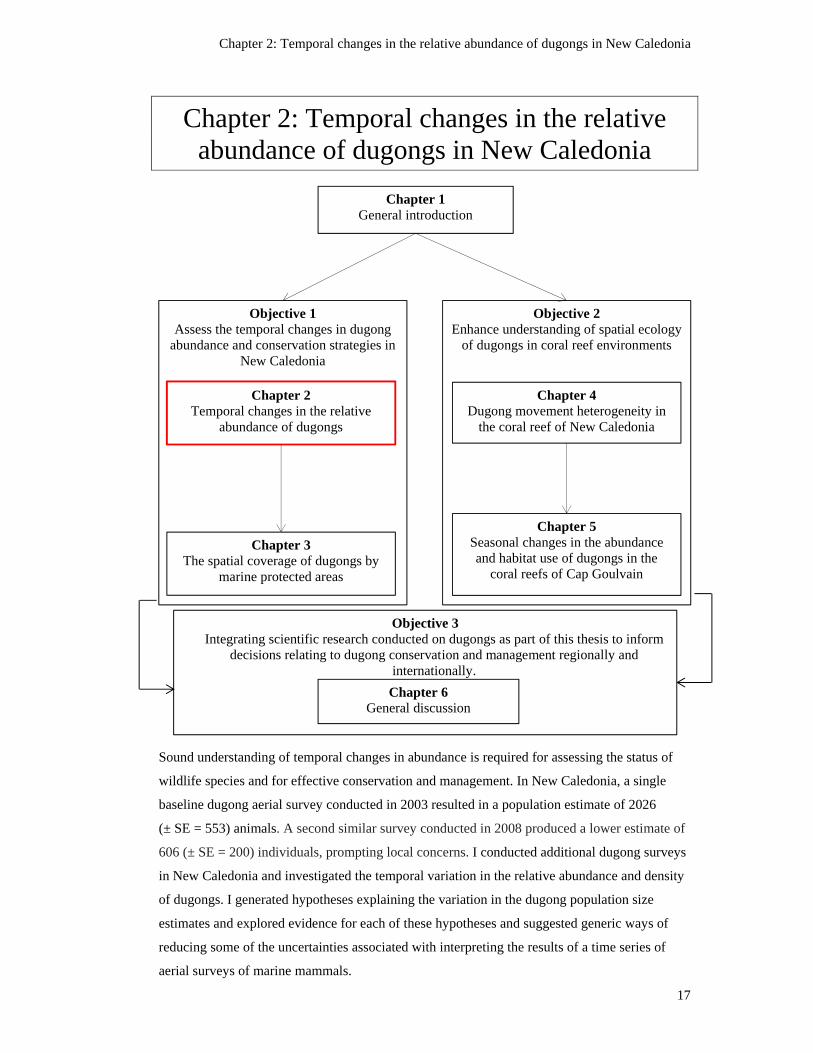
Chapter 2: Temporal changes in the relative abundance of dugongs in New Caledonia
17
Chapter 2: Temporal changes in the relative abundance of dugongs in New Caledonia
Sound understanding of temporal changes in abundance is required for assessing the status of
wildlife species and for effective conservation and management. In New Caledonia, a single
baseline dugong aerial survey conducted in 2003 resulted in a population estimate of 2026
(± SE = 553) animals. A second similar survey conducted in 2008 produced a lower estimate of
606 (± SE = 200) individuals, prompting local concerns. I conducted additional dugong surveys
in New Caledonia and investigated the temporal variation in the relative abundance and density
of dugongs. I generated hypotheses explaining the variation in the dugong population size
estimates and explored evidence for each of these hypotheses and suggested generic ways of
reducing some of the uncertainties associated with interpreting the results of a time series of
aerial surveys of marine mammals.
Objective 2 Enhance understanding of spatial ecology
of dugongs in coral reef environments
Objective 1 Assess the temporal changes in dugong
abundance and conservation strategies in New Caledonia
Chapter 1 General introduction
Chapter 2 Temporal changes in the relative
abundance of dugongs
Chapter 3 The spatial coverage of dugongs by
marine protected areas
Chapter 4 Dugong movement heterogeneity in
the coral reef of New Caledonia
Chapter 5 Seasonal changes in the abundance and habitat use of dugongs in the
coral reefs of Cap Goulvain
Chapter 6 General discussion
Objective 3 Integrating scientific research conducted on dugongs as part of this thesis to inform
decisions relating to dugong conservation and management regionally and internationally.

Christophe Cleguer
18
2.1 Introduction
Monitoring counts, indices, and estimates of wildlife populations provide an indicator of the
likelihood of the population continuing to exist. This information is important for managing
harvested and endangered species, triggering interventions, informing decisions, documenting
compliance with regulatory requirements, and detecting changes (Gibbs et al. 1998, 1999).
Nonetheless, one key challenge for the conservation and management of many wildlife
populations is the lack of robust data on trends (IUCN 2015). Thus focusing efforts on
surveying and assessing trends in wildlife populations is essential especially for coastal marine
species because increases in human population in coastal areas has resulted in growing pressure
to marine ecosystems (Crain et al. 2009).
As explained in Chapter 1, dugongs are an important component of tropical and subtropical
coastal ecosystems and are internationally recognized as vulnerable to extinction by the IUCN
(Marsh 2008). Dugong populations are at high risk of local extinction in several parts of their
range. Prospects for the survival of the dugong are positive in some regions such as Shark Bay,
Western Australia, and Torres Strait (located between Australia and Papua New Guinea).
Nonetheless, the situation is of concern in most of the species range, including the limits of its
range in east Africa to the west and in the Pacific Islands to the east (Marsh et al. 2012).
Dugong numbers have been estimated for 20 countries using aerial surveys methods (Marsh et
al. 2002, 2012). Yet in the Western Pacific region, information on dugong abundance is largely
anecdotal, apart from New Caledonia where standardized aerial surveys were conducted during
the cool season in 2003, resulting in a relative population estimate of 2026 (± SE = 553)
dugongs (Garrigue et al. 2008). Results obtained from this single baseline survey suggest that
New Caledonia supports one of the most important dugong populations in Oceania. However, a
second survey conducted during the warm season of 2008 resulted in an estimate of only 606 (±
SE = 200) individuals (Garrigue et al. 2009), prompting local concerns. Moreover, as I
explained in Chapter 1, recent genetic studies have highlighted the vulnerability of the dugong
population of New Caledonia. This population has a low genetic diversity and is isolated from
the large stocks of dugongs in Australia (Oremus et al. 2011, 2015).
I conducted additional dugong aerial surveys in New Caledonia to determine the current size of
the dugong population and examine its temporal variability. Monitoring changes in abundance
requires multiple surveys over a long period of time and preferably at the same time of year to
avoid the confounding effect of season (Caughley 1977; Aragones et al. 1997). The surveys of
2003 and 2008 conducted prior to my PhD research were carried out in different seasons to
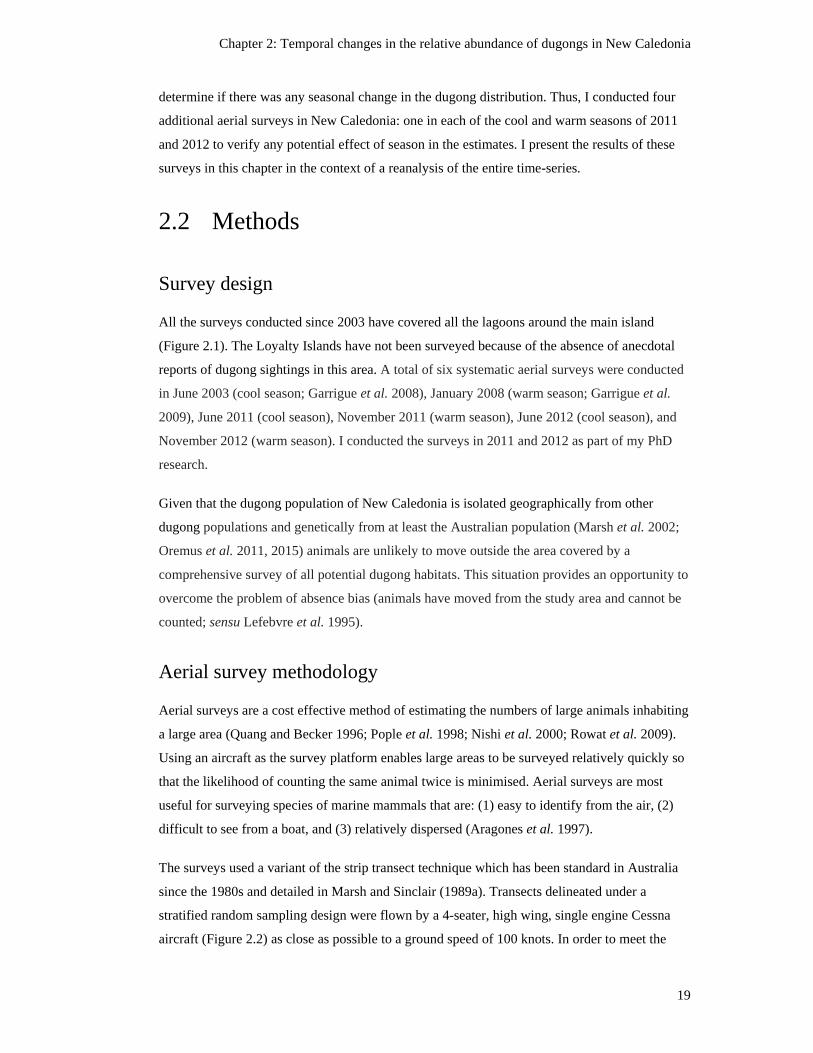
Chapter 2: Temporal changes in the relative abundance of dugongs in New Caledonia
19
determine if there was any seasonal change in the dugong distribution. Thus, I conducted four
additional aerial surveys in New Caledonia: one in each of the cool and warm seasons of 2011
and 2012 to verify any potential effect of season in the estimates. I present the results of these
surveys in this chapter in the context of a reanalysis of the entire time-series.
2.2 Methods
Survey design
All the surveys conducted since 2003 have covered all the lagoons around the main island
(Figure 2.1). The Loyalty Islands have not been surveyed because of the absence of anecdotal
reports of dugong sightings in this area. A total of six systematic aerial surveys were conducted
in June 2003 (cool season; Garrigue et al. 2008), January 2008 (warm season; Garrigue et al.
2009), June 2011 (cool season), November 2011 (warm season), June 2012 (cool season), and
November 2012 (warm season). I conducted the surveys in 2011 and 2012 as part of my PhD
research.
Given that the dugong population of New Caledonia is isolated geographically from other
dugong populations and genetically from at least the Australian population (Marsh et al. 2002;
Oremus et al. 2011, 2015) animals are unlikely to move outside the area covered by a
comprehensive survey of all potential dugong habitats. This situation provides an opportunity to
overcome the problem of absence bias (animals have moved from the study area and cannot be
counted; sensu Lefebvre et al. 1995).
Aerial survey methodology
Aerial surveys are a cost effective method of estimating the numbers of large animals inhabiting
a large area (Quang and Becker 1996; Pople et al. 1998; Nishi et al. 2000; Rowat et al. 2009).
Using an aircraft as the survey platform enables large areas to be surveyed relatively quickly so
that the likelihood of counting the same animal twice is minimised. Aerial surveys are most
useful for surveying species of marine mammals that are: (1) easy to identify from the air, (2)
difficult to see from a boat, and (3) relatively dispersed (Aragones et al. 1997).
The surveys used a variant of the strip transect technique which has been standard in Australia
since the 1980s and detailed in Marsh and Sinclair (1989a). Transects delineated under a
stratified random sampling design were flown by a 4-seater, high wing, single engine Cessna
aircraft (Figure 2.2) as close as possible to a ground speed of 100 knots. In order to meet the
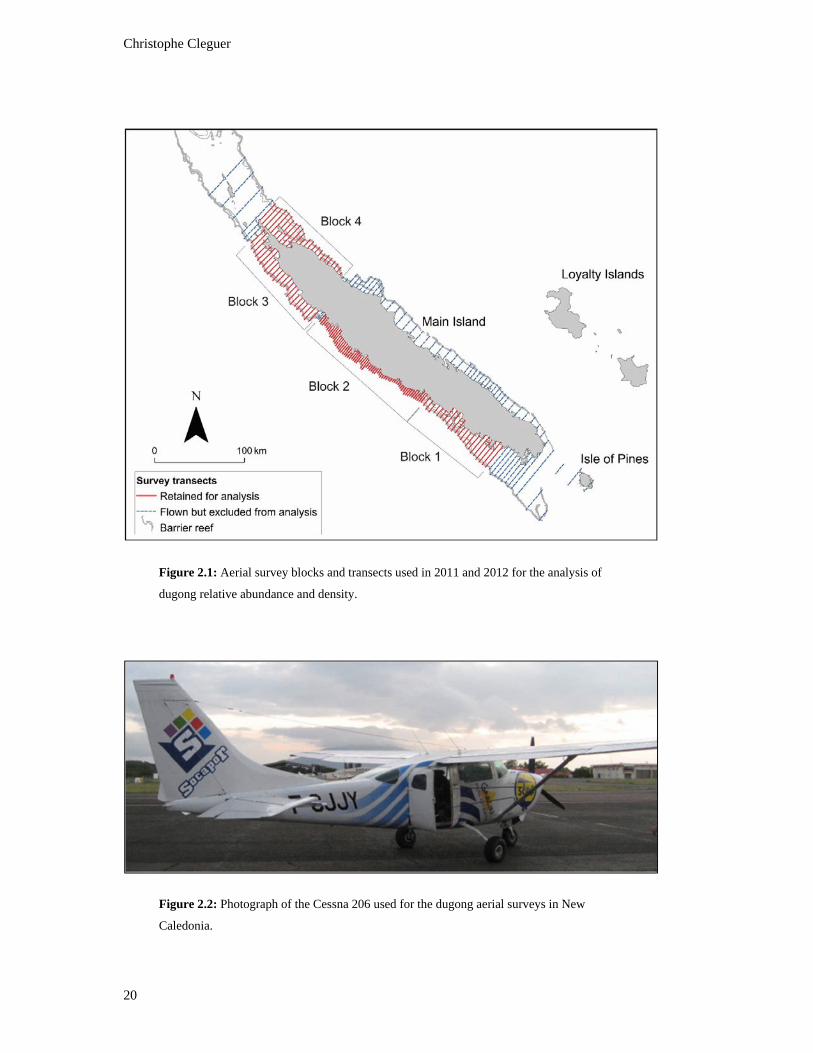
Christophe Cleguer
20
Figure 2.1: Aerial survey blocks and transects used in 2011 and 2012 for the analysis of
dugong relative abundance and density.
Figure 2.2: Photograph of the Cessna 206 used for the dugong aerial surveys in New
Caledonia.
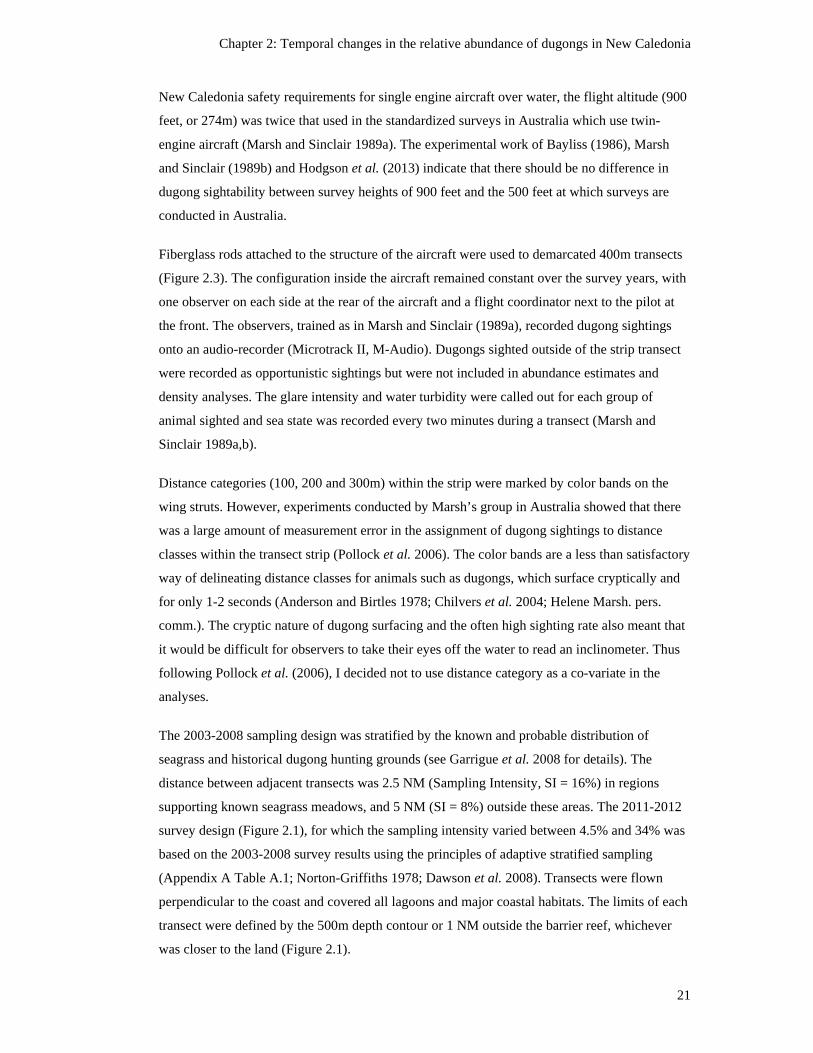
Chapter 2: Temporal changes in the relative abundance of dugongs in New Caledonia
21
New Caledonia safety requirements for single engine aircraft over water, the flight altitude (900
feet, or 274m) was twice that used in the standardized surveys in Australia which use twin-
engine aircraft (Marsh and Sinclair 1989a). The experimental work of Bayliss (1986), Marsh
and Sinclair (1989b) and Hodgson et al. (2013) indicate that there should be no difference in
dugong sightability between survey heights of 900 feet and the 500 feet at which surveys are
conducted in Australia.
Fiberglass rods attached to the structure of the aircraft were used to demarcated 400m transects
(Figure 2.3). The configuration inside the aircraft remained constant over the survey years, with
one observer on each side at the rear of the aircraft and a flight coordinator next to the pilot at
the front. The observers, trained as in Marsh and Sinclair (1989a), recorded dugong sightings
onto an audio-recorder (Microtrack II, M-Audio). Dugongs sighted outside of the strip transect
were recorded as opportunistic sightings but were not included in abundance estimates and
density analyses. The glare intensity and water turbidity were called out for each group of
animal sighted and sea state was recorded every two minutes during a transect (Marsh and
Sinclair 1989a,b).
Distance categories (100, 200 and 300m) within the strip were marked by color bands on the
wing struts. However, experiments conducted by Marsh’s group in Australia showed that there
was a large amount of measurement error in the assignment of dugong sightings to distance
classes within the transect strip (Pollock et al. 2006). The color bands are a less than satisfactory
way of delineating distance classes for animals such as dugongs, which surface cryptically and
for only 1-2 seconds (Anderson and Birtles 1978; Chilvers et al. 2004; Helene Marsh. pers.
comm.). The cryptic nature of dugong surfacing and the often high sighting rate also meant that
it would be difficult for observers to take their eyes off the water to read an inclinometer. Thus
following Pollock et al. (2006), I decided not to use distance category as a co-variate in the
analyses.
The 2003-2008 sampling design was stratified by the known and probable distribution of
seagrass and historical dugong hunting grounds (see Garrigue et al. 2008 for details). The
distance between adjacent transects was 2.5 NM (Sampling Intensity, SI = 16%) in regions
supporting known seagrass meadows, and 5 NM (SI = 8%) outside these areas. The 2011-2012
survey design (Figure 2.1), for which the sampling intensity varied between 4.5% and 34% was
based on the 2003-2008 survey results using the principles of adaptive stratified sampling
(Appendix A Table A.1; Norton-Griffiths 1978; Dawson et al. 2008). Transects were flown
perpendicular to the coast and covered all lagoons and major coastal habitats. The limits of each
transect were defined by the 500m depth contour or 1 NM outside the barrier reef, whichever
was closer to the land (Figure 2.1).
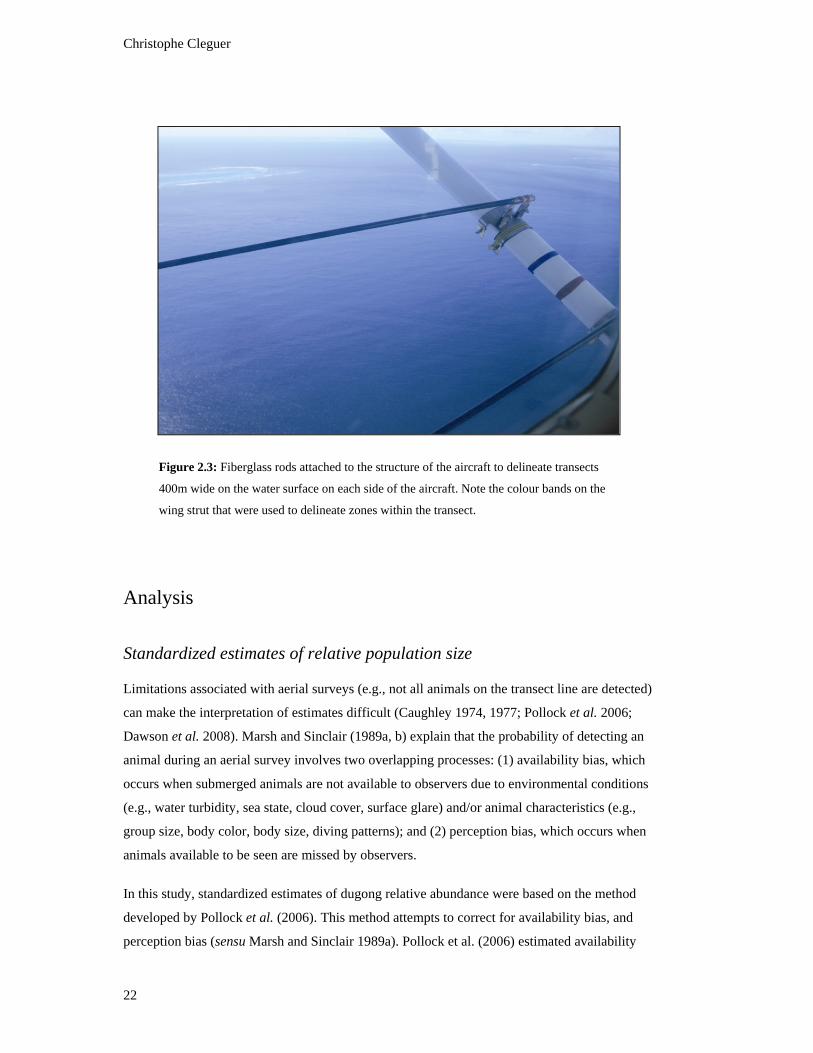
Christophe Cleguer
22
Figure 2.3: Fiberglass rods attached to the structure of the aircraft to delineate transects
400m wide on the water surface on each side of the aircraft. Note the colour bands on the
wing strut that were used to delineate zones within the transect.
Analysis
Standardized estimates of relative population size
Limitations associated with aerial surveys (e.g., not all animals on the transect line are detected)
can make the interpretation of estimates difficult (Caughley 1974, 1977; Pollock et al. 2006;
Dawson et al. 2008). Marsh and Sinclair (1989a, b) explain that the probability of detecting an
animal during an aerial survey involves two overlapping processes: (1) availability bias, which
occurs when submerged animals are not available to observers due to environmental conditions
(e.g., water turbidity, sea state, cloud cover, surface glare) and/or animal characteristics (e.g.,
group size, body color, body size, diving patterns); and (2) perception bias, which occurs when
animals available to be seen are missed by observers.
In this study, standardized estimates of dugong relative abundance were based on the method
developed by Pollock et al. (2006). This method attempts to correct for availability bias, and
perception bias (sensu Marsh and Sinclair 1989a). Pollock et al. (2006) estimated availability
Chapter 2: Temporal changes in the relative abundance of dugongs in New Caledonia
23
bias using two sets of information: (1) information on turbidity and sea state specific to sighting
events to account for the varying depth of the detection zone; and (2) estimates of the average
time dugongs spend in detection zones of various depths. The estimated probabilities of
dugongs being in the detection zones used in my analysis and which allowed to estimate
availability of dugongs under specific conditions are detailed in Appendix A Table A.2.
Survey-specific correction factors for perception bias, as described by Marsh and Sinclair
(1989a), could not be estimated because the aircraft could accommodate only two observers
rather than the four required to estimate perception bias. Hence, I used a single observer
correction for perception bias (0.72, ± SE = 0.0159) derived from Marsh and Sinclair (1989a).
Dugong abundance was estimated separately for each of the blocks surveyed. Population
estimates were not calculated for blocks in which fewer than five dugong groups were sighted.
When a herd of dugongs (i.e., groups of ≥ 10 dugongs) was encountered, the aircraft switched
from passing mode to circling mode in order to count all animals in the herd. Thus, all the
animals were assumed to be counted and availability corrections were not required. Any dugong
herd was first excluded from the calculations and later added to the estimates of population size
and density as outlined in Norton-Griffiths (1978).
Temporal changes in dugong relative density
Dugong relative density was calculated by dividing the corrected counts of dugongs obtained
using the Pollock et al. (2006) methodology by the area of the relevant transect (in km2). As
there were transects on which no dugongs were sighted (Appendix A Table A.3), zero-inflation
was examined using bar-plots. Zero inflation means that there is far more zeros in a dataset than
what would be expected for a Poisson or Negative Binomial distribution. Not accounting for
zero inflation can result in the estimated parameters and standard errors to be biased, and the
excessive number of zeros to cause over dispersion (Zuur et al. 2009). Over dispersion was
assessed based on dispersion statistics generated by generalized linear models assuming the data
were distributed according to: (a) Poisson and (b) Negative Binomial distributions. Only the
dispersion statistics of the Negative Binomial model were within acceptable levels (Zuur et al.
2012). As the statistical analysis required at least one observation in each row of each year and
block combination further examination was conducted only on blocks 1, 2, 3 and 4. To assess
the random effect of transect, only transects that were flown in all six surveys were included in
the subsequent analyses.
Based on this exploratory analysis, a zero-inflated model with a Negative Binomial distribution
was used. To explore temporal and spatial variations in dugong density (based on corrected
Christophe Cleguer
24
number of dugongs per transect area), season, year and block were used as categorical
explanatory variables. Models were generated using the pscl R package (Zeileis et al. 2007).
Two main components were generated from the models: (1) a count component including
surface area (km2) as an offset, for transects on which at least one dugong was sighted during
the time series of surveys; and (2) a zero-inflation component providing an estimate of the
number of transects on which no dugong was sighted on transect. The models with and without
season as a categorical explanatory variable were not significantly different, indicating the
absence of seasonal effect. Thus, the two surveys within each of 2011 and 2012 could be
combined to further assess the temporal changes in dugong relative densities across years.

Chapter 2: Temporal changes in the relative abundance of dugongs in New Caledonia
25
Proportion of calves
Logistic regression was used to examine if the proportions of calves differed over the time
series of surveys and between blocks. The total number of dugongs sighted was used as weight
in the model because this varied among years and blocks. Post-hoc general linear hypotheses
and multiple comparisons were conducted to investigate the differences between blocks (R
package ‘glht-multcomp’; Hothorn et al. 2008).
Temporal changes in the distribution of dugongs across bathymetric ranges
A log-linear model was used to examine whether or not the frequency distribution of the counts
of dugongs corrected for availability and perception biases (response variable) was impacted by
water depth categories and/or surveys (independent categorical variables). Water depth was
identified using the bathymetric model generated by Lefevre et al. (Institut de Recherche pour le
Développement; unpublished). Each dugong sighting was classified into a 5m bathymetric bin
as follow: < 5m, 5-10m, 10-15m, 15-20m and >20m. The coverages of the depth categories
surveyed differed within the survey area. For example, waters in the depth class 15-20m were
relatively uncommon (841km2), compared with shallow waters of less than 5m (2,068km2). To
account for these differences, the surface area of each depth category was offset in the log-linear
model.
2.3 Results
Environmental conditions
Flights were conducted in the best possible weather conditions (i.e., calm sea with low wind
< 19km/h and low cloud coverage) and at times of days that minimised glare (mid-morning
and/or mid-afternoon). Time on the ground during the surveys varied between 19 and 58 days as
a result of rough weather (e.g., high winds, mostly easterly trade-winds; Table 2.1), cloud cover
and rainfall, and logistical issues (e.g., aircraft maintenance). In 2003, the aerial survey was
interrupted for a period of 13 consecutive days (5-17 June 2003) because of strong northerly
winds generated by an unusual out-of-season category 3 tropical cyclone (Météo-France 2014).
Nonetheless, the mean and maximum daily wind speeds recorded during this interruption did
not differ from other survey years (Table 2.1). Results for transects flown within block 1 both
before and after the interruption were included in the population estimates for all survey years.
In 2008, a total of 58 days was spent on the ground because of strong easterly trade-winds and
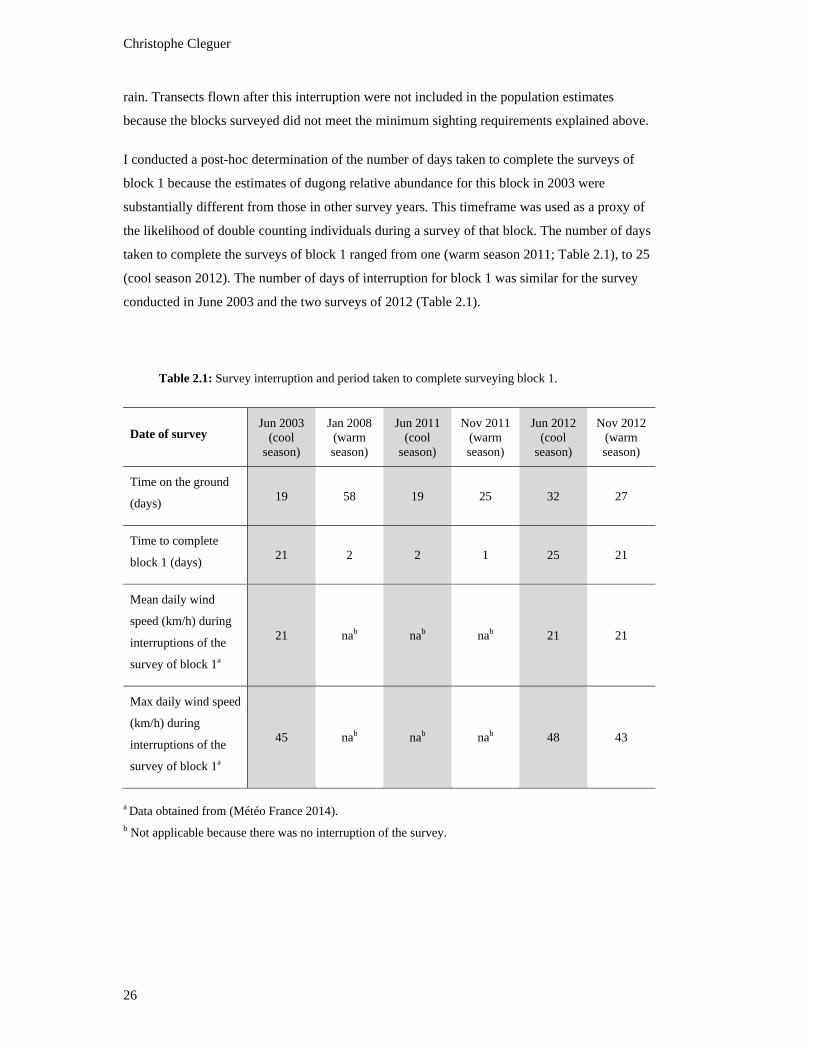
Christophe Cleguer
26
rain. Transects flown after this interruption were not included in the population estimates
because the blocks surveyed did not meet the minimum sighting requirements explained above.
I conducted a post-hoc determination of the number of days taken to complete the surveys of
block 1 because the estimates of dugong relative abundance for this block in 2003 were
substantially different from those in other survey years. This timeframe was used as a proxy of
the likelihood of double counting individuals during a survey of that block. The number of days
taken to complete the surveys of block 1 ranged from one (warm season 2011; Table 2.1), to 25
(cool season 2012). The number of days of interruption for block 1 was similar for the survey
conducted in June 2003 and the two surveys of 2012 (Table 2.1).
Table 2.1: Survey interruption and period taken to complete surveying block 1.
Date of survey Jun 2003
(cool season)
Jan 2008 (warm season)
Jun 2011 (cool
season)
Nov 2011 (warm season)
Jun 2012 (cool
season)
Nov 2012 (warm season)
Time on the ground
(days) 19 58 19 25 32 27
Time to complete
block 1 (days) 21 2 2 1 25 21
Mean daily wind
speed (km/h) during
interruptions of the
survey of block 1a
21 nab nab nab 21 21
Max daily wind speed
(km/h) during
interruptions of the
survey of block 1a
45 nab nab nab 48 43
a Data obtained from (Météo France 2014). b Not applicable because there was no interruption of the survey.
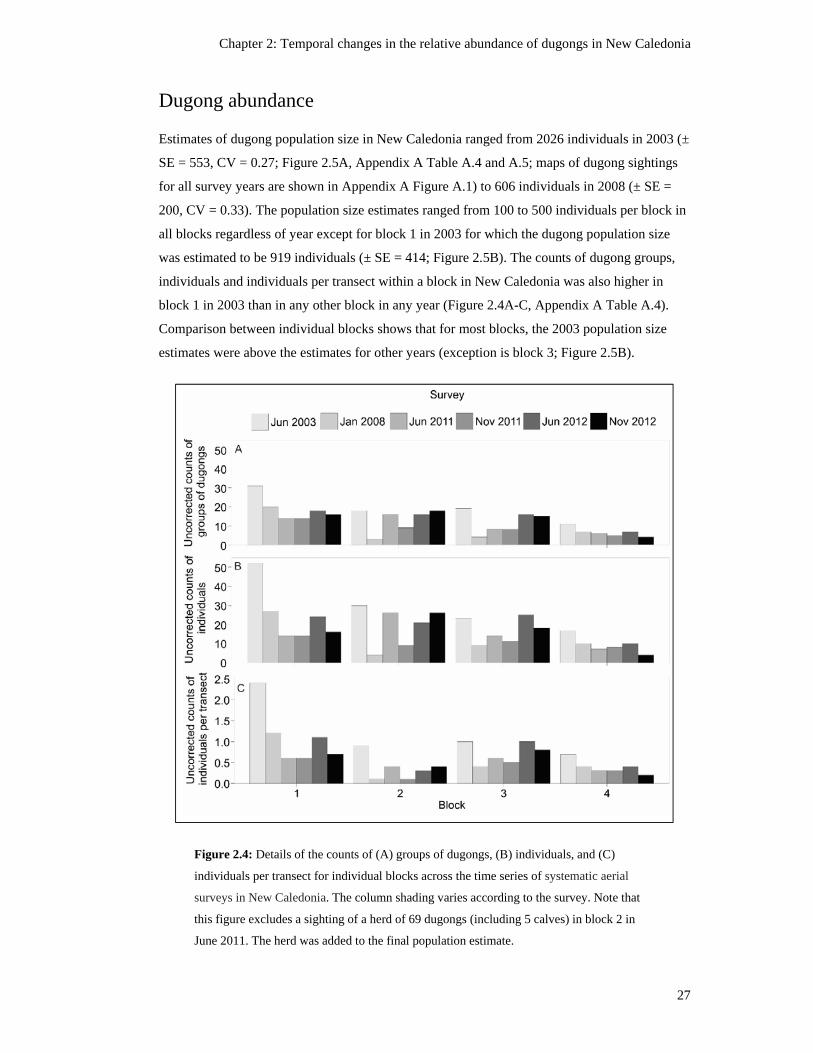
Chapter 2: Temporal changes in the relative abundance of dugongs in New Caledonia
27
Dugong abundance
Estimates of dugong population size in New Caledonia ranged from 2026 individuals in 2003 (±
SE = 553, CV = 0.27; Figure 2.5A, Appendix A Table A.4 and A.5; maps of dugong sightings
for all survey years are shown in Appendix A Figure A.1) to 606 individuals in 2008 (± SE =
200, CV = 0.33). The population size estimates ranged from 100 to 500 individuals per block in
all blocks regardless of year except for block 1 in 2003 for which the dugong population size
was estimated to be 919 individuals (± SE = 414; Figure 2.5B). The counts of dugong groups,
individuals and individuals per transect within a block in New Caledonia was also higher in
block 1 in 2003 than in any other block in any year (Figure 2.4A-C, Appendix A Table A.4).
Comparison between individual blocks shows that for most blocks, the 2003 population size
estimates were above the estimates for other years (exception is block 3; Figure 2.5B).
Figure 2.4: Details of the counts of (A) groups of dugongs, (B) individuals, and (C)
individuals per transect for individual blocks across the time series of systematic aerial
surveys in New Caledonia. The column shading varies according to the survey. Note that
this figure excludes a sighting of a herd of 69 dugongs (including 5 calves) in block 2 in
June 2011. The herd was added to the final population estimate.
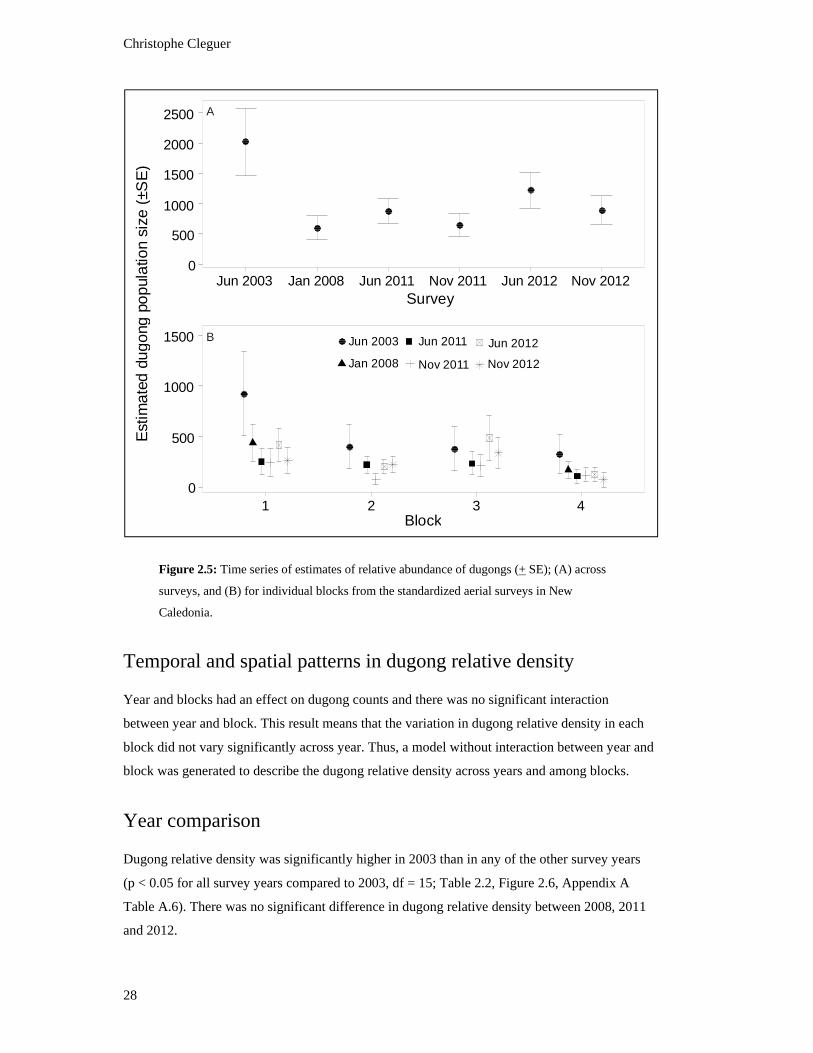
Christophe Cleguer
28
Figure 2.5: Time series of estimates of relative abundance of dugongs (+ SE); (A) across
surveys, and (B) for individual blocks from the standardized aerial surveys in New
Caledonia.
Temporal and spatial patterns in dugong relative density
Year and blocks had an effect on dugong counts and there was no significant interaction
between year and block. This result means that the variation in dugong relative density in each
block did not vary significantly across year. Thus, a model without interaction between year and
block was generated to describe the dugong relative density across years and among blocks.
Year comparison
Dugong relative density was significantly higher in 2003 than in any of the other survey years
(p < 0.05 for all survey years compared to 2003, df = 15; Table 2.2, Figure 2.6, Appendix A
Table A.6). There was no significant difference in dugong relative density between 2008, 2011
and 2012.
Est
imat
ed d
ugon
g po
pula
tion
size
(±S
E)
0
500
1000
1500
2000
2500
Jun 2003 Jan 2008 Jun 2011 Nov 2011 Jun 2012 Nov 2012Survey
0
500
1000
1500
1 2 3 4Block
Jun 2003
Jan 2008
Jun 2011
Nov 2011
Jun 2012
Nov 2012
A
B

Chapter 2: Temporal changes in the relative abundance of dugongs in New Caledonia
29
Table 2.2: Pair-wise comparisons of dugong relative density across survey years in New Caledonia.
Year
Count componenta
2003 2008 2011 2012
2003 ↓*b, c ↓** ↓*
2008 ↑*
2011 ↑**
2012 ↑*
a Estimated from corrected counts with area of transect as an offset. b Example to aid interpretation: 2008 had significantly lower dugong counts than 2003 c Significance codes: < 0.001 = ***; 0.001 to < 0.01 = **; 0.01 to < 0.05 = *
Figure 2.6: Log e dugong relative density (per km2) based on dugongs observed in the
aerial surveys in New Caledonia between 2003 and 2012. Error bars represent 95% credible
intervals and lines in the boxes represent the mean. Circles represent estimated values of
dugong relative density for each survey transect included in the analysis.
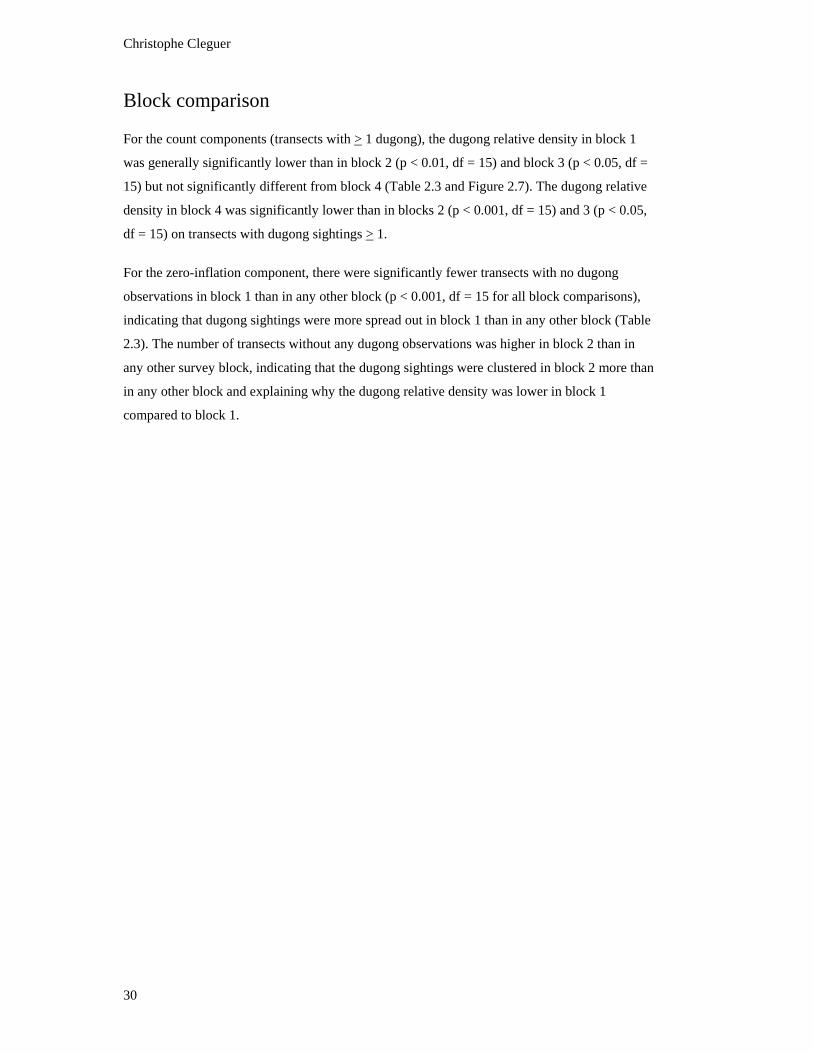
Christophe Cleguer
30
Block comparison
For the count components (transects with > 1 dugong), the dugong relative density in block 1
was generally significantly lower than in block 2 (p < 0.01, df = 15) and block 3 (p < 0.05, df =
15) but not significantly different from block 4 (Table 2.3 and Figure 2.7). The dugong relative
density in block 4 was significantly lower than in blocks 2 (p < 0.001, df = 15) and 3 (p < 0.05,
df = 15) on transects with dugong sightings > 1.
For the zero-inflation component, there were significantly fewer transects with no dugong
observations in block 1 than in any other block (p < 0.001, df = 15 for all block comparisons),
indicating that dugong sightings were more spread out in block 1 than in any other block (Table
2.3). The number of transects without any dugong observations was higher in block 2 than in
any other survey block, indicating that the dugong sightings were clustered in block 2 more than
in any other block and explaining why the dugong relative density was lower in block 1
compared to block 1.
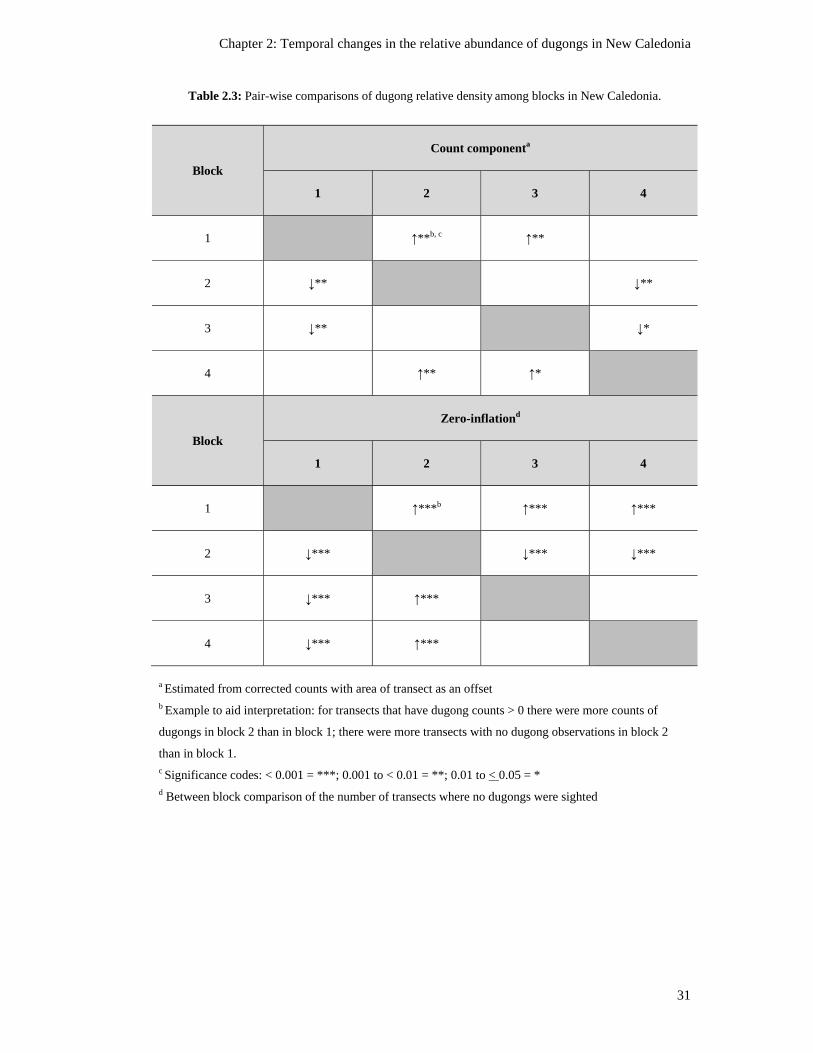
Chapter 2: Temporal changes in the relative abundance of dugongs in New Caledonia
31
Table 2.3: Pair-wise comparisons of dugong relative density among blocks in New Caledonia.
Block
Count componenta
1 2 3 4
1 ↑**b, c ↑**
2 ↓** ↓**
3 ↓** ↓*
4 ↑** ↑*
Block
Zero-inflationd
1 2 3 4
1 ↑***b ↑*** ↑***
2 ↓*** ↓*** ↓***
3 ↓*** ↑***
4 ↓*** ↑***
a Estimated from corrected counts with area of transect as an offset b Example to aid interpretation: for transects that have dugong counts > 0 there were more counts of
dugongs in block 2 than in block 1; there were more transects with no dugong observations in block 2
than in block 1. c Significance codes: < 0.001 = ***; 0.001 to < 0.01 = **; 0.01 to < 0.05 = *
d Between block comparison of the number of transects where no dugongs were sighted
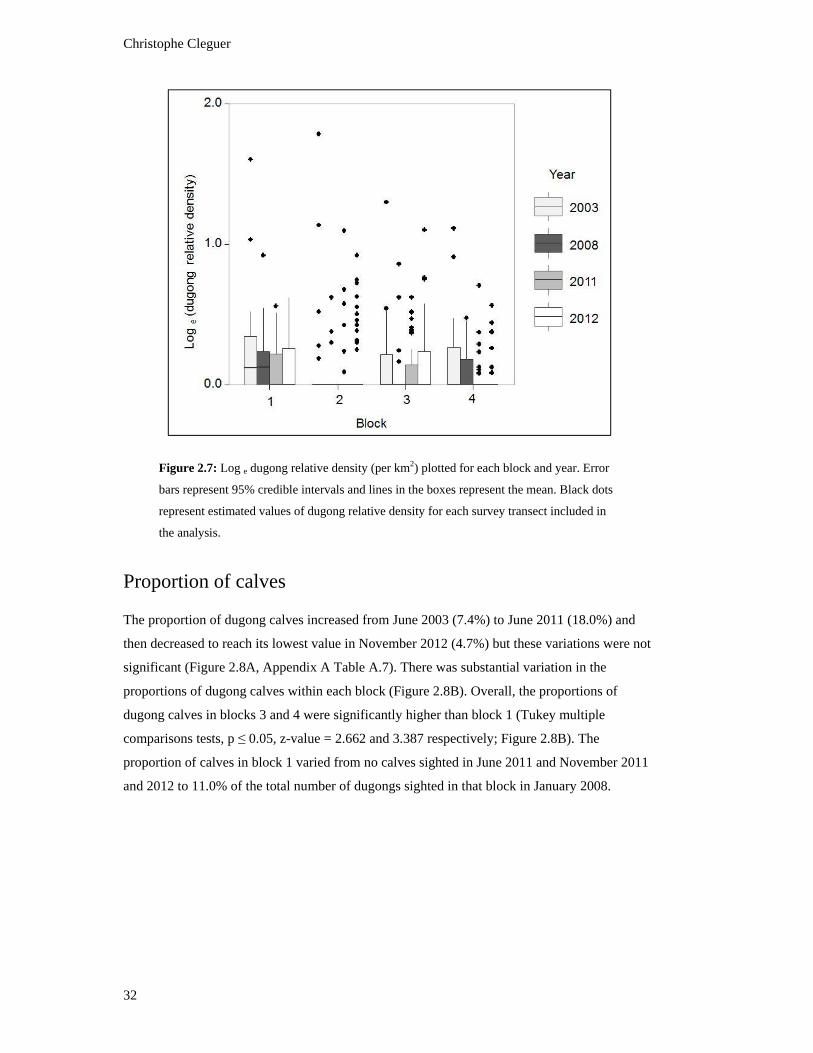
Christophe Cleguer
32
Figure 2.7: Log e dugong relative density (per km2) plotted for each block and year. Error
bars represent 95% credible intervals and lines in the boxes represent the mean. Black dots
represent estimated values of dugong relative density for each survey transect included in
the analysis.
Proportion of calves
The proportion of dugong calves increased from June 2003 (7.4%) to June 2011 (18.0%) and
then decreased to reach its lowest value in November 2012 (4.7%) but these variations were not
significant (Figure 2.8A, Appendix A Table A.7). There was substantial variation in the
proportions of dugong calves within each block (Figure 2.8B). Overall, the proportions of
dugong calves in blocks 3 and 4 were significantly higher than block 1 (Tukey multiple
comparisons tests, p ≤ 0.05, z-value = 2.662 and 3.387 respectively; Figure 2.8B). The
proportion of calves in block 1 varied from no calves sighted in June 2011 and November 2011
and 2012 to 11.0% of the total number of dugongs sighted in that block in January 2008.
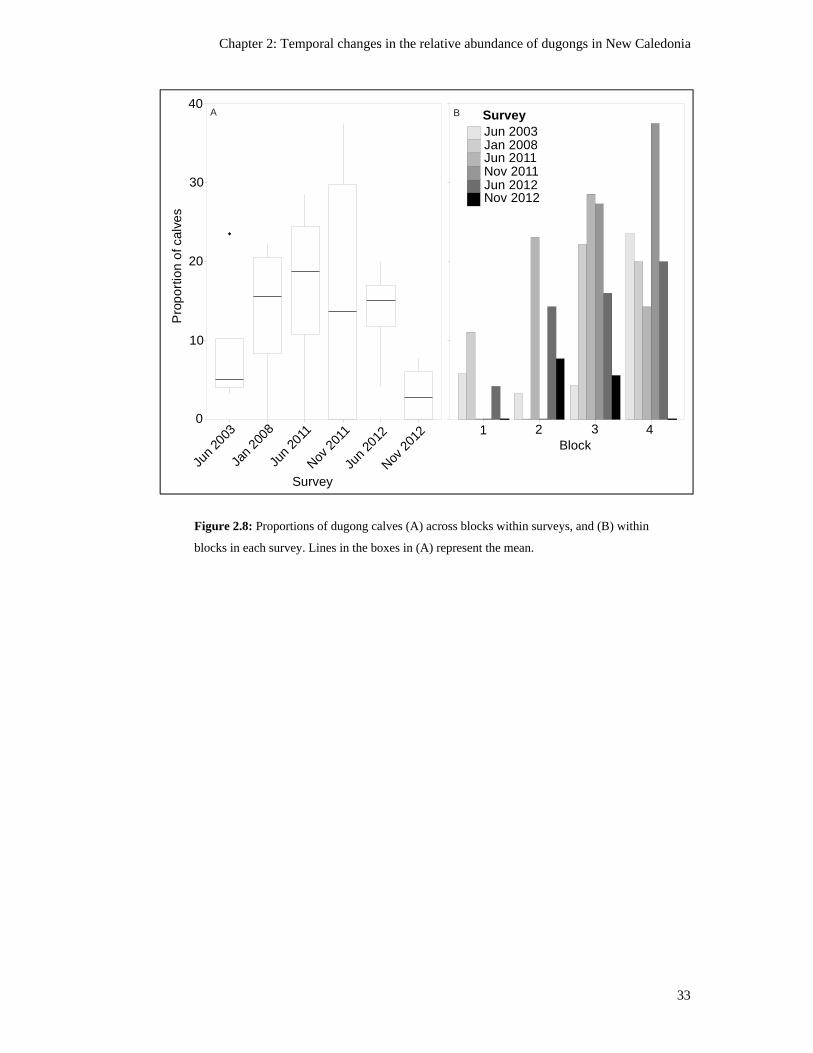
Chapter 2: Temporal changes in the relative abundance of dugongs in New Caledonia
33
Figure 2.8: Proportions of dugong calves (A) across blocks within surveys, and (B) within
blocks in each survey. Lines in the boxes in (A) represent the mean.
0
10
20
30
40
Jun
2003
Jan
2008
Jun
2011
Nov 2
011
Jun
2012
Nov 2
012
Survey
1 2 3 4Block
Pro
po
rtio
n o
f ca
lve
s
SurveyJun 2003Jan 2008Jun 2011Nov 2011Jun 2012Nov 2012
A B
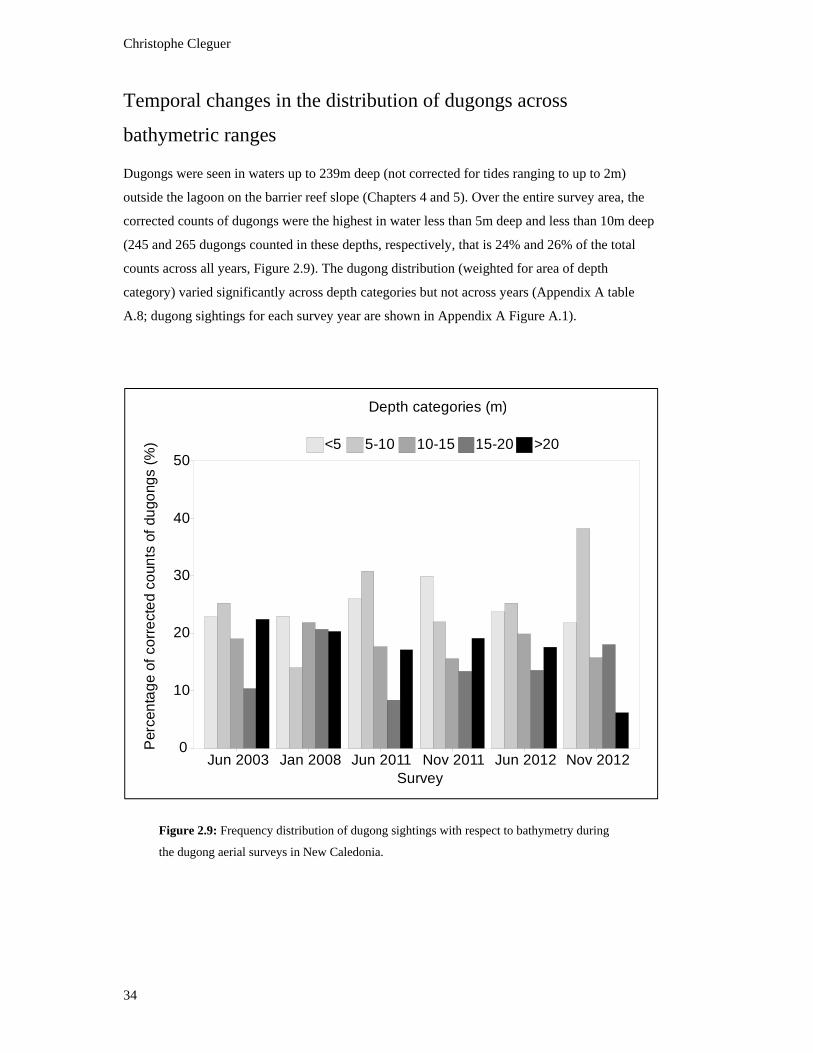
Christophe Cleguer
34
Temporal changes in the distribution of dugongs across
bathymetric ranges
Dugongs were seen in waters up to 239m deep (not corrected for tides ranging to up to 2m)
outside the lagoon on the barrier reef slope (Chapters 4 and 5). Over the entire survey area, the
corrected counts of dugongs were the highest in water less than 5m deep and less than 10m deep
(245 and 265 dugongs counted in these depths, respectively, that is 24% and 26% of the total
counts across all years, Figure 2.9). The dugong distribution (weighted for area of depth
category) varied significantly across depth categories but not across years (Appendix A table
A.8; dugong sightings for each survey year are shown in Appendix A Figure A.1).
Figure 2.9: Frequency distribution of dugong sightings with respect to bathymetry during
the dugong aerial surveys in New Caledonia.
0
10
20
30
40
50
Jun 2003 Jan 2008 Jun 2011 Nov 2011 Jun 2012 Nov 2012Survey
Depth categories (m)
<5 5-10 10-15 15-20 >20
Per
cen
tag
e of
co
rre
cte
d c
oun
ts o
f du
gong
s (%
)
Chapter 2: Temporal changes in the relative abundance of dugongs in New Caledonia
35
2.4 Discussion
There were some significant differences in dugong relative abundance and density between
survey years in New Caledonia. In particular, the estimates from the recent 2011 and 2012
surveys are not significantly different from the results of the 2008 survey (Garrigue et al. 2009)
but are significantly lower than those obtained in 2003 (Garrigue et al. 2008). The lack of a
significant interaction between year and block in dugong relative density suggests that the
dugong relative density in a block did not vary significantly across years (some blocks always
had higher density across years). Thus, mass movement of dugongs across block is unlikely to
have occurred during the time series of surveys but movements of dugongs could have still
occurred within blocks.
I hypothesize that discrepancies between the 2003 dugong relative abundance estimates and
estimate from other survey years could be a result of: (1) actual reduction in the size of the
dugong population between 2003 and the other years; (2) temporary migration within the survey
area; or (3) unaccounted biases associated with detection probability. The evidence for each of
these hypotheses is explored below.
Reduction in the size of the dugong population between 2003 and
the other years
To accept this hypothesis, it is necessary to assume that the New Caledonia dugong population
is closed. This assumption is likely to be valid because the geographic and genetic evidence
indicates that this population is isolated (Oremus et al. 2011, 2015) and our aerial surveys
covered all potential dugong habitats in the region. However, if this hypothesis were true a 45%
decrease in the dugong population size would have occurred between 2003 and 2008 (based on
lower bound of Standard Error of the 2003 estimates and upper bound of Standard Error of
estimates of 2008), presumably from unsustainable anthropogenic or natural mortalities or a
combination of both factors.
Anthropogenic hazards
Urban areas, ports and mining industries are rapidly expanding in New Caledonia especially on
the west coast where most dugongs have been sighted (David et al. 2010; Cleguer et al. 2015;
Chapter 3). The development of ports and shipping channels for the mega coastal mines have
been reported to wipe out hectares of seagrass in several regions of New Caledonia but
comprehensive quantification of the loss of seagrass meadows in the region is not available
Christophe Cleguer
36
(Hily et al. 2010). Deaths of dugongs from collisions with boats occurs in several urbanized
regions of Australia (Eros et al. 2007; Hodgson and Marsh 2007) and have been reported on the
west coast of New Caledonia in urban areas such as Nouméa (Province Sud), Voh and Koné
(Province Nord; ESCAL and A2EP 2011) and confirmed from post mortem examination of
stranded carcasses (Claire Garrigue pers.comm.). The growth of the tourism industry and
associated boating activities along the west coast is likely to aggravate this risk.
Dugongs have been harvested for food by Melanesian people for centuries (Garrigue et al.
2008; Marsh et al. 2012). As explained in chapter 1, this practice is now restricted in New
Caledonia by strict legislation rules which prohibit hunting in the Province Sud and require
special permits in the Province Nord and Province des Iles Loyauté (Resolution 68 dated 25
June 1963; Province Nord 2008, Province Sud 2009). Nonetheless, people continue to hunt
dugongs illegally in New Caledonia (Louis-Harris 2005; TNS 2005) and poaching activities are
reported from time to time around the mainland. The number of dugongs killed from illegal
harvesting is unknown (Cleguer 2010; Resource managers of the Province Sud and Province
Nord, pers. comm.).
The number of dugong carcasses salvaged in New Caledonia is low but increased slightly from
one individual per year in 1999, 2000 and 2002 (n = 3) to 2.3 carcasses per year between 2003
and 2008 (n = 14; Garrigue et al. 2009), and three carcasses per year between 2009 and 2012 (n
= 12). The known causes of dugongs’ death (40% of the total number of carcasses) varied
between collisions with boats (13%) and illegal take (27%; Claire Garrigue pers. comm.).
Salvaged carcasses are underestimates of actual mortality because an unknown proportion of
carcasses is not recovered.
I estimated the sustainable level of human-related mortalities for dugongs using the Potential
Biological Removal method (PBR). This method estimates the maximum number of dugongs,
not including natural mortalities, which can be removed from the population (Wade 1998).
The following is the formula to calculate the PBR:
PBR = Nmin x 0.5 Rmax x RF
where
Nmin = the 20th percentile of a log-normal distribution based on an absolute
estimate of the number of animals N in the population.
Chapter 2: Temporal changes in the relative abundance of dugongs in New Caledonia
37
Rmax = the maximum rate of increase, for which Marsh et al. (2004) use a range of
estimates of 0.01-0.05 due to uncertainty of estimates of age of first reproduction,
fecundity and natural mortality levels
RF = a recovery factor of between 0.1 and 1, which if < 1, allows population
growth and uncertainties in estimates of Nmin or Rmax.
Using the data from the aerial surveys conducted in New Caledonia (Minimum population
estimate (Nmin) ranging from 462 to 1,617), a maximum rate of increase (Rmax) of 0.03; and a
recovery factor (RF) of 0.5, I found that the Potential Biological Removal values ranged
between three and 12 dugongs per year (results for Recovery Factors 0.1, 0.5, and 1.0 are
presented in Appendix A Table A.9).
Given the underestimated number of dugong carcasses, it is possible that the anthropogenic
mortality of dugongs since 2003 in New Caledonia is unsustainable and could lead to a slow
decrease of the population. However, there is no evidence of the level of anthropogenic
mortality required to explain the difference between the results of the 2003 survey and the later
surveys, especially as most of this mortality would have had to have occurred between 2003 and
2008.
Natural hazards
Temporal changes in the distribution of the dugong seagrass food is a common case of unusual
levels of natural mortality in dugongs (Sobtzick et al. 2012). Marsh et al. (2012) summarize the
evidence that the life history and reproductive rate of female dugongs are adversely affected by
seagrass loss which causes dugongs to breed later and less often. Meager and Limpus (2014)
demonstrated that sustained periods of elevated freshwater discharge, which is associated with
seagrass loss, have an adverse impact on dugong survival. Habitat degradation due to extreme
weather events such as cyclones is another potential driver of resource degradation that can
substantially adversely affect dugongs. For example, in February 2011 following several years
of severe storms and heavy rain, severe tropical cyclone Yasi resulted in a significant decrease
of food availability for dugongs on the east coast of Australia and hence a dramatic increase in
the number of carcasses salvaged (GBRMPA 2011). No exceptional weather events could
explain a sudden widespread degradation in the dugong’s seagrass food between 2003 and 2008
and there is no evidence of such loss of seagrass in New Caledonia (Météo-France 2014).

Christophe Cleguer
38
Calf counts
If the dugong population of New Caledonia had been subjected to widespread habitat loss, a
reduction in fecundity and increase in neonatal mortality evidenced by low calf counts might be
expected (Marsh et al. 2012) as observed in Australia following extreme weather events such as
floods and cyclones (Preen and Marsh 1995; Marsh et al. 2012; Sobtzick et al. 2012). Such
changes are not indicated here because: (1) I did not find any evidence of major seagrass habitat
loss; and, (2) the percentages of calves recorded during the aerial surveys increased between
2003 and 2008. However, if there had been a reduction in the dugong population that was
independent of habitat loss, fecundity could have increased as a density dependent response
(Marsh and Kwan 2008).
Temporary migration of dugongs
Dugongs are highly mobile (Chapter 4) and fluctuations in dugong population estimates
observed in repeated surveys of the same area in both Australia and the Arabian region, where
the dugong’s ranges are extensive, have been largely attributed to temporary migrations within
the survey area (Hagihara et al. 2014) and between the survey area and adjacent regions (Gales
et al. 2004; Marsh et al. 2004; Preen et al. 2012; Sobtzick et al. 2014). New Caledonia is an
isolated archipelago. The aerial survey sampling design covered all the lagoons of the main
island. Thus I consider that is unlikely that dugongs moved out of the survey area between 2003
and 2008 and remained outside.
The statistical analysis does not support the hypothesis that dugongs moved across survey
blocks between survey years. Nonetheless, dugong movements within survey blocks are likely
(Chapter 4). Home-range estimates for individual dugongs can vary from 0.5 to 733km2
(Sheppard et al. 2006). Large home-ranges are a result of dugongs making large-scale
movements even over relatively short time periods. For example a dugong satellite tagged in
north-eastern Australia travelled 560km in just under 17 days (Sheppard et al. 2006). These
individual movement patterns may lead to double counting of individuals over the course of a
survey especially if a survey is prolonged.
Dugongs also move to sheltered areas in response of strong winds (Nietschmann and
Nietschmann 1981; Nietschmann 1984). For example, in Torres Strait, north of Australia,
dugongs move from large offshore seagrass meadows to leeside reefs and island borders during
the south-east trade-wind season, in response to strong winds and low tides. Similar
observations have been reported by local fishermen in New Caledonia in rough weather
(Nathalie Baillon, pers. comm.). Survey block 1 in the south west of New Caledonia was where

Chapter 2: Temporal changes in the relative abundance of dugongs in New Caledonia
39
the dugong abundance estimates differed most between 2003 and the following years (Figure
2.5B). However the time to complete the surveys of block 1 and the strength of the winds that
caused the survey interruptions appear to be similar in 2003 and 2012. Although dugong
movement and double counting remains a plausible cause of at least part of the variation in
abundance estimates, the evidence is insufficient to accept or reject this hypothesis.
Unaccounted biases associated with detection probability
Unaccounted fluctuations in the availability of dugongs to observers
The analysis conducted here assumes that the proportion of time a dugong spends at the surface
does not vary with location and depth. However, recent studies carried out on dugong diving
and surfacing patterns in soft bottom habitats in Australia show that this assumption is false and
that the dugong’s availability for detection varies with water depth (Hagihara et al. 2014). The
probability of sighting a dugong at the surface from the air is lowest in water between 5m and
25m deep (Hagihara et al. 2014). Thus, changes in dugong abundance estimates in New
Caledonia could be partially explained by the difference in water depth used by dugongs in
2003 compared with other survey years. My analysis of the distribution of dugongs in relation
to bathymetry across survey years does not support this conclusion. Nonetheless, data on
dugong diving behaviour in relation to bathymetry should be obtained in New Caledonia to
estimate dugong numbers more accurately.
Variation in the timing of the New Caledonia surveys with respect to the tidal cycle may
account for at least some of the variation in population estimates because a different proportion
of animals may have been sighted in deep versus shallow waters. Lanyon (unpublished data)
found a 43% decrease in dugong population estimates during a low-tide survey of Moreton Bay
banks compared with a high-tide survey on the same day under otherwise identical conditions.
In Moreton Bay dugongs are prone to use deeper areas at low tide than at high tide because of
the inaccessibility of some of the shallow feeding grounds. This situation is different from that
of the lagoon in the Nouméa regions where most of the difference in the estimate of dugong
numbers between 2003 and subsequent survey years was found. The lagoon in the Nouméa
region is relatively deep for a coastal environment (mean depth = 18m) and most seagrasses
occur in subtidal areas (Garrigue 1995, 1998; Chapter 4). There was no major change in the
distribution of dugongs in this region across survey years. Thus, it is unlikely that tides have
played a significant role in the changes in the estimates of dugong numbers in the Nouméa
region.
Christophe Cleguer
40
Observer error
Observer error is an important variable in any aerial survey (Caughley 1974). Observer error in
surveys of marine megafauna can include: missed observations, misidentification of species,
and individuals sighted outside the transect (Fuentes et al. 2015). The dugong aerial survey
conducted in 2003 in New Caledonia was the first marine megafauna survey in the region. We
cannot dismiss observer error as a cause of part of the temporal variation between surveys
reported here, despite the experience and training of the 2003 crew. Measurement of the
perception bias of observers is missing in these surveys; it would have aided assessment of
differences in observer capacity between surveys.
2.5 Conclusion
The additional standardized aerial surveys I conducted in 2011 and 2012 have not detected a
significant change in dugong relative density compared to 2008 but were significantly lower
than the baseline survey in 2003. Precaution should be taken when interpreting variability in
estimates of relative abundance as there is usually a low power to detect population trends in
marine mammals, particularly those that occur in low abundance (Taylor and Gerrodette 1993).
Detecting trends in marine mammal populations in a time frame useful to conservation and
management is very difficult. Marsh (1995) calculated that it would take at least 10 years of
annual aerial surveys before it could be determined that a regional dugong population,
apparently declining at 5% per year, was in fact declining even if the availability bias and
perception bias were constant. This problem is not unique to aerial surveys, it applies to other
survey techniques such as boat and land-based surveys.
If the reduction of the estimated dugong population size in New Caledonia over the last 10 years
was real, the population would likely qualify as ‘Endangered’ under criterion A2b of the IUCN
Red List (IUCN 2012a, b). However, my study shows that it is impossible to conclude with
certainty why the 2003 estimate of a population size is an outlier from the remainder of a time
series.
My results highlight the need to replicate the baseline monitoring of marine mammal
populations. Replicating baseline surveys would: (1) provide a greater confidence in the
inference made regarding the trends in population estimates, and (2) ensure that these estimates
are not specific to the circumstances that may have prevailed during a single study (Gilbert
1999; Johnson 2002; Brown et al. 2005). This work also highlights concerns about animal
movement during a survey. In boat (Palka and Hammond 2001) or aerial surveys of marine
Chapter 2: Temporal changes in the relative abundance of dugongs in New Caledonia
41
mammals (Marsh and Sinclair 1989a, b) observation platform speeds are generally set
sufficiently high for animal movements between transects within the survey period to be
ignored. However, it is impossible to know how many animals will move during a long
interruption and what distance they will swim, especially when the interruption is caused by
strong winds and high seas. Consequently, if a survey is not completed within a short time
frame it is possible for animals to be double counted or missed. Decision rules should be
developed to decide when a specific region needs to be completely re-surveyed for a target
species. These strategies should improve population estimates and enhance the information
provided to management.
2.6 A critical evaluation of my approach
Population trends are frequently based on temporal comparison of indices of relative abundance
(Gerrodette 1987; Taylor and Gerrodette 1993; Zielinski and Stauffer 1996). However, as
pointed out in this Chapter, relative indices do not always reliably reflect changes in population
abundance because of the uncertainties associated with population estimates (Colyvan et al.
1999). I highlighted that uncertainties including the timing of surveys, observer error,
heterogeneity in the environmental conditions and the behaviour of dugongs may have
influenced the variability in the dugong population size estimates in New Caledonia.
Observer error could not be assessed in the surveys conducted in New Caledonia because at the
time of the surveys there was no aircraft available that could accommodate two rows of
observers, which is necessary to evaluate perception bias (Marsh et al. 1989a, b). Using a larger
aircraft in New Caledonia could enable to use two independent observers on each side of the
aircraft and hence to estimate the observer’s ability to detect animals. This approach would
provide more confidence in the interpretation of the estimates of dugong population size.
The estimates of dugong relative abundance I obtained are likely to be underestimates because
of the underestimation of the availability correction factor. Indeed, the analysis I conducted in
this Chapter assumes that the proportion of time a dugong spends at the surface does not vary
with location and water depth. However, recent studies conducted on dugong diving and
surfacing patterns in soft bottom habitats in Australia show that this assumption is false: the
dugong’s availability for detection varies with water depth (Hagihara et al. 2014). Data on
dugong diving in New Caledonia are required to estimate dugong numbers more accurately in
New Caledonia where the topography is different from the area where Hagihara et al.’s (2014)
data were collected. Dugong dive data were obtained at the end of the dugong satellite tracking
study (see Chapter 4) as 11 out of the 12 tag attachment assemblies were recovered with nine of
Christophe Cleguer
42
them equipped with time depth recorders (TDRs) attached to the peduncle end of the tether. I
have recently facilitated collaboration between the principal investigator of the Hagihara et al.
(2014) study, a local Marine Mammal research NGO (Opération Cétacés) and the resources
managers of New Caledonia, owners of the TDRs, to analyze these data and improve the
precision of the estimates of dugong relative abundance in New Caledonia. This analysis has yet
to be completed.
2.7 Chapter summary
I conducted four additional dugong aerial surveys in New Caledonia in 2011-2012 to
determine the current size of the dugong population and examine its temporal variability, and
I investigated evidences to explain this variability.
I reanalysed the entire time-series and found that the dugong population size and relative
density in 2011-2012 were not significantly different from the 2008 survey but were
significantly lower than the 2003 survey.
I explored reasons to explain the discrepancies between the 2003 dugong relative abundance
estimates and estimate from other survey years. I hypothesized that the results could
originate from: (1) an actual reduction in the size of the dugong population between 2003
and the other years; (2) temporary migration across the survey area; or (3) unaccounted
biases associated with detection probability.
I did not find any evidence that could explain a real decline in the dugong population in New
Caledonia. It is possible that movement of dugongs at least within survey blocks and
unaccounted biases associated with detection probability and human error, have all
influenced my results.
My results highlight the necessity of conducting multiple baseline surveys to enhance
interpretation of changes in wildlife population size estimates.
The dugong population of New Caledonia is small and genetically isolated from the large
dugong stocks from Australia. Monitoring should be continued while minimising
methodology biases as much as possible to aid interpretation of results. Chapters 3, 4, 5 and
6 provide evidence-based opportunities to improve the conservation and management of
dugongs in the region.
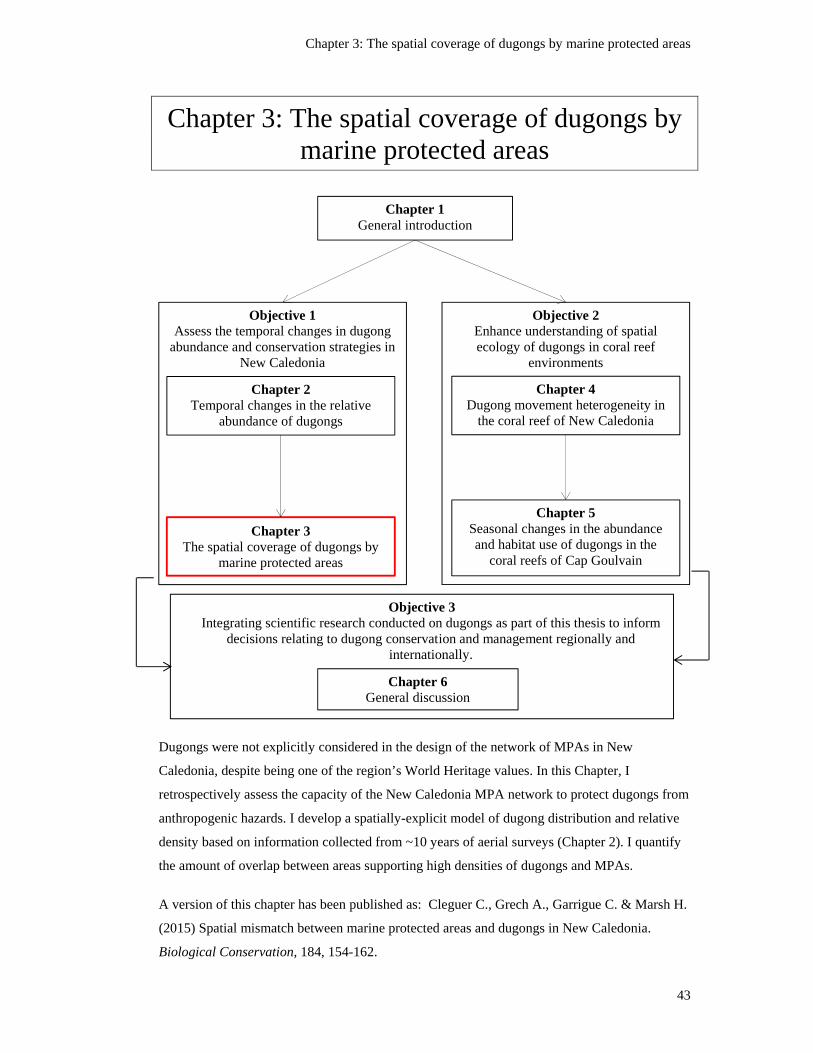
Chapter 3: The spatial coverage of dugongs by marine protected areas
43
Chapter 3: The spatial coverage of dugongs by marine protected areas
Dugongs were not explicitly considered in the design of the network of MPAs in New
Caledonia, despite being one of the region’s World Heritage values. In this Chapter, I
retrospectively assess the capacity of the New Caledonia MPA network to protect dugongs from
anthropogenic hazards. I develop a spatially-explicit model of dugong distribution and relative
density based on information collected from ~10 years of aerial surveys (Chapter 2). I quantify
the amount of overlap between areas supporting high densities of dugongs and MPAs.
A version of this chapter has been published as: Cleguer C., Grech A., Garrigue C. & Marsh H.
(2015) Spatial mismatch between marine protected areas and dugongs in New Caledonia.
Biological Conservation, 184, 154-162.
Objective 2 Enhance understanding of spatial ecology of dugongs in coral reef
environments
Objective 1 Assess the temporal changes in dugong
abundance and conservation strategies in New Caledonia
Chapter 1 General introduction
Chapter 2 Temporal changes in the relative
abundance of dugongs
Chapter 3 The spatial coverage of dugongs by
marine protected areas
Chapter 4 Dugong movement heterogeneity in
the coral reef of New Caledonia
Chapter 5 Seasonal changes in the abundance and habitat use of dugongs in the
coral reefs of Cap Goulvain
Chapter 6 General discussion
Objective 3 Integrating scientific research conducted on dugongs as part of this thesis to inform
decisions relating to dugong conservation and management regionally and internationally.
Christophe Cleguer
44
3.1 Introduction
Marine protected areas (MPAs) are a powerful tool for the conservation and management of
marine resources (Gaines et al. 2010; Agardy et al. 2011; Lockwood et al. 2012). The levels of
protection provided by MPAs range from restrictions on one or more human activities (e.g.,
fishing and tourism; Eagles et al. 2002; Pauly et al. 2002), to the comprehensive protection of
an area from all anthropogenic impacts. Systematically designed MPAs use goals and targets to
ensure the representation and persistence of biodiversity features and ecological processes at
multiple spatial and temporal scales (Margules and Pressey 2000; Lourie and Vincent 2004).
MPAs designed for the preservation of ecosystems are widely advocated over single-species
approaches as the ecosystem approach provides conservation benefits for more species at a
comparable cost (Pomeroy and Douvere 2008). Nonetheless, ecosystem-based MPAs need to
incorporate ecological information and targets to ensure the protection of species and habitats of
conservation concern (Hooker and Gerber 2004; Fernandes et al. 2005; Dobbs et al. 2008).
The MPAs of New Caledonia were designed to mitigate the adverse effects of human activities
on marine biodiversity and the World Heritage listed lagoon ecosystem. An explicit reason for
the 2008 World Heritage inscription of the lagoons was their globally important dugong
population (UNESCO 2009). New Caledonia is critical to the persistence of dugongs at the
eastern edge of its range and globally (Marsh et al. 2012). Protecting the dugong as a
charismatic ‘umbrella’ species is also beneficial to other coastal species that utilise seagrass
habitats, which are threatened by multiple human activities (Jones et al. 1995; Marsh and
Morales-Vela 2012). Explicit targets for dugongs were not included in the design of New
Caledonia’s MPA network, and the ability of the network to protect the species is unknown.
I assessed the capacity of New Caledonia’s network of MPAs to protect important dugong
habitats. I developed a spatially-explicit model of dugong distribution and relative density using
information collected from Chapter 2’s time-series of aerial surveys and geostatistics. The
overlap between the model and the current MPA network was used to assess the representation
of important dugong habitats in various types of protected areas. I identified the potential
drivers of spatial mismatch between dugong habitats and MPAs, and provide guidance on how
these shortcomings can be overcome for dugongs and other marine species of conservation
concern in New Caledonia and other regions.
Chapter 3: The spatial coverage of dugongs by marine protected areas
45
3.2 Study area and species
New Caledonia’s MPAs were originally designed to protect sites of great natural beauty from
local informal fisheries (i.e., any activity that is conducted without a license or outside any
institutional framework) and tourism (Service de l’environnement de la Province Sud, pers.
comm.; David et al. 2010). In the early 2000s, the focus of MPA design changed to the
conservation of connectivity and biodiversity informed by empirical studies on fish and sea bird
breeding areas. Information on dugong relative abundance and distribution derived from a
standardised aerial survey conducted in 2003 (~2026 ± 553 individuals sensu Garrigue et al.
2008 and see Chapter 2) was not used in subsequent MPA design.
Today, there are 33 MPAs in New Caledonia: seven in Province Nord and 26 in Province Sud.
These areas are divided into five types: Integral reserves (IUCN Ia), wilderness reserves (IUCN
Ib), natural reserves (IUCN IV), sustainable management reserves (IUCN VI) and Province
parks (IUCN II; Table 3.1). Each Province is responsible for managing the MPAs within its
administrative boundaries (Table 3.1). Each type of MPA is supported by a different set of
regulations with different levels of restrictions, ranging from highly restricted-no access areas to
areas with very few limitations on human activities (Table 3.1). The extent to which the
regulations benefit dugongs and their seagrass habitats varies among each type of MPA (Table
3.1). In addition to MPAs, six marine zones (henceforth UNESCO zones), representing major
patterns in the diversity of coral reefs and associated ecosystems, are registered as a World
Heritage Area (UNESCO 2009; Figure 3.1). There are two UNESCO zones in Province Nord,
two in Province Sud, one in Province des Iles Loyauté and one at the Entrecasteaux reefs. Each
UNESCO zone is managed by local management committees and the relevant Province
management authority.
Direct hazards to dugongs in New Caledonia include by-catch in gill-nets, illegal harvest, and
collision with boats (Louis-Harris 2005; TNS 2005; Bordin 2009; Cleguer 2010; ESCAL and
A2EP 2011; Pilcher et al. 2014). Urban development, mining and aquaculture are also likely to
disturb the dugong’s lagoon seagrass habitats (David et al. 2010; Hily et al. 2010). With the
exception of by-catch in gill-nets and poaching, the anthropogenic hazards to dugongs and their
seagrass habitats occur primarily on the west coast of New Caledonia, especially around the
capital-city of Nouméa and in the Voh- Koné-Pouembout region (Bordin 2009).
Christophe Cleguer
46
3.3 Methods
I used information derived from the 10-year time series of aerial surveys described in Chapter 2
to develop a spatially-explicit model of dugong distribution and relative density in New
Caledonia. I followed the methods of Grech and Marsh (2007) and Grech et al. (2011) to: (1)
correct data from the aerial survey for sampling intensity variations between blocks and across
surveys; and then (2) model dugong distribution and relative density using geostatistics. The
spatial autocorrelation in the corrected aerial survey data was assessed using a variogram
analysis in ArcGIS® 10.0 (ESRI 2011). The corrected aerial survey data were interpolated to
the spatial extent of the aerial survey region (24,359km2; Chapter 2 Figure 2.1) using universal
kriging. Dugong distribution and relative density were calculated at a grid size of 1.6km x
1.6km (2.56km2 cells). This scale accounts for: (a) the width of the transects; (b) slight changes
in altitude of the aircraft which affect transect width at the surface; and (c) the area unavailable
for observation under the aircraft. Each grid cell in the final model was regarded as a dugong
density unit with a relative value of dugongs/km2. I grouped the dugong relative density
estimates based on their frequency distribution following the method of Grech and Marsh
(2007) and Grech et al. (2011). I binned the values into four arbitrary categories: low density (0
dugongs/km2); medium density (0-0.10 dugongs/km2); high density (0.10-0.5 dugongs/km2);
and very high density (> 0.5 dugongs/km2). Density units with 0 dugongs/km2 were included in
my analysis to ensure that the spatial layers extended across the entire survey region and to
account for undetected dugongs that may have been present or moved between units (Chapter
4). The spatially-explicit model was tested by comparing the values of dugong relative density
generated by the model to observed values using a cross validation analysis. Moran’s I Spatial
Autocorrelation statistics were used to assess clustering of dugong density units.
I developed a composite layer of all MPAs in New Caledonia from layers provided by resource
managers from Province Sud and Province Nord. The UNESCO zones in Province des Iles
Loyauté were removed from my analysis because dugong aerial surveys were not conducted in
this Province. I overlaid the dugong distribution and relative density model with the composite
MPA layer in ArcGIS® 10.0 to calculate the proportion of dugong density units within each
MPA type (Table 3.1).
Chapter 3: The spatial coverage of dugongs by marine protected areas
47
3.4 Results
The spatially-explicit model of dugong distribution and relative density showed a heterogeneous
and clustered distribution of dugongs in the lagoons surrounding New Caledonia (Moran’s I, z-
score = 15.99, p ≤ 0.0001; Figure 3.1). The average dugong relative density across the entire
survey region was 0.01 dugongs/km2, and ranged from 0 to 1.49 dugongs/km2. The predicted
dugong relative density and the aerial survey data were highly correlated (cross validation
analysis RMSS = 0.98). Units of very high dugong relative density were located in the Cap
Goulvain region on the west coast between Province Sud and Province Nord (Figure 3.1 and
3.2). Units with high dugong density were located: (a) at several locations on the west coast:
near Koumac, north of Voh, near and south of Nekoro, in the Moindou region and between the
Nouméa and the Paita region; and (b) on the north-east coast between Pouebo and Touho
(Figure 3.1 and 3.2).
Units of high to very high dugong relative density were poorly represented by the MPAs that
provide high levels of restriction on anthropogenic activities. Units supporting a very high
dugong density were not covered by any of the integral reserves (IUCN Ia), wilderness reserves
(IUCN Ib), natural reserves (IUCN IV) and sustainable management reserves (IUCN VI).
Instead, units of very high dugong density were located in the UNESCO zones (22%) and
Province parks (90%, Figure 3.2). Most of the units of high dugong density were in non-MPA
areas (74%) or covered by Province parks (12%) and UNESCO zones (17%).
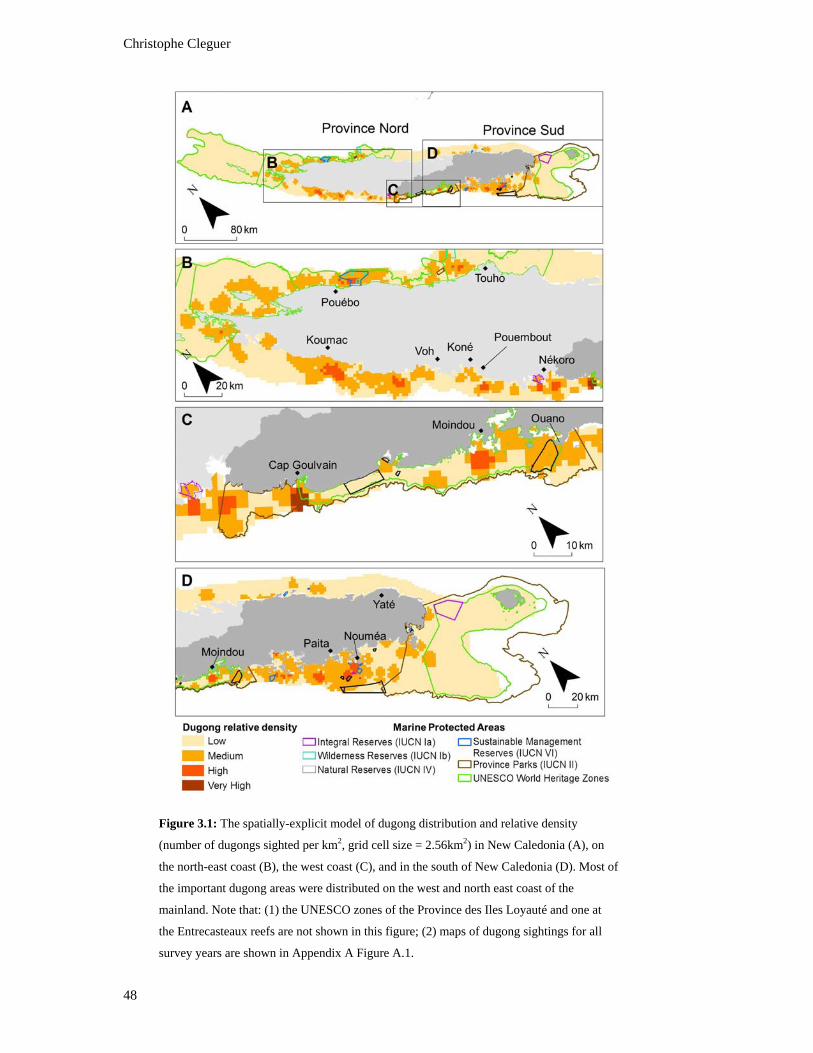
Christophe Cleguer
48
Figure 3.1: The spatially-explicit model of dugong distribution and relative density
(number of dugongs sighted per km2, grid cell size = 2.56km2) in New Caledonia (A), on
the north-east coast (B), the west coast (C), and in the south of New Caledonia (D). Most of
the important dugong areas were distributed on the west and north east coast of the
mainland. Note that: (1) the UNESCO zones of the Province des Iles Loyauté and one at
the Entrecasteaux reefs are not shown in this figure; (2) maps of dugong sightings for all
survey years are shown in Appendix A Figure A.1.

Chapter 3: The spatial coverage of dugongs by marine protected areas
49
Figure 3.2: The relative frequency of each category of modeled dugong density units in
each type of marine protected area (MPA) in New Caledonia. Most (84%) of the very high
dugong relative density units occur in Province Parks (IUCN II), which are absent from
Integral reserves (IUCN Ia). The sum of percentages within each density category does not
equal 100% because MPA types overlap.
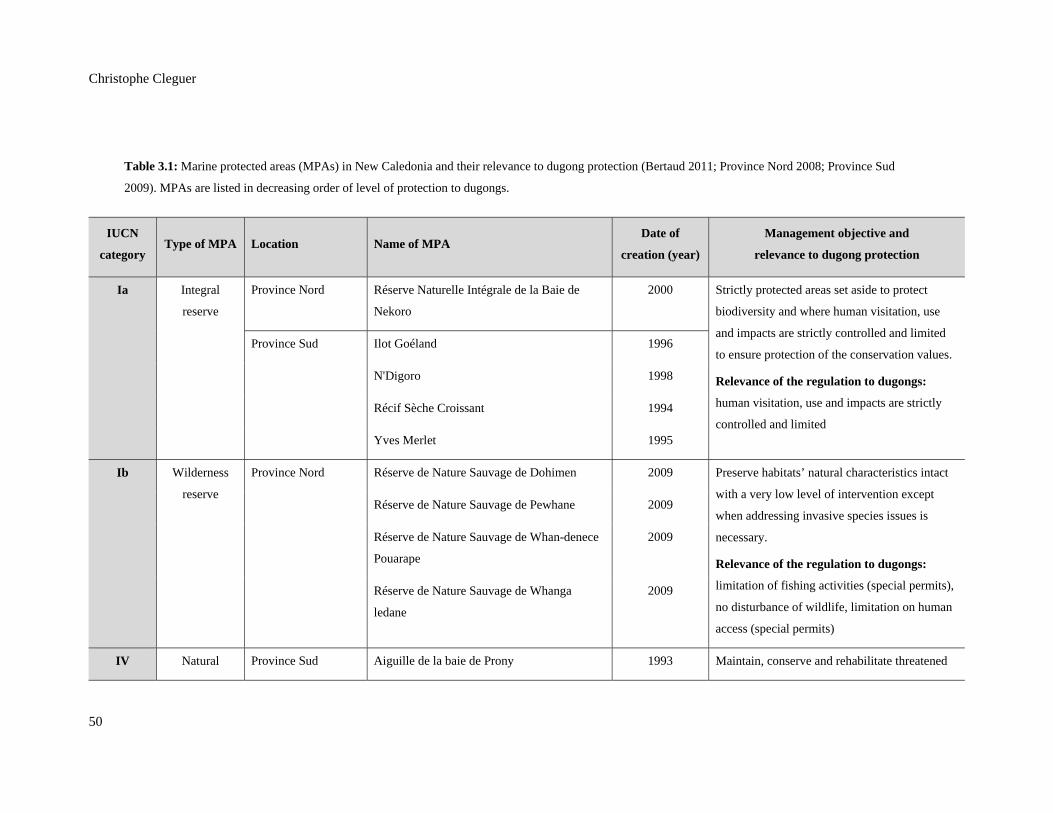
Christophe Cleguer
50
Table 3.1: Marine protected areas (MPAs) in New Caledonia and their relevance to dugong protection (Bertaud 2011; Province Nord 2008; Province Sud
2009). MPAs are listed in decreasing order of level of protection to dugongs.
IUCN
category Type of MPA Location Name of MPA
Date of
creation (year)
Management objective and
relevance to dugong protection
Ia Integral
reserve
Province Nord Réserve Naturelle Intégrale de la Baie de
Nekoro
2000 Strictly protected areas set aside to protect
biodiversity and where human visitation, use
and impacts are strictly controlled and limited
to ensure protection of the conservation values.
Relevance of the regulation to dugongs:
human visitation, use and impacts are strictly
controlled and limited
Province Sud Ilot Goéland 1996
N'Digoro 1998
Récif Sèche Croissant 1994
Yves Merlet 1995
Ib Wilderness
reserve
Province Nord Réserve de Nature Sauvage de Dohimen 2009 Preserve habitats’ natural characteristics intact
with a very low level of intervention except
when addressing invasive species issues is
necessary.
Relevance of the regulation to dugongs:
limitation of fishing activities (special permits),
no disturbance of wildlife, limitation on human
access (special permits)
Réserve de Nature Sauvage de Pewhane 2009
Réserve de Nature Sauvage de Whan-denece
Pouarape
2009
Réserve de Nature Sauvage de Whanga
ledane
2009
IV Natural Province Sud Aiguille de la baie de Prony 1993 Maintain, conserve and rehabilitate threatened
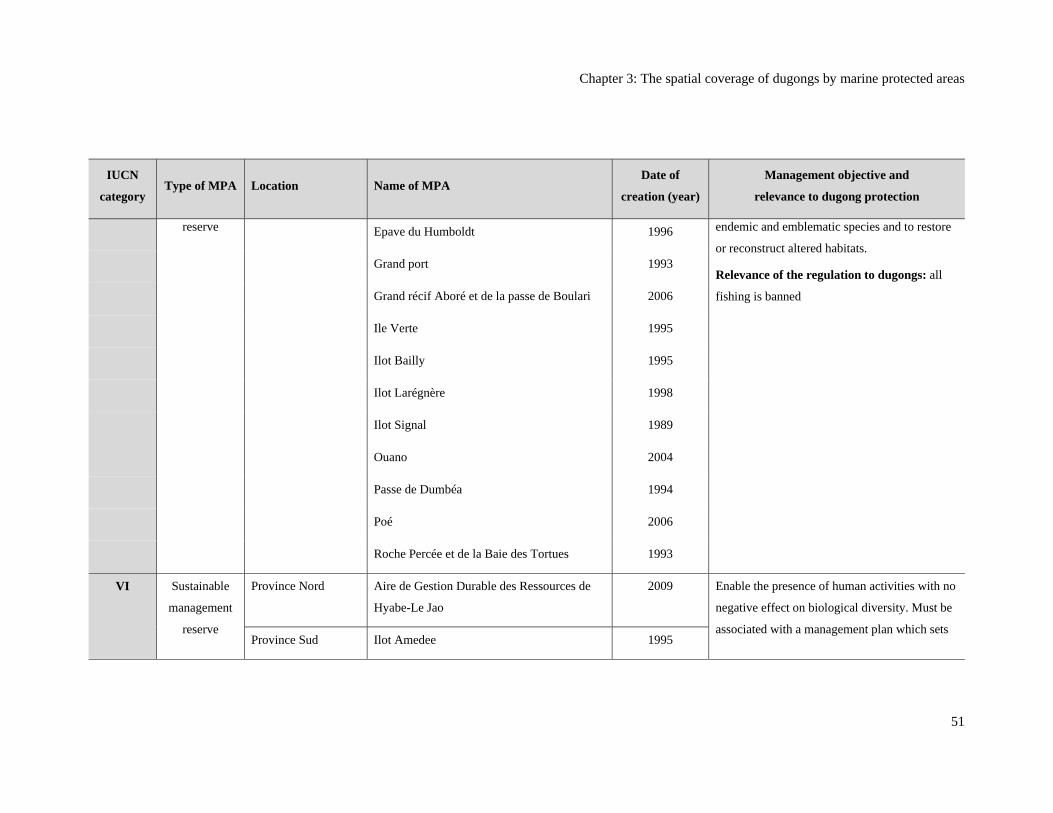
Chapter 3: The spatial coverage of dugongs by marine protected areas
51
IUCN
category Type of MPA Location Name of MPA
Date of
creation (year)
Management objective and
relevance to dugong protection
reserve Epave du Humboldt 1996 endemic and emblematic species and to restore
or reconstruct altered habitats.
Relevance of the regulation to dugongs: all
fishing is banned
Grand port 1993
Grand récif Aboré et de la passe de Boulari 2006
Ile Verte 1995
Ilot Bailly 1995
Ilot Larégnère 1998
Ilot Signal 1989
Ouano 2004
Passe de Dumbéa 1994
Poé 2006
Roche Percée et de la Baie des Tortues 1993
VI Sustainable
management
reserve
Province Nord Aire de Gestion Durable des Ressources de
Hyabe-Le Jao
2009 Enable the presence of human activities with no
negative effect on biological diversity. Must be
associated with a management plan which sets Province Sud Ilot Amedee 1995
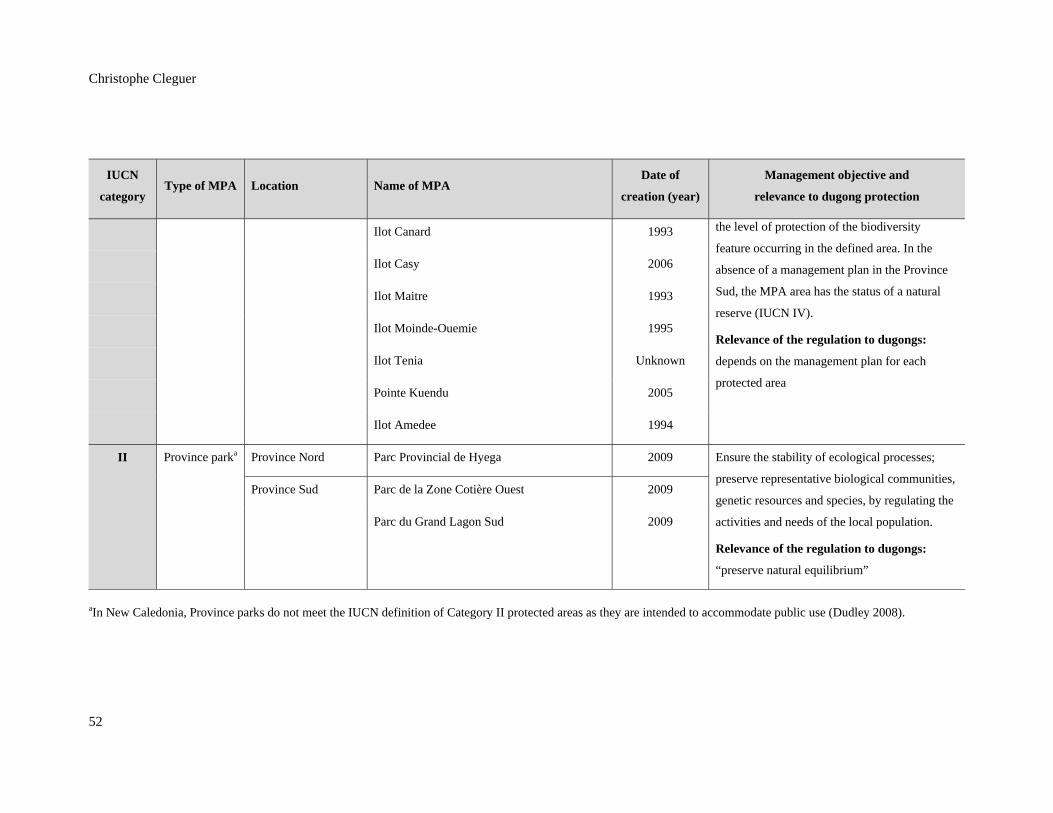
Christophe Cleguer
52
IUCN
category Type of MPA Location Name of MPA
Date of
creation (year)
Management objective and
relevance to dugong protection
Ilot Canard 1993 the level of protection of the biodiversity
feature occurring in the defined area. In the
absence of a management plan in the Province
Sud, the MPA area has the status of a natural
reserve (IUCN IV).
Relevance of the regulation to dugongs:
depends on the management plan for each
protected area
Ilot Casy 2006
Ilot Maitre 1993
Ilot Moinde-Ouemie 1995
Ilot Tenia Unknown
Pointe Kuendu 2005
Ilot Amedee 1994
II Province parka Province Nord Parc Provincial de Hyega 2009 Ensure the stability of ecological processes;
preserve representative biological communities,
genetic resources and species, by regulating the
activities and needs of the local population.
Relevance of the regulation to dugongs:
“preserve natural equilibrium”
Province Sud Parc de la Zone Cotière Ouest 2009
Parc du Grand Lagon Sud 2009
aIn New Caledonia, Province parks do not meet the IUCN definition of Category II protected areas as they are intended to accommodate public use (Dudley 2008).

Chapter 3: The spatial coverage of dugongs by marine protected areas
53
3.5 Discussion
Identifying the location of sites where dugongs are at risk from anthropogenic activities is
critical to the long-term management of the species in New Caledonia. My analysis indicates
that there is a spatial mismatch between locations that support a high density of dugongs and
MPAs that provide the greatest protection from anthropogenic activities. My spatially-explicit
modelling approach revealed a heterogeneous distribution of dugongs at the scale of New
Caledonia, and identified important dugong areas in regions highly affected by human activities
including the Nouméa and the Voh- Koné-Pouembout regions.
Appropriate conservation targets and spatial data are critical to the effective planning and
management of threatened marine species (Pressey et al. 2007). The potential benefits of MPAs
are compromised without this information. For example, the status of the vaquita (Phocoena
sinus) in the Gulf of Mexico continues to deteriorate and the species is now listed as critically
endangered because the reserve designed to protect the species and established in 1993 failed to
cover 40% of its core habitat (Rojas-Bracho et al. 2006); although measures have recently been
taken to tackle this issue (Braulik 2015). In the Mediterranean, seasonal legislation and MPAs
do not cover the core breeding and feeding areas of the endangered loggerhead sea turtle,
(Caretta caretta); (Schofield et al. 2013). The vaquita and loggerhead examples, my study and
others are indicative of a global trend towards the declaration of ‘residual’ MPAs that fail to
separate species from the activities that threaten them (Devillers et al. 2014).
I identified five potential drivers of the spatial mismatch between important dugong areas and
the New Caledonia MPA network. I discuss each of these drivers below and provide generic
guidance on how such shortcomings can be avoided for marine species of conservation concern.
Lack of explicit conservation goals and targets
In the past, terrestrial parks were primarily selected on the basis of their scenery and wilderness
quality (Lockwood et al. 2012). This selection process also occurs in the marine environment
(Margules and Pressey 2000; Devillers et al. 2014), including New Caledonia. The primary goal
of protected areas should be the long term conservation of nature and the associated ecosystem
services and cultural values (Dudley 2008). Some MPAs are also designed to conserve
biodiversity specifically (i.e., minimise extinction risk), protect ecosystems, and enhance the
size and productivity of harvested fish or invertebrate populations that support fisheries (Hooker
and Gerber 2004). The design of effective MPAs requires clear conservation goals and targets
(Margules and Pressey 2000; Pressey and Bottrill 2009). A goal is a broad statement about what
Christophe Cleguer
54
the protected area is attempting to achieve; a target is a quantitative measure of what needs to be
accomplished to reach this goal (Margules and Pressey 2000).
This study demonstrates that the absence of conservation goals and targets increases the
likelihood that MPAs will not benefit some species of conservation concern because they are of
inadequate size and/or location. Conservation goals and targets should: (1) incorporate if not
prioritise the most threatened biodiversity features or species, especially if such protection can
benefit other less charismatic species (Dobbs et al. 2008; Devillers et al. 2014), and (2) reflect
the needs of coastal communities as much as possible. The protection of 50% of all high priority
dugong areas was an explicit target in the 2003 rezoning of the Great Barrier Reef Marine Park,
Australia (Dobbs et al. 2008). A similar target-based approach should be applied in other
countries and territories, including New Caledonia, to improve the protection of threatened
species (McCook et al. 2010).
Omission of spatial information on species’ distribution
The first proposal for the inscription of New Caledonia’s lagoons as a World Heritage Area was
rejected by the majority of the elected representatives, local descisions makers, and the French
government in 2001. David et al. (2010) suggest that this proposal failed because of
disagreements between public authorities and a local environmental Non Governmental
Oragnization (NGO) on mining projects in New Caledonia. The spatially-explicit outputs of the
first dugong aerial survey (Garrigue and Patenaude 2004; Garrigue et al. 2008) were provided to
local resource managers in 2004 when proposals for the construction of two metal-processing
projects were under assessment: Goro Nickel south of Nouméa and Falconbridge in the Voh-
Koné-Pouembout region. Public authorities feared that inscribing the lagoons as a World
Heritage Area would deter the project’s investors (David et al. 2010). The World Heritage
proposal was reopened after the Goro nickel metal-processing project commenced in 2005.
Thus, controversy over the two metal-processing projects may have influenced the failure of
public authorities to consider dugongs when planning the design of new MPAs and the World
Heritage zones.
The omission of spatial information on dugong distribution at the planning stage of subsequent
MPAs in New Caledonia contributed to the observed spatial mismatch, even though information
was available. In other overseas regions, especially developing countries, spatially-explicit
information on the range, migration, feeding and reproductive areas of marine mammals is often
limited and prohibitively costly to obtain. Data-poor areas often receive little or no protection
from MPAs even though they may be just as important or more important for species of
conservation concern such as marine mammals (Hooker and Gerber 2004; Hoyt 2012). MPA

Chapter 3: The spatial coverage of dugongs by marine protected areas
55
design requires the use of the best available ecological data. When data are absent, expert
opinion can be used to define operational principles and critical sites for protection (e.g.,
Fernandes et al. 2005). An alternative is to design large MPAs inclusive of all the places that the
population might be using, although this approach has also been criticized (Weaver and Johnson
2012; Singleton and Roberts 2014). Irrespective of the approach, resource managers should
provide a solid and effective management mechanism along with appropriate management aims
and strategies that explicitly prioritize the conservation of target species.
Mismatch of spatial scales
The New Caledonian MPA network was designed and is managed at the provincial scale. The
provincial scale is not congruent with the ecological scale of marine mammals such as dugongs
(Grech et al. 2011; Hoyt 2012). In Australia, repeated time series of dugong aerial surveys in
the same region suggest that dugongs undertake large-scale movements (Preen and Marsh 1995;
Marsh and Lawler 2002; Gales et al. 2004; Marsh et al. 2004; Gredzens et al. 2014). For
example, in Torres Strait between Australia and Papua New Guinea, dugongs cross international
boundaries in all directions (Gredzens et al. 2014). These movements support the importance of
management and monitoring at ecological scales that cross jurisdictions
(Marsh et al. 2002, 2012). The need to address cross-jurisdictional dugong conservation and
management issues is confirmed by the inclusion of the dugong on Appendix I of the
Convention on Migratory Species of Wild Animals (CMS 2015) and is one of the priorities of
the Dugong Memorandum of Understanding signed by 26 signatories of which France (Mayotte
and New Caledonia) is party (MoU 2007). Nonetheless, when developing strategies for mobile
marine mammal conservation, politico-jurisdictional considerations should not prevail over
ecological considerations. Cross-jurisdictional frameworks in which decisions about spatial
scale are made explicit can improve the development of ecologically functional networks of
MPAs or alternative conservation tools (Mills et al. 2010) as exemplified by: (1) the consortium
of countries developing a regional framework for protection of the environment and sustainable
development of coastal and marine resources, including dugongs in the Red Sea region
(Gladstone et al. 2003); (2) the multilateral Coral Triangle Initiative in south-east Asia which
aims to coordinate dugong conservation efforts throughout that region (Secretariat 2009); (3)
the integrated and comprehensive management of Australia’s Great Barrier Reef (Day and
Dobbs 2013), and (4) the UNEP-CMS Global Dugong, Seagrass and Coastal Communities
Initiative (CMS 2010). In conjunction with the recent development of a Dugong Action Plan in
New Caledonia (Jacob and Gardes 2010), the results of my study provide scope to improve
dugong conservation planning at multiple scales and across jurisdictions.
Christophe Cleguer
56
Cost considerations
I found that important dugong areas in New Caledonia received limited protection from direct
hazards such as nets in small-scale fisheries and boating, and indirect hazards such as growing
coastal urbanisation and the development of coastal mining industries (e.g., there is no MPA in
the Voh- Koné-Pouembout region where the mining industry is booming and boating activities
are expected to increase; David et al. 2010). In contrast, areas of low dugong conservation value
are highly protected. The lack of protection of key habitats and species within the boundaries of
protected areas occurs in terrestrial regions (Scott et al. 2001) and is becoming an issue of
concern in the marine environment (Dryden et al. 2008; Edgar 2011; Devillers et al. 2014).
Focusing on the conservation of areas where hazards are not significant diverts attention and
resources from actions that address real hazards or more highly threatened areas (Agardy et al.
2011). This problem, which is often referred to as “residual protection”, occurs where the cost
to industry is minimised by locating protected areas where the level of extractive use or
commercial potential is low (Devillers et al. 2014). One of the major disadvantages of residual
protection is that species most associated with extractive uses (e.g., coastal marine species), and
most in need of protection, continue to decline without effective intervention (Margules and
Pressey 2000). Political leadership is required to transform scientific knowledge to effective
conservation and management strategies (Day and Dobbs 2013).
Incorrect application of IUCN protected area categories
New Caledonian MPAs that cover most of the important dugong areas allow extractive
activities such as fishing, even though they are designated as Category II IUCN protected areas.
The most recent guidelines from the IUCN clearly state that commercial or recreational fishing
is inappropriate in MPAs designated as category II protected areas (Dudley 2008). The correct
application of IUCN categories to MPAs is important because it: (1) ensures that the IUCN
categorization remains internationally meaningful; and (2) enables the accurate tracking of
conservation progress towards international and national biodiversity targets (Fitzsimons 2011).
Furthermore, the incorrect application of IUCN categories can create an illusion that the MPA is
fulfilling a role when in fact it is not (Agardy et al. 2011). This illusion of protection may
eventually reduce public trust in MPAs and has negative effects on their management. Increased
efforts to clarify the definitions of IUCN categories relevant to MPAs and enforcement of the
global framework are required.
Chapter 3: The spatial coverage of dugongs by marine protected areas
57
3.6 Conclusion
The outputs of my study provide an important decision support-tool that can be used to improve
the protection of dugongs in New Caledonia. While this improved protection could be addressed
by establishing additional MPAs, other non-spatial management approaches such as community
engagement, public education and codes of environmental best practice should also be
considered (Kenchington and Day 2011; Day and Dobbs 2013). Approaches to
comprehensively assess the existing and potential hazards to dugongs and options to mitigate
these hazards should also be examined in the face of the uncertainties regarding the relative
effect of human activities that threaten dugongs and their habitats in New Caledonia (e.g., Grech
and Marsh 2008; Redfern et al. 2013).
To prevent spatial mismatch of future MPAs and species of conservation concern, management
agencies should ensure that: (1) the best available data on the target species and the
precautionary principle (i.e., coping with possible risks where scientific understanding is yet
incomplete) are used and, when appropriate, knowledge inferred from studies conducted
elsewhere (e.g., biology and life history); (2) explicit goals, preferably translated into
quantitative, operational targets are set; (3) jurisdictional boundaries and political considerations
do not preclude effective planning (Chapter 4); (4) MPAs incorporate the needs of threatened
species and do not favour areas with the least value for extractive use; (5) MPA designations
follow global conservation frameworks; and (6) if MPAs are to be established, the communities
involved have a positive attitude towards them as lack of acceptance is potentially dangerous to
their effective functioning (Agardy et al. 2003), especially in situations where resources for
monitoring and enforcement are lacking (McMahon 2005; Arias et al. 2014), (7) integrate
spatially-explicit information on the movement patterns of the species of interest if that data are
available (Chapter 4), (8) optimize the chances of conservation of dugongs by using an adaptive
management approach whereby management actions are taken and assessed through effective
monitoring and changes are made for future actions based on the results.
Christophe Cleguer
58
3.7 Chapter summary
Dugongs were not explicitly considered in the design of the network of MPAs in New
Caledonia.
In this chapter, I retrospectively assessed the capacity of the New Caledonia marine
protected area (MPA) network to protect dugongs from anthropogenic hazards using
information collected from ~10 years of aerial surveys in the region (Chapter 2). I developed
a spatially-explicit model of dugong distribution and relative density and overlaid it with the
layer of the New Caledonia MPA network.
I identified high dugong relative density areas in the lagoons of New Caledonia and found
that most of these important dugong habitats had a low coverage of MPAs that provide high
levels of restriction on anthropogenic activities.
The spatial mismatch between MPAs and dugongs was likely caused by weaknesses in the
planning process, including the: (1) lack of explicit conservation goals and targets; (2)
omission of spatial information on species’ distribution; (3) mismatch of spatial scales; (4)
cost considerations; and (5) incorrect application of the IUCN protected area categories.
I provide guidance on how these shortcomings can be overcome for marine species of
conservation concern in New Caledonia and other regions.
Similar spatially-explicit models of dugong distribution and relative density have been used
as a key decision support tool in Australia to inform the conservation and management of
dugong and the outputs from this Chapter could aid future conservation plans in New
Caledonia.

Chapter 4: Movement heterogeneity of dugongs in the lagoons of New Caledonia
59
Chapter 4: Movement heterogeneity of dugongs in the lagoons of New Caledonia
Effective protection of large marine megafauna is often hampered by a lack of information on
their use of space. In this chapter, I examine the heterogeneity in movement patterns of 12
dugongs which I captured and satellite tracked in three different regions in the lagoons of New
Caledonia. I discuss the ecological significance of my findings. The conservation and
management implications are discussed in Chapter 6.
Objective 2 Enhance understanding of spatial ecology of dugongs in coral reef
environments
Objective 1 Assess the temporal changes in
dugong abundance and conservation strategies in New Caledonia
Chapter 1 General introduction
Chapter 2 Temporal changes in the relative
abundance of dugongs
Chapter 3 The spatial coverage of dugongs by
marine protected areas
Chapter 4 Dugong movement heterogeneity in the coral reef of New Caledonia
Chapter 5 Seasonal changes in the abundance and habitat use of dugongs in the
coral reefs of Cap Goulvain
Chapter 6 General discussion
Objective 3 Integrating scientific research conducted on dugongs as part of this thesis to inform
decisions relating to dugong conservation and management regionally and internationally.
Christophe Cleguer
60
4.1 Introduction
Spatially-explicit information on the movement patterns of marine wildlife species can play a
central role during the development of management strategies including the design of marine
protected areas (MPAs); (Cañadas et al. 2005; Lovvorn et al. 2009; Hoyt 2012; Hussey et al.
2015). The objectives of individual MPAs vary but they typically aim to conserve marine
biodiversity by separating species and their habitats from anthropogenic activities (Chapter 3;
Edgar et al. 2007; Fox et al. 2012). Marine protected areas often fail to reach their full potential,
in part at least as a consequence of a lack of biological information on critical habitat
connectivity, animal movements and use of space (Dryden et al. 2008; Agardy et al. 2011;
Bearzi 2012; Schofield et al. 2013). For example, the protection of highly mobile marine
megafauna species, including species of marine mammals, tends to be sub-optimal because
MPAs are often too small or placed in locations that offer incomplete spatial protection (Flores
and Bazzalo 2004; Bearzi 2012; Hoyt 2012). Thus understanding the use of space in marine
megafauna can have profound implications for their conservation, especially for species such as
dugongs that live in coastal environments under increasing pressure from anthropogenic
activities.
Remote recording devices have been used to examine how dugongs use space in order to inform
their conservation. For example Marsh and Rathbun (1990) first documented the movements
and habitat use of dugongs using remote recording devices (satellite and VHF transmitters).
Their motivation was to assess the efficacy of the Great Barrier Reef Marine Park Authority
zoning strategy, which provided a high level of protection for some inshore seagrass areas that
support large numbers of dugongs. Most of the dugongs tracked by Marsh and Rathbun (1990)
remained in the vicinity of localised highly protected inshore and intertidal and subtidal seagrass
beds. However, one pubescent male dugong moved between two bays about 140km apart three
times in nine weeks (Marsh and Rathbun, 1990). This heterogeneity in dugong movements has
been confirmed as technology has improved and more dugongs have been tracked (De Iongh et
al. 1998; Holley 2006; Sheppard et al. 2006; Gredzens et al. 2014). For example, Sheppard et
al. (2006) found that of the 70 dugongs tracked in Queensland and the Northern Territory, 26
(37%) moved less than 15km from their capture sites, 28 (40%) moved 15-100km and 14 (20%)
moved over 100km away. Large-scale movements of dugongs were also identified in Shark
Bay, Western Australia (Holley et al. 2006). In Indonesian waters four dugongs tracked moved
distances between 17km and 65km (De Iongh et al. 1998). Most of the tracking periods were
relatively short (i.e., weeks or months) so it is likely that this tracking underestimated the extent
of movement between habitats as demonstrated by Cope et al. (2015) using pedigree analysis.
Chapter 4: Movement heterogeneity of dugongs in the lagoons of New Caledonia
61
Information on the use of space by dugongs is used in management. Detailed maps of possible
movement corridors and core habitats informed the zoning of the Great Sandy Strait Marine
Park Zoning in Queensland (Sheppard 2008). Evidence of dugong movements outside of
reserve structures have been obtained in Western Australia where dugongs undertake seasonal
movements (Holley 2006) and in Torres Strait where tracked dugongs underused the sanctuary
specifically designed for their protection (Gredzens et al. 2014). Both satellite and acoustic
tracking technologies have been used to document the movement patterns of dugongs in
Moreton Bay in an area adjacent to the Port of Brisbane, Australia’s third busiest port (Zeh et al.
2015), suggesting that dugongs regularly move in and out of Go-Slow zones (i.e., zones where
speed is limited to a non-planing speed to reduce the risk to dugongs and marine turtles from
collision with boats, see Chapter 6). By comparing observed boat movements with those of
tracked dugongs, Maitland et al. (2006) suggested new boating routes to minimise collisions
with dugongs while limiting imposition on boaters.
The dugong’s use of space may differ between localities within the species’ range. Gredzens et
al. (2014) found substantial differences in the dugong range sizes and depth zone preferences
between Torres Strait and Shoalwater Bay, suggesting that the relative availability of deeper
water and shallow-water habitat, the presence of reefs, the location and size of available
seagrass meadows and the regional dugong population size may influence these patterns. Thus,
enhancing understanding of the dugong’s use of space requires investigation on the movements
of dugongs in disparate habitats in order to obtain generic insights in specific habitats to inform
conservation initiatives.
In Chapter 2, my analysis of the dugong relative abundance and density suggested that dugong
movements may occur at least within survey blocks but this could not be verified. In Chapter 3,
I used aerial survey data and spatially-explicit modelling to obtain information on the locality of
important dugong habitats and on the capacity of the MPA network to protect these areas. In
this Chapter, I use GPS satellite telemetry to examine the scale and heterogeneity of the use of
space by dugongs in the lagoons of New Caledonia by capturing 12 individuals in three
locations of high dugong conservation value. My primary research objectives were to: (1)
describe the dugongs’ movement patterns; (2) estimate the size of their home-ranges and
identify core activity spaces; and (3) identify any specific movement corridors used by dugongs
to transit between important habitats. I then discuss the ecological and conservation and
management implications of my findings.
Christophe Cleguer
62
4.2 Methods
Study sites
Twelve dugongs were satellite tagged in three high dugong density locations (Cap Goulvain,
Ouano, Nouméa) identified on the basis of the spatially-explicit model of dugong distribution
and relative density (Chapter 3; Figure 3.1) based on the aerial surveys (Chapter 2).
Cap Goulvain is the most remote of all three study sites. It is located 200km north of Nouméa
and supports one of the highest dugong densities in New Caledonia (Cleguer et al. 2015;
Chapter 3). The lagoon in Cap Goulvain is approximately four kilometres wide. It is shallow
(< 10m) in the reticulated reef and inshore intertidal seagrass meadow areas but deeper (> 10m)
in the channels. The lagoon widens north of Cap Goulvain to reach 15km in the Koné region
and narrows southward to 2km wide between Cap Goulvain and Bourail. The Ouano region is
located approximately half way between Cap Goulvain and Nouméa. In the Ouano region, the
lagoon is up to 10km wide, it is shallow north of Ouano (most areas are < 10m deep) and it
increases in depth (> 10m deep) further south. The southwestern lagoon surrounding the
Nouméa region is funnel shaped with a width varying from 40km in the southeast to about 5km
in the northwest, and a mean depth of approximately 17.5m.
Dugong capture
Seven dugongs were tagged in Cap Goulvain, two in Ouano and three in the Nouméa region
(Figure 4.1 and Table 4.1). Tracking animals like cetaceans and sirenians that spend all of their
lives in the water can be difficult as there are numerous challenges associated with tag
deployment (Irvine 1983; Marsh and Rathbun 1990). Tag deployment is particularly
challenging when animals need to be physically captured. Capturing dugongs to deploy satellite
tags risks injuring both the animals and the research team (Marsh and Rathbun 1990). Thus,
using a safe technique for capturing and tagging dugongs is essential.
The most commonly-used technique for catching dugongs to fit GPS satellite transmitters is the
rodeo technique, first used by Marsh and Rathbun (1990) and described in detail by Lanyon et
al. (2006). This technique requires a close pursuit of an individual dugong, preferably in clear,
shallow waters to increase the chances of following the animal as it moves through the water
column. The pursuit is usually carried out using an outboard-powered speed-boat - also called a
‘catch-boat’ - until the animal is fatigued and then caught manually by personnel jumping from
the vessel (Lanyon et al. 2006). Given the dugong’s short burst capabilities during a pursuit
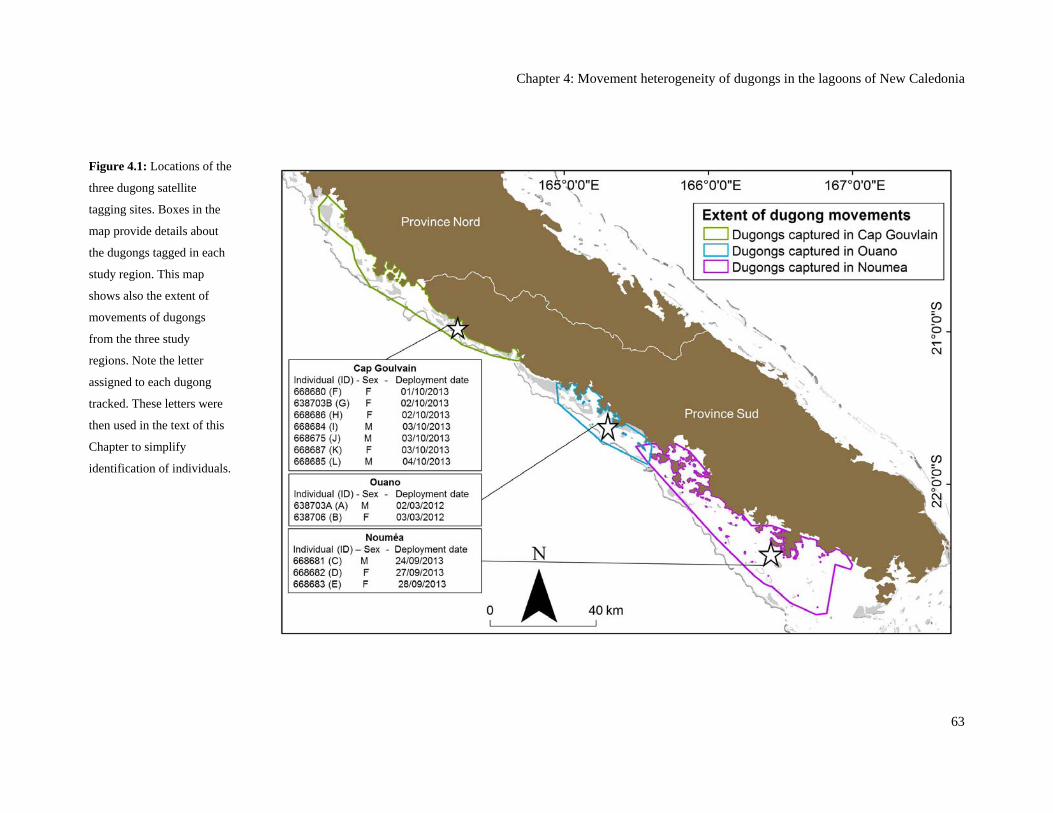
Chapter 4: Movement heterogeneity of dugongs in the lagoons of New Caledonia
63
Figure 4.1: Locations of the
three dugong satellite
tagging sites. Boxes in the
map provide details about
the dugongs tagged in each
study region. This map
shows also the extent of
movements of dugongs
from the three study
regions. Note the letter
assigned to each dugong
tracked. These letters were
then used in the text of this
Chapter to simplify
identification of individuals.
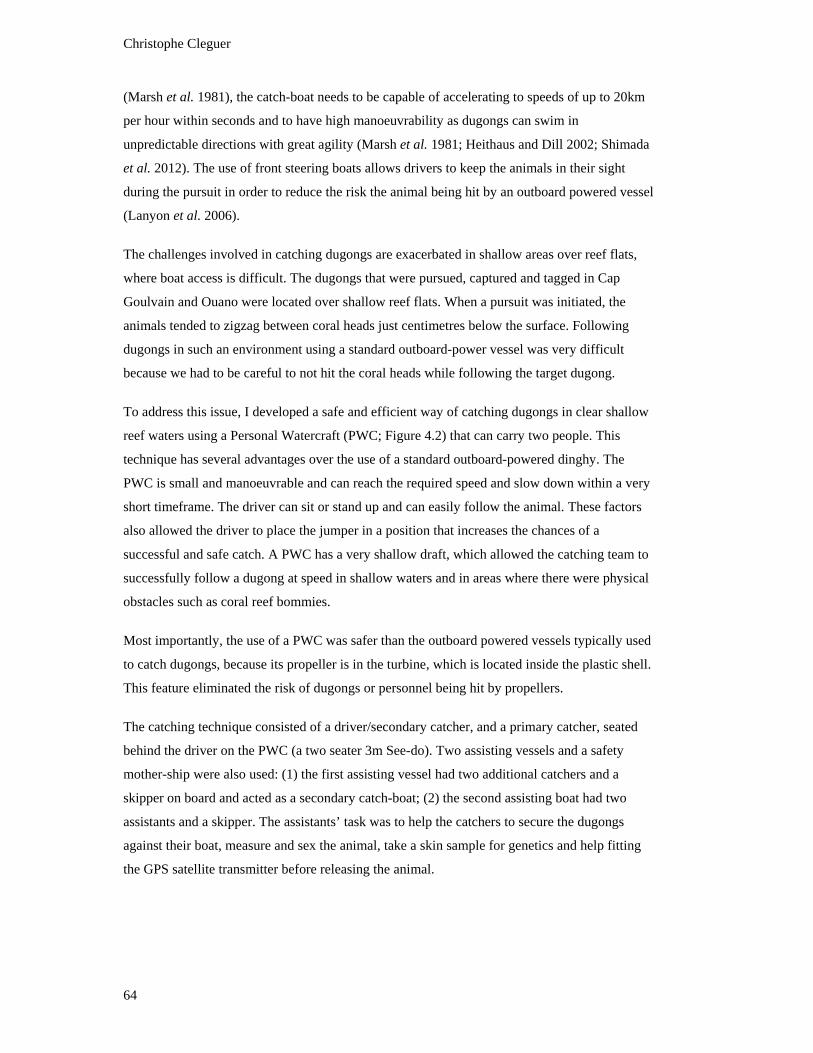
Christophe Cleguer
64
(Marsh et al. 1981), the catch-boat needs to be capable of accelerating to speeds of up to 20km
per hour within seconds and to have high manoeuvrability as dugongs can swim in
unpredictable directions with great agility (Marsh et al. 1981; Heithaus and Dill 2002; Shimada
et al. 2012). The use of front steering boats allows drivers to keep the animals in their sight
during the pursuit in order to reduce the risk the animal being hit by an outboard powered vessel
(Lanyon et al. 2006).
The challenges involved in catching dugongs are exacerbated in shallow areas over reef flats,
where boat access is difficult. The dugongs that were pursued, captured and tagged in Cap
Goulvain and Ouano were located over shallow reef flats. When a pursuit was initiated, the
animals tended to zigzag between coral heads just centimetres below the surface. Following
dugongs in such an environment using a standard outboard-power vessel was very difficult
because we had to be careful to not hit the coral heads while following the target dugong.
To address this issue, I developed a safe and efficient way of catching dugongs in clear shallow
reef waters using a Personal Watercraft (PWC; Figure 4.2) that can carry two people. This
technique has several advantages over the use of a standard outboard-powered dinghy. The
PWC is small and manoeuvrable and can reach the required speed and slow down within a very
short timeframe. The driver can sit or stand up and can easily follow the animal. These factors
also allowed the driver to place the jumper in a position that increases the chances of a
successful and safe catch. A PWC has a very shallow draft, which allowed the catching team to
successfully follow a dugong at speed in shallow waters and in areas where there were physical
obstacles such as coral reef bommies.
Most importantly, the use of a PWC was safer than the outboard powered vessels typically used
to catch dugongs, because its propeller is in the turbine, which is located inside the plastic shell.
This feature eliminated the risk of dugongs or personnel being hit by propellers.
The catching technique consisted of a driver/secondary catcher, and a primary catcher, seated
behind the driver on the PWC (a two seater 3m See-do). Two assisting vessels and a safety
mother-ship were also used: (1) the first assisting vessel had two additional catchers and a
skipper on board and acted as a secondary catch-boat; (2) the second assisting boat had two
assistants and a skipper. The assistants’ task was to help the catchers to secure the dugongs
against their boat, measure and sex the animal, take a skin sample for genetics and help fitting
the GPS satellite transmitter before releasing the animal.
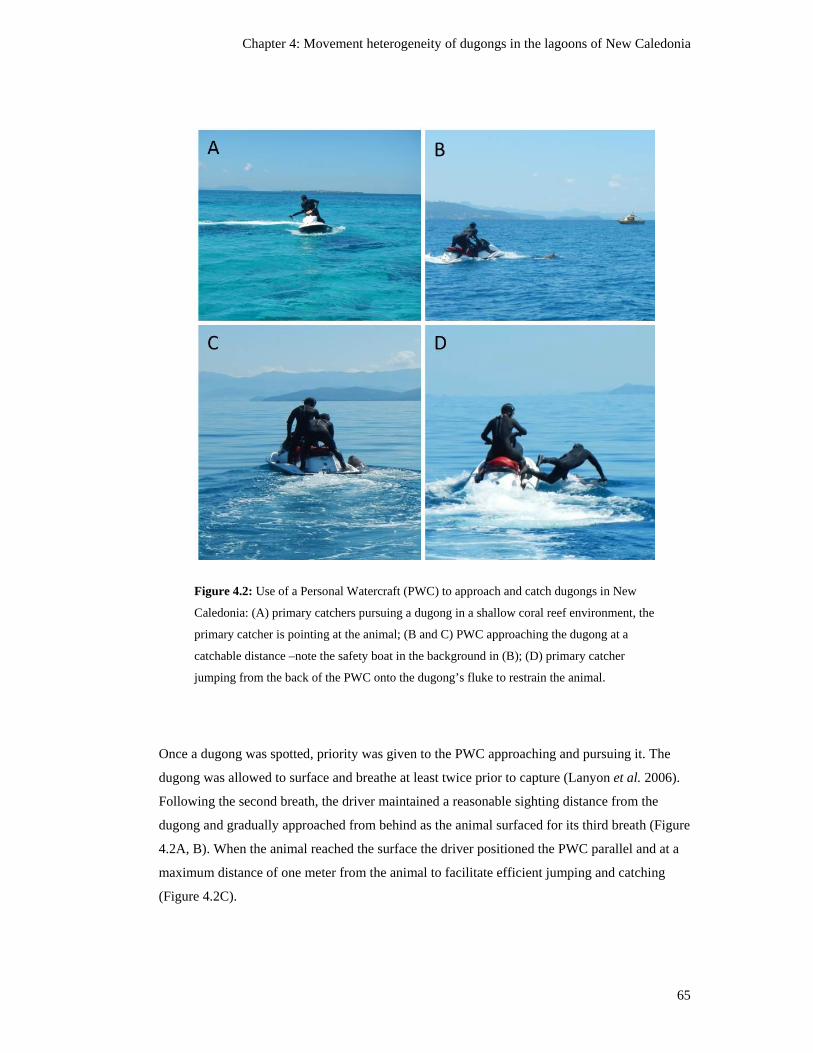
Chapter 4: Movement heterogeneity of dugongs in the lagoons of New Caledonia
65
Figure 4.2: Use of a Personal Watercraft (PWC) to approach and catch dugongs in New
Caledonia: (A) primary catchers pursuing a dugong in a shallow coral reef environment, the
primary catcher is pointing at the animal; (B and C) PWC approaching the dugong at a
catchable distance –note the safety boat in the background in (B); (D) primary catcher
jumping from the back of the PWC onto the dugong’s fluke to restrain the animal.
Once a dugong was spotted, priority was given to the PWC approaching and pursuing it. The
dugong was allowed to surface and breathe at least twice prior to capture (Lanyon et al. 2006).
Following the second breath, the driver maintained a reasonable sighting distance from the
dugong and gradually approached from behind as the animal surfaced for its third breath (Figure
4.2A, B). When the animal reached the surface the driver positioned the PWC parallel and at a
maximum distance of one meter from the animal to facilitate efficient jumping and catching
(Figure 4.2C).
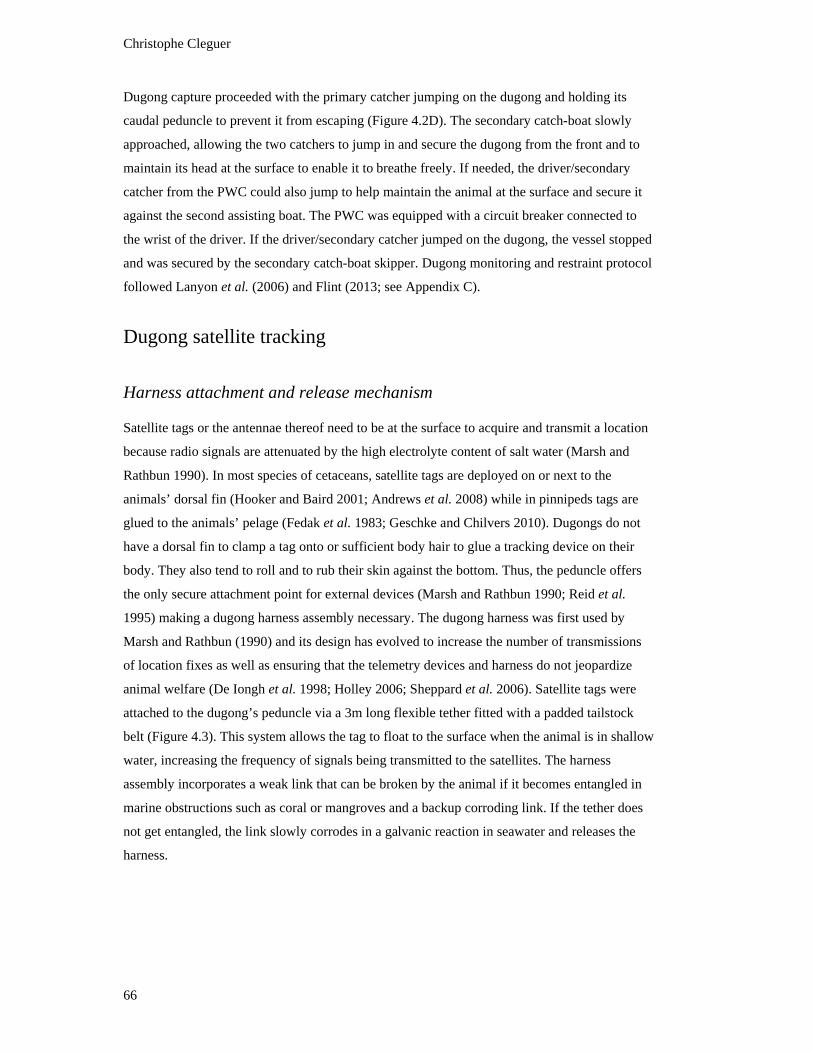
Christophe Cleguer
66
Dugong capture proceeded with the primary catcher jumping on the dugong and holding its
caudal peduncle to prevent it from escaping (Figure 4.2D). The secondary catch-boat slowly
approached, allowing the two catchers to jump in and secure the dugong from the front and to
maintain its head at the surface to enable it to breathe freely. If needed, the driver/secondary
catcher from the PWC could also jump to help maintain the animal at the surface and secure it
against the second assisting boat. The PWC was equipped with a circuit breaker connected to
the wrist of the driver. If the driver/secondary catcher jumped on the dugong, the vessel stopped
and was secured by the secondary catch-boat skipper. Dugong monitoring and restraint protocol
followed Lanyon et al. (2006) and Flint (2013; see Appendix C).
Dugong satellite tracking
Harness attachment and release mechanism
Satellite tags or the antennae thereof need to be at the surface to acquire and transmit a location
because radio signals are attenuated by the high electrolyte content of salt water (Marsh and
Rathbun 1990). In most species of cetaceans, satellite tags are deployed on or next to the
animals’ dorsal fin (Hooker and Baird 2001; Andrews et al. 2008) while in pinnipeds tags are
glued to the animals’ pelage (Fedak et al. 1983; Geschke and Chilvers 2010). Dugongs do not
have a dorsal fin to clamp a tag onto or sufficient body hair to glue a tracking device on their
body. They also tend to roll and to rub their skin against the bottom. Thus, the peduncle offers
the only secure attachment point for external devices (Marsh and Rathbun 1990; Reid et al.
1995) making a dugong harness assembly necessary. The dugong harness was first used by
Marsh and Rathbun (1990) and its design has evolved to increase the number of transmissions
of location fixes as well as ensuring that the telemetry devices and harness do not jeopardize
animal welfare (De Iongh et al. 1998; Holley 2006; Sheppard et al. 2006). Satellite tags were
attached to the dugong’s peduncle via a 3m long flexible tether fitted with a padded tailstock
belt (Figure 4.3). This system allows the tag to float to the surface when the animal is in shallow
water, increasing the frequency of signals being transmitted to the satellites. The harness
assembly incorporates a weak link that can be broken by the animal if it becomes entangled in
marine obstructions such as coral or mangroves and a backup corroding link. If the tether does
not get entangled, the link slowly corrodes in a galvanic reaction in seawater and releases the
harness.
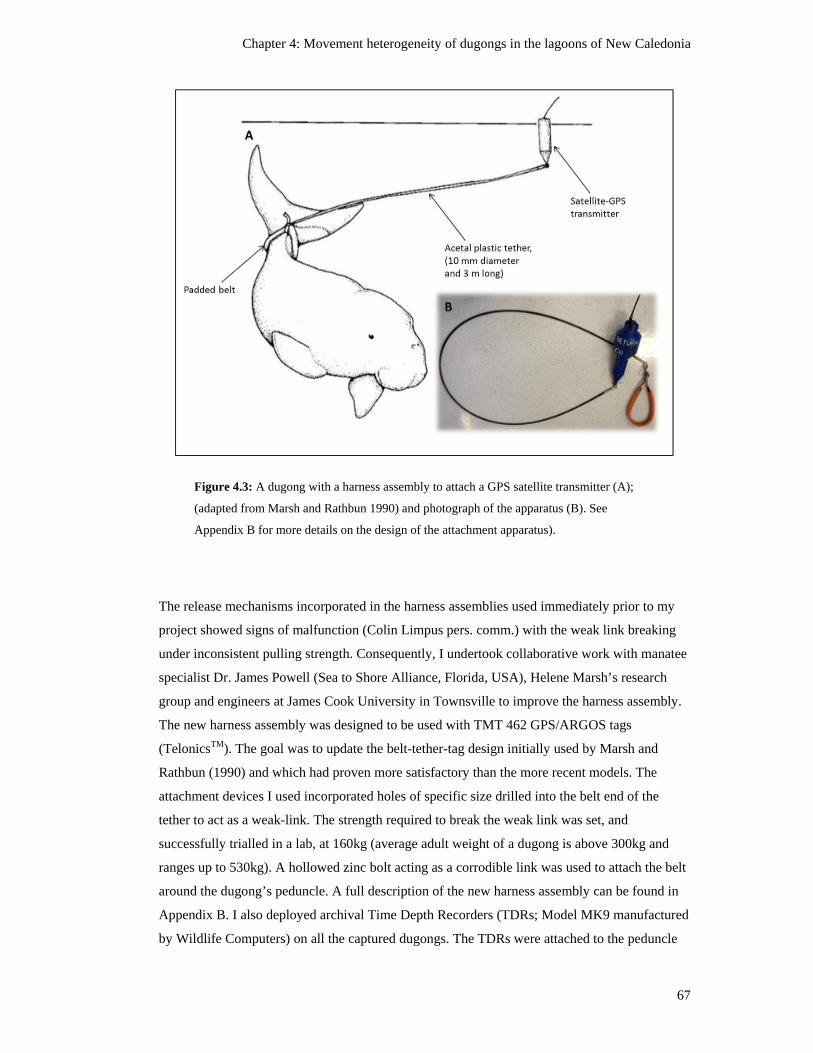
Chapter 4: Movement heterogeneity of dugongs in the lagoons of New Caledonia
67
Figure 4.3: A dugong with a harness assembly to attach a GPS satellite transmitter (A);
(adapted from Marsh and Rathbun 1990) and photograph of the apparatus (B). See
Appendix B for more details on the design of the attachment apparatus).
The release mechanisms incorporated in the harness assemblies used immediately prior to my
project showed signs of malfunction (Colin Limpus pers. comm.) with the weak link breaking
under inconsistent pulling strength. Consequently, I undertook collaborative work with manatee
specialist Dr. James Powell (Sea to Shore Alliance, Florida, USA), Helene Marsh’s research
group and engineers at James Cook University in Townsville to improve the harness assembly.
The new harness assembly was designed to be used with TMT 462 GPS/ARGOS tags
(TelonicsTM). The goal was to update the belt-tether-tag design initially used by Marsh and
Rathbun (1990) and which had proven more satisfactory than the more recent models. The
attachment devices I used incorporated holes of specific size drilled into the belt end of the
tether to act as a weak-link. The strength required to break the weak link was set, and
successfully trialled in a lab, at 160kg (average adult weight of a dugong is above 300kg and
ranges up to 530kg). A hollowed zinc bolt acting as a corrodible link was used to attach the belt
around the dugong’s peduncle. A full description of the new harness assembly can be found in
Appendix B. I also deployed archival Time Depth Recorders (TDRs; Model MK9 manufactured
by Wildlife Computers) on all the captured dugongs. The TDRs were attached to the peduncle

Christophe Cleguer
68
end of the tether. The primary aim of deploying Time Depth Recorder was to investigate the
diving patterns of dugongs in the lagoons of New Caledonia to enhance the estimates of dugong
relative abundance in this region (Chapter 2). However this analysis was beyond the scope of
my thesis.
Global positioning system (GPS) satellite tags
I used the Gen4 GPS receiver technology developed by Telonics. Gen4 systems incorporate a
GPS receiver for obtaining positional data. The fix time of this GPS receiver ranges between 30
and 90 sec assuming a clear view of the sky (Telonics 2013). Typical GPS position accuracy is
2-10m. The units also employed a fast acquisition GPS tracking technology entitled Quick Fix
Pseudoranging (QFP) technology developed for marine mammals that surface for only short
periods of time. The QFP technology obtains location fixes with as little as 3 seconds of
surfacing time. QFP locations are categorized by locational accuracy into three categories:
resolved QFP, resolved QFP (uncertain), and unresolved QFP. Telonics (2012) states that
98.4% of resolved QFP positions are within 30m of the actual position, resolved QFP
(uncertain) positions are generally within 75m, and unresolved QFP positions are over 100m.
Data processing
All raw data were transmitted via the ARGOS network (Argos-system.org), downloaded from
ARGOS via the transmitter manufacturer-supplied software (Telonics Data Converter) and
converted to the Universal Transverse Mercator (UTM) coordinate system. Dugong location
data were used from the time of release of the animal until a transmitter stopped transmitting or
detached. Transmitter detachments were identified by: (1) acquisition of successive GPS
location classes at consistent time intervals (e.g., on the hour, every hour), (2) prolonged
consistent movement indicative of a drifting tag, or (3) signals from one location for an
extended period of time (e.g., days) indicative of a stranded tag.
Because the use of QFP technology in animal tracking is relatively new, objective filtering
techniques were developed to maintain the accuracy of acquired locations. For fine-scale
analysis, the data were initially filtered by location class, using only successful GPS, and
resolved QFP location classes to maintain accuracy of 30m. After initial filtering, data were
corrected for: (1) over-speed errors: identified by the distance and time between successive fixes
necessitating speeds beyond the maximum sustained swimming speed for dugongs of 10km hr-1
(Marsh et al. 1981), (2) temporal duplicates: fixes which were simultaneously obtained but
associated with different level of quality index (the fix with higher quality index was retained),
and (3) fixes obtained inland: locations more than 30m inland were removed as 30m is the error
Chapter 4: Movement heterogeneity of dugongs in the lagoons of New Caledonia
69
estimate for the most precise QFP locations (Telonics 2013). Corrections were conducted using
the data-driven method described by Shimada et al. (2012) and the associated R-package.
After filtering and correcting the dataset, the location data from each dugong were standardized
by dividing the remaining location points into 1 hour duty-cycles and selecting the most
accurate location within each duty-cycle. One hour was chosen to retain as many location points
as possible while minimising differences in the number of location points per day per animal. In
addition, duty cycles were used to reduce the effects of autocorrelation and effects resulting
from differences in transmitter performance. These measures were necessary as sample size has
been shown to significantly affect home-range estimates (Boyle et al. 2009). The best location
was chosen using two criteria: (1) the location with the greatest number of satellite uplinks, and
(2) if multiple locations had the same number of uplinks, the final choice was the location with
the lowest error in position. When multiple locations had the same error value, the location
closest to the median time point within each duty-cycle was chosen.
Analysis
Data from all tracked dugongs were used to analyse the duration of satellite tag deployment and
to explore the movements of the tracked individuals. Three dugongs were subsequently
removed from the analyses because their GPS transmitters detached after a week or less, which
was regarded as a too short tracking period to undertake meaningful analysis of home range
(Table 4.2). Thus, home-range and core area calculations and the analyses on the diurnal
comparison of home-range, seagrass and depth zone distribution and use of marine protected
areas describe below included data from nine dugongs: two dugongs captured in Nouméa, two
dugongs captured in Ouano, and five dugongs captured in Cap Goulvain.
Extent of movements
Minimum convex polygons (MCP) were calculated using the Minimum Bounding Geometry
tool in ArcGIS 10.2 (ESRI, 2013) to define the extent of movement of dugongs in each of the
three study regions. The maximum distance each individual swam from its capture location was
determined using the least-cost path analysis tool in ArcGIS 10.2.
Home-ranges and core areas
The space used by dugongs was defined by their home-range – 95% Kernel density estimates
(Kde) and the core areas were defined by the 50% Kde. For both, the fixed Kernel density
estimation was used and isopleth tools in the Geospatial Modelling Environment software
Christophe Cleguer
70
(GME; Beyer, 2012) at a resolution of 30m. This resolution was selected because the mean
accuracy of filtered QFP GPS locations is within 30m of the true location. I tested several
smoothing parameters including Least-squares Cross-validation (LSCV), Smoothed Cross-
validation (SCV), Biased Cross-validation (BCV) and Likelihood Cross-Validation (CVh).
After exploratory data analysis, CVh was chosen as the most biologically relevant smoothing
parameter for the dataset. This approach is consistent with other recent analyses of dugong
home-ranges and core areas (Gredzens et al. 2014; Zeh et al. 2015). The sizes of the 95% home-
range and 50% core areas (area in which an individual is predicted to be 95% and 50% of the
time respectively) of the nine tracked dugongs were calculated in ArcMap 10.2 from the 95%
and 50% contour polygons generated in GME. Any areas of the 95% and 50% polygons that
overlapped with land were removed before the size of each polygon was calculated. Home-
ranges were calculated for each animal using data from the entire period in which it was
tracked.
Diurnal comparisons of home-ranges
I calculated the diurnal and nocturnal home-ranges for each animal using all filtered data,
recorded respectively during the day (6am-6pm hours) and during the night (6pm-6am hours).
Differences between day and night ranges were determined by: (1) calculation and comparison
of day/night estimated range sizes; (2) using the Utilisation Distribution Overlap Index (UDOI;
Fieberg and Kochanny 2005) to measure the degree to which day/night estimated ranges of each
individual shared space. Calculations UDOI were conducted in R (R Development Core Team
2010) using the ‘adehabitatHR’ package (Calenge and Calenge 2015). The UDOI equals zero
for two home-ranges that do not overlap and equals 1 if both home-ranges are uniformly
distributed and have 100% overlap. UDOI can be greater than 1 if the two home-ranges are non-
uniformly distributed and have a high degree of overlap (Fieberg and Kochanny 2005).
Seagrass and depth zone distribution
A bathymetric model with a resolution of 100m generated by Lefevre et al. (Institut de
Recherche pour le Développement; 2013 unpublished) was used to determine the depth zones
used by each tracked animal. Each layer was stored in raster format, reclassified into 5m depth
zones and converted to vector format to allow the home-range vector polygons to be overlaid.
Total individual ranges of each individual (both 95% home-ranges and 50% core areas) were
then overlaid on the reclassified bathymetry layer and the total area over each depth zone was
calculated for each individual.
Chapter 4: Movement heterogeneity of dugongs in the lagoons of New Caledonia
71
The only georeferenced seagrass map layer available at the spatial scale of our study was a layer
of the maximum extent of shallow seagrasses (< 5m) generated from Landsat imagery
(Andréfouët et al. 2010). I calculated the sizes of the 95% home-ranges and 50% core areas of
the combined tracks of animals by region overlapping with the seagrass layer. Dugongs are
likely to use seagrasses that are not identified by the seagrass layer because the seagrass map is
restricted to seagrasses present in shallow waters (< 5m). Thus this analysis provided an
indication only of the proportion of the range of dugongs using shallow seagrasses.
Use of marine protected areas
A composite GIS layer of all MPAs in New Caledonia was provided by resource managers from
Province Sud and Province Nord and was integrated into ArcGIS. The MPA layer was overlaid
with the filtered dugong GPS tracks and the proportion of GPS location fixes contained in each
type of MPA was calculated for each tracked individual to obtain an indication of the amount of
time spent by each dugong within the boundaries of the MPAs.
4.3 Results
Dugong catching and tagging
Of the 12 animals captured and satellite tagged, seven were females and five were males. Total
lengths ranged from 2.15-2.90m with a mean of 2.52m, ± SE = 0.07m (Table 4.1). There was no
difference in the mean lengths of males and females (Independent T test: p = 0.13).
The mean chase initiation to release time of the 12 dugongs captured was 15 min 44 s (range: 7
min to 44 min; Table 4.1). The upper bound reflects the circumstances under which individual
D was captured. This dugong was sighted in deep (> 10m), clear water off Nouméa. It did not
swim away from our catching vessel. Manually capturing individual D was very difficult
because atypically it was not followed and therefore not fatigued.
Filtered location points
Out of 16,262 location fixes, 6,241 filtered data locations were retained for analysis. The
number of filtered data locations for individual dugongs ranged between 33 and 2,720 locations
over the total tracking time for each individual. An average of 14 filtered data points was
obtained per animal per day (± SE = 0.94; Table 4.2). Individual variation was low within each
study region, ranging from 16 to 21 filtered data points per individual in Ouano, 11 to 13
Christophe Cleguer
72
filtered data points per individual in Nouméa and 10 to 16 filtered data points per individual in
Cap Goulvain. The number of locations was fairly evenly distributed between day (48% of
locations obtained between 6am and 6pm) and night (52% of locations obtained between 6pm
and 6am) throughout the tracking period of all individuals (Table 4.2).
Tracking duration and distance from capture location
Individual dugongs were tracked for between three and 192 days (mean = 35.9 days,
median = 18 days, ± SE = 15.31 days, n = 12 individuals; Table 4.2). The extent of movements
for the tracked dugongs reflected the southeast/northwest orientations and width of the lagoons
(Figure 4.1). The extent of movements for the seven dugongs captured in Cap Goulvain
extended over 100km from the Koné Bay to the Bourail Bay (Figure 4.4). Movements of the
two dugongs captured near Ouano extended over 46km from Moindou in the north to Tenia Islet
in the South (Figure 4.5). There was an overlap, near Tenia Islet, between the areas traversed by
dugongs tracked from Ouano and that of dugongs tracked from Nouméa (Figure 4.1).
Movements of dugongs tracked near Nouméa extended south to Redika Island (25km south of
Nouméa Figure 4.6).
The tracked dugongs moved a mean maximum distance of 37.7km (± SE = 5.2) from their
capture location (range: 13.8km to 72.9km; Table 4.3). There was no significant relationship
between the maximum distance that the dugongs moved from their capture location and their
tracking period (Pearson’s correlation coefficient = -0.14). Individual I ranged farther from its
capture location than any other tracked dugong (Figure 4.4A and Table 4.3), going on a seven
day trip 73km north from Cap Goulvain into the Koniène coral reef-seagrass plateau before
swimming back to its capture location. The shortest distance a dugong moved away from its
capture location was 14km; individual H remained between Cap Goulvain and the Poya Pass
(Figure 4.4B and Table 4.3).
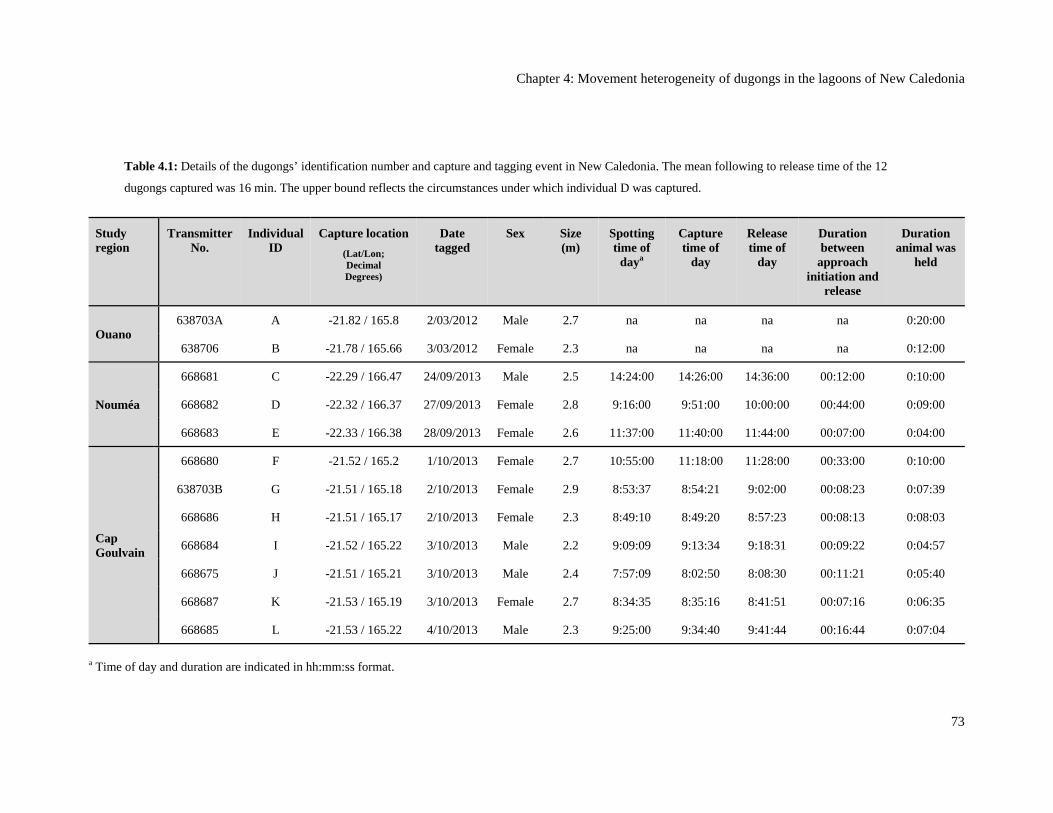
Chapter 4: Movement heterogeneity of dugongs in the lagoons of New Caledonia
73
Table 4.1: Details of the dugongs’ identification number and capture and tagging event in New Caledonia. The mean following to release time of the 12
dugongs captured was 16 min. The upper bound reflects the circumstances under which individual D was captured.
Study region
Transmitter No.
Individual ID
Capture location
(Lat/Lon; Decimal Degrees)
Date tagged
Sex Size (m)
Spotting time of
daya
Capture time of
day
Release time of
day
Duration between
approach initiation and
release
Duration animal was
held
Ouano 638703A A -21.82 / 165.8 2/03/2012 Male 2.7 na na na na 0:20:00
638706 B -21.78 / 165.66 3/03/2012 Female 2.3 na na na na 0:12:00
Nouméa
668681 C -22.29 / 166.47 24/09/2013 Male 2.5 14:24:00 14:26:00 14:36:00 00:12:00 0:10:00
668682 D -22.32 / 166.37 27/09/2013 Female 2.8 9:16:00 9:51:00 10:00:00 00:44:00 0:09:00
668683 E -22.33 / 166.38 28/09/2013 Female 2.6 11:37:00 11:40:00 11:44:00 00:07:00 0:04:00
Cap Goulvain
668680 F -21.52 / 165.2 1/10/2013 Female 2.7 10:55:00 11:18:00 11:28:00 00:33:00 0:10:00
638703B G -21.51 / 165.18 2/10/2013 Female 2.9 8:53:37 8:54:21 9:02:00 00:08:23 0:07:39
668686 H -21.51 / 165.17 2/10/2013 Female 2.3 8:49:10 8:49:20 8:57:23 00:08:13 0:08:03
668684 I -21.52 / 165.22 3/10/2013 Male 2.2 9:09:09 9:13:34 9:18:31 00:09:22 0:04:57
668675 J -21.51 / 165.21 3/10/2013 Male 2.4 7:57:09 8:02:50 8:08:30 00:11:21 0:05:40
668687 K -21.53 / 165.19 3/10/2013 Female 2.7 8:34:35 8:35:16 8:41:51 00:07:16 0:06:35
668685 L -21.53 / 165.22 4/10/2013 Male 2.3 9:25:00 9:34:40 9:41:44 00:16:44 0:07:04
a Time of day and duration are indicated in hh:mm:ss format.

Christophe Cleguer
74
Table 4.2: Tracking period and details for each dugong on the numbers (No) of total and filtered location points and their 95% home-range and 50% core area
sizes. The number of location points was evenly distributed between day (48% of locations obtained between 6am and 6pm) and night (52% of locations
obtained between 6pm and 6am). Values of the Utilisation Distribution Overlap Indexes (UDOI) close to or ≥ 1 show that there was a high degree of overlap
between day and night 95% home-ranges and 50% core areas (also see Figure 4.11). The 95% home-range, 50% core areas and UDOI were not calculated for
the dugongs with short tracking periods (i.e., ≤ 7 days); (na).
Study region
Individual ID
Tracking period (days)
No of filtered location points
Mean No of location points
per day
No of filtered location points
(day)
No of filtered location points
(night)
95% home-range
50% core area
UDOI
Ouano A 26 535 21 252 283 45.60 5.00 1.37
B 21 356 16 152 204 117.40 17.40 1.46
Nouméa C 3 33 11 15 18 na na na
D 13 156 12 83 73 455.80 47.20 1.25
E 40 505 13 242 263 250.30 12.30 2.02
Cap Goulvain
F 12 137 11 74 63 206.00 42.60 1.20
G 7 67 10 34 33 na na na
H 20 261 13 132 129 74.10 12.60 0.91
I 16 191 13 102 89 82.10 3.90 4.66
J 76 1223 16 582 641 12.80 1.00 1.88
K 5 57 11 32 25 na Na na
L 192 2720 16 1305 1415 12.40 2.30 1.18
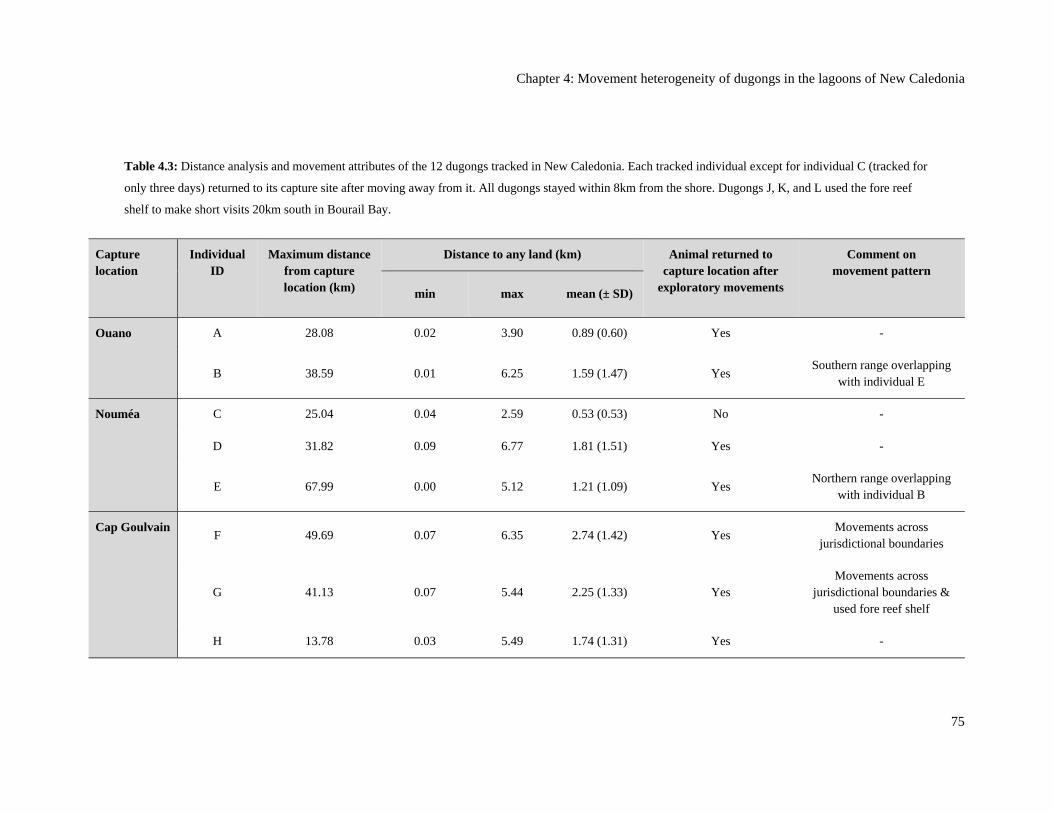
Chapter 4: Movement heterogeneity of dugongs in the lagoons of New Caledonia
75
Table 4.3: Distance analysis and movement attributes of the 12 dugongs tracked in New Caledonia. Each tracked individual except for individual C (tracked for
only three days) returned to its capture site after moving away from it. All dugongs stayed within 8km from the shore. Dugongs J, K, and L used the fore reef
shelf to make short visits 20km south in Bourail Bay.
Capture location
Individual ID
Maximum distance from capture location (km)
Distance to any land (km) Animal returned to capture location after
exploratory movements
Comment on movement pattern
min max mean (± SD)
Ouano A 28.08 0.02 3.90 0.89 (0.60) Yes -
B 38.59 0.01 6.25 1.59 (1.47) Yes Southern range overlapping
with individual E
Nouméa C 25.04 0.04 2.59 0.53 (0.53) No -
D 31.82 0.09 6.77 1.81 (1.51) Yes -
E 67.99 0.00 5.12 1.21 (1.09) Yes Northern range overlapping
with individual B
Cap Goulvain F 49.69 0.07 6.35 2.74 (1.42) Yes
Movements across jurisdictional boundaries
G 41.13 0.07 5.44 2.25 (1.33) Yes Movements across
jurisdictional boundaries & used fore reef shelf
H 13.78 0.03 5.49 1.74 (1.31) Yes -
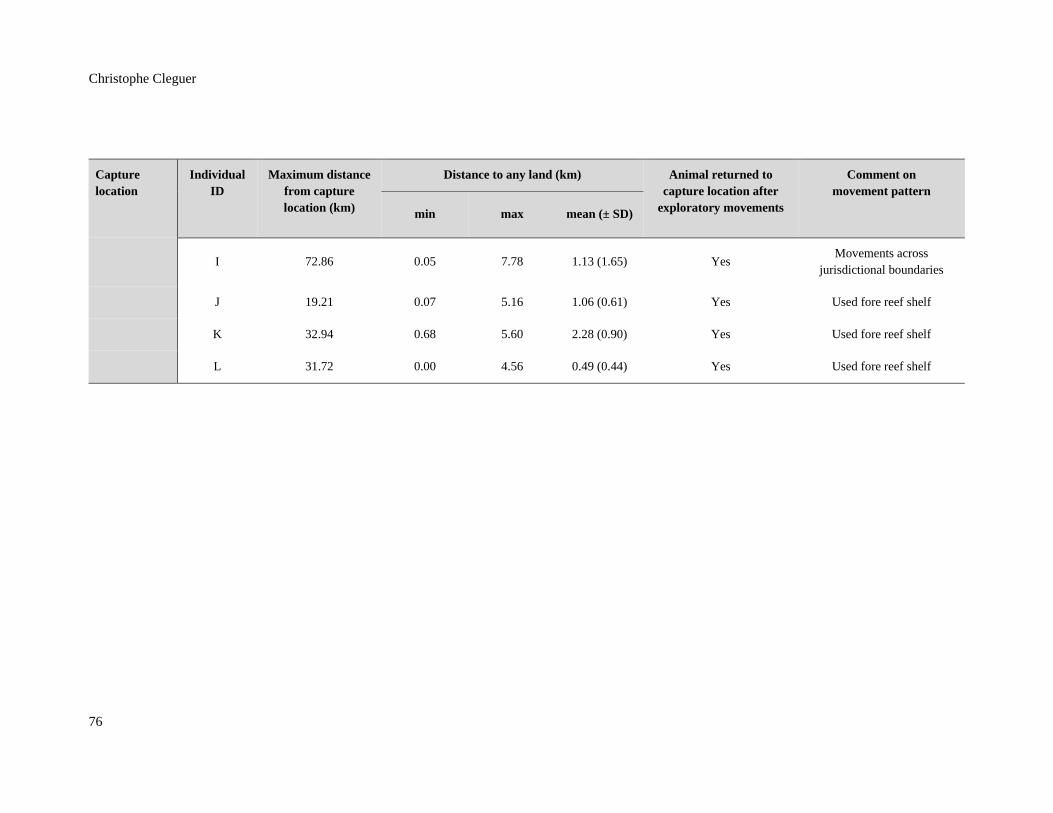
Christophe Cleguer
76
Capture location
Individual ID
Maximum distance from capture location (km)
Distance to any land (km) Animal returned to capture location after
exploratory movements
Comment on movement pattern
min max mean (± SD)
I 72.86 0.05 7.78 1.13 (1.65) Yes Movements across
jurisdictional boundaries
J 19.21 0.07 5.16 1.06 (0.61) Yes Used fore reef shelf
K 32.94 0.68 5.60 2.28 (0.90) Yes Used fore reef shelf
L 31.72 0.00 4.56 0.49 (0.44) Yes Used fore reef shelf
Chapter 4: Movement heterogeneity of dugongs in the lagoons of New Caledonia
77
Movement patterns, home-ranges and core areas
Cap Goulvain
The seven dugongs tracked in Cap Goulvain had individualistic movement patterns. Thus each
dugong showed movement patterns different from all others (i.e., different direction and scale of
movements among individuals; Figure 4.4A-C). Three dugongs (F, H and I) moved north
(Figure 4.4A, B), whereas individuals J, K and L spent their tracking time between their capture
locations and Bourail Bay located approximately 20km to the south (Figure 4.4C). Individuals J,
K, and L travelled from Cap Goulvain to Bourail Bay along the fore reef shelf near the barrier
reef outside the lagoon with no evidence of stopping.
Data from five of the seven tracked dugongs were used in the home-range and core area
analysis. The home-range and core areas of four dugongs (H, I, J, L) were small. Their 95%
home-range areas ranged from 12.4km2 to 82.1km2 (median = 43.5km2; Figure 4.7 and Table
4.2) and their 50% core areas ranged between 1km2 and 12.6km2 (Figure 4.4E and Figure 4.7).
The fifth dugong (I) had a substantially larger home-range (95% home-range of 206km2 and a
50% core area of 42.6km2; Table 4.2). The areas most intensively used by dugongs tracked in
Cap Goulvain were located in the bay of Cap Goulvain, between Cap Goulvain and the Poya
Pass, around the Mueo Pass and on top of coral reef plateaus located north of the Pindai
Peninsula (Figure 4.4E).

Christophe Cleguer
78
Figure 4.4: Details of the movement patterns and use of space by dugongs captured in Cap Goulvain
using the total tracking period of each tracked individual. Figures A, B and C show the movement
patterns of the seven dugongs tracked in the Cap Goulvain region. The maps were separated to aid visual
representation. Triangles display the capture location of each individual. Figure D shows the GPS-QFP
location fixes of individual L that moved from Cap Goulvain to Bourail Bay using the fore reef shelf
outside the lagoon. Figure E shows the combined 50% core areas and 95% home-ranges of six of the
seven dugongs captured in Cap Goulvain (Individual G’s tracking duration was regarded as a too short
tracking period to undertake meaningful analysis of home-range). These 50% core areas and 95% home-
ranges were not weighted for the tracking period of each tracked dugong as the aim of the figure was to
provide an indication of the combined area used by dugongs in the region. Note that light brown
represents the land, dark grey represents the barrier reef, and light grey represents reefs inside the
lagoons.
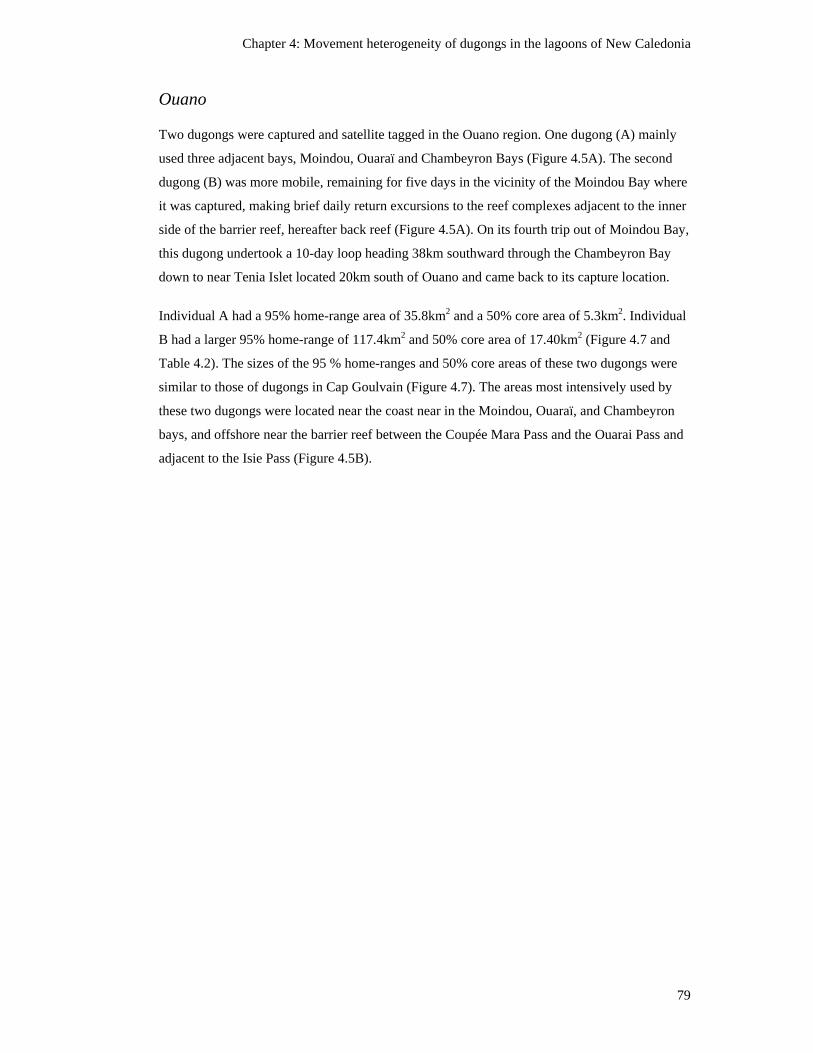
Chapter 4: Movement heterogeneity of dugongs in the lagoons of New Caledonia
79
Ouano
Two dugongs were captured and satellite tagged in the Ouano region. One dugong (A) mainly
used three adjacent bays, Moindou, Ouaraï and Chambeyron Bays (Figure 4.5A). The second
dugong (B) was more mobile, remaining for five days in the vicinity of the Moindou Bay where
it was captured, making brief daily return excursions to the reef complexes adjacent to the inner
side of the barrier reef, hereafter back reef (Figure 4.5A). On its fourth trip out of Moindou Bay,
this dugong undertook a 10-day loop heading 38km southward through the Chambeyron Bay
down to near Tenia Islet located 20km south of Ouano and came back to its capture location.
Individual A had a 95% home-range area of 35.8km2 and a 50% core area of 5.3km2. Individual
B had a larger 95% home-range of 117.4km2 and 50% core area of 17.40km2 (Figure 4.7 and
Table 4.2). The sizes of the 95 % home-ranges and 50% core areas of these two dugongs were
similar to those of dugongs in Cap Goulvain (Figure 4.7). The areas most intensively used by
these two dugongs were located near the coast near in the Moindou, Ouaraï, and Chambeyron
bays, and offshore near the barrier reef between the Coupée Mara Pass and the Ouarai Pass and
adjacent to the Isie Pass (Figure 4.5B).
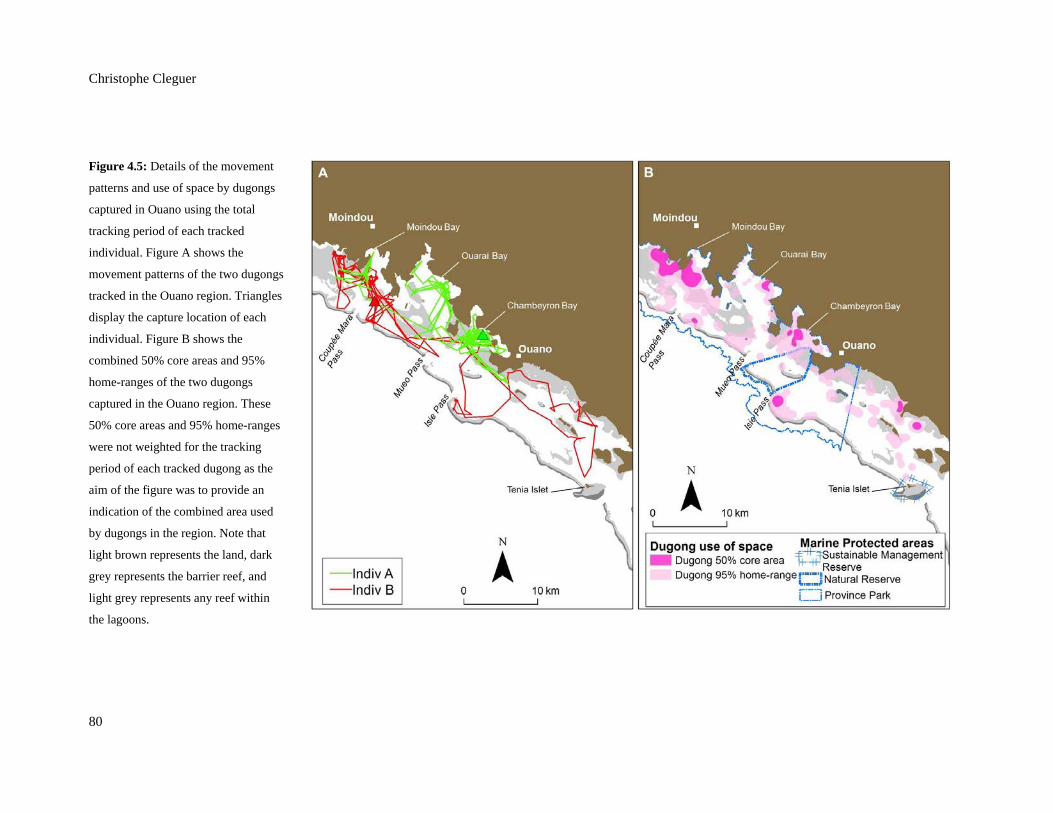
Christophe Cleguer
80
Figure 4.5: Details of the movement
patterns and use of space by dugongs
captured in Ouano using the total
tracking period of each tracked
individual. Figure A shows the
movement patterns of the two dugongs
tracked in the Ouano region. Triangles
display the capture location of each
individual. Figure B shows the
combined 50% core areas and 95%
home-ranges of the two dugongs
captured in the Ouano region. These
50% core areas and 95% home-ranges
were not weighted for the tracking
period of each tracked dugong as the
aim of the figure was to provide an
indication of the combined area used
by dugongs in the region. Note that
light brown represents the land, dark
grey represents the barrier reef, and
light grey represents any reef within
the lagoons.
Chapter 4: Movement heterogeneity of dugongs in the lagoons of New Caledonia
81
Nouméa
Three dugongs were captured and satellite tagged in the Nouméa region. The movements of the
tracked dugongs were also individualistic. One dugong (D) undertook three trips in three
different areas of the Nouméa region (Figure 4.6A). On its first trip, individual D undertook a
five-day loop to Plum Bay located south of Nouméa and then returned to its capture location.
One day after its return to its capture location this dugong undertook a three-day loop to Ndié
Islet, then Ndue Islet and Mba Islet before swimming back to Maître Islet. Finally, a day after
its second return to its capture location individual D headed south and remained north of
Amédée Islet over a day before swimming back to Maître Islet. Individual E commuted twice
between the area near Maître Islet and Puen Islet where it spent most of its tracking time (Figure
4.6A). Individual C swam southward and very close to the coast (mean distance from coastline
0.53km SD 0.53) during two days before its satellite tag stopped transmitting.
The home-ranges of individuals D and E were substantially greater than those of dugongs
tracked in Cap Goulvain and Ouano (Figure 4.7 and Table 4.2). Individual D used a 95% home-
range of 455.8km2 and a 50% core area 47.2km2 (Figure 4.7). The 95% home-range of
individual E was 250.3km2 and its 50% core area was 12.3km2. The areas most used by the
tracked dugongs were located at their capture site Maître Islet, in the Plum Bay, near Amédée
Islet, and adjacent to Puen Islet approximately 60km north of Nouméa (Figure 4.6B).
Christophe Cleguer
82
Figure 4.6: Details of the movement
patterns and use of space by dugongs
captured in Nouméa using the total
tracking period of each tracked individual.
Figure A shows the movement patterns of
the three dugongs tracked in the Nouméa
region. Triangles display the capture
location of each individual. Figure B
shows the combined 50% core areas and
95% home-ranges of two dugongs
captured in the Nouméa region (Individual
C’s tracking period was regarded as a too
short for meaningful analysis of its home-
range). These 50% core areas and 95%
home-ranges were not weighted for the
tracking period of each tracked dugong as
the aim of the figure was to provide an
indication of the combined area used by
dugongs in the region. Note that light
brown represents the land, dark grey
represents the barrier reef, and light grey
represents any reef within the lagoons.
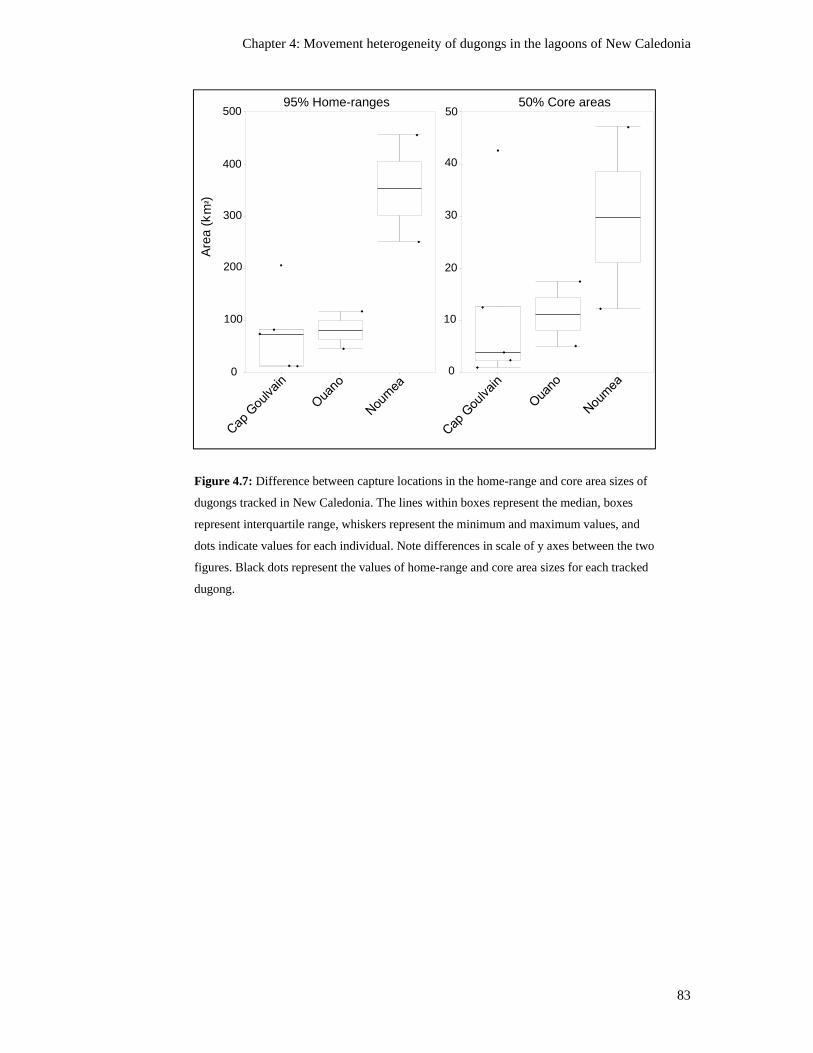
Chapter 4: Movement heterogeneity of dugongs in the lagoons of New Caledonia
83
Figure 4.7: Difference between capture locations in the home-range and core area sizes of
dugongs tracked in New Caledonia. The lines within boxes represent the median, boxes
represent interquartile range, whiskers represent the minimum and maximum values, and
dots indicate values for each individual. Note differences in scale of y axes between the two
figures. Black dots represent the values of home-range and core area sizes for each tracked
dugong.
95% Home-ranges 50% Core areas
Are
a(k
m2 )
0
100
200
300
400
500
0
10
20
30
40
50
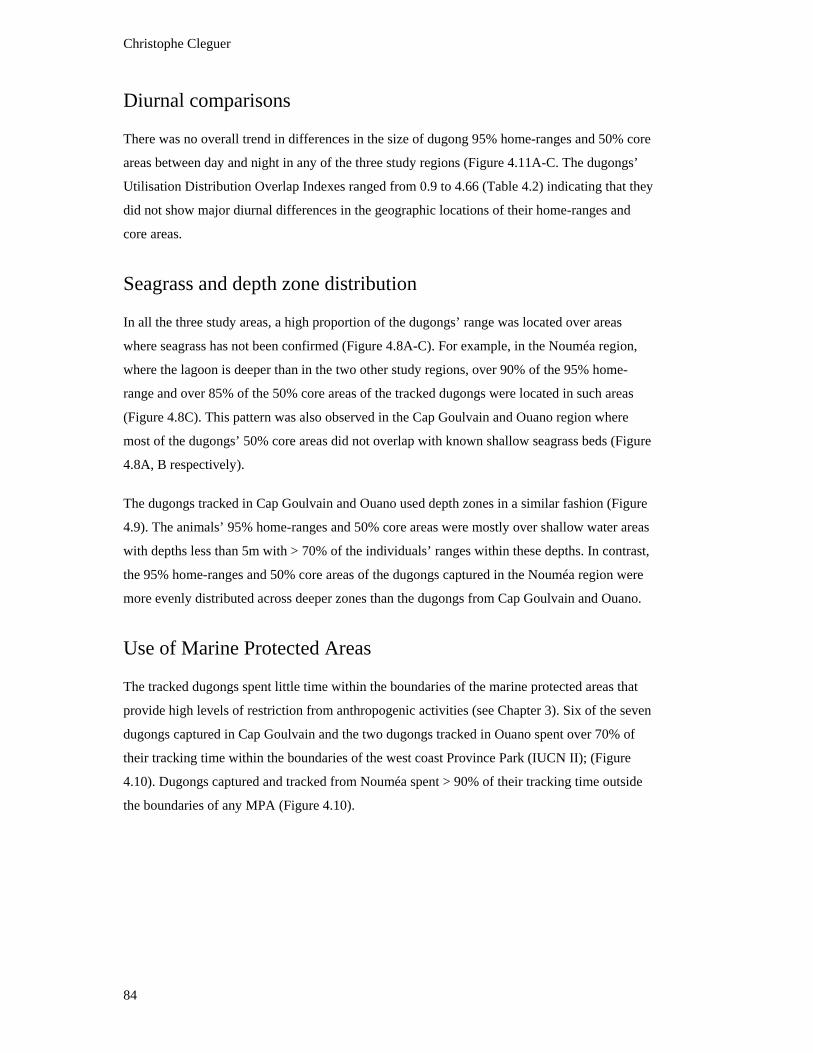
Christophe Cleguer
84
Diurnal comparisons
There was no overall trend in differences in the size of dugong 95% home-ranges and 50% core
areas between day and night in any of the three study regions (Figure 4.11A-C. The dugongs’
Utilisation Distribution Overlap Indexes ranged from 0.9 to 4.66 (Table 4.2) indicating that they
did not show major diurnal differences in the geographic locations of their home-ranges and
core areas.
Seagrass and depth zone distribution
In all the three study areas, a high proportion of the dugongs’ range was located over areas
where seagrass has not been confirmed (Figure 4.8A-C). For example, in the Nouméa region,
where the lagoon is deeper than in the two other study regions, over 90% of the 95% home-
range and over 85% of the 50% core areas of the tracked dugongs were located in such areas
(Figure 4.8C). This pattern was also observed in the Cap Goulvain and Ouano region where
most of the dugongs’ 50% core areas did not overlap with known shallow seagrass beds (Figure
4.8A, B respectively).
The dugongs tracked in Cap Goulvain and Ouano used depth zones in a similar fashion (Figure
4.9). The animals’ 95% home-ranges and 50% core areas were mostly over shallow water areas
with depths less than 5m with > 70% of the individuals’ ranges within these depths. In contrast,
the 95% home-ranges and 50% core areas of the dugongs captured in the Nouméa region were
more evenly distributed across deeper zones than the dugongs from Cap Goulvain and Ouano.
Use of Marine Protected Areas
The tracked dugongs spent little time within the boundaries of the marine protected areas that
provide high levels of restriction from anthropogenic activities (see Chapter 3). Six of the seven
dugongs captured in Cap Goulvain and the two dugongs tracked in Ouano spent over 70% of
their tracking time within the boundaries of the west coast Province Park (IUCN II); (Figure
4.10). Dugongs captured and tracked from Nouméa spent > 90% of their tracking time outside
the boundaries of any MPA (Figure 4.10).
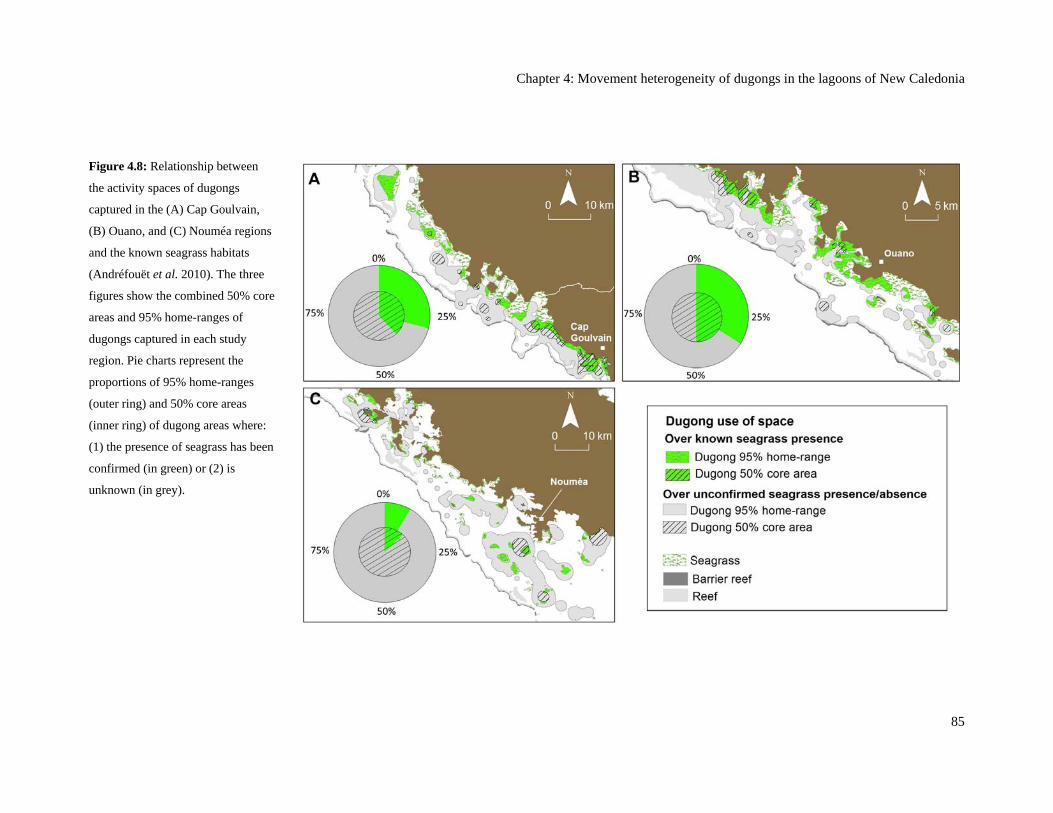
Chapter 4: Movement heterogeneity of dugongs in the lagoons of New Caledonia
85
Figure 4.8: Relationship between
the activity spaces of dugongs
captured in the (A) Cap Goulvain,
(B) Ouano, and (C) Nouméa regions
and the known seagrass habitats
(Andréfouët et al. 2010). The three
figures show the combined 50% core
areas and 95% home-ranges of
dugongs captured in each study
region. Pie charts represent the
proportions of 95% home-ranges
(outer ring) and 50% core areas
(inner ring) of dugong areas where:
(1) the presence of seagrass has been
confirmed (in green) or (2) is
unknown (in grey).
Christophe Cleguer
86
Figure 4.9: Proportion of the 95% home ranges and 50% core areas of
dugongs across depth zones in New Caledonia.
0102030405060708090
100
Prop
ortio
n(%
,SE
)±
Cap Goulvain Ouano Noumea
0102030405060708090
100
0<5 5-10 10-15 15-20 >20Depth zones
95% Home-range
50% Core area
Prop
ortio
n(%
,SE
)±
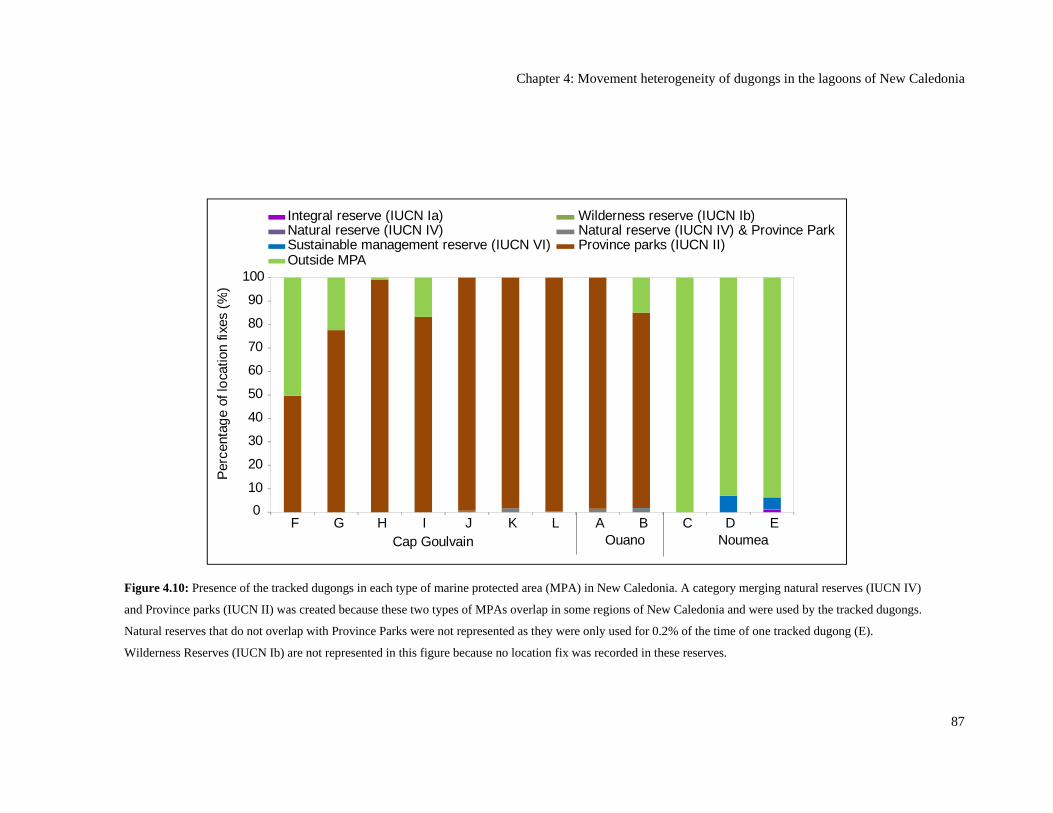
Chapter 4: Movement heterogeneity of dugongs in the lagoons of New Caledonia
87
Figure 4.10: Presence of the tracked dugongs in each type of marine protected area (MPA) in New Caledonia. A category merging natural reserves (IUCN IV)
and Province parks (IUCN II) was created because these two types of MPAs overlap in some regions of New Caledonia and were used by the tracked dugongs.
Natural reserves that do not overlap with Province Parks were not represented as they were only used for 0.2% of the time of one tracked dugong (E).
Wilderness Reserves (IUCN Ib) are not represented in this figure because no location fix was recorded in these reserves.
0
10
20
30
40
50
60
70
80
90
100
F G H I J K L A B C D E
Per
cent
age
of lo
catio
n fix
es (
%)
Integral reserve (IUCN Ia) Wilderness reserve (IUCN Ib)Natural reserve (IUCN IV) Natural reserve (IUCN IV) & Province ParkSustainable management reserve (IUCN VI) Province parks (IUCN II)Outside MPA
Cap Goulvain Ouano Noumea
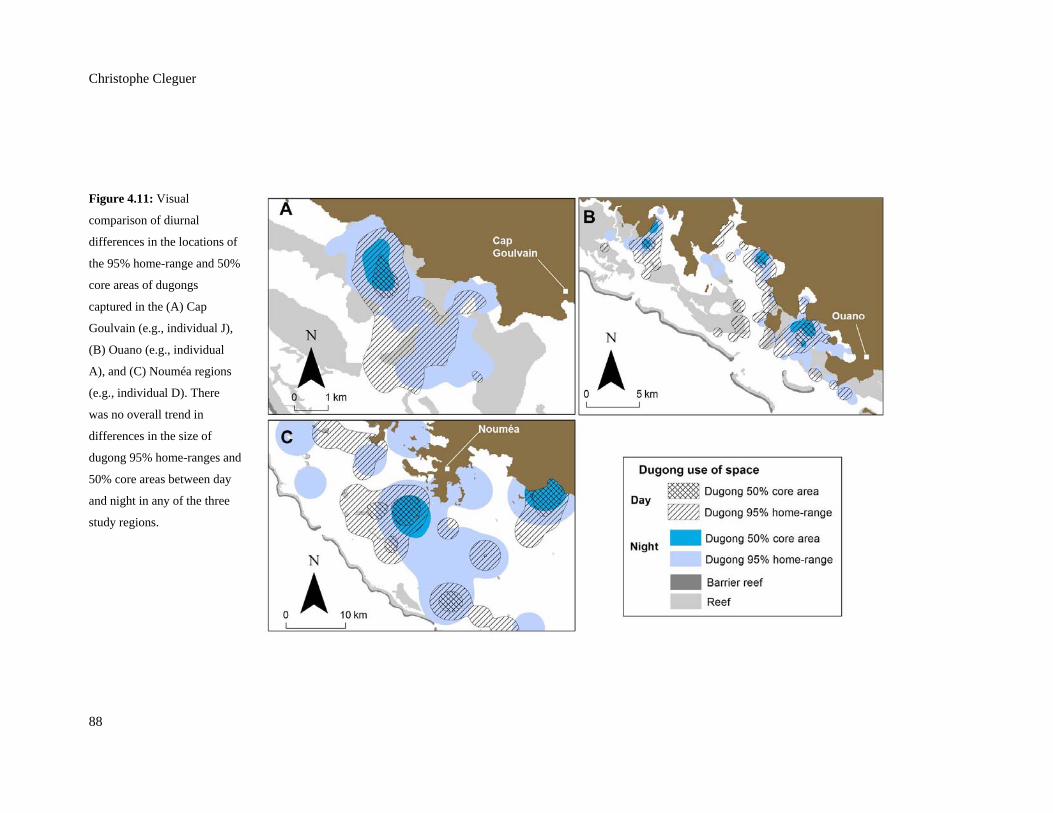
Christophe Cleguer
88
Figure 4.11: Visual
comparison of diurnal
differences in the locations of
the 95% home-range and 50%
core areas of dugongs
captured in the (A) Cap
Goulvain (e.g., individual J),
(B) Ouano (e.g., individual
A), and (C) Nouméa regions
(e.g., individual D). There
was no overall trend in
differences in the size of
dugong 95% home-ranges and
50% core areas between day
and night in any of the three
study regions.
Chapter 4: Movement heterogeneity of dugongs in the lagoons of New Caledonia
89
4.4 Discussion
Tracking of dugongs in New Caledonia confirmed that they display a high variability in the
movement patterns, as observed in other regions (Marsh and Rathbun 1990; De Iongh et al.
1998; Holley 2006; Sheppard et al. 2006; Gredzens et al. 2014). All but one tracked dugong
returned to their capture site after undertaking a trip. Some dugongs crossed Provincial
boundaries. Dugongs swam within as well as outside the lagoon to transit between important
habitats. Collectively, these results show that dugongs present a management challenge in New
Caledonia because of the complexity of their movement behaviours across several spatial scales
(see Chapter 6).
Individuality and scale of movements
The dugongs I tracked for this study all exhibited individualistic movements. Whereas some
animals displayed sedentary behaviour, others swam over large distances and moved up to
70km from their capture site (Table 4.3). In sub-tropical and tropical waters of Queensland and
the Northern Territory in Australia dugongs also exhibited heterogeneous movements ranging
from small scale commuting movements (< 15km, n = 26 individuals) to large scale moves (>
15km, n = 44 individuals; Sheppard et al. 2006). Small scale commuting movements versus
exploratory large scale movements were also reported in Torres Strait (Gredzens et al. 2014). In
the tropical Lease Islands in east Indonesia, dugongs exhibited similar heterogeneous movement
patterns ranging 17-65km from their capture sites (De Iongh et al. 1998).
All the large scale movements of the satellite-tracked dugongs that I studied involved animals of
both sexes. In contrast, a dugong pedigree analysis across several bays along the east coast of
Australia based on a much larger sample size (n = 1002 dugongs) suggests that male dugongs
move between populations more than females (Cope et al. 2015). My sample size is too small to
test whether this phenomenon also applies in New Caledonia.
Some of the movement of the tracked dugongs may be attributable to flight responses. For
example, Individuals K and I (captured in the Cap Goulvain region) undertook large scale
movements less than a day after they were captured. In contrast, individual L swam from Cap
Goulvain to Bourail Bay using the fore reef shelf 110 days after it was captured, suggesting that
not all movements can be explained by flight responses a result consistent with other dugong
satellite tracking studies (Sheppard et al. 2006; Gredzens et al. 2014; Zeh et al. in review).

Christophe Cleguer
90
Regional comparisons
The sizes and depth distribution of the tracked dugongs’ home-ranges differed among the three
study regions with dugong ranges in the Nouméa region being several times larger than those in
Cap Goulvain and Ouano in the mid-west lagoon (mean range in Nouméa = 353.1km2, Ouano
mean = 81.5km2, Cap Goulvain mean = 77.5km2). Dugongs in the Nouméa region used deeper
waters (> 10m) with 70% of the tracked individuals’ 95% home-ranges located in such waters.
Substantial regional differences in dugong range sizes and water depth use have also been
observed in Australia. For example, the range of dugongs in Torres Strait, a vast dugong habitat
(see Figure 5.1A), was much higher (median = 942.6km2) than the range of dugongs along the
east coast (Shoalwater Bay, median = 60.6km2; Gredzens et al. 2014).
The lagoon in the Nouméa region is wide and provides large subtidal areas of relatively deep
water (> 10m) with shallow-water areas (< 10m) accounting for only a small proportion of the
region primarily restricted to reef tops around islets (Bonvallot et al. 2012). Most seagrasses in
Nouméa are subtidal (Garrigue 1995) although small reef tops and shallow inshore areas also
support dense seagrass pastures (Hily et al. 2010). The tracking data show that whereas the
dugongs tracked in the Nouméa region used reef tops (e.g., reef surrounding Maître Islet) and
shallow inshore waters adjacent to the city, they mostly remained in deeper subtidal areas. In
contrast, the Ouano and Cap Goulvain regions are characterised by much narrower lagoons and
seagrasses are mostly found in shallow inshore areas or over elevated reef flats. Differences in
the size and geomorphology of the lagoon and seagrass distribution may explain the smaller
range sizes of the dugongs tracked in Cap Goulvain and Ouano in comparison to the dugongs
tracked in the Nouméa region.
Use of deeper areas by dugongs in the Nouméa region may also be a response of anthropogenic
disturbance. There is evidence of dugongs killed by watercraft in front of Nouméa (ESCAL and
A2EP 2011; Claire Garrigue pers. comm.) but the frequency of such collisions is unknown.
Boat strike is responsible for the death of dugongs in many other parts of the dugong’s range
especially in regions where anthropogenic coastal activities are high (Marsh et al. 2012). For
example, in Moreton Bay which is adjacent to Brisbane -one of the largest cities in Australia-
dugongs are struck by boats typically in areas where both animals and boats are constrained to
narrow channels at low tide. Hodgson (2004) and Hodgson and Marsh (2007) studied the
response of dugongs to approaching boats. One of the primary responses of dugongs to the
sound of an approaching boat is to move towards deeper water. In Burrum Heads, north of
Hervey Bay, dugongs use deep subtidal waters during the day. Sheppard et al. (2007) suggested
that dugongs were discouraged from foraging close to the shore during the day because of the
high density of recreational boating traffic.

Chapter 4: Movement heterogeneity of dugongs in the lagoons of New Caledonia
91
Spatial heterogeneity in the use of space
The distribution of dugongs generally coincides broadly with that of seagrass beds (Marsh et al.
2002, 2012). The patchy nature of seagrasses mapped in the lagoons of New Caledonia partly
explains how dugongs used space during their tracking period. However, dugongs also
intensively used some areas where seagrasses have not been mapped but are likely to occur. For
example, the area around Maître Islet in front of Nouméa was intensively used by two tracked
dugongs. Seagrass was reported to be present in this area in early studies of the macrophyte
associations on the benthic habitats in the south-west lagoon (Garrigue 1995). But dugongs also
make intensive use of areas where seagrass is unlikely to be present including reef complexes
adjacent to the inner side of the barrier reef in Cap Goulvain and Ouano. The reasons for
dugongs to use such habitats are further investigated in Chapter 5.
Movement corridors
Sheppard et al. (2006) suggested that dugongs have evolved to cope with unpredictable and
patchy seagrass abundance by making directed movements to alternative areas. My findings
support this hypothesis and suggest that dugongs maintain a spatial memory of specific habitat
hotspots which may include patches of seagrass food resources that they visit periodically. I
identified directed dugong movements with no evidence of stopping. For example, individuals J,
K, and L tagged in Cap Goulvain used the fore reef shelf, a non-seagrass coral reef habitat
located outside the lagoon, to make return trips to the Bourail Bay. In the Nouméa region,
individual E captured near Maître undertook two return trips using very similar routes to visit
the area near Puen Islet approximately 60km away. This dugong bypassed areas that were
identified as important dugong habitats by aerial survey data (Chapter 3). Similar patterns of
dugong movements with no evidence of stop overs to feed have been reported in Australia. For
example, two dugongs undertook one day return ‘visits’ from Hinchinbrook Island to Cleveland
Bay located 150km to the south without exploring any known seagrass meadows en route
(Sheppard et al. 2006). Another two dugongs moved from Hervey Bay to Great Keppel Island
and Clearview respectively, bypassing Rodds Bay an area of high seagrass density (Sheppard et
al. 2006).
Although there is no evidence that dugongs show long-term social structure, the use of distinct
movement pathways and bypassing other habitats may reflect matrilineal transmitted learned
behaviours and spatial memory (Sheppard et al. 2006; Marsh et al. 2012). This hypothesis is
reinforced by tracking studies conducted on Florida manatees that showed that manatee calves
exhibited strong fidelity to areas frequented by their mothers (Deutsch et al. 2003).
Interestingly, most captive-raised Florida manatees released as sub-adults along the Atlantic

Christophe Cleguer
92
coast did not undertake seasonal migrations, despite migratory behaviour occurring in over 87%
of the wild population (Deutsch et al. 2003).
Movements of dugongs across large distances and using distinctive pathways also suggest great
capacity for orientation and navigation. I did not find any diurnal patterns in the movement and
home-ranges of dugongs in New Caledonia. For example, dugongs that transited between Cap
Goulvain and Bourail Bay swam during both day and night over the fore reef shelf. Recent
dugong movement studies in Moreton Bay (Zeh et al. 2015) and Torres Strait (Gredzens et al.
2014) obtained similar results.
The sensory modalities used by sirenians to navigate are unknown. But the limitations on vision
(Bauer et al. 2003) and a lack of active echolocation (Mann et al. 2005) suggest that other
sensory modalities play an important role in spatial orientation (Reep et al. 2002; Reep and
Sarko 2009; Reep et al. 2011). The tactile sensory modality is highly developed in sirenians
(Reep and Sarko 2009), especially their orofacial hair system. Reep et al. (2011) found that the
detection threshold levels of hydrodynamic stimuli of manatees using facial or post-facial
vibrissae were similar with the lateral line systems of some fish, a theory originally proposed by
Reynolds in 1980 (Reynolds pers. comm.). Facial and post-facial vibrissae of sirenians may
play a similar role as the lateral line system in fish (Dijkgraaf 1963; Bleckmann 1986) by aiding
them to detect conspecifics, water currents, tidal flows, and to explore the environment.
Manatees are known to have an exceptional acoustic sensitivity (Hartman 1979; Popov and
Supin 1990; Gerstein 2002). Coral reefs are associated with high levels of biological sound
generated by organisms such as shrimps and fishes in the range 0.4-4kHz (Cato 1978; Radford
et al. 2010). This range falls within the hearing capacity of manatees, ranging from about 200Hz
to 35-40kHz and presumably of dugongs which produce sounds in the range of 0.3kHz to
18kHz (Anderson and Barclay 1995). Thus, it is reasonable to hypothesize that dugongs may
use auditory cues while travelling, especially at night, in coral reef environments. Sirenian
tongues possess developed tastebuds which are more abundant than other marine mammals,
suggesting that tastebuds may function as receptors for chemical cues from the environment
(Levin and Pfeiffer 2002). However, navigation in dugongs remains largely unexplored and
requires further investigation.
Movements of dugongs between Cap Goulvain and the Bourail Bay may be limited by a
combination of geomorphological characteristics. The lagoon between Cap Goulvain and the
Bourail Bay is the narrowest (average width = 2km) and the shallowest (< 5m) around the main
island of New Caledonia. This lagoon is characterised by reticulated reef formations
(Andréfouët et al. 2004), which may impede movement of large animals like dugongs especially
Chapter 4: Movement heterogeneity of dugongs in the lagoons of New Caledonia
93
at low tide (see Chapter 5). There may be a risk of dugongs being ambushed by predators in
reticulated reef areas (see Chapter 5). These factors may explain why dugongs use the fore reef
shelf to commute between bays in this particular region.
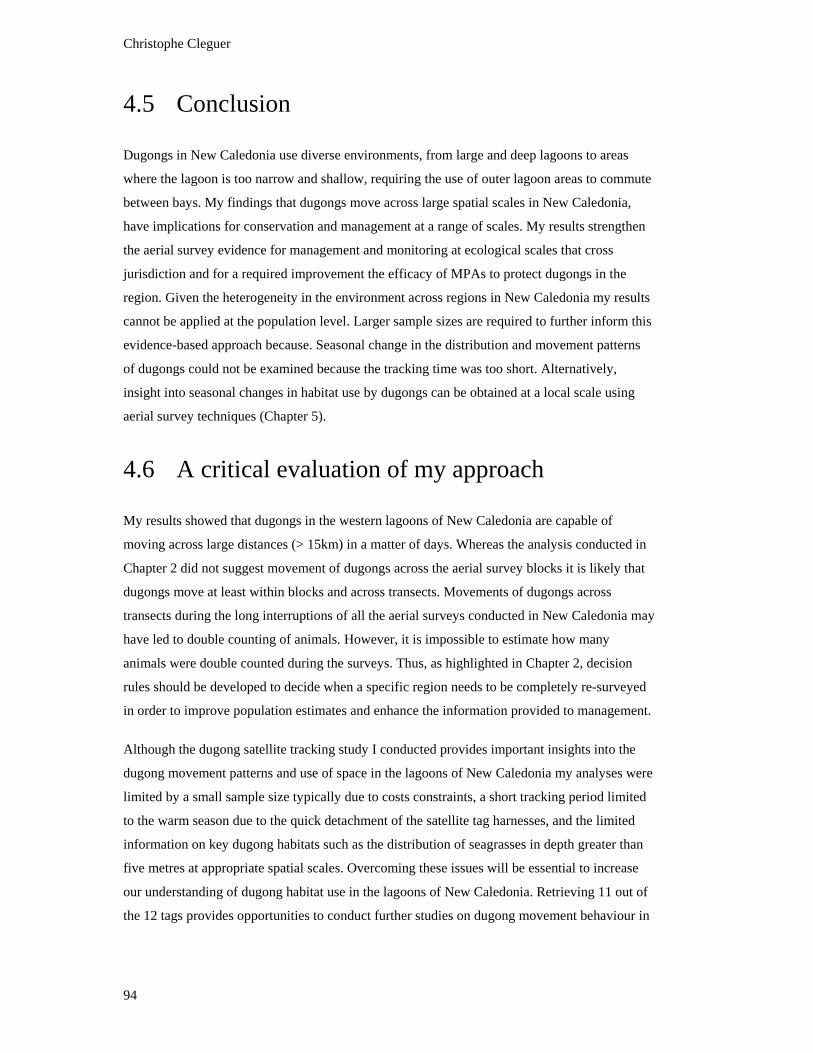
Christophe Cleguer
94
4.5 Conclusion
Dugongs in New Caledonia use diverse environments, from large and deep lagoons to areas
where the lagoon is too narrow and shallow, requiring the use of outer lagoon areas to commute
between bays. My findings that dugongs move across large spatial scales in New Caledonia,
have implications for conservation and management at a range of scales. My results strengthen
the aerial survey evidence for management and monitoring at ecological scales that cross
jurisdiction and for a required improvement the efficacy of MPAs to protect dugongs in the
region. Given the heterogeneity in the environment across regions in New Caledonia my results
cannot be applied at the population level. Larger sample sizes are required to further inform this
evidence-based approach because. Seasonal change in the distribution and movement patterns
of dugongs could not be examined because the tracking time was too short. Alternatively,
insight into seasonal changes in habitat use by dugongs can be obtained at a local scale using
aerial survey techniques (Chapter 5).
4.6 A critical evaluation of my approach
My results showed that dugongs in the western lagoons of New Caledonia are capable of
moving across large distances (> 15km) in a matter of days. Whereas the analysis conducted in
Chapter 2 did not suggest movement of dugongs across the aerial survey blocks it is likely that
dugongs move at least within blocks and across transects. Movements of dugongs across
transects during the long interruptions of all the aerial surveys conducted in New Caledonia may
have led to double counting of animals. However, it is impossible to estimate how many
animals were double counted during the surveys. Thus, as highlighted in Chapter 2, decision
rules should be developed to decide when a specific region needs to be completely re-surveyed
in order to improve population estimates and enhance the information provided to management.
Although the dugong satellite tracking study I conducted provides important insights into the
dugong movement patterns and use of space in the lagoons of New Caledonia my analyses were
limited by a small sample size typically due to costs constraints, a short tracking period limited
to the warm season due to the quick detachment of the satellite tag harnesses, and the limited
information on key dugong habitats such as the distribution of seagrasses in depth greater than
five metres at appropriate spatial scales. Overcoming these issues will be essential to increase
our understanding of dugong habitat use in the lagoons of New Caledonia. Retrieving 11 out of
the 12 tags provides opportunities to conduct further studies on dugong movement behaviour in
Chapter 4: Movement heterogeneity of dugongs in the lagoons of New Caledonia
95
New Caledonia at a reasonable cost because the tags I used can be redeployed after their
batteries are changed.
As expected, many GPS satellite tags remained attached to dugongs for only a short period of
time in New Caledonia because of the high likelihood of the tracking equipment entangling in
the coral reefs. The size of the tags currently used to track dugongs may partly explain why the
attachment apparatus gets easily entangled. Collaborative work with a wildlife tracking
company is underway to decrease the size of the tags and hence increase the chances of tracking
dugongs for longer periods.
I captured dugongs in high dugong density areas to increase my chances of capturing animals.
In Chapter 3, I highlighted that these high dugong density areas were poorly covered by MPAs
that provide high levels of restriction from anthropogenic activities. Thus, it was not unexpected
to find that the tracked dugongs spent little time within the boundaries of highly restrictive
MPAs. Nonetheless it would be very difficult to capture dugongs in MPAs with high levels of
restriction from anthropogenic activities because dugongs occur only in low densities in these
areas.
4.7 Chapter summary
Understanding the use of space in marine megafauna species has profound implications for
their conservation. The use of space by dugongs in coral reefs is poorly understood. Thus
investigating use of space by dugongs in the lagoons of New Caledonia enhances
understanding of dugong ecology in coral reef systems and informs the conservation and
management of the species in the region.
I used modern GPS satellite telemetry to examine the scale and heterogeneity in the use of
space by dugongs in the lagoons of New Caledonia by capturing 12 individuals in three
locations of high dugong conservation value.
My findings confirmed that dugongs display great variability in movement patterns and
range as established in other regions.
Dugongs moved as far as 70km from their capture location. Three of the seven dugongs
captured in Cap Goulvain crossed Provincial boundaries.
Dugongs swam within the lagoon as well as over the fore reef shelf outside the lagoon to
transit between bays. This is the first study documenting movements of dugongs on the
external edge of a barrier reef.
I found regional differences in the sizes and depth distribution of the tracked dugongs’
home-ranges with dugong ranges in the Nouméa region being several times larger than those
Christophe Cleguer
96
in Cap Goulvain and Ouano in the mid-west lagoon (mean range in Nouméa = 353.1km2,
Ouano mean = 81.5km2, Cap Goulvain mean = 77.5km2). Dugongs in the Nouméa region
used deeper waters with 70% of the tracked individuals’ 95% home-ranges located in waters
deeper than 10m.
There was no overall trend in differences in the size of dugong 95% home-ranges and 50%
core areas between day and night in any of the three study regions, indicating that dugongs
did not show major diurnal differences in the geographic locations of their home-ranges and
core areas.
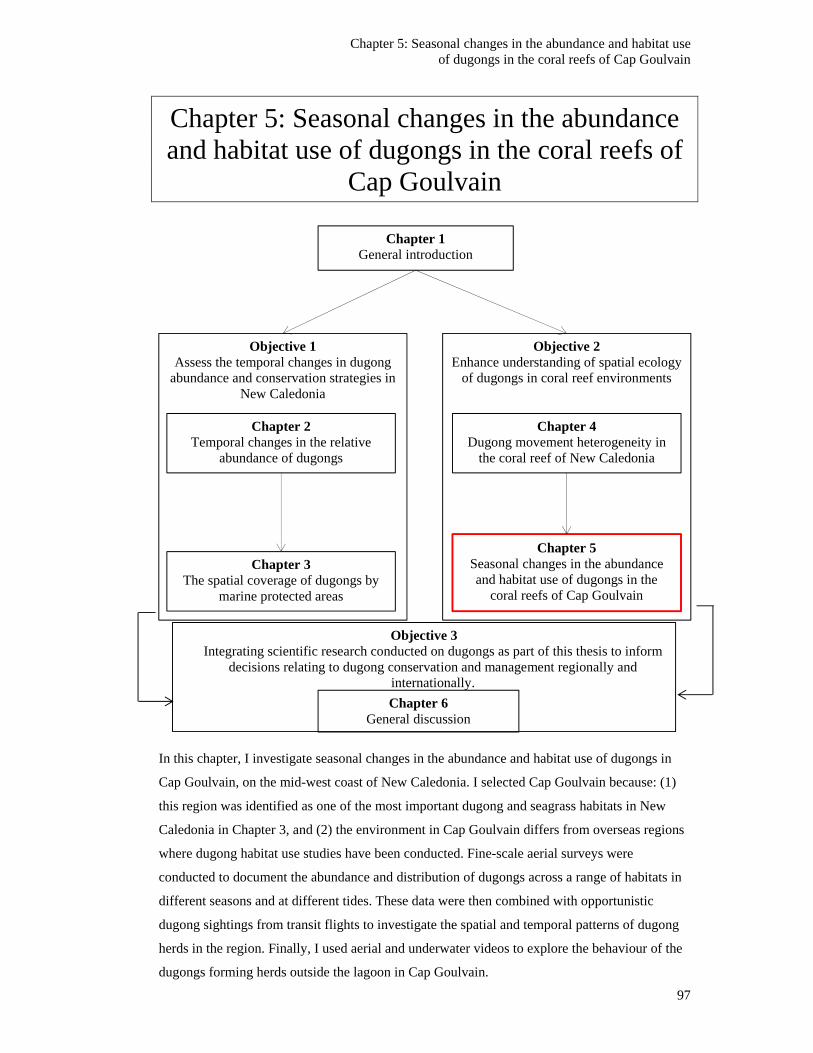
Chapter 5: Seasonal changes in the abundance and habitat use of dugongs in the coral reefs of Cap Goulvain
97
Chapter 5: Seasonal changes in the abundance and habitat use of dugongs in the coral reefs of
Cap Goulvain
In this chapter, I investigate seasonal changes in the abundance and habitat use of dugongs in
Cap Goulvain, on the mid-west coast of New Caledonia. I selected Cap Goulvain because: (1)
this region was identified as one of the most important dugong and seagrass habitats in New
Caledonia in Chapter 3, and (2) the environment in Cap Goulvain differs from overseas regions
where dugong habitat use studies have been conducted. Fine-scale aerial surveys were
conducted to document the abundance and distribution of dugongs across a range of habitats in
different seasons and at different tides. These data were then combined with opportunistic
dugong sightings from transit flights to investigate the spatial and temporal patterns of dugong
herds in the region. Finally, I used aerial and underwater videos to explore the behaviour of the
dugongs forming herds outside the lagoon in Cap Goulvain.
Objective 2 Enhance understanding of spatial ecology
of dugongs in coral reef environments
Objective 1 Assess the temporal changes in dugong
abundance and conservation strategies in New Caledonia
Chapter 1 General introduction
Chapter 2 Temporal changes in the relative
abundance of dugongs
Chapter 3 The spatial coverage of dugongs by
marine protected areas
Chapter 4 Dugong movement heterogeneity in
the coral reef of New Caledonia
Chapter 5 Seasonal changes in the abundance and habitat use of dugongs in the
coral reefs of Cap Goulvain
Chapter 6 General discussion
Objective 3 Integrating scientific research conducted on dugongs as part of this thesis to inform
decisions relating to dugong conservation and management regionally and internationally.
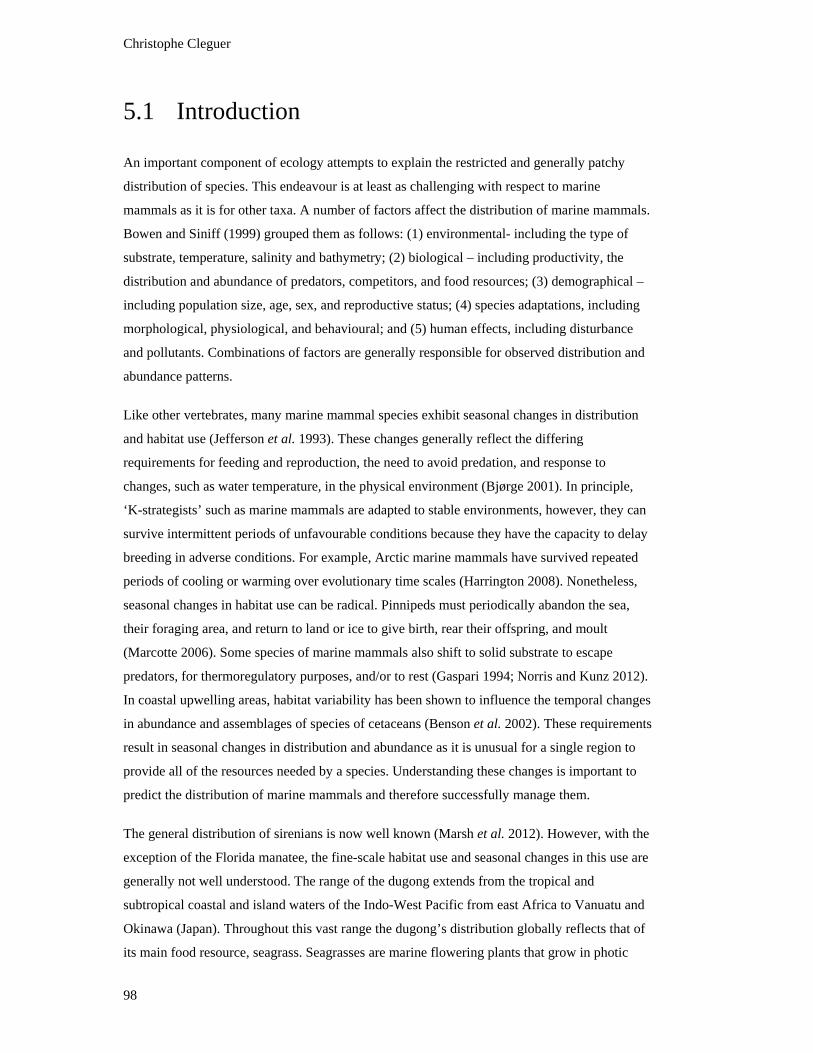
Christophe Cleguer
98
5.1 Introduction
An important component of ecology attempts to explain the restricted and generally patchy
distribution of species. This endeavour is at least as challenging with respect to marine
mammals as it is for other taxa. A number of factors affect the distribution of marine mammals.
Bowen and Siniff (1999) grouped them as follows: (1) environmental- including the type of
substrate, temperature, salinity and bathymetry; (2) biological – including productivity, the
distribution and abundance of predators, competitors, and food resources; (3) demographical –
including population size, age, sex, and reproductive status; (4) species adaptations, including
morphological, physiological, and behavioural; and (5) human effects, including disturbance
and pollutants. Combinations of factors are generally responsible for observed distribution and
abundance patterns.
Like other vertebrates, many marine mammal species exhibit seasonal changes in distribution
and habitat use (Jefferson et al. 1993). These changes generally reflect the differing
requirements for feeding and reproduction, the need to avoid predation, and response to
changes, such as water temperature, in the physical environment (Bjørge 2001). In principle,
‘K-strategists’ such as marine mammals are adapted to stable environments, however, they can
survive intermittent periods of unfavourable conditions because they have the capacity to delay
breeding in adverse conditions. For example, Arctic marine mammals have survived repeated
periods of cooling or warming over evolutionary time scales (Harrington 2008). Nonetheless,
seasonal changes in habitat use can be radical. Pinnipeds must periodically abandon the sea,
their foraging area, and return to land or ice to give birth, rear their offspring, and moult
(Marcotte 2006). Some species of marine mammals also shift to solid substrate to escape
predators, for thermoregulatory purposes, and/or to rest (Gaspari 1994; Norris and Kunz 2012).
In coastal upwelling areas, habitat variability has been shown to influence the temporal changes
in abundance and assemblages of species of cetaceans (Benson et al. 2002). These requirements
result in seasonal changes in distribution and abundance as it is unusual for a single region to
provide all of the resources needed by a species. Understanding these changes is important to
predict the distribution of marine mammals and therefore successfully manage them.
The general distribution of sirenians is now well known (Marsh et al. 2012). However, with the
exception of the Florida manatee, the fine-scale habitat use and seasonal changes in this use are
generally not well understood. The range of the dugong extends from the tropical and
subtropical coastal and island waters of the Indo-West Pacific from east Africa to Vanuatu and
Okinawa (Japan). Throughout this vast range the dugong’s distribution globally reflects that of
its main food resource, seagrass. Seagrasses are marine flowering plants that grow in photic
Chapter 5: Seasonal changes in the abundance and habitat use of dugongs in the coral reefs of Cap Goulvain
99
environments (Dawes 1998). Seagrass communities exhibit high spatial heterogeneity at a range
of scales (Coles et al. 2011). Thus, seagrass meadows form both continuous and fragmented
landscapes of varying nutritional quality interspersed with non-vegetated substrate (Hemminga
and Duarte 2000; Robbins and Bell 2000). As seagrass community specialists, dugongs have
presumably adapted their foraging strategies to cope with the spatial variability in their food
resource (Sheppard et al. 2007, 2009, 2010). However, little is known about how dugongs have
adapted to environments where seagrasses occur only in relatively small intertidal patches
accessible only at high tide.
Comprehensive studies designed specifically to examine dugong habitat use have mainly been
conducted in Australia, in regions where seagrass meadows are distributed over vast intertidal
and subtidal areas, often associated with coral reefs. In eastern Queensland, where most of the
studies of the interaction between dugongs and their habitats have been conducted, the shallow
(< 15m) seagrasses are distributed over more than 5,000km2 and it is expected that
approximately 40,000km2 of the seafloor in the Great Barrier Reef World Heritage Area deeper
than 15m supports some seagrass (Coles et al. 2007). In Torres Strait (Figure 5.1A) immediately
to the north of the Great Barrier Reef region and home of the world’s largest dugong population
(Marsh et al. 2012), Coles et al. (2003) estimated that there was least 13,000km2 of seagrass
distributed in the intertidal and subtidal zones. Taylor and Rasheed (2010) subsequently
discovered the largest recorded single continuous seagrass meadow in Australia (8,752km2) to
the west of this region in 2010.
The environment is very different in other parts of the dugong’s range. For example in Okinawa
(Japan), Palau, Mayotte, Madagascar, and the Pacific Islands such as New Caledonia, dugongs
are observed in locations where the width of the continental shelf is narrow (i.e., tens of
kilometres). In these regions, seagrasses are found on coral reef flats in lagoons protected by
tropical barrier reefs (Short et al. 2007). The width of these lagoons ranges from a few
kilometres to tens of kilometres (Pinet 2011). How dugongs have adapted to these environments
especially where lagoons are narrow and seagrasses located on top of reefs are available only at
high tide has not been studied.
Studies at both the eastern and western southern limits to the dugong’s range in Australia,
Moreton Bay in South-east Queensland and Shark Bay in Western Australia indicate that
several environmental variables are associated with changes in dugong distribution and habitat
use. In Moreton Bay, Preen (1992) used aerial survey data to explore the environmental
variables associated with the distribution and abundance of dugongs. During winter, dugongs
were more likely to be in waters warmer than 19°C than in areas where water temperatures were
lower and in areas with easy access to deep water rather than in areas where deep water was
Christophe Cleguer
100
Figure 5.1: Torres Strait, north of Australia (A) and Cap Goulvain on the mid-west coast of
the main island of New Caledonia (B), both important dugong areas comprising seagrass
communities associated with coral reefs with very different environments. Torres Strait is a
very important seagrass habitat that includes intertidal seagrass meadows on top of reef
flats and the largest single continuous seagrass meadow in Australia (8,752km2; Taylor and
Rasheed 2010) whereas in Cap Goulvain the 17.4km2 intertidal seagrass meadow is
distributed over small coral reef plateaus and space is limited by a narrow lagoon. Note (1)
differences in scale between the two figures; and (2) that the extent of the seagrass
communities in Torres Strait is vastly underestimated in Figure (A). Satellite images
source: in software ARCGIS 10.2 (ESRI 2013).
further away, presumably to facilitate escape from large sharks. Dugongs were generally more
likely to be associated with seagrass meadows dominated by species of Halophila except in
winter when habitats dominated by Zostera capricorni, channels and the area immediately
outside South Passage leading into the Bay were preferred. The distribution of dugongs did not
vary among years and was not affected by the presence of boats. In Shark Bay, dugong
distribution also varied seasonally apparently in response to water temperature (Anderson 1986;
1994; Holley 2006; Holley et al. 2006). At finer spatial scales, changes in habitat use by
dugongs in the eastern Gulf of Shark Bay were attributed to the risk of predation from tiger
sharks (Galeocerdo cuvier) by Wirsing et al. (a-d). The potential influence of water temperature
on the fine-scale habitat use of dugongs was dismissed by Wirsing et al. (2007d) based on the
Chapter 5: Seasonal changes in the abundance and habitat use of dugongs in the coral reefs of Cap Goulvain
101
fact that dugongs were sighted with some regularity in the study area even when water
temperatures were below the proposed lower physiological threshold for dugongs (i.e., 19°C);
(Anderson 1986). This explanation did not consider the possible energetic advantages of
behavioural thermoregulation (Cossins and Bowler 1987; Terrien et al. 2011). Nonetheless,
these findings collectively suggest that the use of seagrass habitats by dugongs is influenced by
factors other than the prevalence and community structure of seagrass per se including water
temperature and the risk of predation.
Located on the mid-west coast of the main island of New Caledonia, Cap Goulvain is home to
one of the largest intertidal seagrass meadows (17km2) and highest densities of dugongs in New
Caledonia (Payri et al. 2005; also see Chapters 2 and 3). In this region, the lagoon is narrow (up
to 4km) and accessibility to intertidal seagrasses is restricted by tides, forcing dugongs to use
adjacent non-seagrass coral reef habitats at low tide.
There are a variety of non-seagrass coral reef habitats adjacent to the seagrass beds in Cap
Goulvain. One such habitat is the fore reef shelf, a flattened coral reef area, located outside the
lagoon between the fore reef crest and the reef slope connecting to the deep open ocean waters.
During the first dugong aerial survey conducted during the cool season in 2003 an aggregation
of over 45 dugongs was observed in this habitat, (Chapter 2; Garrigue et al. 2008). There are
similar reports of dugongs aggregating (i.e., forming groups sizes of ≥ 10 individuals sensu
Lanyon 2003) in warm oceanic water near the high latitude limits of their range in winter. For
example, dugongs aggregating in the oceanic area outside South Passage in Moreton Bay (up to
10km offshore from Moreton and North Stradbroke Islands) were described by Marsh and
Sinclair (1989b), Preen (1992), and Lanyon (2003). Anderson (1986) described dugongs
aggregating in warm tongues of oceanic water during winter in Shark Bay. In the Arabian Gulf,
Preen (2004) observed a large dugong aggregation, estimated to contain some 670 individuals in
two main groups. Preen (2004) suggested that the herds were located near warm water sources
but this was not verified. Whereas the possible causes of dugong aggregations over inshore
seagrass meadows have received attention (Preen 1992; Hodgson 2004), the reasons why
dugongs aggregate in oceanic waters where seagrass is absent have not been formally
investigated.
The goal of this chapter is to investigate seasonal and tidal changes in abundance, aggregation
patterns and habitat use of dugongs in the lagoon of Cap Goulvain. Aerial surveys were
conducted over 18 months at both low and high tide to document the seasonal and tidal changes
in the distribution and number of dugongs found in seagrass and non-seagrass coral reef
habitats. I then used the resultant dataset and other opportunistic dugong herd sightings to
explore the spatial and temporal occurrence of dugong herds in Cap Goulvain. Finally, I used
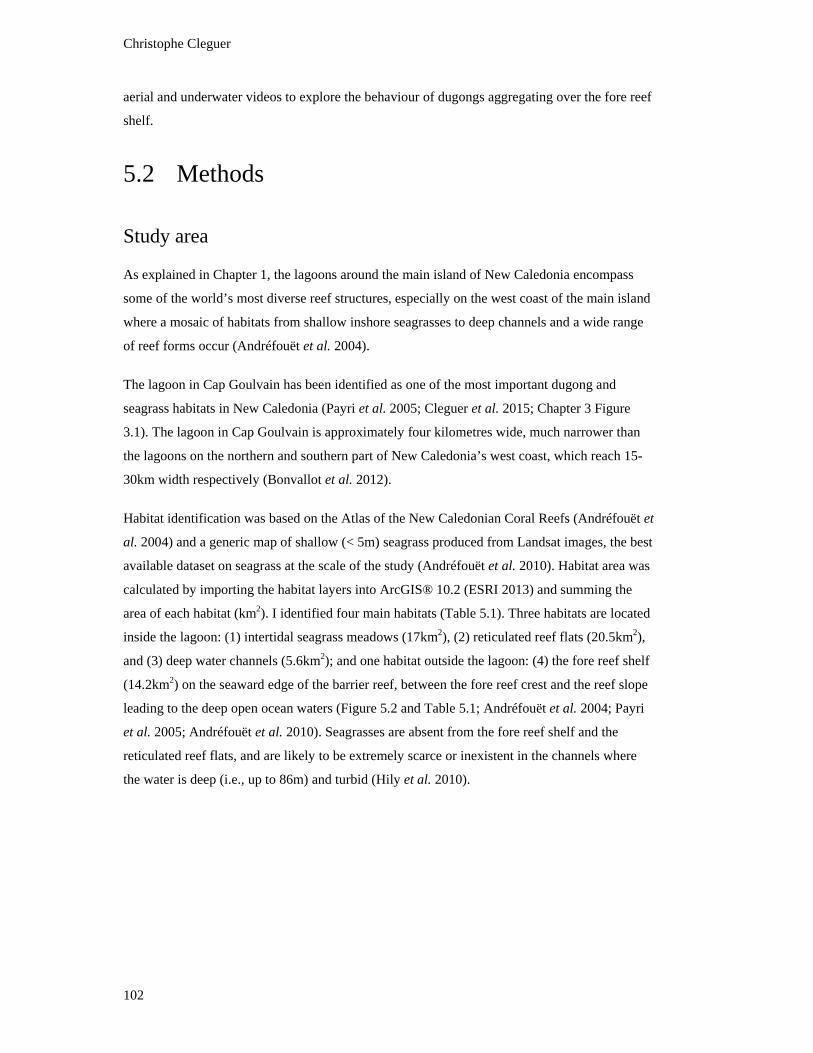
Christophe Cleguer
102
aerial and underwater videos to explore the behaviour of dugongs aggregating over the fore reef
shelf.
5.2 Methods
Study area
As explained in Chapter 1, the lagoons around the main island of New Caledonia encompass
some of the world’s most diverse reef structures, especially on the west coast of the main island
where a mosaic of habitats from shallow inshore seagrasses to deep channels and a wide range
of reef forms occur (Andréfouët et al. 2004).
The lagoon in Cap Goulvain has been identified as one of the most important dugong and
seagrass habitats in New Caledonia (Payri et al. 2005; Cleguer et al. 2015; Chapter 3 Figure
3.1). The lagoon in Cap Goulvain is approximately four kilometres wide, much narrower than
the lagoons on the northern and southern part of New Caledonia’s west coast, which reach 15-
30km width respectively (Bonvallot et al. 2012).
Habitat identification was based on the Atlas of the New Caledonian Coral Reefs (Andréfouët et
al. 2004) and a generic map of shallow (< 5m) seagrass produced from Landsat images, the best
available dataset on seagrass at the scale of the study (Andréfouët et al. 2010). Habitat area was
calculated by importing the habitat layers into ArcGIS® 10.2 (ESRI 2013) and summing the
area of each habitat (km2). I identified four main habitats (Table 5.1). Three habitats are located
inside the lagoon: (1) intertidal seagrass meadows (17km2), (2) reticulated reef flats (20.5km2),
and (3) deep water channels (5.6km2); and one habitat outside the lagoon: (4) the fore reef shelf
(14.2km2) on the seaward edge of the barrier reef, between the fore reef crest and the reef slope
leading to the deep open ocean waters (Figure 5.2 and Table 5.1; Andréfouët et al. 2004; Payri
et al. 2005; Andréfouët et al. 2010). Seagrasses are absent from the fore reef shelf and the
reticulated reef flats, and are likely to be extremely scarce or inexistent in the channels where
the water is deep (i.e., up to 86m) and turbid (Hily et al. 2010).
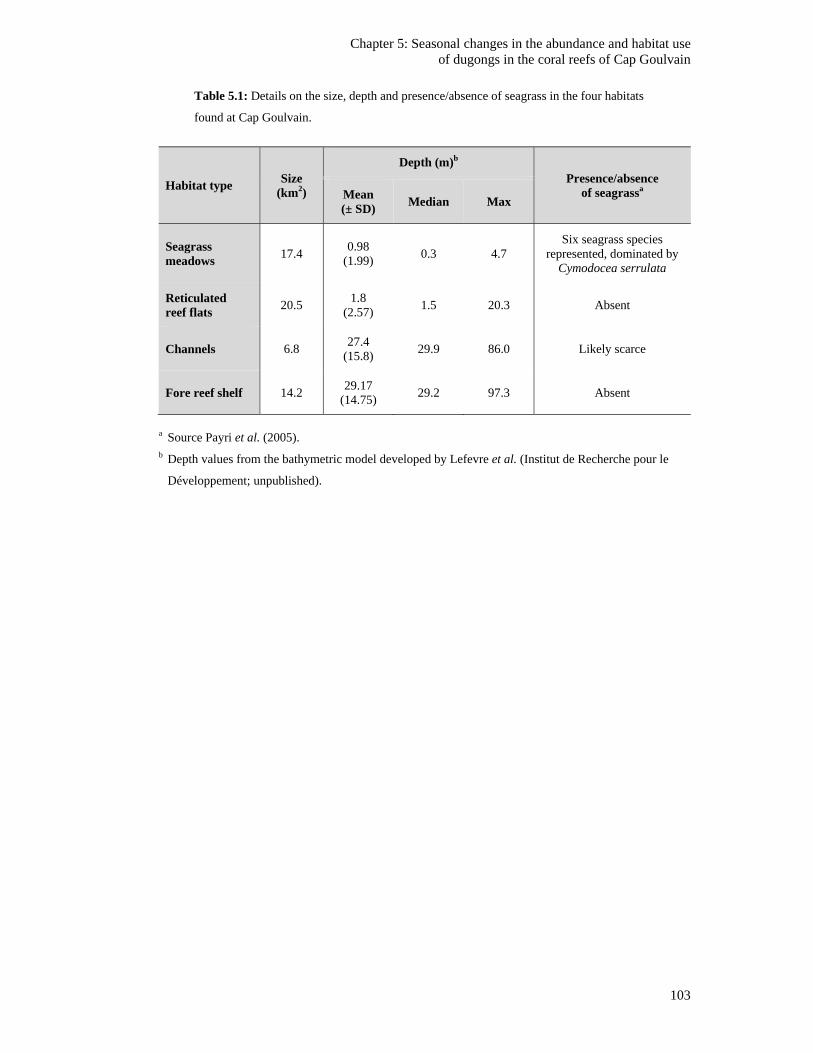
Chapter 5: Seasonal changes in the abundance and habitat use of dugongs in the coral reefs of Cap Goulvain
103
Table 5.1: Details on the size, depth and presence/absence of seagrass in the four habitats
found at Cap Goulvain.
Habitat type Size
(km2)
Depth (m)b Presence/absence
of seagrassa Mean (± SD)
Median Max
Seagrass meadows
17.4 0.98
(1.99) 0.3 4.7
Six seagrass species represented, dominated by
Cymodocea serrulata
Reticulated reef flats
20.5 1.8
(2.57) 1.5 20.3 Absent
Channels 6.8 27.4
(15.8) 29.9 86.0 Likely scarce
Fore reef shelf 14.2 29.17
(14.75) 29.2 97.3 Absent
a Source Payri et al. (2005). b Depth values from the bathymetric model developed by Lefevre et al. (Institut de Recherche pour le
Développement; unpublished).
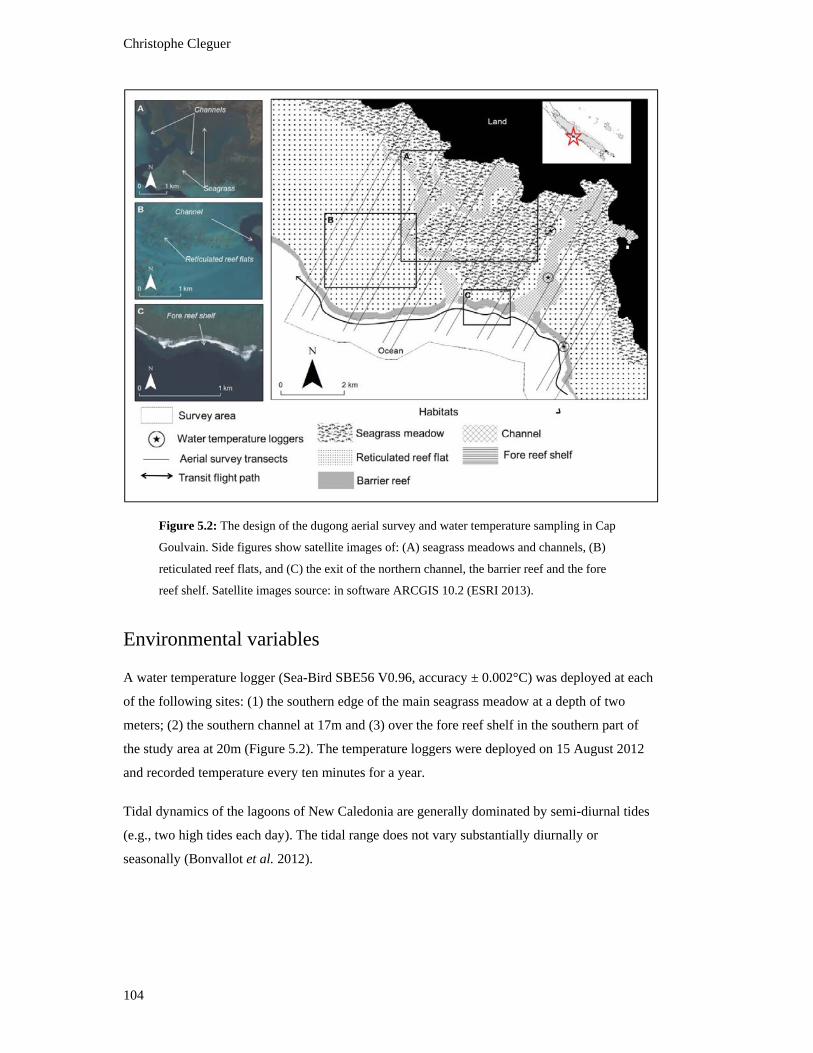
Christophe Cleguer
104
Figure 5.2: The design of the dugong aerial survey and water temperature sampling in Cap
Goulvain. Side figures show satellite images of: (A) seagrass meadows and channels, (B)
reticulated reef flats, and (C) the exit of the northern channel, the barrier reef and the fore
reef shelf. Satellite images source: in software ARCGIS 10.2 (ESRI 2013).
Environmental variables
A water temperature logger (Sea-Bird SBE56 V0.96, accuracy ± 0.002°C) was deployed at each
of the following sites: (1) the southern edge of the main seagrass meadow at a depth of two
meters; (2) the southern channel at 17m and (3) over the fore reef shelf in the southern part of
the study area at 20m (Figure 5.2). The temperature loggers were deployed on 15 August 2012
and recorded temperature every ten minutes for a year.
Tidal dynamics of the lagoons of New Caledonia are generally dominated by semi-diurnal tides
(e.g., two high tides each day). The tidal range does not vary substantially diurnally or
seasonally (Bonvallot et al. 2012).
Chapter 5: Seasonal changes in the abundance and habitat use of dugongs in the coral reefs of Cap Goulvain
105
Aerial surveys
Transect surveys
Sixty-two dedicated transect surveys were conducted over Cap Goulvain, from mid-February
2012 to mid-August 2013 to record the number of dugongs and temporal changes in their
habitat use. Twenty-nine surveys were conducted during the warm season as defined by Météo-
France (Météo-France 2014) including 15 surveys at high tide and 14 surveys at low tide
(Appendix D Table D.1). Thirty-three surveys were conducted during the cool season (sensu
Météo-France 2014); 16 at high tide and 17 at low tide.
The surveys required an observer to be available every two weeks during 18 months. Given the
co-tutelle arrangements of my PhD candidature, I could not be available for such a time period.
Thus prior to the start of the study in Cap Goulvain, I trained two observers using an 8-seater
Cessna 210/Centurion plane available in Nouméa. I then conducted two trial surveys in Cap
Goulvain with the pilot who was hired for the entire survey period to ensure that the predefined
transects were appropriately followed using a strict flight protocol. The surveys were conducted
using a two seater Fly Synthesis Storch ultra-light aircraft. A trained observer sat on the
starboard side next to the pilot. To limit potential observer bias, the same observer conducted
most of the surveys. Five of the 62 surveys were conducted by a second trained observer.
Surveys were conducted at a constant ground speed of 60 knots. In order to meet New
Caledonia safety requirements of a single engine aircraft over water, flights were conducted at
900 feet (274m). Flying at this altitude also enabled the observer to identify the limits of and
count large groups of dugongs (Marsh and Sinclair 1989a, b). These ultra-light surveys were
flown at approximately two week intervals (mean interval between surveys = 16.2 days, ± SE =
1.4) and took an average of 46.6 min each (± SE = 0.68) excluding aircraft transit times to and
from the airport. If possible, surveys were conducted at slack low and high tides on each survey
day and in calm weather with wind speeds of less than 20km/h; and cloud cover less than 6
oktas to minimise sighting bias caused by poor visibility in bad weather.
The survey design and procedures were a variant of the protocols of Marsh and Saalfeld (1989)
and Marsh and Sinclair (1989a); coloured tape was attached to the starboard wing strut of the
aircraft to delineate a transect 400m wide on the water surface on the starboard side of the
aircraft (see Chapter 2 Figure 2.3). This transect width delimited the zone in which dugongs
were counted. Habitats inside the lagoon and the fore reef shelf (total of 60km2) were covered
by 14 non-overlapping transects (Figure 5.2). Transects were paired because observer coverage
was limited to the starboard side of the aircraft. Within pairs, transects were spaced at intervals
Christophe Cleguer
106
of 350m; the inter-pair transect distance was 1km. This design allowed the survey to intensively
cover the study area with a 59% sampling intensity while limiting the risks of double counting
dugongs. The 14 transects were flown in all survey sessions, hence there was no variation in
sampling effort during the study. All dugong and large shark (> 2m) sightings and their
associated habitats were recorded onto an audio-recorder. In all habitats other than the channels
the bottom was visible from the aircraft.
Transiting flights
I examined the data from 41 flights transiting over the fore reef shelf in Cap Goulvain for
sightings of more than 10 dugongs forming a distinct aggregation (dugong herds sensu Lanyon
2003). These flights were conducted by teams of aerial survey observers transiting to the north
of New Caledonia to conduct dugong surveys in other areas. The flight altitude was adjusted to
900 feet (274m) when passing over the fore reef shelf of Cap Goulvain in order to maximise
dugong sightings.
Aerial and underwater video footages
Some aerial video footage of dugong herds over the fore reef shelf was available for analysis.
The videos were taken from a photographer of the Province Sud Resource Department from a
helicopter (Martial Dosdane pers. comm.). Seven videos were taken on 7 July 2011 and four on
16 July 2012. An underwater video, taken by local sea-rangers snorkelling over the fore reef
shelf on 18 April 2011 was also available for examination (Romain Laigle pers. comm.;
Appendix D Table D.2).
Data analysis
Habitat use
I explored monthly and tidal variation in the numbers of dugongs observed. The response was
the total number of dugongs observed in each month-tide combination divided by the
corresponding number of surveys.
The interaction between the total counts of dugongs for each of the four habitat types (seagrass
meadows, channels, reticulated reef flats, fore reef shelf), season and tide was assessed using
log-linear regression via generalized linear models (GLM) with a Poisson distribution
(McCullough and Nelder 1989). The size of each habitat was accounted for using the logarithm
to the base e of habitat area as an offset in the models. I tested the null hypothesis that there was
Chapter 5: Seasonal changes in the abundance and habitat use of dugongs in the coral reefs of Cap Goulvain
107
no three-way interaction between habitat, tide and season. The dataset was subsequently divided
into season-tide categories (i.e., cool season-low tide, cool season-high tide, warm season-low
tide, warm season-high tide) and the proportion of dugongs sighted across habitats in each
season-tide category was calculated. The resulting values were binned into four classes of
dugong sightings (i.e., 0-25, 25-50, 50-75, 75-100%). These classes were coloured and assigned
to their relevant habitat layer within each season-tide category in ArcGIS® 10.2 (ESRI 2013) to
enable better visual representation of the results.
Dugong herds
I explored the occurrence of dugong herds: (1) spatially - inside or outside the lagoon; and (2)
temporally - by month. Dedicated transect survey and transiting flight data were combined for
the analysis of the dugong herd observations outside the lagoon but not for the analysis of the
dugong herd observation inside the lagoon because the transiting flights were conducted only
outside the lagoon. I then examined the correlation between water temperature changes and the
spatial and temporal patterns of dugong herding. I calculated the mean minimum monthly water
temperature difference between the fore reef shelf - outside the lagoon, and the seagrass
meadow - inside the lagoon during the transect surveys. A Spearman rank correlation test (Zar
1998) was conducted to assess the correlation between the probability of seeing at least one
dugong herd and the mean minimum water temperature difference between outside and inside
the lagoon. I chose to focus on the minimum water temperatures, which I assumed likely to
trigger a change in the spatial and temporal pattern of dugong herding. The association between
the proportions of dugong herd observations by tides was tested using a Fisher’s exact test
(Upton 1992). I examined whether sharks were observed during the same dedicated transect
survey as the dugong herd observations. Hodgson’s (2004) behavioural protocol was used for
the analysis of the video footages in order to identify the behaviour of dugongs in the herds
located on the fore reef shelf (Appendix D Table D.3).
Christophe Cleguer
108
5.3 Results
Water temperature
The changes in water temperature in Cap Goulvain were concordant with the definition of
seasons used by Météo France (2015); (Chapter 1). The cool season started in April when water
temperature decreased in all three monitored habitats. The warm season extended from October
to March. During the cool season the mean minimum monthly water temperature was
significantly higher over the fore reef shelf outside of the lagoon, than in the channel or over the
seagrass meadows (Tukey multiple comparisons tests, p < 0.0001, Table 5.2). The difference
between the mean minimum monthly water temperature over the fore reef shelf and in the
southern channel became positive in April and peaked in May at 1.9°C (Table 5.2). A similar
pattern was observed between the fore reef shelf and the seagrass meadow with the mean
minimum monthly water temperature being warmer over the fore reef shelf from May through
October (water temperature difference ranging 0.1-1.1°C). During the warm season, the spatial
differences in water temperature reversed: the mean minimum monthly water temperature was
significantly higher in the channel (up to 1.1°C difference; Tukey multiple comparisons tests, p
< 0.0001) and over the seagrass meadow (up to 0.8°C Tukey multiple comparisons tests, p <
0.0001) compared with the fore reef shelf (Table 5.2).
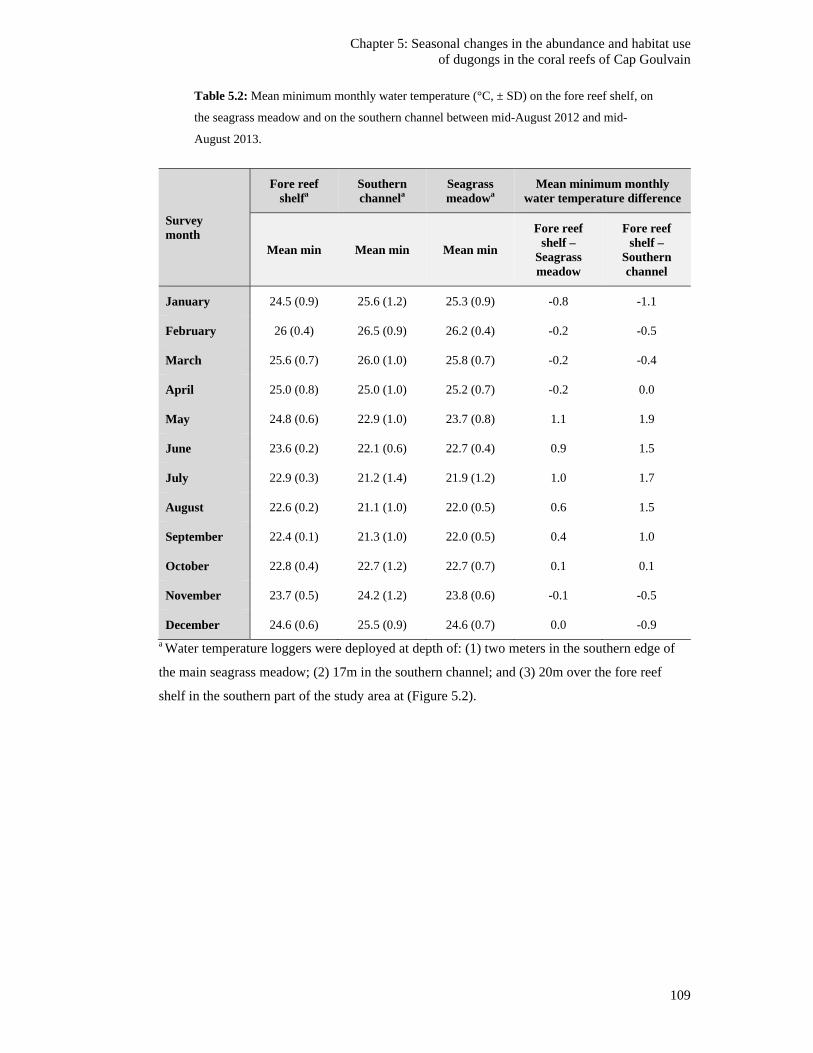
Chapter 5: Seasonal changes in the abundance and habitat use of dugongs in the coral reefs of Cap Goulvain
109
Table 5.2: Mean minimum monthly water temperature (°C, ± SD) on the fore reef shelf, on
the seagrass meadow and on the southern channel between mid-August 2012 and mid-
August 2013.
Survey month
Fore reef shelfa
Southern channela
Seagrass meadowa
Mean minimum monthly water temperature difference
Mean min Mean min Mean min
Fore reef shelf –
Seagrass meadow
Fore reef shelf –
Southern channel
January 24.5 (0.9) 25.6 (1.2) 25.3 (0.9) -0.8 -1.1
February 26 (0.4) 26.5 (0.9) 26.2 (0.4) -0.2 -0.5
March 25.6 (0.7) 26.0 (1.0) 25.8 (0.7) -0.2 -0.4
April 25.0 (0.8) 25.0 (1.0) 25.2 (0.7) -0.2 0.0
May 24.8 (0.6) 22.9 (1.0) 23.7 (0.8) 1.1 1.9
June 23.6 (0.2) 22.1 (0.6) 22.7 (0.4) 0.9 1.5
July 22.9 (0.3) 21.2 (1.4) 21.9 (1.2) 1.0 1.7
August 22.6 (0.2) 21.1 (1.0) 22.0 (0.5) 0.6 1.5
September 22.4 (0.1) 21.3 (1.0) 22.0 (0.5) 0.4 1.0
October 22.8 (0.4) 22.7 (1.2) 22.7 (0.7) 0.1 0.1
November 23.7 (0.5) 24.2 (1.2) 23.8 (0.6) -0.1 -0.5
December 24.6 (0.6) 25.5 (0.9) 24.6 (0.7) 0.0 -0.9
a Water temperature loggers were deployed at depth of: (1) two meters in the southern edge of
the main seagrass meadow; (2) 17m in the southern channel; and (3) 20m over the fore reef
shelf in the southern part of the study area at (Figure 5.2).
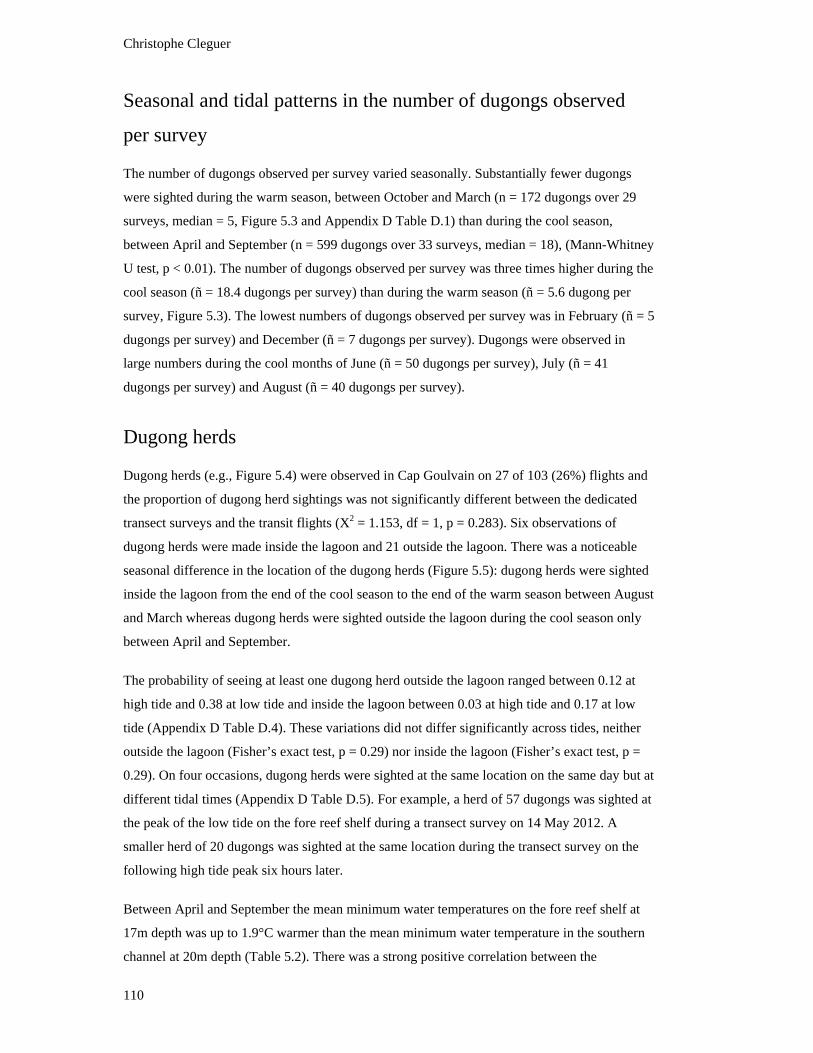
Christophe Cleguer
110
Seasonal and tidal patterns in the number of dugongs observed
per survey
The number of dugongs observed per survey varied seasonally. Substantially fewer dugongs
were sighted during the warm season, between October and March (n = 172 dugongs over 29
surveys, median = 5, Figure 5.3 and Appendix D Table D.1) than during the cool season,
between April and September (n = 599 dugongs over 33 surveys, median = 18), (Mann-Whitney
U test, p < 0.01). The number of dugongs observed per survey was three times higher during the
cool season (ñ = 18.4 dugongs per survey) than during the warm season (ñ = 5.6 dugong per
survey, Figure 5.3). The lowest numbers of dugongs observed per survey was in February (ñ = 5
dugongs per survey) and December (ñ = 7 dugongs per survey). Dugongs were observed in
large numbers during the cool months of June (ñ = 50 dugongs per survey), July (ñ = 41
dugongs per survey) and August (ñ = 40 dugongs per survey).
Dugong herds
Dugong herds (e.g., Figure 5.4) were observed in Cap Goulvain on 27 of 103 (26%) flights and
the proportion of dugong herd sightings was not significantly different between the dedicated
transect surveys and the transit flights (X2 = 1.153, df = 1, p = 0.283). Six observations of
dugong herds were made inside the lagoon and 21 outside the lagoon. There was a noticeable
seasonal difference in the location of the dugong herds (Figure 5.5): dugong herds were sighted
inside the lagoon from the end of the cool season to the end of the warm season between August
and March whereas dugong herds were sighted outside the lagoon during the cool season only
between April and September.
The probability of seeing at least one dugong herd outside the lagoon ranged between 0.12 at
high tide and 0.38 at low tide and inside the lagoon between 0.03 at high tide and 0.17 at low
tide (Appendix D Table D.4). These variations did not differ significantly across tides, neither
outside the lagoon (Fisher’s exact test, p = 0.29) nor inside the lagoon (Fisher’s exact test, p =
0.29). On four occasions, dugong herds were sighted at the same location on the same day but at
different tidal times (Appendix D Table D.5). For example, a herd of 57 dugongs was sighted at
the peak of the low tide on the fore reef shelf during a transect survey on 14 May 2012. A
smaller herd of 20 dugongs was sighted at the same location during the transect survey on the
following high tide peak six hours later.
Between April and September the mean minimum water temperatures on the fore reef shelf at
17m depth was up to 1.9°C warmer than the mean minimum water temperature in the southern
channel at 20m depth (Table 5.2). There was a strong positive correlation between the
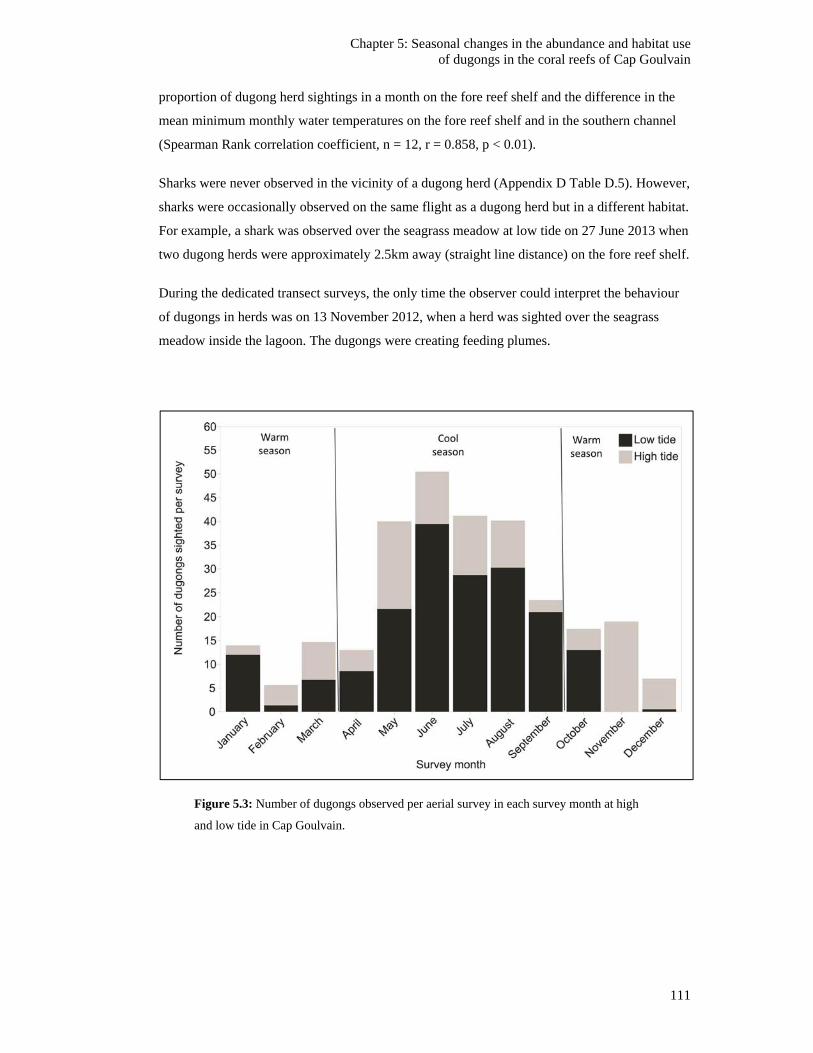
Chapter 5: Seasonal changes in the abundance and habitat use of dugongs in the coral reefs of Cap Goulvain
111
proportion of dugong herd sightings in a month on the fore reef shelf and the difference in the
mean minimum monthly water temperatures on the fore reef shelf and in the southern channel
(Spearman Rank correlation coefficient, n = 12, r = 0.858, p < 0.01).
Sharks were never observed in the vicinity of a dugong herd (Appendix D Table D.5). However,
sharks were occasionally observed on the same flight as a dugong herd but in a different habitat.
For example, a shark was observed over the seagrass meadow at low tide on 27 June 2013 when
two dugong herds were approximately 2.5km away (straight line distance) on the fore reef shelf.
During the dedicated transect surveys, the only time the observer could interpret the behaviour
of dugongs in herds was on 13 November 2012, when a herd was sighted over the seagrass
meadow inside the lagoon. The dugongs were creating feeding plumes.
Figure 5.3: Number of dugongs observed per aerial survey in each survey month at high
and low tide in Cap Goulvain.
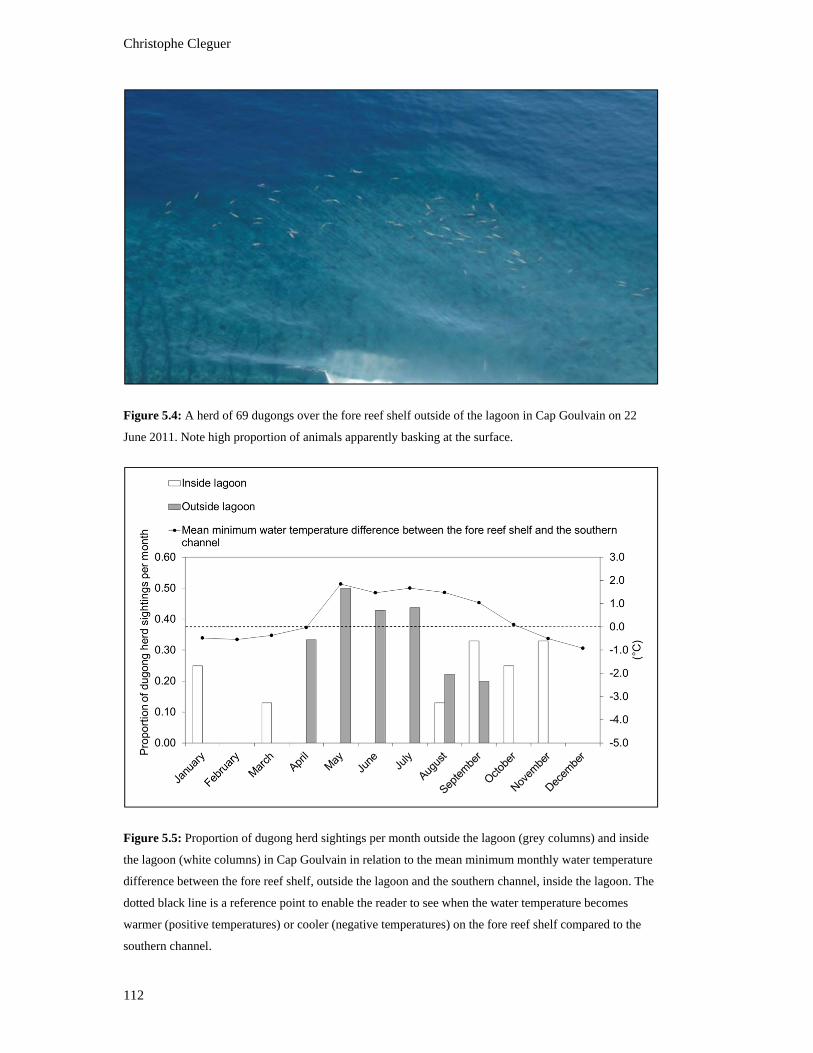
Christophe Cleguer
112
Figure 5.4: A herd of 69 dugongs over the fore reef shelf outside of the lagoon in Cap Goulvain on 22
June 2011. Note high proportion of animals apparently basking at the surface.
Figure 5.5: Proportion of dugong herd sightings per month outside the lagoon (grey columns) and inside
the lagoon (white columns) in Cap Goulvain in relation to the mean minimum monthly water temperature
difference between the fore reef shelf, outside the lagoon and the southern channel, inside the lagoon. The
dotted black line is a reference point to enable the reader to see when the water temperature becomes
warmer (positive temperatures) or cooler (negative temperatures) on the fore reef shelf compared to the
southern channel.
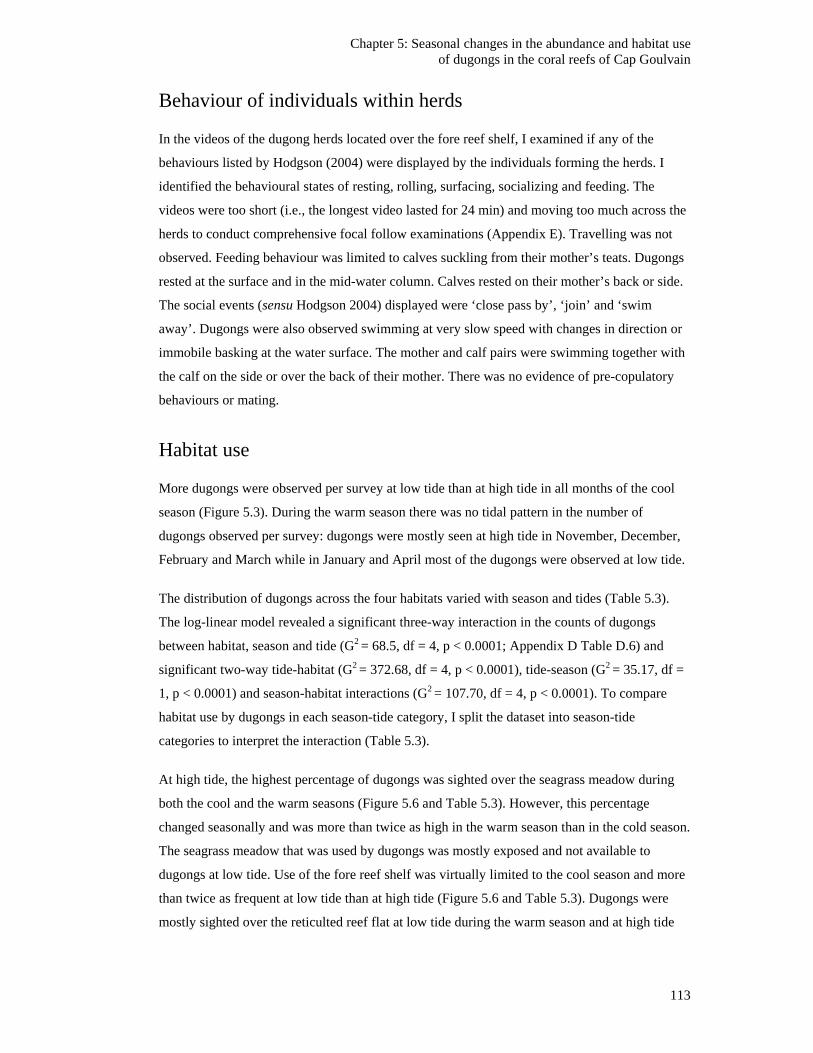
Chapter 5: Seasonal changes in the abundance and habitat use of dugongs in the coral reefs of Cap Goulvain
113
Behaviour of individuals within herds
In the videos of the dugong herds located over the fore reef shelf, I examined if any of the
behaviours listed by Hodgson (2004) were displayed by the individuals forming the herds. I
identified the behavioural states of resting, rolling, surfacing, socializing and feeding. The
videos were too short (i.e., the longest video lasted for 24 min) and moving too much across the
herds to conduct comprehensive focal follow examinations (Appendix E). Travelling was not
observed. Feeding behaviour was limited to calves suckling from their mother’s teats. Dugongs
rested at the surface and in the mid-water column. Calves rested on their mother’s back or side.
The social events (sensu Hodgson 2004) displayed were ‘close pass by’, ‘join’ and ‘swim
away’. Dugongs were also observed swimming at very slow speed with changes in direction or
immobile basking at the water surface. The mother and calf pairs were swimming together with
the calf on the side or over the back of their mother. There was no evidence of pre-copulatory
behaviours or mating.
Habitat use
More dugongs were observed per survey at low tide than at high tide in all months of the cool
season (Figure 5.3). During the warm season there was no tidal pattern in the number of
dugongs observed per survey: dugongs were mostly seen at high tide in November, December,
February and March while in January and April most of the dugongs were observed at low tide.
The distribution of dugongs across the four habitats varied with season and tides (Table 5.3).
The log-linear model revealed a significant three-way interaction in the counts of dugongs
between habitat, season and tide (G2 = 68.5, df = 4, p < 0.0001; Appendix D Table D.6) and
significant two-way tide-habitat (G2 = 372.68, df = 4, p < 0.0001), tide-season (G2 = 35.17, df =
1, p < 0.0001) and season-habitat interactions (G2 = 107.70, df = 4, p < 0.0001). To compare
habitat use by dugongs in each season-tide category, I split the dataset into season-tide
categories to interpret the interaction (Table 5.3).
At high tide, the highest percentage of dugongs was sighted over the seagrass meadow during
both the cool and the warm seasons (Figure 5.6 and Table 5.3). However, this percentage
changed seasonally and was more than twice as high in the warm season than in the cold season.
The seagrass meadow that was used by dugongs was mostly exposed and not available to
dugongs at low tide. Use of the fore reef shelf was virtually limited to the cool season and more
than twice as frequent at low tide than at high tide (Figure 5.6 and Table 5.3). Dugongs were
mostly sighted over the reticulted reef flat at low tide during the warm season and at high tide

Christophe Cleguer
114
during the cool season and used the channels mostly at low tide, especially in the warm season
(Figure 5.6 and Table 5.3).
Table 5.3: Percentage of dugong sightings in each habitat for each season-tide category.
Tide-season
Habitat
Seagrass Reticulated
reef flat Channels Fore reef shelf
Low – Cool 3 7 31 59
Low – Warm 0 23 73 4
High – Cool 36 28 14 22
High – Warm 79 6 16 0
Figure 5.6: Percentage of dugong sightings in each habitat for each season-tide category.
Sampling intensity was constant within and across each season-tide category.
Chapter 5: Seasonal changes in the abundance and habitat use of dugongs in the coral reefs of Cap Goulvain
115
5.4 Discussion
I found strong seasonal and tidal patterns in dugong abundance, behaviour and habitat use in
Cap Goulvain. The number of dugongs observed per survey was three times higher during the
cool season than during the warm season. There was a noticeable seasonal difference in the
location and behaviour of the dugong herds. Aggregations of dugongs inside the lagoon were
generally sighted in the warm season and resting aggregations outside the lagoon during the
cool season between April and September. In addition, there were strong seasonal and tidal
changes in the way dugongs used habitats in Cap Goulvain. Not unexpectedly, dugongs were
sighted in higher numbers over the intertidal seagrass meadows at high tide than in any other
habitat regardless of the season. But when tides restricted access to the seagrass meadows there
was a seasonal variability in the way dugongs were distributed over the non-seagrass coral reef
habitats. During the cool season at low tide, a higher percentage of dugongs was sighted on the
fore reef shelf than in any other habitat. During the warm season at low tide, dugongs appeared
to remain in the lagoon, particularly in the channels. The reticulated reefs were used by dugongs
at low tide during the warm season and at high tide during the cool season.
During the cool season the water temperature on the fore reef shelf, outside the lagoon, was
higher than the water temperature on the seagrass meadow and in the southern channel inside
the lagoon. This difference reversed during the warm season. Collectively, these results suggest
that behavioural thermoregulation may have played a key role in the seasonal changes in
number and behaviour of dugongs in Cap Goulvain as well as in the way animals used their
habitats in the region. Below I evaluate the evidence supporting this hypothesis while
considering other possible explanatory factors, which are not mutually exclusive.
Behavioural thermoregulation
Thermoregulation is a key feature in the maintenance of homeostasis in mammals (Cossins and
Bowler 1987; Terrien et al. 2011). Thermoregulatory capacities are strongly related to energy
balance and animals constantly seek to limit the energy costs of normothermia (Terrien et al.
2011). Many mammals use behavioural mechanisms to reduce the energy costs of
thermoregulation (Cabanac et al. 1970; Baldwin 1974; Gordon 1985; Flouris 2011). For
example, in Australia, wild pigs inhabiting river systems in the semi-arid rangelands reduce the
cost of thermoregulation by seeking refuge under continuous cover associated with riverine
woodlands. The need to access riverine woodlands when temperatures are high constrains the
foraging behaviour and habitat use of wild pigs where the landscape topography limits access to
this habitat (Choquenot and Ruscoe 2003).
Christophe Cleguer
116
Thermoregulation is a particular problem for marine mammals because they spend all or a
greater part of their lives in water, a medium with conductivity 25 times greater than air and
with temperatures generally lower than their body temperature (Pabst et al. 1999; Rosen et al.
2007; Satinoff 2011). Marine mammals regulate their body temperature through both
morphological (fur, subcutaneous body fat, changes to anatomy of the blood supply to the
integument) and behavioural adaptations. For example, sea otters keep their highly vascularized
paws out of the cold water to stay warm (Morrison et al. 1974; Costa and Kooyman 1982).
Seals and sea lions commute up and down the tidal zone on the beach to cool off or warm up
(White and Odell 1971; Odell 1974).
Sirenians feed on low energy food relative to the food of carnivorous marine mammals
(Aragones et al. 2012). They have a relatively low metabolic rate, poor thermal conductance
(although see Horgan et al. 2014) compared to cold-water marine mammals and limited scope
for increasing their metabolic rate to counter heat loss (Gallivan and Best 1980; Irvine 1983).
Thus sirenians modify their behaviour to reduce the energy lost by thermal conductance. This
phenomenon has been extensively studied in Florida where winter water temperatures can be
lethal to manatees after cold fronts (Bossart et al. 2003, 2004). Manatees respond to cold water
temperatures in Florida by seasonal migrations and local movements between warm water
springs and industrial warm-water sources during winter (Laist and Reynolds 2005; Deutsch et
al. 2006). In areas where temperature-inverted haloclines result in the water temperature being
higher at the bottom than at the surface, manatees tend to spend more time at the bottom (Stith
et al. 2011).
Both aerial surveys and tracking suggest that the movement patterns of dugongs are associated
with changes in water temperature at the higher latitude limits of their range even though the
water temperatures are much higher than the temperatures that cause cold induced movements
in manatees. Marsh and Rathbun (1990) found that a radio-tagged dugongs travelled more than
100km to warmer waters coincident with the onset of cold weather. Six dugongs tracked in
Hervey Bay, eastern Australia, undertook meso-scale 80km movements across the bay in winter
from the 19-20°C coastal waters to the 21-22°C waters off Sandy Cape despite the apparent lack
of seagrass meadows in the Sandy Cape area (Sheppard et al. 2006). Preen (1992) reported
movements in and out of Moreton Bay over a temperature gradient of less than two degrees
between offshore and inshore areas (i.e., 17.7°C inside the bay versus 19.4°C recorded outside
the bay). Holley (2006) concluded that seasonal drops in temperature caused individual dugongs
to move from the inner to outer regions of Shark Bay. Sighting records and aerial surveys at
three high latitude limits to the dugong’s range indicate that most dugongs avoid waters lower in
temperature than about 18°C: Moreton Bay in Queensland (Marsh and Sinclair 1989b; Preen

Chapter 5: Seasonal changes in the abundance and habitat use of dugongs in the coral reefs of Cap Goulvain
117
1992), Shark Bay in Western Australia (Anderson 1986, 1994; Marsh et al. 1994; Preen et al.
1997; Gales et al. 2004; Holley et al. 2006), and the Arabian/Persian Gulf (Preen 1989).
Sighting records of live dugongs along the New South Wales coast in south-eastern Australia
are limited to summer (Allen et al. 2004). These behavioural adjustments along with insulation
provided by the integument may help dugongs to live year-round at sub-tropical latitudes
(Horgan et al. 2014). Nonetheless, Wirsing et al. (2007b) sighted some dugongs in Shark Bay in
waters below 15°C, and Lanyon et al. (2005) reported seeing dugongs in Pumicestone Passage
in the Moreton Bay region year round, despite water temperatures below 18°C from June to
August, and down to 15.4°C in June. It is not known whether these were repeated sightings of
the same dugongs.
The seasonal changes in the distribution and number of dugongs at low tide in non-seagrass
coral reef habitats of Cap Goulvain were correlated with the differences in water temperature
between the outer and the inner-lagoon areas, even though the lowest mean minimum monthly
water temperatures recorded (21.1°C) were much higher than 18°C. A similar difference in
water temperature between inshore areas and areas closer to oceanic waters has been
documented in other regions on the west coast of New Caledonia where the lagoon is wider than
in Cap Goulvain including the southwest lagoon in the Nouméa region (i.e., up to 35km from
coastline to barrier reef; Le Borgne et al. 2010).
Nonetheless the ~2°C temperature difference between the dugongs spending low tide on the
fore reef shelf rather than in the subtidal sections of the lagoon in the cool season could
significantly reduce the heat transfer to the dugong’s body core to the skin as illustrated by this
simplistic application of Newton’s law of cooling (Davidzon 2012):
H = Ak (Tc-Ta)
where
H = heat produced, transferred from the core to the surface via the circulation; A =
surface area; k = heat transfer coefficient; and Tc = deep body temperature and Ta =
water temperature.
Assuming that A and k are constant and that the dugong’s deep body temperature Tc = 37°C,
moving from the channel temperature of 22.9°C (coolest mean minimum monthly water
temperature recorded in May) during the cool season at low tide to the fore reef shelf (24.8°C;
mean minimum monthly water temperature in May) would reduce heat transfer by 13.5%
(37°C - 22.9°C /37°C - 24.8°C). These energy savings would be reversed in the warm season
when it is warmer in the lagoon than on the fore reef shelf.
Christophe Cleguer
118
More dugongs were sighted in Cap Goulvain during the cool season compared with the warm
season. The increase in the number of dugongs in Cap Goulvain during the cool season could be
a strategy to reduce the energy cost of accessing warm waters. The lagoon in Cap Goulvain is
narrower than other regions on the west coast where seagrass meadows are extensive. For
example, Nepoui and Poya Bays, the closest bays north of Cap Goulvain that support extensive
seagrass meadows are up to 10km wide. Similar distances separate inshore seagrasses to
oceanic waters in Moindou located south of Cap Goulvain. Thus the energy cost of dugongs
commuting from their seagrass feeding grounds to warm water at Cap Goulvain is potentially
lower than in other regions where the lagoon is wider.
At low tide during the warm season, dugongs were mainly sighted in the channels and on the
reticulated reef flats than over the fore reef shelf. During this period, the water temperature
inside the lagoon and the channels was warmer than the water temperature outside the lagoon,
supporting the hypothesis that dugongs may seek the warmest habitat while resting to maintain
their core body temperature.
Dugongs sighted outside the lagoon were always observed in the proximity of the passes which
constitute the main access to the inshore seagrass resources. Proximity to the passes may help
dugongs to minimise their energy cost to commute to the seagrass meadow. The dugong
aggregations were observed during the cool season coinciding with the increase in dugong
abundance. Therefore the herds observed on the fore reef shelf in the cool season may have
simply reflected an inevitable increase in density associated with the increase in abundance. I
conclude that the increase in the number of dugongs in Cap Goulvain combined with the need to
use a habitat as warm as possible with easy access to food resources is a plausible explanation
or why dugongs aggregate on the fore reef shelf at Cap Goulvain during the cool season.
Reducing the risk of predation
As long-lived slow breeding marine mammals, dugongs need to maximise survival by
minimising the risk of predation. The evidence of direct attacks on dugongs from sharks
summarised by Marsh et al. (2012) indicate that there is a risk of dugongs being attacked by
large sharks, particularly tiger sharks despite being protected from shark attack by their large
size, generally good auditory and tactile perception, thick skin, stout rib cage, and fusiform
body shape with minimal constriction or appendages that can be easily grasped by predators
(Marsh et al. 2012).
Dugongs also minimise predation through behaviour by: (1) reducing the risk of encountering a
predator by using a refuge; and (2) decreasing the consequences of the encounter by increasing
Chapter 5: Seasonal changes in the abundance and habitat use of dugongs in the coral reefs of Cap Goulvain
119
the likelihood of escape (Wirsing et al. 2007a). These strategies are likely to fail if dugongs are
ambushed in the reticulated reef flats and channels in Cap Goulvain. The reticulated reef flats
are subtidal but shallow (< 10m) formations with the potential to limit the movements of large
vertebrates (Andréfouët et al. 2004). During the 2003 aerial survey described in Chapter 2,
Garrigue et al. (2008) observed an animal tentatively identified as a dugong being attacked by
10 tiger sharks and 20 other smaller sharks. The dugong could not escape the barrier created by
the reef and pursuit lasted only a few minutes before the sharks attacked it. Shark attacks of live
dugongs in the reticulated reef flats of the west coast of New Caledonia have also reported by
sea rangers during boat patrols (Bruno Manach. pers. comm.). Adjacent to the reticulated reef
flats, the channels provide access to deep water to escape from predation. Wirsing et al.
(2007 a-d) suggested that dugongs overuse deep areas as a refuge when sharks are abundant
even though these areas may offer little food. However, the channels in Cap Goulvain are deep
and turbid, possibly limiting the dugongs’ capacity to detect shark attacks from below.
Predation from below is more likely to be fatal than attacks from above because the dorsum and
sides of dugongs are protected by the rib cage (Marsh et al. 2012). The fore reef shelf located
outside the lagoon provides access to deep oceanic waters. Studies on dugong-shark interactions
suggest that dugongs use habitats that provide an easy access to deep waters to escape from
shark attacks if sharks are present (Wirsing et al. 2007 a-d). During our surveys the dugongs
sighted over the fore reef shelf were sighted in clear waters where the bottom is visible. Thus,
predation from below may be more easily detected when dugongs are on the fore reef shelf than
in the channels.
However, at least 22% and up to 96% of dugongs were sighted in the reticulated reef flat or in
the channels during our surveys in the four season-tide combinations (Table 5.3). Even at low
tide in winter, 38% of dugongs were in these areas. It is difficult to reconcile these observations
with the hypothesis that use of the fore reef shelf in the cool season being primarily a strategy to
limit the risk of shark attack. Further investigation on the seasonal changes in abundance and
habitat use of sharks in Cap Goulvain is required to evaluate the influence of shark predation on
dugongs in this region.
Rotational cropping of seagrass
The seasonal pattern in the number of animals sighted in Cap Goulvain presumably results from
dugong movements in and out of the study area (see Chapter 4). However, my capacity to
explain why such movements may have occurred is limited.
Herbivory in some reef environments, particularly lagoon environments can significantly alter
seagrass productivity (Unsworth et al. 2007; Coles et al. 2011), which in turn can affect the
Christophe Cleguer
120
distribution and abundance of the herbivores that rely on it for food. Seagrass grazing by
dugongs influences microbial processes, plant biomass and productivity, community structure
and composition, food quality and associated benthic animals such as marine invertebrates (see
review by Marsh et al. 2012). The time scale of recovery of seagrass beds from dugong feeding
varies with time of year and location (McMahon 2005). For example recovery times ranged
from months for species of Zostera, Cymodocea and Halophila in tropical north Queensland to
more than a year in a monospecific meadow of Halodule uninervis at another site in the same
general area (Aragones and Marsh 2000). Short shoots of Halodule wrightii and Syringodium
filiforme showed significant recovery within one growing season after Florida manatees
intensively fed on them for the three winter months of the year (Lefebvre et al. 2000). The
growing season recovery of these plants enabled manatees to migrate again to the same area
during the next winter. It is therefore reasonable to hypothesize that the seasonal change in
dugong abundance at Cap Goulvain results from rotational grazing with some (but not all
dugongs) using the area as a seasonal feeding ground only and then moving to allow the
seagrass to recover during the warm season. However, I have no evidence to reject or support
this hypothesis, which is not mutually exclusive of the behavioural thermoregulation hypothesis
discussed above.
Social interactions
Social interactions seem an unlikely explanation for the seasonal changes in the distribution of
dugongs at Cap Goulvain. The (admittedly limited) video footage available for analysis
indicated that the dugongs forming herds on the fore reef shelf were resting. I did not identify
any distinct social interaction between dugongs except for the females nursing their calves.
Hodgson (2004) conducted the most comprehensive study on the behaviour of dugongs forming
herds using a blimp-mounted video system in Moreton Bay. She concluded that dugongs were
not forming herds to facilitate social interactions, rest or reduce the risk of predation. Rather
their aggregations stimulated the growth of pioneer seagrass species with high quality foliage
(Preen 1992, 1995; Hodgson 2004). However these interpretations of the function of herding in
dugongs in Moreton Bay may have been biased by the focus of the observations, which were
mostly conducted over seagrass meadows. The situation at Cap Goulvain is very different
because there is no doubt from the videos that the dugongs sighted on the fore reef shelf were
resting and this habitat is devoid of seagrass. Thus although rotational cropping may be part of
the reason for the increase in the abundance of dugongs at Cap Goulvain during the cool season,
it cannot explain the formation of herds on the fore-reef shelf.

Chapter 5: Seasonal changes in the abundance and habitat use of dugongs in the coral reefs of Cap Goulvain
121
Reducing the risk of anthropogenic disturbance
The behavioural responses of dugongs to boat traffic have only been formally investigated in
Moreton Bay, a region with relatively high and increasing boating activity (Hodgson and Marsh
2007). This study showed limited behavioural responses of dugongs from boat traffic. How
dugongs react to boat traffic in more remote areas where they may be less familiar to this type
of disturbance is unknown. Acoustic playback experiments were conducted to assess the
behavioral responses of Florida manatees to watercraft approaches. Manatees markedly
responded to vessel approaches, especially to fast personal watercrafts (Miksis‐Olds et al.
2007). Disturbance from human activities is unlikely to have influenced the distribution of
dugongs at Cap Goulvain as very little activity was recorded in the region during the surveys.
Ten boats observed over the 62 surveys were the only evidence of human activity detected.
5.5 Conclusion
This chapter highlights that season (presumably water temperature) and tides strongly influence
the number and distribution of dugongs in Cap Goulvain and that both seagrass and non-
seagrass habitats are important for this species. Behavioural thermoregulation may be a key
driver in the seasonal changes in number and behaviour of dugongs in Cap Goulvain as well as
in the way animals used their habitats in the region. Nonetheless, further investigation on the
effect of seasonal changes in food availability and quality and predation from sharks is required.
The fore reef shelf is a key non-seagrass habitat for dugongs not only to transit from one bay to
another (see Chapter 4) but also to rest during the cool season. The ecological importance of this
habitat has also been identified for species of reef fish in the tropical Atlantic (Olavo et al.
2011) and reef sharks in the Great Barrier Reef in Australia (Rizzari et al. 2014).
Christophe Cleguer
122
5.6 Chapter summary
Little is known about dugong habitat use in coral reef environments where seagrasses occur
only in relatively small intertidal patches that are not accessible at low tide.
I investigated seasonal and tidal changes in abundance, aggregation patterns and habitat use
of dugongs in the lagoon of Cap Goulvain using data obtained from fine-scale aerial surveys.
I then used aerial and underwater videos to explore the behaviour of dugongs aggregating
over the fore reef shelf outside the lagoon.
There were strong seasonal and tidal patterns in dugong abundance, behaviour and habitat
use in Cap Goulvain.
Substantially fewer dugongs were sighted during the warm season, between October and
March (n = 172 dugongs over 29 surveys, median = 5) than during the cool season, between
April and September (n = 599 dugongs over 33 surveys, median = 18).
Aggregations of dugongs inside the lagoon were generally sighted in the warm season and
aggregations outside the lagoon during the cool season between April and September.
Aerial and underwater videos clearly showed that the dugongs aggregating over the fore reef
shelf were resting. There was no tidal pattern in the occurrence of these outer reef herds in
Cap Goulvain.
Dugongs were sighted in higher numbers over the intertidal seagrass meadows at high tide
than in any other habitat regardless of the season.
When tides restricted access to the seagrass meadows there was a seasonal variability in the
way dugongs were distributed over the non-seagrass coral reef habitats. During the cool
season at low tide, a higher percentage of dugongs was sighted on the fore reef shelf than in
any other habitat. During the warm season at low tide, dugongs appeared to remain in the
lagoon, particularly in the channels. The reticulated reefs were used by dugongs at low tide
during the warm season and at high tide during the cool season.
The intensive use of the outer lagoon area coincided with a positive difference in the water
temperature between the fore reef shelf, outside the lagoon, higher by up to ~2°C than the
water temperature on the seagrass meadow and in the southern channel inside the lagoon.
I hypothesised that behavioural thermoregulation may have played a key role in the seasonal
changes in number and behaviour of dugongs in Cap Goulvain as well as in the way animals
used their habitats in the region. Nonetheless, further investigation is required to evaluate the
influence of other possible non-mutually explanatory factors including seasonal variation in
the abundance of sharks and in seagrass availability and quality.
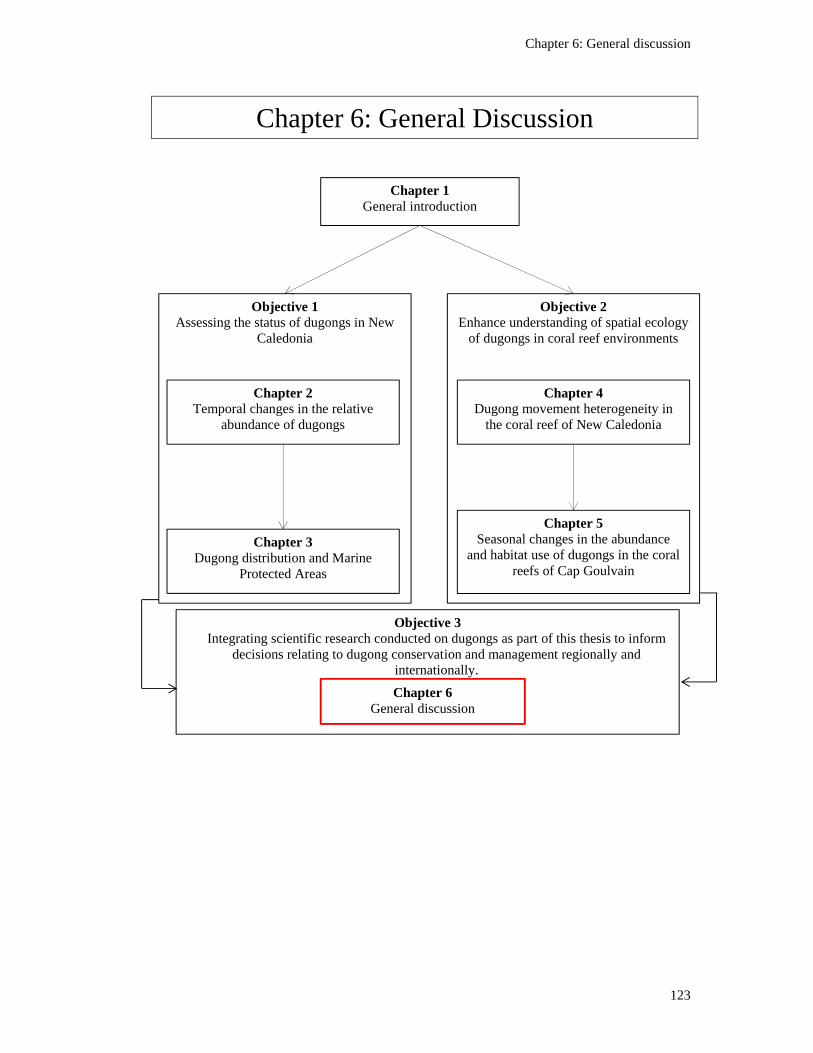
Chapter 6: General discussion
123
Chapter 6: General Discussion
Objective 2 Enhance understanding of spatial ecology
of dugongs in coral reef environments
Objective 1 Assessing the status of dugongs in New
Caledonia
Chapter 1 General introduction
Chapter 2 Temporal changes in the relative
abundance of dugongs
Chapter 3 Dugong distribution and Marine
Protected Areas
Chapter 4 Dugong movement heterogeneity in
the coral reef of New Caledonia
Chapter 5 Seasonal changes in the abundance
and habitat use of dugongs in the coral reefs of Cap Goulvain
Chapter 6 General discussion
Objective 3 Integrating scientific research conducted on dugongs as part of this thesis to inform
decisions relating to dugong conservation and management regionally and internationally.

Christophe Cleguer
124
6.1 Opportunities to enhance the conservation and
management of dugongs in New Caledonia
In response to increasing worldwide biodiversity loss, the United Nations Environment
Programme (UNEP) developed the Convention on Biological Diversity (CBD) with the intent,
in part, of “enabling the conservation of biological diversity, the sustainable use of its
components and the fair and equitable sharing of benefits from using genetic resources”
(Balmford et al. 2005). The conservation of dugongs is congruent with the aim of this
convention.
Dugongs are important components of tropical and subtropical coastal ecosystems. The status of
most of these ecosystems is of great concern and affects dugongs throughout most of their range
in the Indo-West Pacific (Marsh et al. 2012). The scope for the survival of dugongs from
disturbance should be higher in countries of Very High Human Development Index (HDI)
because the capacity to implement effective conservation actions and tackle wildlife
conservation issues should be greater than in less developed countries (Marsh et al. 2012).
New Caledonia is one of the richest countries in Oceania (ISEE 2014). New Caledonia receives
financial transfers from Metropolitan France, which has a Very High HDI, plus the European
Union, and its mining activities are booming. The capacity of New Caledonia to implement
research and conservation initiatives to enhance the conservation of dugongs should be higher
than any other dugong range state in Oceania with exception of Australia. As explained in
Chapters 1 and 2, standardized dugong aerial surveys were conducted in 2003 and in 2008
(Garrigue et al. 2008, 2009). The dugong population estimate that resulted from the 2008 survey
was much lower than that for the 2003 survey, triggering local concerns. Hence local managers
decided to underwrite further investigation including research on the basic ecology of dugongs
in New Caledonia to assess the size and status of the dugong population and of the conservation
strategies in place. This thesis is the result of that investment.
Initiating new conservation strategies and/or enhancing current actions to protect dugongs
require spatial-ecological information about the population. The generic information on the
spatial ecology of dugongs is substantial and reflects more than 30 years of extensive scientific
research mostly conducted in Australia (Marsh et al. 2012). Some of this science is relevant to
informing the conservation of the dugong throughout its range. However, further research on the
spatial ecology of dugongs was required in New Caledonia because the environment is very
different from that in the countries where dugong research has been carried out. Very little is
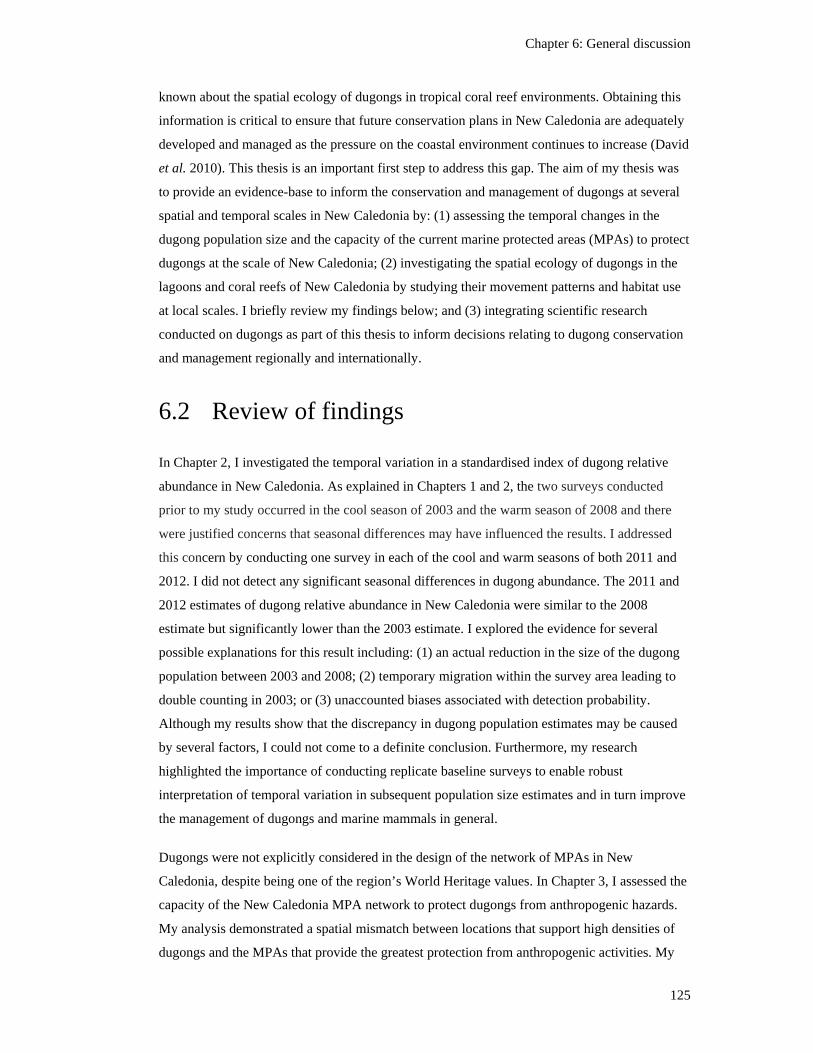
Chapter 6: General discussion
125
known about the spatial ecology of dugongs in tropical coral reef environments. Obtaining this
information is critical to ensure that future conservation plans in New Caledonia are adequately
developed and managed as the pressure on the coastal environment continues to increase (David
et al. 2010). This thesis is an important first step to address this gap. The aim of my thesis was
to provide an evidence-base to inform the conservation and management of dugongs at several
spatial and temporal scales in New Caledonia by: (1) assessing the temporal changes in the
dugong population size and the capacity of the current marine protected areas (MPAs) to protect
dugongs at the scale of New Caledonia; (2) investigating the spatial ecology of dugongs in the
lagoons and coral reefs of New Caledonia by studying their movement patterns and habitat use
at local scales. I briefly review my findings below; and (3) integrating scientific research
conducted on dugongs as part of this thesis to inform decisions relating to dugong conservation
and management regionally and internationally.
6.2 Review of findings
In Chapter 2, I investigated the temporal variation in a standardised index of dugong relative
abundance in New Caledonia. As explained in Chapters 1 and 2, the two surveys conducted
prior to my study occurred in the cool season of 2003 and the warm season of 2008 and there
were justified concerns that seasonal differences may have influenced the results. I addressed
this concern by conducting one survey in each of the cool and warm seasons of both 2011 and
2012. I did not detect any significant seasonal differences in dugong abundance. The 2011 and
2012 estimates of dugong relative abundance in New Caledonia were similar to the 2008
estimate but significantly lower than the 2003 estimate. I explored the evidence for several
possible explanations for this result including: (1) an actual reduction in the size of the dugong
population between 2003 and 2008; (2) temporary migration within the survey area leading to
double counting in 2003; or (3) unaccounted biases associated with detection probability.
Although my results show that the discrepancy in dugong population estimates may be caused
by several factors, I could not come to a definite conclusion. Furthermore, my research
highlighted the importance of conducting replicate baseline surveys to enable robust
interpretation of temporal variation in subsequent population size estimates and in turn improve
the management of dugongs and marine mammals in general.
Dugongs were not explicitly considered in the design of the network of MPAs in New
Caledonia, despite being one of the region’s World Heritage values. In Chapter 3, I assessed the
capacity of the New Caledonia MPA network to protect dugongs from anthropogenic hazards.
My analysis demonstrated a spatial mismatch between locations that support high densities of
dugongs and the MPAs that provide the greatest protection from anthropogenic activities. My
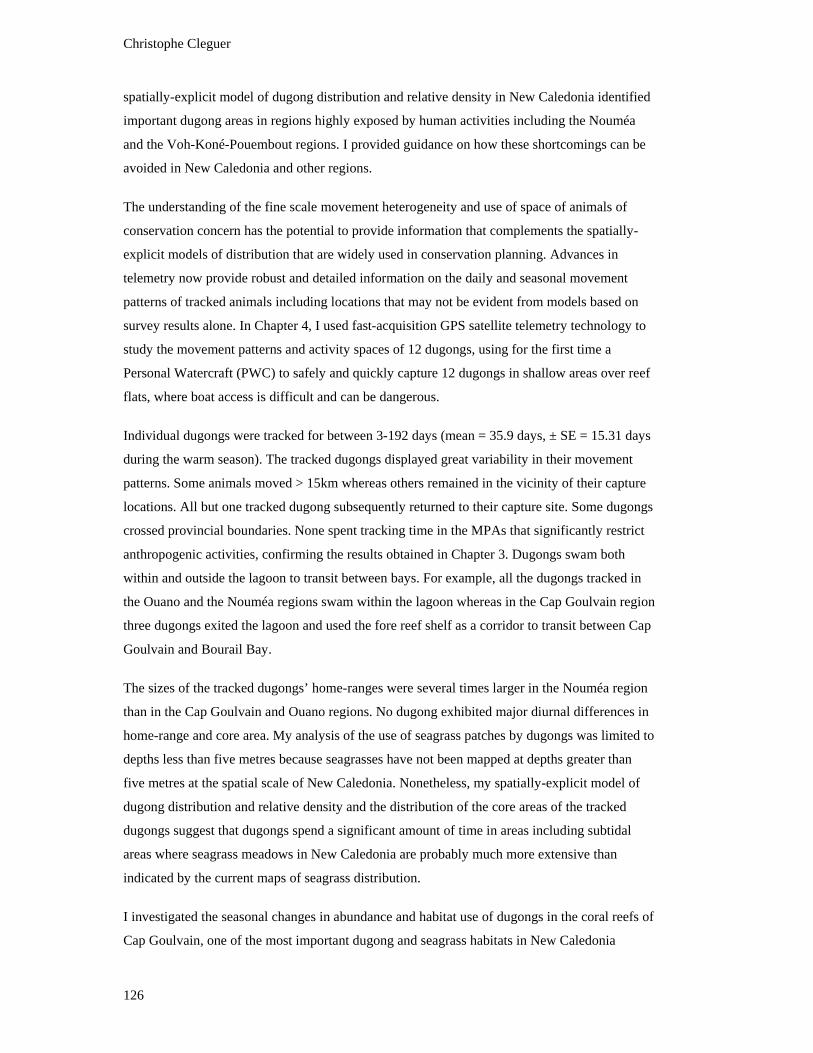
Christophe Cleguer
126
spatially-explicit model of dugong distribution and relative density in New Caledonia identified
important dugong areas in regions highly exposed by human activities including the Nouméa
and the Voh-Koné-Pouembout regions. I provided guidance on how these shortcomings can be
avoided in New Caledonia and other regions.
The understanding of the fine scale movement heterogeneity and use of space of animals of
conservation concern has the potential to provide information that complements the spatially-
explicit models of distribution that are widely used in conservation planning. Advances in
telemetry now provide robust and detailed information on the daily and seasonal movement
patterns of tracked animals including locations that may not be evident from models based on
survey results alone. In Chapter 4, I used fast-acquisition GPS satellite telemetry technology to
study the movement patterns and activity spaces of 12 dugongs, using for the first time a
Personal Watercraft (PWC) to safely and quickly capture 12 dugongs in shallow areas over reef
flats, where boat access is difficult and can be dangerous.
Individual dugongs were tracked for between 3-192 days (mean = 35.9 days, ± SE = 15.31 days
during the warm season). The tracked dugongs displayed great variability in their movement
patterns. Some animals moved > 15km whereas others remained in the vicinity of their capture
locations. All but one tracked dugong subsequently returned to their capture site. Some dugongs
crossed provincial boundaries. None spent tracking time in the MPAs that significantly restrict
anthropogenic activities, confirming the results obtained in Chapter 3. Dugongs swam both
within and outside the lagoon to transit between bays. For example, all the dugongs tracked in
the Ouano and the Nouméa regions swam within the lagoon whereas in the Cap Goulvain region
three dugongs exited the lagoon and used the fore reef shelf as a corridor to transit between Cap
Goulvain and Bourail Bay.
The sizes of the tracked dugongs’ home-ranges were several times larger in the Nouméa region
than in the Cap Goulvain and Ouano regions. No dugong exhibited major diurnal differences in
home-range and core area. My analysis of the use of seagrass patches by dugongs was limited to
depths less than five metres because seagrasses have not been mapped at depths greater than
five metres at the spatial scale of New Caledonia. Nonetheless, my spatially-explicit model of
dugong distribution and relative density and the distribution of the core areas of the tracked
dugongs suggest that dugongs spend a significant amount of time in areas including subtidal
areas where seagrass meadows in New Caledonia are probably much more extensive than
indicated by the current maps of seagrass distribution.
I investigated the seasonal changes in abundance and habitat use of dugongs in the coral reefs of
Cap Goulvain, one of the most important dugong and seagrass habitats in New Caledonia

Chapter 6: General discussion
127
(Chapter 5). I also explored the behaviour of dugongs aggregating over the fore reef shelf
outside the lagoon. I found strong seasonal and tidal patterns in dugong relative abundance,
behaviour and habitat use at Cap Goulvain. Substantially fewer dugongs were sighted during the
warm season, between October and March, than during the cool season, between April and
September. Aggregations of dugongs inside the lagoon were generally sighted in the warm
season; those outside the lagoon during the cool season. Aerial and underwater videos clearly
showed that the dugongs aggregating over the fore reef shelf were resting. The intensive use of
the outer lagoon area during the cool season coincided with the water temperatures being up to
2°C higher on the fore reef shelf than over the seagrass meadow and in the southern channel
inside the lagoon, suggesting that behavioural thermoregulation plays a key role in the seasonal
changes in number and behaviour of dugongs in Cap Goulvain. Nonetheless, the influence of
other explanatory factors including seasonal variation in the abundance of sharks and in
seagrass biomass and quality cannot be ruled out.
6.3 Management considerations
Managing at multiple spatial scales
The management agencies responsible for dugong conservation in New Caledonia operate at
provincial scales. I showed that important dugong habitats occur in both Province Nord and Sud
and that dugongs cross these jurisdictional boundaries (Chapter 4). Thus management needs to
be coordinated at an ecological scale relevant to the dugong by developing cross-jurisdictional
management arrangements between the government of New Caledonia and the Province Nord
and Sud of New Caledonia. As pointed out by Sheppard (2008) “the dugong population of any
one bay should be considered not as an isolated entity but as a fluctuating component of a
spatially dynamic metapopulation”.
My findings indicate the need to implement dugong conservation actions at local scales also. I
selected Cap Goulvain as a local scale case study (Chapter 4 and 5) because it is an important
dugong and seagrass habitat (Chapter 3). The tracking data indicated that dugongs made
intensive use of the Cap Goulvain region. My time series of fine-scale aerial surveys further
indicated that the number of dugongs in the Cap Goulvain region varied seasonally and that the
dugongs used habitats differently according to the season and tide. Human activity in Cap
Goulvain was very low at the time of my study. However, this situation is about to change.
Construction of a large beach resort ten kilometres south of Cap Goulvain has recently been
completed. The hotel should attract a large number of tourists to the region and it is designed to
make the lagoon one of its main attractions. Strategies to mitigate the potential risk of
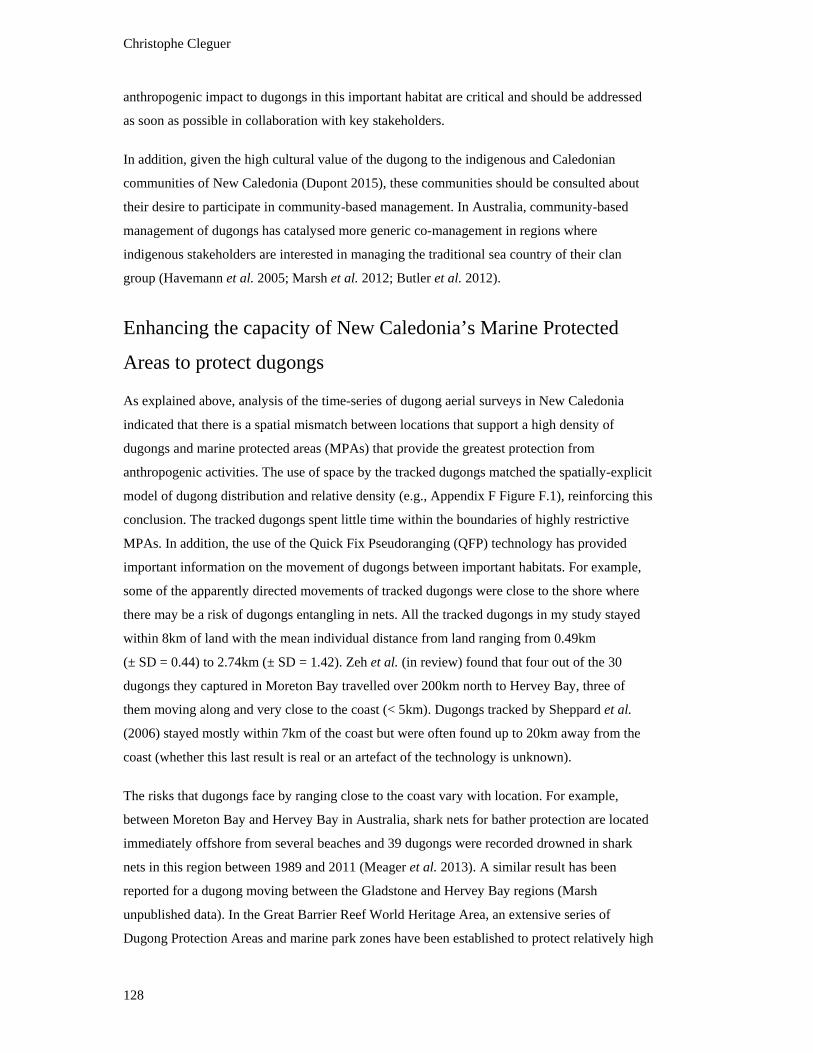
Christophe Cleguer
128
anthropogenic impact to dugongs in this important habitat are critical and should be addressed
as soon as possible in collaboration with key stakeholders.
In addition, given the high cultural value of the dugong to the indigenous and Caledonian
communities of New Caledonia (Dupont 2015), these communities should be consulted about
their desire to participate in community-based management. In Australia, community-based
management of dugongs has catalysed more generic co-management in regions where
indigenous stakeholders are interested in managing the traditional sea country of their clan
group (Havemann et al. 2005; Marsh et al. 2012; Butler et al. 2012).
Enhancing the capacity of New Caledonia’s Marine Protected
Areas to protect dugongs
As explained above, analysis of the time-series of dugong aerial surveys in New Caledonia
indicated that there is a spatial mismatch between locations that support a high density of
dugongs and marine protected areas (MPAs) that provide the greatest protection from
anthropogenic activities. The use of space by the tracked dugongs matched the spatially-explicit
model of dugong distribution and relative density (e.g., Appendix F Figure F.1), reinforcing this
conclusion. The tracked dugongs spent little time within the boundaries of highly restrictive
MPAs. In addition, the use of the Quick Fix Pseudoranging (QFP) technology has provided
important information on the movement of dugongs between important habitats. For example,
some of the apparently directed movements of tracked dugongs were close to the shore where
there may be a risk of dugongs entangling in nets. All the tracked dugongs in my study stayed
within 8km of land with the mean individual distance from land ranging from 0.49km
(± SD = 0.44) to 2.74km (± SD = 1.42). Zeh et al. (in review) found that four out of the 30
dugongs they captured in Moreton Bay travelled over 200km north to Hervey Bay, three of
them moving along and very close to the coast (< 5km). Dugongs tracked by Sheppard et al.
(2006) stayed mostly within 7km of the coast but were often found up to 20km away from the
coast (whether this last result is real or an artefact of the technology is unknown).
The risks that dugongs face by ranging close to the coast vary with location. For example,
between Moreton Bay and Hervey Bay in Australia, shark nets for bather protection are located
immediately offshore from several beaches and 39 dugongs were recorded drowned in shark
nets in this region between 1989 and 2011 (Meager et al. 2013). A similar result has been
reported for a dugong moving between the Gladstone and Hervey Bay regions (Marsh
unpublished data). In the Great Barrier Reef World Heritage Area, an extensive series of
Dugong Protection Areas and marine park zones have been established to protect relatively high
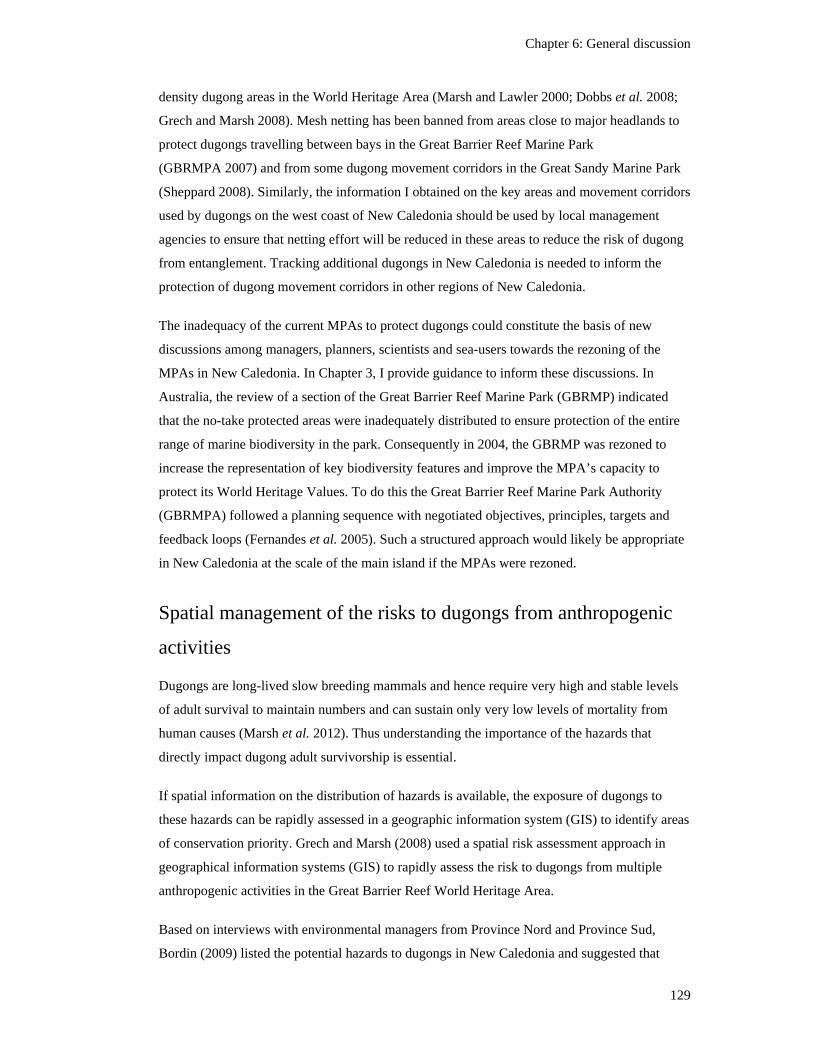
Chapter 6: General discussion
129
density dugong areas in the World Heritage Area (Marsh and Lawler 2000; Dobbs et al. 2008;
Grech and Marsh 2008). Mesh netting has been banned from areas close to major headlands to
protect dugongs travelling between bays in the Great Barrier Reef Marine Park
(GBRMPA 2007) and from some dugong movement corridors in the Great Sandy Marine Park
(Sheppard 2008). Similarly, the information I obtained on the key areas and movement corridors
used by dugongs on the west coast of New Caledonia should be used by local management
agencies to ensure that netting effort will be reduced in these areas to reduce the risk of dugong
from entanglement. Tracking additional dugongs in New Caledonia is needed to inform the
protection of dugong movement corridors in other regions of New Caledonia.
The inadequacy of the current MPAs to protect dugongs could constitute the basis of new
discussions among managers, planners, scientists and sea-users towards the rezoning of the
MPAs in New Caledonia. In Chapter 3, I provide guidance to inform these discussions. In
Australia, the review of a section of the Great Barrier Reef Marine Park (GBRMP) indicated
that the no-take protected areas were inadequately distributed to ensure protection of the entire
range of marine biodiversity in the park. Consequently in 2004, the GBRMP was rezoned to
increase the representation of key biodiversity features and improve the MPA’s capacity to
protect its World Heritage Values. To do this the Great Barrier Reef Marine Park Authority
(GBRMPA) followed a planning sequence with negotiated objectives, principles, targets and
feedback loops (Fernandes et al. 2005). Such a structured approach would likely be appropriate
in New Caledonia at the scale of the main island if the MPAs were rezoned.
Spatial management of the risks to dugongs from anthropogenic
activities
Dugongs are long-lived slow breeding mammals and hence require very high and stable levels
of adult survival to maintain numbers and can sustain only very low levels of mortality from
human causes (Marsh et al. 2012). Thus understanding the importance of the hazards that
directly impact dugong adult survivorship is essential.
If spatial information on the distribution of hazards is available, the exposure of dugongs to
these hazards can be rapidly assessed in a geographic information system (GIS) to identify areas
of conservation priority. Grech and Marsh (2008) used a spatial risk assessment approach in
geographical information systems (GIS) to rapidly assess the risk to dugongs from multiple
anthropogenic activities in the Great Barrier Reef World Heritage Area.
Based on interviews with environmental managers from Province Nord and Province Sud,
Bordin (2009) listed the potential hazards to dugongs in New Caledonia and suggested that
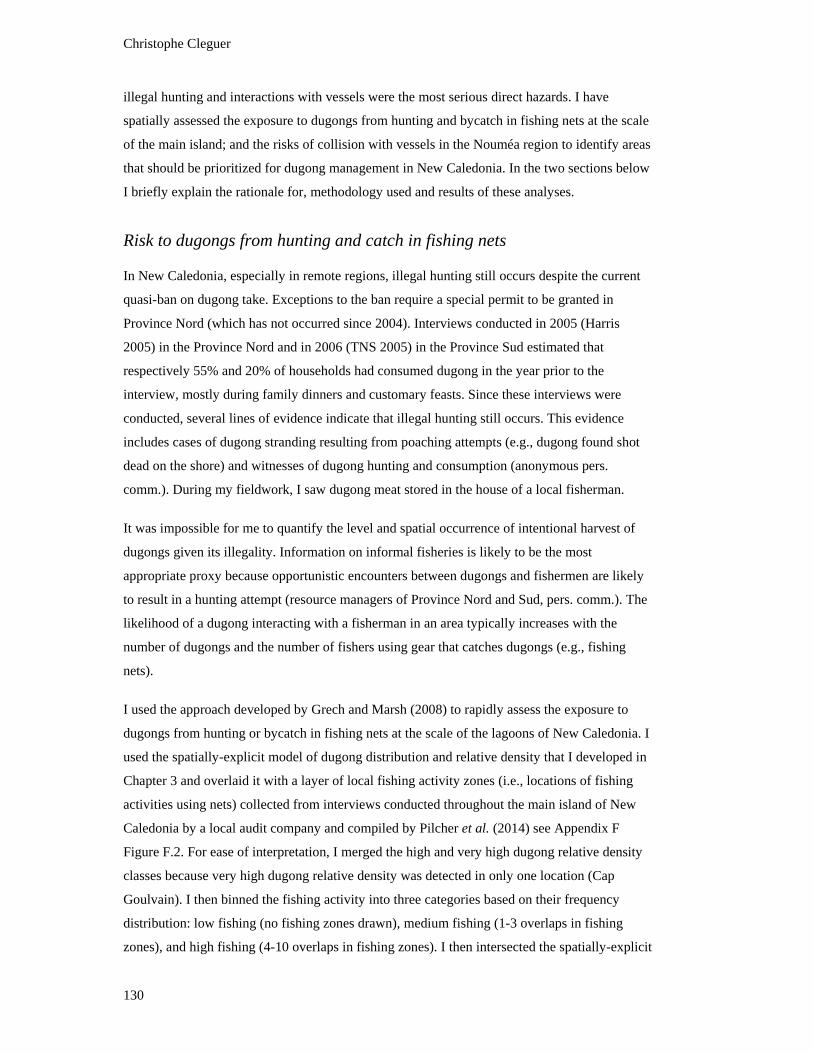
Christophe Cleguer
130
illegal hunting and interactions with vessels were the most serious direct hazards. I have
spatially assessed the exposure to dugongs from hunting and bycatch in fishing nets at the scale
of the main island; and the risks of collision with vessels in the Nouméa region to identify areas
that should be prioritized for dugong management in New Caledonia. In the two sections below
I briefly explain the rationale for, methodology used and results of these analyses.
Risk to dugongs from hunting and catch in fishing nets
In New Caledonia, especially in remote regions, illegal hunting still occurs despite the current
quasi-ban on dugong take. Exceptions to the ban require a special permit to be granted in
Province Nord (which has not occurred since 2004). Interviews conducted in 2005 (Harris
2005) in the Province Nord and in 2006 (TNS 2005) in the Province Sud estimated that
respectively 55% and 20% of households had consumed dugong in the year prior to the
interview, mostly during family dinners and customary feasts. Since these interviews were
conducted, several lines of evidence indicate that illegal hunting still occurs. This evidence
includes cases of dugong stranding resulting from poaching attempts (e.g., dugong found shot
dead on the shore) and witnesses of dugong hunting and consumption (anonymous pers.
comm.). During my fieldwork, I saw dugong meat stored in the house of a local fisherman.
It was impossible for me to quantify the level and spatial occurrence of intentional harvest of
dugongs given its illegality. Information on informal fisheries is likely to be the most
appropriate proxy because opportunistic encounters between dugongs and fishermen are likely
to result in a hunting attempt (resource managers of Province Nord and Sud, pers. comm.). The
likelihood of a dugong interacting with a fisherman in an area typically increases with the
number of dugongs and the number of fishers using gear that catches dugongs (e.g., fishing
nets).
I used the approach developed by Grech and Marsh (2008) to rapidly assess the exposure to
dugongs from hunting or bycatch in fishing nets at the scale of the lagoons of New Caledonia. I
used the spatially-explicit model of dugong distribution and relative density that I developed in
Chapter 3 and overlaid it with a layer of local fishing activity zones (i.e., locations of fishing
activities using nets) collected from interviews conducted throughout the main island of New
Caledonia by a local audit company and compiled by Pilcher et al. (2014) see Appendix F
Figure F.2. For ease of interpretation, I merged the high and very high dugong relative density
classes because very high dugong relative density was detected in only one location (Cap
Goulvain). I then binned the fishing activity into three categories based on their frequency
distribution: low fishing (no fishing zones drawn), medium fishing (1-3 overlaps in fishing
zones), and high fishing (4-10 overlaps in fishing zones). I then intersected the spatially-explicit
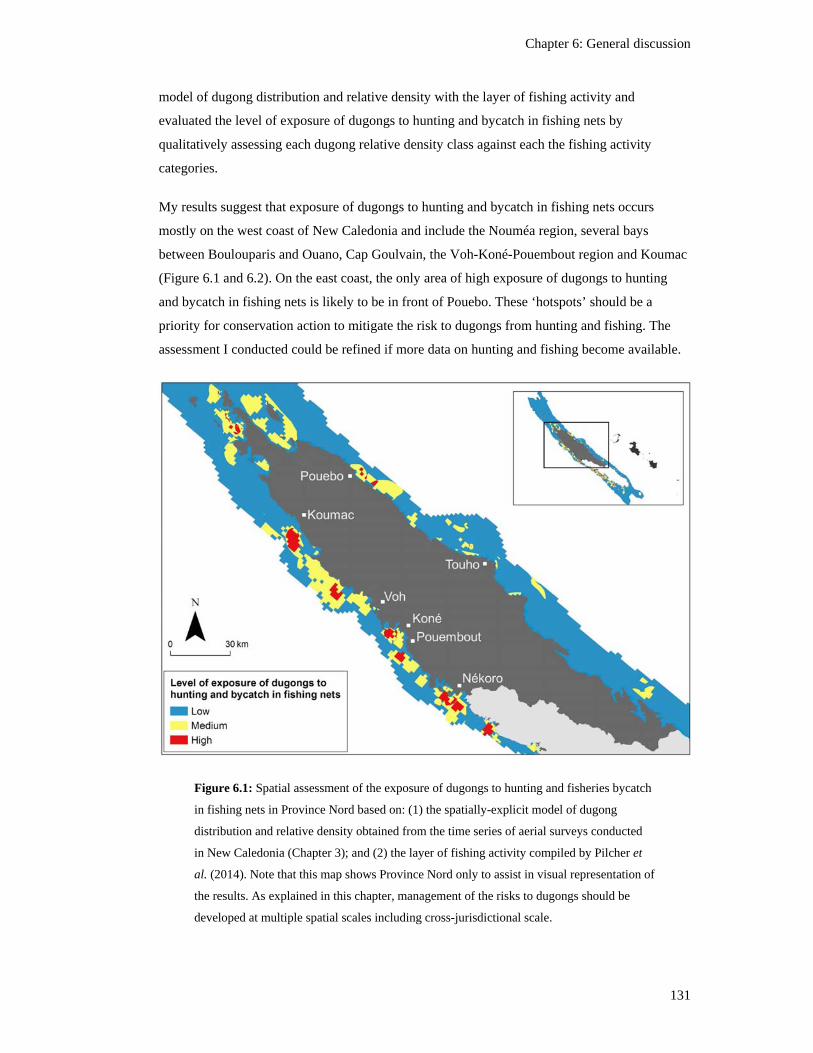
Chapter 6: General discussion
131
model of dugong distribution and relative density with the layer of fishing activity and
evaluated the level of exposure of dugongs to hunting and bycatch in fishing nets by
qualitatively assessing each dugong relative density class against each the fishing activity
categories.
My results suggest that exposure of dugongs to hunting and bycatch in fishing nets occurs
mostly on the west coast of New Caledonia and include the Nouméa region, several bays
between Boulouparis and Ouano, Cap Goulvain, the Voh-Koné-Pouembout region and Koumac
(Figure 6.1 and 6.2). On the east coast, the only area of high exposure of dugongs to hunting
and bycatch in fishing nets is likely to be in front of Pouebo. These ‘hotspots’ should be a
priority for conservation action to mitigate the risk to dugongs from hunting and fishing. The
assessment I conducted could be refined if more data on hunting and fishing become available.
Figure 6.1: Spatial assessment of the exposure of dugongs to hunting and fisheries bycatch
in fishing nets in Province Nord based on: (1) the spatially-explicit model of dugong
distribution and relative density obtained from the time series of aerial surveys conducted
in New Caledonia (Chapter 3); and (2) the layer of fishing activity compiled by Pilcher et
al. (2014). Note that this map shows Province Nord only to assist in visual representation of
the results. As explained in this chapter, management of the risks to dugongs should be
developed at multiple spatial scales including cross-jurisdictional scale.
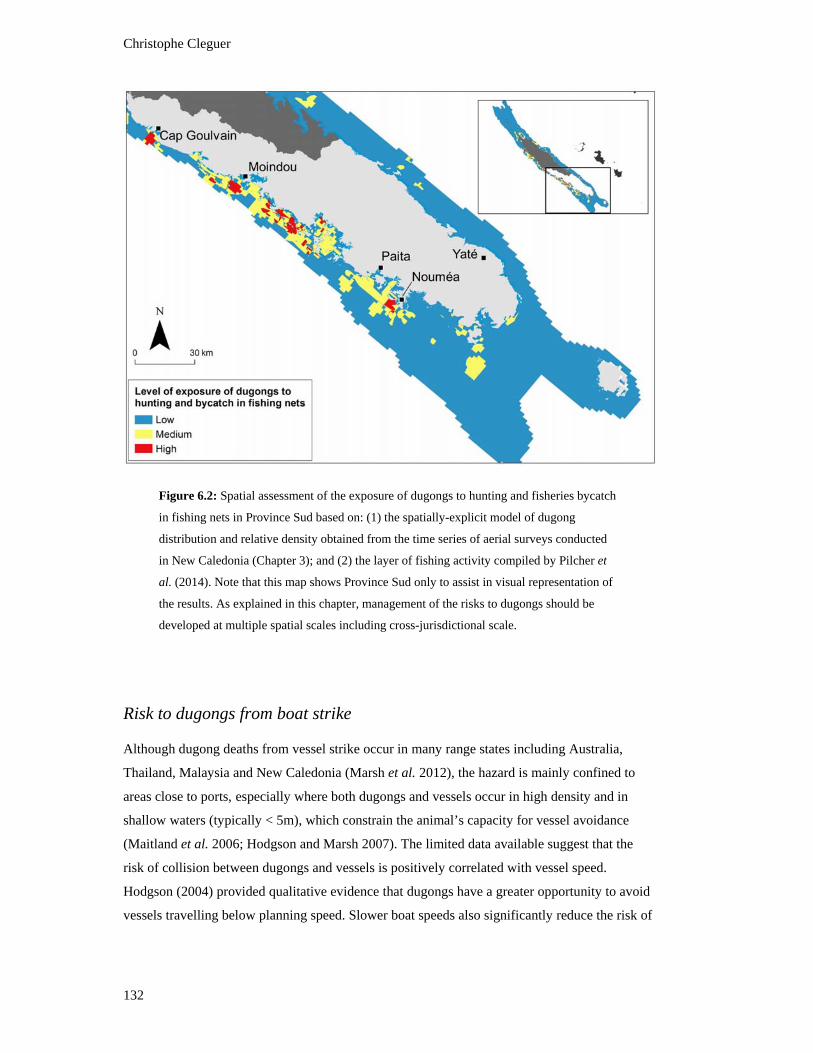
Christophe Cleguer
132
Figure 6.2: Spatial assessment of the exposure of dugongs to hunting and fisheries bycatch
in fishing nets in Province Sud based on: (1) the spatially-explicit model of dugong
distribution and relative density obtained from the time series of aerial surveys conducted
in New Caledonia (Chapter 3); and (2) the layer of fishing activity compiled by Pilcher et
al. (2014). Note that this map shows Province Sud only to assist in visual representation of
the results. As explained in this chapter, management of the risks to dugongs should be
developed at multiple spatial scales including cross-jurisdictional scale.
Risk to dugongs from boat strike
Although dugong deaths from vessel strike occur in many range states including Australia,
Thailand, Malaysia and New Caledonia (Marsh et al. 2012), the hazard is mainly confined to
areas close to ports, especially where both dugongs and vessels occur in high density and in
shallow waters (typically < 5m), which constrain the animal’s capacity for vessel avoidance
(Maitland et al. 2006; Hodgson and Marsh 2007). The limited data available suggest that the
risk of collision between dugongs and vessels is positively correlated with vessel speed.
Hodgson (2004) provided qualitative evidence that dugongs have a greater opportunity to avoid
vessels travelling below planning speed. Slower boat speeds also significantly reduce the risk of
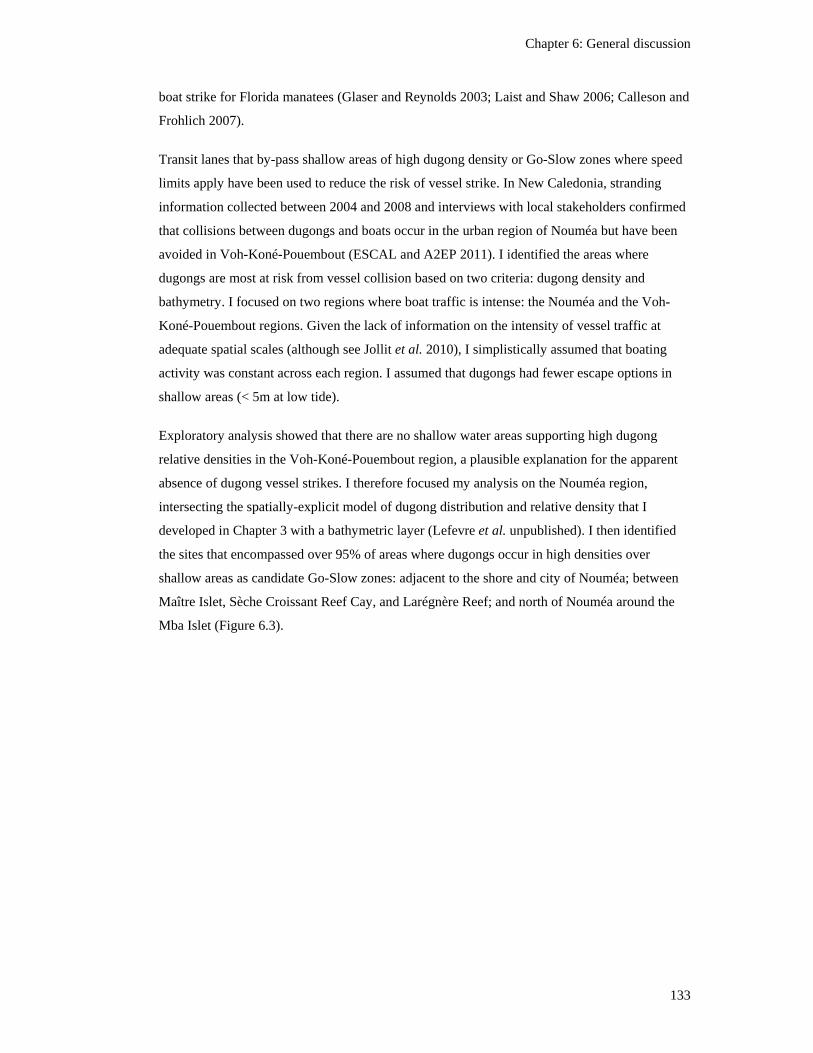
Chapter 6: General discussion
133
boat strike for Florida manatees (Glaser and Reynolds 2003; Laist and Shaw 2006; Calleson and
Frohlich 2007).
Transit lanes that by-pass shallow areas of high dugong density or Go-Slow zones where speed
limits apply have been used to reduce the risk of vessel strike. In New Caledonia, stranding
information collected between 2004 and 2008 and interviews with local stakeholders confirmed
that collisions between dugongs and boats occur in the urban region of Nouméa but have been
avoided in Voh-Koné-Pouembout (ESCAL and A2EP 2011). I identified the areas where
dugongs are most at risk from vessel collision based on two criteria: dugong density and
bathymetry. I focused on two regions where boat traffic is intense: the Nouméa and the Voh-
Koné-Pouembout regions. Given the lack of information on the intensity of vessel traffic at
adequate spatial scales (although see Jollit et al. 2010), I simplistically assumed that boating
activity was constant across each region. I assumed that dugongs had fewer escape options in
shallow areas (< 5m at low tide).
Exploratory analysis showed that there are no shallow water areas supporting high dugong
relative densities in the Voh-Koné-Pouembout region, a plausible explanation for the apparent
absence of dugong vessel strikes. I therefore focused my analysis on the Nouméa region,
intersecting the spatially-explicit model of dugong distribution and relative density that I
developed in Chapter 3 with a bathymetric layer (Lefevre et al. unpublished). I then identified
the sites that encompassed over 95% of areas where dugongs occur in high densities over
shallow areas as candidate Go-Slow zones: adjacent to the shore and city of Nouméa; between
Maître Islet, Sèche Croissant Reef Cay, and Larégnère Reef; and north of Nouméa around the
Mba Islet (Figure 6.3).
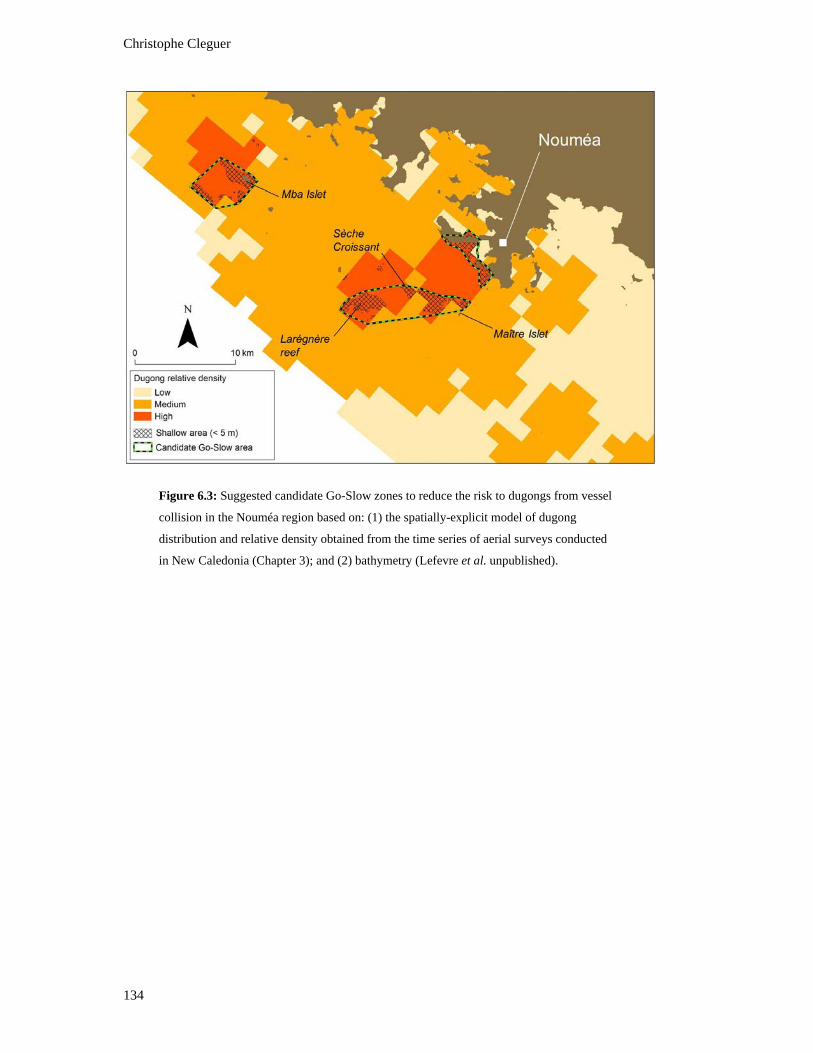
Christophe Cleguer
134
Figure 6.3: Suggested candidate Go-Slow zones to reduce the risk to dugongs from vessel
collision in the Nouméa region based on: (1) the spatially-explicit model of dugong
distribution and relative density obtained from the time series of aerial surveys conducted
in New Caledonia (Chapter 3); and (2) bathymetry (Lefevre et al. unpublished).
Chapter 6: General discussion
135
Legislation and compliance
One of the primary goals of the Dugong Action Plan for New Caledonia is to increase
awareness that dugong hunting is illegal. An enlarged Dugong Action Plan (DAP) Committee
which includes teachers and local associations for environmental education is currently focusing
on this issue. Funding has been allocated and the enlarged committee is currently developing
culturally appropriate outreach materials (e.g., TV advertisements, calendars with drawings
from schools kids, educational books). Nonetheless, a recent social survey conducted in the
north-east and in the mid-west coastal regions of New Caledonia indicates that people are aware
that killing a dugong in New Caledonia without a valid permit is against the law (Dupont 2015).
In the conservation context, non-compliance is common; it is one of the largest illegal activities
in the world, degrading social, environmental and economic goals (Haken 2011). Thus,
understanding and managing compliance is key for ensuring effective conservation of natural
resources. Social surveys are the simplest method of studying compliance, but the responses are
likely to be biased because non-compliance is perceived as clandestine behaviour and the
likelihood of deceitful responses is high. Methods for studying compliance have recently been
reviewed by Arias (2015). These methods should be investigated along with understanding
fundamental cultural values and changing those values and consequent behaviour, to enhance
understanding of non-compliance with dugong hunting regulations in New Caledonia with a
view to implementing them more effectively.
Environmental regulations are difficult to implement in New Caledonia (Sourisseau et al. 2010).
The division of responsibilities between the French government, the government of New
Caledonia, and the provinces is one of the factors that impede the effective application of
regulations. For example, marine fisheries and coastal MPA regulations are the responsibility of
the provincial authorities but the New Caledonia government is in charge of monitoring and
enforcement. Patrolling and enforcement are weak because the provinces have limited capacity
to control human activities at the spatial scale of the large lagoons of New Caledonia. The
challenge is for local authorities to work out an effective way enforcing environmental laws in
New Caledonia. Allocating sufficient funding and staffing to ensure that existing laws are
enforced will be critical.
Dugong population monitoring
As discussed in Chapter 2, detecting trends in dugong and other marine mammal species
abundance in a management time frame when animals occur at low densities is very difficult
unless changes are very large (Taylor and Gerrodette 1993; Marsh 1995; Taylor et al. 2007).
Christophe Cleguer
136
Nonetheless, dugong aerial surveys in New Caledonia have been very useful to show that there
was no seasonal effect in the dugong population size estimates (Chapter 2) and for identifying
important dugong habitats (Chapter 3). Continuing to conduct regular aerial surveys for
dugongs in New Caledonia will allow spatial and temporal changes in the important dugong
habitats in the region to be monitored. It will be important to reach agreement about the
optimum time between surveys and the timing of the surveys based on: (1) power analysis of
their capacity to detect trends (Gerrodette 1987); (2) the need to retain corporate memory of the
methodology; (3) the lessons from my experience and analysis (Chapter 2).
Given the uncertainties that remain in the dugong relative abundance estimates and the lack of
robust information on the number of dugongs killed by anthropogenic activities in New
Caledonia, it is difficult to conclude whether this level or removal of dugongs is sustainable or
not. A comprehensive record of dugong mortality in New Caledonia could help to identify areas
where conservation should be prioritized and enable the relative importance of the various
causes of anthropogenic mortality to be estimated. This approach will be very difficult to
implement given that most hunting is illegal. However, involving local communities in a
stranding network across New Caledonia should be logistically possible and more widely
acceptable than monitoring mortality per se, and have the added advantage of increasing
understanding of the demography and biology of other marine mammals and marine turtles in
the region.
6.4 Future research on dugong and seagrass
ecology
Mapping subtidal seagrasses
Seagrass habitats are reported to be declining worldwide (Waycott et al. 2009). Various
anthropogenic activities potentially harm seagrasses: dredging, coastal development, damage
associated with over exploitation of coastal resources, recreational boating activities and
nutrient and sediment loading from adjacent land catchments (Cambridge and McComb 1984;
Short and Wyllie-Echeverria 1996; Coles et al. 2003; Orth et al. 2006; Waycott et al. 2009). In
New Caledonia, the increase in coastal human population density and resource developments in
mining and agriculture, especially on the west coast is inevitably placing pressures on the
adjacent marine environment and seagrass ecosystems (Hily et al. 2010). Local resource
managers in New Caledonia are aware of the importance of seagrasses to the maintenance of
Chapter 6: General discussion
137
coastal ecosystems and they have classified seagrasses as an ‘Ecosystem Heritage’ (Province
Nord 2008; Province Sud 2009).
The shallow seagrasses (< 5m) of New Caledonia have been mapped using remote sensing
(Andréfouët et al. 2010). I used this map in Chapters 4 and 5 to provide an indication of the use
of shallow seagrass meadows by dugongs at different spatial scales in New Caledonia. The
resolution and information provided by the map of seagrass I used is not appropriate for fine-
scale analysis of the seagrass use by dugongs in New Caledonia. Although seagrasses present in
waters deeper than five metres are unlikely to occur at high density (Hily et al. 2010), they may
be used by dugongs when intertidal seagrass are unavailable. Australian studies show that
dugongs also routinely use subtidal seagrass habitats (Holley et al. 2006; Sheppard et al. 2007,
2009), a result concordant with my tracking data. Locating and protecting seagrass habitats that
are important to dugongs is critical to the maintenance of both. The spatially-explicit model of
dugong distribution and relative density I developed in Chapter 3, the dugong movements and
home-range analysis conducted in Chapter 4, and the local seasonal and tidal use of habitats in
Cap Goulvain (Chapter 5) provide an excellent basis for using dugongs as indicators to design a
program to map the distribution of subtidal seagrasses in the lagoons of New Caledonia for
subsequent ground-truthing as was done in the Northern Great Barrier Reef and Torres Strait in
Australia (Helene Marsh pers. comm.). An accurate map of the subtidal seagrasses in the
lagoons of New Caledonia combined with dugong telemetry data could improve the evidence-
base for conserving dugongs and their seagrass habitat in this region. For example seagrass
maps in the south-west lagoon near Nouméa could be developed using multibeam sonars and
supporting ground-truth data (e.g., Kenny et al. 2003; Komatsu et al. 2003).
Knowledge on the nutritional ecology of herbivores is central to understanding their activity
patterns, demography, and distribution (Choat and Clements 1998). The diet of sirenians has
traditionally been studied through gut, mouth, and faeces content analysis (see Marsh et al. 2012
for review). These methods provide snapshots of the food recently eaten by individual sirenians.
Measurement of the ratio of stable isotopes from various tissues can provide information on the
average dietary intake of individuals over a long period of time and has been used in Florida
manatees (Alves-Stanley and Worthy 2009; Alves-Stanley et al. 2010). In New Caledonia, there
are few opportunities to collect dugong stomach contents (Claire Garrigue pers. comm.).
Nonetheless, the collection of soft tissues is now substantial and could be used in isotopic
analyses to provide information on the food selection of dugongs in New Caledonia.
Christophe Cleguer
138
Dugong spatial ecology
In Chapter 4, I provided insights into the movement heterogeneity and home-range of dugongs
in the lagoons of New Caledonia. The inferences from my study are limited by sample size and
time of tracking (i.e., warm season). A complementary study could determine whether dugongs
use space differently during the cool season. For example, tracking dugongs at the start of the
cool season in Cap Goulvain could improve understanding of how individual dugongs commute
across habitats in this region and provide further evidence to evaluate the behavioural
thermoregulation hypothesis suggested in Chapter 5. Tagging more dugongs in Cap Goulvain or
other regions where the lagoon is narrow would also provide further information on the use of
the fore reef shelf as a resting as well as a transiting platform.
The Quick Fix Pseudo Ranging (QFP) technology enabled me to identify previously unknown
movement corridors used by dugongs to commute between bays. Such information is difficult to
obtain from aerial surveys and provides supplementary information relevant to the conservation
of important dugong habitats. Tracking more dugongs with QFP technology could reveal
dugong movement corridors of dugongs in other regions. For example, the development of a
mining complex in the Voh-Koné-Pouembout region is resulting in significant human and
economic developments; and fishing pressure on local reef fish resources is likely to increase
(Guillemot et al. 2009). Fine-scale data on the movement patterns of dugongs in this region
could inform local spatial management actions (e.g., implementation of netting closures in areas
intensively used by dugongs). In the Nouméa region, my tracking information is based on only
three dugongs, one of which was tracked for only three days. Inferences about the dugongs’ use
of space in the Nouméa region would be stronger if more dugongs were tracked.
6.5 Collaborative research
My dugong satellite tracking study provided an opportunity to collect skin and faeces samples
across different regions. These samples have been used by Oremus et al. (2015) to conduct a
study on the conservation genetics and evolutionary history of dugongs in New Caledonia.
I deployed time depth recorders (TDRs, MK9 Wildlife Computers) on the 12 dugongs I
captured in New Caledonia. Nine recorders were retrieved and are now being used by Dr Rie
Hagihara, from James Cook University to explore the dive patterns of the dugongs tracked in
New Caledonia with a view to improving the estimates of dugong population size estimates in
the region.

Chapter 6: General discussion
139
6.6 Concluding remarks
In New Caledonia, the management of the dugong population has been hampered by a lack of
scientific information. My research tackled this issue by providing an evidence-base for the
conservation and management of dugongs in New Caledonia at several spatial and temporal
scales. Future research should be directed at understanding why illegal hunting occurs in New
Caledonia and how compliance with the law could be increased. Further investigating the fine-
scale interaction between seagrasses and dugongs in New Caledonia would also greatly enhance
our understanding of dugong and seagrass ecology in tropical lagoons and coral reefs more
generically.

References
141
References
AGARDY, T., BRIDGEWATER, P., CROSBY, M. P., DAY, J., DAYTON, P. K.,
KENCHINGTON, R., LAFFOLEY, D., MCCONNEY, P., MURRAY, P. A.,
PARKS, J. E. & PEAU, L. 2003. Dangerous targets? Unresolved issues and
ideological clashes around marine protected areas. Aquatic conservation: marine
and freshwater ecosystems, 13, 353-367.
AGARDY, T., DI SCIARA, G. N. & CHRISTIE, P. 2011. Mind the gap: Addressing
the shortcomings of marine protected areas through large scale marine spatial
planning. Marine Policy, 35, 226-232.
ALLEN, S., MARSH, H. & HODGSON, A. 2004. Occurrence and conservation of the
Dugong (Sirenia: Dugongidae) in New South Wales. Proceedings of the Linnean
Society of New South Wales, 125, 211-216.
ALVES-STANLEY, C. D. & WORTHY, G. A. 2009. Carbon and nitrogen stable
isotope turnover rates and diet–tissue discrimination in Florida manatees
(Trichechus manatus latirostris). The Journal of experimental biology, 212,
2349-2355.
ALVES-STANLEY, C. D., WORTHY, G. A. & BONDE, R. K. 2010. Feeding
preferences of West Indian manatees in Florida, Belize, and Puerto Rico as
indicated by stable isotope analysis. Marine Ecology Progress Series, 402, 255-
267.
ANDERSON, P. 1986. Dugongs of Shark Bay, Australia-Seasonal migration, water
temperature, and forage. Natl. Geogr. Res., 2, 473-490.
ANDERSON, P. K. 1994. Dugong Distribution, the Seagrass Halophila-Spinulosa, and
Thermal Environment in Winter in Deeper Waters of Eastern Shark Bay,
Western-Australia. Wildlife Research, 21, 381-388.
ANDERSON, P. K. & BARCLAY, R. M. 1995. Acoustic signals of solitary dugongs:
physical characteristics and behavioral correlates. Journal of Mammalogy, 76,
1226-1237.
ANDERSON, P. & BIRTLES, A. 1978. Behaviour and Ecology of the Dugong,
Dugong Dugon (Sirenia): Observations in Shoalwater and Cleveland Bays,
Queensland. Wildlife Research, 5, 1-23.
Christophe Cleguer
142
ANDRÉFOUËT, S., TORRES-PULLIZA, D., DOSDANE, M., KRANENBURG, C. &
MURCH, B. 2004. Atlas des récifs coralliens de Nouvelle-Calédonie. IFRECOR
Nouvelle-Calédonie, IRD, Nouméa, 26.
ANDRÉFOUËT, S., CABIOCH, G., FLAMAND, B. & PELLETIER, B. 2009. A
reappraisal of the diversity of geomorphological and genetic processes of New
Caledonian coral reefs: a synthesis from optical remote sensing, coring and
acoustic multibeam observations. Coral Reefs, 28, 691-707.
ANDRÉFOUËT, S., PAYRI, C., KULBICKI, M., SCOPÉLITIS, J., DALLEAU, M.,
MELLIN, C., SCAMPS, M. & DIRBERG, G. 2010. Mesure, suivi et potentiel
économique de la diversité de l’habitat récifo-lagonaire néo-calédonien :
inventaire des herbiers, suivi des zones coralliennes et rôle des habitats dans la
distribution des ressources en poissons de récifs. Rapport Conventions Sciences
de la Mer. Biologie Marine, IRD Centre de Nouméa / ZoNéCo.
ANDREWS, R. D., PITMAN, R. L. & BALLANCE, L. T. 2008. Satellite tracking
reveals distinct movement patterns for Type B and Type C killer whales in the
southern Ross Sea, Antarctica. Polar Biology, 31, 1461-1468.
ARAGONES, L. & MARSH, H. 2000. Impact of dugong grazing and turtle cropping on
tropical seagrass communities. Pacific Conservation Biology, 5, 277-288.
ARAGONES, L. V., JEFFERSON, T. A. & MARSH, H. 1997. Marine mammal survey
techniques applicable in developing countries. Asian Marine Biology, 14, 15-39.
ARAGONES, L. V., LAWLER, I., MARSH, H., DOMNING, D. & HODGSON, A.
2012. The role of sirenians in aquatic ecosystems. Sirenian conservation: issues
and strategies in developing countries. University Press of Florida, Gainesville,
FL, 4-11.
ARIAS, A. 2015. Understanding and managing compliance in the nature conservation
context. Journal of environmental management, 153, 134-143.
ARIAS, A., PRESSEY, R. L., JONES, R. E., ÁLVAREZ-ROMERO, J. G. & CINNER,
J. E. 2014. Optimizing enforcement and compliance in offshore marine
protected areas: a case study from Cocos Island, Costa Rica. Oryx, 1-9.
BAILEY, H. & THOMPSON, P. M. 2009. Using marine mammal habitat modelling to
identify priority conservation zones within a marine protected area. Marine
Ecology Progress Series, 378, 279-287.
BALDWIN, B. 1974. Behavioural thermoregulation. Heat Loss from Animals and Man:
Assessment and Control. Butterworths London.

References
143
BALMFORD, A., BENNUN, L., TEN BRINK, B., COOPER, D., CÔTÉ, I. M.,
CRANE, P., DOBSON, A., DUDLEY, N., DUTTON, I. & GREEN, R. E. 2005.
The convention on biological diversity's 2010 target. Science, 307.
BAUER, G. B., COLBERT, D. E., GASPARD III, J. C., LITTLEFIELD, B. &
FELLNER, W. 2003. Underwater visual acuity of Florida manatees (Trichechus
manatus latirostris). International Journal of Comparative Psychology, 16.
BAYLISS, P. 1986. Factors Affecting Surveys of Marine Fauna, and their Relationship
to a Census of Dugongs in the Coastal Waters of the Northern Territory.
Australian Wildlife Research, 13: 27-37.
BEARZI, M. 2012. Cetaceans and MPAs should go hand in hand: A case study in Santa
Monica Bay, California. Ocean & Coastal Management, 60, 56-59.
BENSON, S. R., CROLL, D. A., MARINOVIC, B. B., CHAVEZ, F. P. & HARVEY, J.
T. 2002. Changes in the cetacean assemblage of a coastal upwelling ecosystem
during El Niño 1997–98 and La Niña 1999. Progress in Oceanography, 54, 279-
291.
BERTRAM, C. & BERTRAM, K. R. 1970. Dugongs in Ceylon. Oryx, 10, 362-364.
BEYER, H.L. 2012. Geospatial Modelling Environment (Version 0.6.0.0). Available:
http://www.spatialecology.com/gme
BJØRGE, A. 2001. How persistent are marine mammal habitats in an ocean of
variability? Marine Mammals. Springer.
BLECKMANN, H. 1986. Role of the lateral line in fish behaviour. The behaviour of
teleost fishes. Springer.
BOGRAD, S. J., BLOCK, B. A., COSTA, D. P. & GODLEY, B. J. 2010. Biologging
technologies: new tools for conservation. Introduction. Endangered Species
Research, 10, 1-7.
BONVALLOT, J., GAY, J.-C. & E., H. 2012. Atlas de la Nouvelle-Caledonie,
Marseille-Noumea.
BORDIN, A. 2009. Identification d'aires de conservation prioritaires pour la
population de dugongs qui utilise les lagons de Nouvelle-Calédonie. MSc
dissertation, Université de La Rochelle & Opération Cétacés.
BOSSART, G. D., MEISNER, R. A., ROMMEL, S., GHIM, S. & JENSON, A. B.
2003. Pathological features of the Florida manatee cold stress syndrome.
Aquatic Mammals, 29, 9-17.
Christophe Cleguer
144
BOSSART, G. D., MEISNER, R. A., ROMMEL, S. A., LIGHTSEY, J. D., VARELA,
R. A. & DEFRAN, R. 2004. Pathologic Findings in Florida
Manatees(Trichechus manatus latirostris). Aquatic Mammals, 30, 434-440.
BOWEN, W. 1997. Role of marine mammals in aquatic ecosystems. Marine Ecology
Progress Series, 158, 74.
BOWEN, W. D. & SINIFF, D. B. 1999. Distribution, population biology, and feeding
ecology of marine mammals. Biology of marine mammals, 423-484.
BOYD, I. L., LOCKYER, C. & MARSH, H. D. 1999. Reproduction in marine
mammals. In: REYNOLDS III, J. E. & ROMMEL, S. A. (eds.) Biology of
marine mammals. Washington, D.C.: Smithsonian Institute Press.
BOYLE, S. A., LOURENÇO, W. C., DA SILVA, L. R. & SMITH, A. T. 2009. Home
range estimates vary with sample size and methods. Folia Primatologica, 80,
33-42.
BRAULIK, G. 2015. Finally:Announcement from Mexico on Vaquita Conservation.
http://www.iucn-csg.org/index.php/2015/01/15/finally-announcement-from-
mexico-on-vaquita-conservation. (accessed 25 jul 2015).
BROWN, R. F., WRIGHT, B. E., RIEMER, S. D. & LAAKE, J. 2005. Trends in
abundance and current status of harbor seals in Oregon: 1977–2003. Marine
Mammal Science, 21, 657-670.
BUTCHART, S. H., WALPOLE, M., COLLEN, B., VAN STRIEN, A.,
SCHARLEMANN, J. P., ALMOND, R. E., BAILLIE, J. E., BOMHARD, B.,
BROWN, C. & BRUNO, J. 2010. Global biodiversity: indicators of recent
declines. Science, 328, 1164-1168.
BUTLER, J. R., TAWAKE, A., SKEWES, T., TAWAKE, L. & MCGRATH, V. 2012.
Integrating traditional ecological knowledge and fisheries management in the
Torres Strait, Australia: the catalytic role of turtles and dugong as cultural
keystone species. Ecology and Society, 17, 1-19.
CABANAC, M., DUCLAUX, R. & GILLET, A. 1970. Thermoregulation
comportementale chez le chien: effects de la fievre et de la thyroxine.
Physiology & behavior, 5, 697-704.
CALENGE, C. & CALENGE, M. C. 2015. Package ‘adehabitat’.
CALLESON, C. S. & FROHLICH, R. K. 2007. Slower boat speeds reduce risks to
manatees. Endangered Species Research, 3, 295-304.
References
145
CAMBRIDGE, M. & MCCOMB, A. 1984. The loss of seagrasses in Cockburn Sound,
Western Australia. I. The time course and magnitude of seagrass decline in
relation to industrial development. Aquatic Botany, 20, 229-243.
CAÑADAS, A., SAGARMINAGA, R., DE STEPHANIS, R., URQUIOLA, E. &
HAMMOND, P. 2005. Habitat preference modelling as a conservation tool:
proposals for marine protected areas for cetaceans in southern Spanish waters.
Aquatic conservation: marine and freshwater ecosystems, 15, 495-521.
CATO, D. H. 1978. Marine biological choruses observed in tropical waters near
Australia. The Journal of the Acoustical Society of America, 64, 736-743.
CAUGHLEY, G. 1974. Bias in Aerial Survey. The Journal of Wildlife Management, 38,
921-933.
CAUGHLEY, G. 1977. Sampling in aerial survey. The Journal of Wildlife
Management, 605-615.
CENTRAL INTELLIGENCE AGENCY 2015. The world factbook. Available:
https://www.cia.gov/library/publications/the-world-factbook/geos/nc.html
CHILVERS, B. L., DELEAN, S., GALES, N. J., HOLLEY, D. K., LAWLER, I. R.,
MARSH, H. & PREEN, A. R. 2004. Diving behaviour of dugongs, Dugong
dugon. Journal of Experimental Marine Biology and Ecology, 304, 203-224.
CHOAT, J. & CLEMENTS, K. 1998. Vertebrate herbivores in marine and terrestrial
environments: a nutritional ecology perspective. Annual Review of Ecology and
Systematics, 375-403.
CHOQUENOT, D. & RUSCOE, W. A. 2003. Landscape complementation and food
limitation of large herbivores: habitat-related constraints on the foraging
efficiency of wild pigs. Journal of Animal Ecology, 72, 14-26.
CLEGUER, C. 2010. Le dugong (Dugong dugon), monographie de l'espèce, état des
lieux des connaissances et des méthodologies d'études. Propositions d'actions en
vue d'améliorer les connaissances relatives au dugong en Nouvelle-Calédonie.
In: PROTEGEES, A. D. A. M. (ed.).
CLEGUER, C., GRECH, A., GARRIGUE, C. & MARSH, H. 2015. Spatial mismatch
between marine protected areas and dugongs in New Caledonia. Biological
Conservation, 184, 154-162.
CMS 2009. Appendices I and II of the Convention on the Conservation of Migratory
Species of Wild Animals (CMS).
Christophe Cleguer
146
CMS. 2010. Convention on Migratory Species. [Online]. Available at:
http://www.cms.int. .
CMS. 2014. Memorandum of Understanding on the Conservation and Management of
Dugongs (Dugong dugon) and their Habitats throughout their Range [Online].
Available: http://www.cms.int/species/dugong/index.htm (accessed 14 Feb
2014).
CMS. 2015. Convention on the Conservation of Migratory Species of Wild Animals -
Memorandum of Understanding on the Conservation and Management of
Dugongs (Dugong dugon) and their Habitats throughout their Range [Online].
http://www.cms.int/species/dugong/index.htm (accessed 11 June 2015).
Available: http://www.cms.int/species/dugong/index.htm (accessed 14 Feb
2014).
COLES, R. G., MCKENZIE, L. J. & CAMPBELL, S. J. 2003. Chapter 11: The
seagrasses of eastern Australia. In: SHORT, E. P. G. A. F. T. (ed.) World Atlas
of Seagrasses. University of California Press, Berkley, USA COLYVAN, M.,
BURGMAN, M. A., TODD, C. R., RESIT AKÇAKAYA, H. & BOEK, C.
1999. The treatment of uncertainty and the structure of the IUCN threatened
species categories. Biological Conservation, 89, 245-249.
COLES, R. G., MCKENZIE, L., RASHEED, M., MELLORS, J., TAYLOR, H., DEW,
K., MCKENNA, S., SANKEY, T., CARTER, A. & GRECH, A. 2007. Status
and trends of seagrass habitats in the Great Barrier Reef World Heritage Area,
Department of Primary Industries and Fisheries.
COLES, R., GRECH, A., RASHEED, M., MCKENZIE, L., UNSWORTH, R. &
SHORT, F. 2011. Seagrass ecology and threats in the tropical Indo-Pacific
bioregion. Seagrass: Ecology, Uses and Threats. Hauppauge: Nova Science
Publishers, 225-240.
COLYVAN, M., BURGMAN, M. A., TODD, C. R., RESIT AKÇAKAYA, H. &
BOEK, C. 1999. The treatment of uncertainty and the structure of the IUCN
threatened species categories. Biological Conservation, 89, 245-249.
COPE, R., POLLETT, P., LANYON, J. & SEDDON, J. 2015. Indirect detection of
genetic dispersal (movement and breeding events) through pedigree analysis of
dugong populations in southern Queensland, Australia. Biological Conservation,
181, 91-101.
References
147
COSSINS, A. R. & BOWLER, K. 1987. Temperature biology of animals, Springer
Science & Business Media.
COSTA, D. P. & KOOYMAN, G. L. 1982. Oxygen consumption, thermoregulation,
and the effect of fur oiling and washing on the sea otter, Enhydra lutris.
Canadian Journal of Zoology, 60, 2761-2767.
CRAIN, C. M., HALPERN, B. S., BECK, M. W. & KAPPEL, C. V. 2009.
Understanding and managing human threats to the coastal marine environment.
Annals of the New York Academy of Sciences, 1162, 39-62.
DAVID, G., LEOPOLD, M., DUMAS, P. S., FERRARIS, J., HERRENSCHMIDT, J.
B. & FONTENELLE, G. 2010. Integrated coastal zone management
perspectives to ensure the sustainability of coral reefs in New Caledonia. Marine
Pollution Bulletin, 61, 323-334.
DAVIDZON, M. I. 2012. Newton’s law of cooling and its interpretation. International
Journal of Heat and Mass Transfer, 55, 5397-5402.
DAWES, C. J. 1998. Marine botany, John Wiley & Sons.
DAWSON, S., WADE, P., SLOOTEN, E. & BARLOW, J. A. Y. 2008. Design and
field methods for sighting surveys of cetaceans in coastal and riverine habitats.
Mammal Review, 38, 19-49.
DAY, J. C. & DOBBS, K. 2013. Effective governance of a large and complex cross-
jurisdictional marine protected area: Australia's Great Barrier Reef. Marine
Policy, 41, 14-24.
DE IONGH, H. H., LANGEVELD, P. & VAN DER WAL, M. 1998. Movement and
Home Ranges of Dugongs Around the Lease Islands, East Indonesia Marine
Ecology, 19, 179-193.
DEUTSCH, C. J., REID, J. P., BONDE, R. K., EASTON, D. E., KOCHMAN, H. I. &
O'SHEA, T. J. 2003. Seasonal movements, migratory behavior, and site fidelity
of West Indian manatees along the Atlantic Coast of the United States. Wildlife
Monographs, 1-77.
DEUTSCH, C., EDWARDS, H. & BARLAS, M. 2006. Florida manatee foraging
behavior around a winter warm-water refuge. Final Report to the Wildlife
Foundation ofFlorida. Grant No. CWT0405-12. FWCIFWRI file FCWT0405-12-
F.
DEVILLERS, R., PRESSEY, R. L., GRECH, A., KITTINGER, J. N., EDGAR, G. J.,
WARD, T. & WATSON, R. 2014. Reinventing residual reserves in the sea: are
Christophe Cleguer
148
we favouring ease of establishment over need for protection? Aquatic
conservation: marine and freshwater ecosystems.
DI MININ, E. & TOIVONEN, T. 2015. Global Protected Area Expansion: Creating
More than Paper Parks. BioScience, biv064.
DIJKGRAAF, S. 1963. The functioning and significance of the lateral‐line organs.
Biological Reviews, 38, 51-105.
DOBBS, K., FERNANDES, L., SLEGERS, S., JAGO, B., THOMPSON, L., HALL, J.,
DAY, J., CAMERON, D., TANZER, J. & MACDONALD, F. 2008.
Incorporating dugong habitats into the marine protected area design for the
Great Barrier Reef Marine Park, Queensland, Australia. Ocean & Coastal
Management, 51, 368-375.
DRYDEN, J., GRECH, A., MOLONEY, J. & HAMANN, M. 2008. Rezoning of the
Great Barrier Reef World Heritage Area: does it afford greater protection for
marine turtles? Wildlife Research, 35, 477-485.
DUDLEY, N. 2008. Guidelines for applying protected area management categories,
IUCN.
DUPONT, A. 2015. Évaluation de la place du dugong dans la société néo-calédonienne.
Plan d'action dugong Nouvelle-Caledonie 2010-2015. Rapport final.
EAGLES, P. F., MCCOOL, S. F., HAYNES, C. D., PHILLIPS, A. & PROGRAMME,
U. N. E. 2002. Sustainable tourism in protected areas: Guidelines for planning
and management, IUCN Gland, Switzerland and Cambridge, UK.
EDGAR, G. J. 2011. Does the global network of marine protected areas provide an
adequate safety net for marine biodiversity? Aquatic conservation: marine and
freshwater ecosystems, 21, 313-316.
EDGAR, G. J., RUSS, G. R. & BABCOCK, R. C. 2007. Marine protected areas.
Marine Ecology, 533-555.
EROS, C., MARSH, H., BONDE, R., O'SHEA, T., BECK, C., RECCHIA, C., DOBBS,
K., TURNER, M., LEMM, S. & PEARS, R. 2007. Procedures for the salvage
and necropsy of the Dugong (Dugong Dugon)-2007, Great Barrier Reef Marine
Park Authority.
ESCAL & A2EP 2011. Enquête sur les pressions exercées par les activités nautiques sur
la population de dugongs en Nouvelle Calédonie. Agence des Aires Marine
Protegees.
References
149
ESRI 2011. ArcGIS Desktop: Release 10. Redlands: CA: Environmental Systems
Research Institute.
ESRI 2013. ArcGIS Desktop: Release 10.2. Redlands: CA: Environmental Systems
Research Institute.
FEDAK, M. A., ANDERSON, S. S. & CURRY, M. G. 1983. Attachment of a radio tag
to the fur of seals. Journal of Zoology, 200, 298-300.
FERNANDES, L., DAY, J., LEWIS, A., SLEGERS, S., KERRIGAN, B., BREEN, D.,
CAMERON, D., JAGO, B., HALL, J. & LOWE, D. 2005. Establishing
Representative No‐Take Areas in the Great Barrier Reef: Large‐Scale
Implementation of Theory on Marine Protected Areas. Conservation Biology,
19, 1733-1744.
FIEBERG, J. & KOCHANNY, C. O. 2005. Quantifying home-range overlap: the
importance of the utilization distribution. Journal of Wildlife Management, 69,
1346-1359.
FITZSIMONS, J. A. 2011. Mislabeling marine protected areas and why it matters—a
case study of Australia. Conservation Letters, 4, 340-345.
FLORES, P. A. & BAZZALO, M. 2004. Home ranges and movement patterns of the
marine tucuxi dolphin, Sotalia fluviatilis, in Baía Norte, southern Brazil. Latin
American Journal of Aquatic Mammals, 3, 37-52.
FLOURIS, A. D. 2011. Functional architecture of behavioural thermoregulation.
European journal of applied physiology, 111, 1-8.
FOX, H. E., MASCIA, M. B., BASURTO, X., COSTA, A., GLEW, L., HEINEMANN,
D., KARRER, L. B., LESTER, S. E., LOMBANA, A. V. & POMEROY, R. S.
2012. Reexamining the science of marine protected areas: linking knowledge to
action. Conservation Letters, 5, 1-10.
FUENTES, M., BELL, I., HAGIHARA, R., HAMANN, M., HAZEL, J., HUTH, A.,
SEMINOFF, J., SOBTZICK, S. & MARSH, H. 2015. Improving in-water
estimates of marine turtle abundance by adjusting aerial survey counts for
perception and availability biases. Journal of Experimental Marine Biology and
Ecology, 471, 77-83.
GAINES, S. D., WHITE, C., CARR, M. H. & PALUMBI, S. R. 2010. Designing
marine reserve networks for both conservation and fisheries management.
Proceedings of the National Academy of Sciences, 107, 18286-18293.
Christophe Cleguer
150
GALES, N., HINDELL, M. & KIRKWOOD, R. 2003. Marine Mammals: Fisheries,
Tourism and Management Issues: Fisheries, Tourism and Management Issues,
Csiro Publishing.
GALES, N., MCCAULEY, R. D., LANYON, J. M. & HOLLEY, D. 2004. Change in
abundance of dugongs in Shark Bay, Ningaloo and Exmouth Gulf, Wertern
Australia: evidence for large-scale migration. Wildlife Research, 31.
GALLIVAN, G. & BEST, R. 1980. Metabolism and respiration of the Amazonian
manatee (Trichechus inunguis). Physiological zoology, 245-253.
GARRIGUE, C. 1987. Les macrophytes benthiques du lagon Sud-Ouest de la Nouvelle-
Calédonie (cartes des principaux groupements). Rapports scientifiques de
techniques sciences de la mer. Nouméa.
GARRIGUE, C. 1995. Macrophyte associations on the soft bottoms of the south-west
lagoon of New Caledonia: description, structure and biomass. Botanica Marina,
38, 481-492.
GARRIGUE, C. 1998. Distribution and biomass of microphytes measured by benthic
chlorophyll a in a tropical lagoon (New Caledonia, South Pacific).
Hydrobiologia, 385, 1-10.
GARRIGUE, C. & PATENAUDE, N. 2004. Statut de la population de dugongs en
Provinces Nord et Sud de Nouvelle-Calédonie. Rapport final.
GARRIGUE, C., PATENAUDE, N. & MARSH, H. 2008. Distribution and abundance
of the dugong in New Caledonia, southwest Pacific. Marine Mammal Science,
24, 81-90.
GARRIGUE, C., OREMUS, M., SCHAFFAR, A. & PATENAUDE, N. 2009. Etude du
statut de la population de dugongs en provinces Nord et Sud 2008. Rapport
final.
GASPARI, S. 1994. Haul-out behaviour, site fidelity and vigilance of common seals
(Phoca vitulina) and grey seals (Halichoerus grypus) in the tees Estuary.
Durham University.
GBRMPA 2007. Great Barrier Reef Marine Park Authority Position Statement on the
conservation and management of protected species in relation to the Queensland
East Coast Inshore Finfish Fishery: 2007 position statement.
GBRMPA 2011. Extreme Weather and the Great Barrier Reef. In: AUSTRALIA, C. O.
(ed.). Great Barrier Reef Marine Park Authority.
References
151
GERRODETTE, T. 1987. A Power Analysis for Detecting Trends. Ecology, 68, 1364-
1372.
GERSTEIN, E. 2002. Manatees, Bioacoustics and Boats Hearing tests, environmental
measurements and acoustic phenomena may together explain why boats and
animals collide. American Scientist, 90, 154-163.
GESCHKE, K. & CHILVERS, B. L. 2010. Managing big boys: a case study on remote
anaesthesia and satellite tracking of adult male New Zealand sea lions
(Phocarctos hookeri). Wildlife Research, 36, 666-674.
GIBBS, J. P., DROEGE, S. & EAGLE, P. 1998. Monitoring populations of plants and
animals. BioScience, 935-940.
GIBBS, J. P., SNELL, H. L. & CAUSTON, C. E. 1999. Effective monitoring for
adaptive wildlife management: lessons from the Galapagos Islands. The Journal
of Wildlife Management, 1055-1065.
GILBERT, J. 1999. Review of previous Pacific walrus surveys to develop improved
survey designs. Marine mammal survey and assessment methods. AA Balkema,
Rotterdam, The Netherlands, 75-84.
GILLESPIE, A. 2005. The Dugong Action Plan for the South Pacific: An Evaluation
Based on the Need for International and Regional Conservation of Sirenians.
Ocean Development & International Law, 36, 135-158.
GLADSTONE, W., KRUPP, F. & YOUNIS, M. 2003. Development and management
of a network of marine protected areas in the Red Sea and Gulf of Aden region.
Ocean & Coastal Management, 46, 741-761.
GLASER, K. & REYNOLDS, III J. E. 2003. Mysterious manatees, University press of
Florida.
GORDON, C. J. 1985. Relationship between autonomic and behavioral
thermoregulation in the mouse. Physiology & behavior, 34, 687-690.
GRECH, A. & MARSH, H. 2007. Prioritising areas for dugong conservation in a
marine protected area using a spatially explicit population model. Applied GIS,
3, 1-14.
GRECH, A. & MARSH, H. 2008. Rapid Assessment of Risks to a Mobile Marine
Mammal in an Ecosystem Scale Marine Protected Area. Conservation Biology,
22, 711-720.
Christophe Cleguer
152
GRECH, A., SHEPPARD, J. & MARSH, H. 2011. Informing Species Conservation at
Multiple Scales Using Data Collected for Marine Mammal Stock Assessments.
Plos One, 6.
GREDZENS, C., MARSH, H., FUENTES, M. M., LIMPUS, C. J., SHIMADA, T. &
HAMANN, M. 2014. Satellite Tracking of Sympatric Marine Megafauna Can
Inform the Biological Basis for Species Co-Management. Plos One, 9, e98944.
GROVES, C. 2003. Drafting a conservation blueprint: a practitioner's guide to
planning for biodiversity, Island Press.
GROVES, C. R., JENSEN, D. B., VALUTIS, L. L., REDFORD, K. H., SHAFFER, M.
L., SCOTT, J. M., BAUMGARTNER, J. V., HIGGINS, J. V., BECK, M. W. &
ANDERSON, M. G. 2002. Planning for Biodiversity Conservation: Putting
Conservation Science into Practice A seven-step framework for developing
regional plans to conserve biological diversity, based upon principles of
conservation biology and ecology, is being used extensively by the nature
conservancy to identify priority areas for conservation. BioScience, 52, 499-512.
GUILLEMOT, N., LÉOPOLD, M., CUIF, M. & CHABANET, P. 2009.
Characterization and management of informal fisheries confronted with socio-
economic changes in New Caledonia (South Pacific). Fisheries Research, 98,
51-61.
HAGIHARA, R., JONES, R. E., GRECH, A., LANYON, J. M., SHEPPARD, J. K. &
MARSH, H. 2014. Improving population estimates by quantifying diving and
surfacing patterns: A dugong example. Marine Mammal Science, 30, 348-366.
HAKEN, J. 2011. Transnational crime in the developing world. Global financial
integrity.
HARINGTON, C. 2008. The evolution of Arctic marine mammals. Ecological
Applications, 18, S23-S40.
HARRIS 2005. Etude de la consommation des tortues et des vaches marines en
Province Nord. In: ENQUETE (ed.). Noumea.
HARTMAN, D. S. 1979. Ecology and behavior of the manatee (Trichechus manatus) in
Florida, American Society of Mammalogists Pittsburgh, Pennsylvania, USA.
HAVEMANN, P., THIRIET, D., MARSH, H. & JONES, C. 2005. Decolonising
conservation? traditional use of marine resources agreements and dugong
hunting in the Great Barrier Reef World Heritage Area. Environmental and
Planning Law Journal, 22, 258-280.
References
153
HEITHAUS, M. R. & DILL, L. M. 2002. Food availability and tiger shark predation
risk influence bottlenose dolphin habitat use. Ecology, 83, 480-491.
HEMMINGA, M. A. & DUARTE, C. M. 2000. Seagrass ecology, Cambridge
University Press.
HILY, C., DUCHÊNE, J., BOUCHON, C., BOUCHON-NAVARO, Y., GIGOU, A.,
PAYRI, C. & VÉDIE, F. 2010. Les herbiers de phanérogames marines de
l'outre-mer français, IFRECOR, Conservatoire du littoral.
HINES, E. M., REYNOLD, J., MIGNUCCI-GIANNONI, A., ARAGONES, L. &
MARMONTEL, M. 2012. Sirenian Conservation: Issues and Strategies in
Developing Countries, Gainesville, USA.
HODGSON, A. J. 2004. Dugong behaviour and responses to human influences. PhD,
James Cook University.
HODGSON, A. J. & MARSH, H. 2007. Response of dugongs to boat traffic: the risk of
disturbance and displacement. Journal of Experimental Marine Biology and
Ecology, 340, 50-61.
HODGSON, A. J., KELLY, N. & PEEL, D. 2013. Unmanned aerial vehicles (UAVs)
for surveying marine fauna: a dugong case study. Plos One, 8, e79556.
HOLLEY, D. K. 2006. Movement patterns and habitat usage of Shark Bay dugongs.
Master of Science, Edith Cowan University.
HOLLEY, D. K., LAWLER, I. R. & GALES, N. J. 2006. Summer survey of dugong
distribution and abundance in Shark Bay reveals additional key habitat area.
Wildlife Research, 33, 243-250.
HOOKER, S. K. & BAIRD, R. W. 2001. Diving and ranging behaviour of odontocetes:
a methodological review and critique. Mammal Review, 31, 81-105.
HOOKER, S. K. & GERBER, L. R. 2004. Marine Reserves as a Tool for Ecosystem-
Based Management: The Potential Importance of Megafauna. BioScience, 54,
27-39.
HORGAN, P., BOOTH, D., NICHOLS, C. & LANYON, J. M. 2014. Insulative
capacity of the integument of the dugong (Dugong dugon): thermal conductivity,
conductance and resistance measured by in vitro heat flux. Marine Biology, 161,
1395-1407.
HOTHORN, T., BRETZ, F. & WESTFALL, P. 2008. Simultaneous inference in general
parametric models. Biometrical Journal, 50, 346-363.
Christophe Cleguer
154
HOYT, E. 2012. Marine Protected Areas for Whales, Dolphins and Porpoises: A world
handbook for cetacean habitat conservation and planning, Routledge.
HUSAR, S. L. 1978. Dugong dugon. American Society of Mammalogists, 88, 1-7.
HUSSEY, N. E., KESSEL, S. T., AARESTRUP, K., COOKE, S. J., COWLEY, P. D.,
FISK, A. T., HARCOURT, R. G., HOLLAND, K. N., IVERSON, S. J. &
KOCIK, J. F. 2015. Aquatic animal telemetry: A panoramic window into the
underwater world. Science, 348, 1255642.
INGRAM, S. N. & ROGAN, E. 2002. Identifying critical areas and habitat preferences
of bottlenose dolphins Tursiops truncatus. Marine Ecology Progress Series, 244,
247-255.
IRVINE, A. B. 1983. Manatee metabolism and its influence on distribution in Florida.
Biological Conservation, 25, 315-334.
ISEE. 2014. Recensement de population [Online]. Available:
http://www.isee.nc/population/population.html. [Accessed 10 July 2015]
IUCN. 2012a. IUCN Red List Categories and Criteria: Version 3.1. Second edition.
Gland, Switzerland and Cambridge, UK: IUCN. iv + 32pp.
IUCN 2012b. Guidelines for Application of IUCN Red List Criteria at Regional and
National Levels: Version 4.0. Gland, Switzerland and Cambridge, UK: IUCN. iii
+41pp.
IUCN. 2015. IUCN Red List of threatened species: version 2015.2 [Online].
http://www.iucnredlist.org/. Available: http://www.iucnredlist.org/ [Accessed 05
July 2015].
JACOB, T. & GARDES, L. 2010. Propositions relatives au développement des
connaissances de la population de dugongs en Nouvelle-Calédonie. Période
2010-2012. Agence des Aires Marines Protégées. Nouméa, New Caledonia.
JEFFERSON, T. A., LEATHERWOOD, S. & WEBBER, M. A. 1993. Marine
mammals of the world, Food & Agriculture Org.
JOHNSON, D. H. 2002. The Importance of Replication in Wildlife Research. The
Journal of Wildlife Management, 66, 919-932.
JOHNSTONE, I. M. & HUDSON, B. E. T. 1981. The Dugong Diet - Mouth Sample
Analysis. Bulletin of Marine Science, 31, 681-690.
JOLLIT, I., LÉOPOLD, M., GUILLEMOT, N., DAVID, G., CHABANET, P.,
LEBIGRE, J. & FERRARIS, J. 2010. Geographical aspects of informal reef
fishery systems in New Caledonia. Marine Pollution Bulletin, 61, 585-597.
References
155
JONES, G., KALY, U., ZANN, L. & KAILOLA, P. 1995. Conservation of rare,
threatened and endemic marine species in Australia. State of the marine
environment report for Australia, Technical Annex, 1.
KENCHINGTON, R. & DAY, J. 2011. Zoning, a fundamental cornerstone of effective
Marine Spatial Planning: lessons learnt from the Great Barrier Reef, Australia.
Journal of Coastal Conservation, 15, 271-278.
KENNY, A., CATO, I., DESPREZ, M., FADER, G., SCHÜTTENHELM, R. & SIDE,
J. 2003. An overview of seabed-mapping technologies in the context of marine
habitat classification. ICES Journal of Marine Science: Journal du Conseil, 60,
411-418.
KOMATSU, T., IGARASHI, C., TATSUKAWA, K., SULTANA, S., MATSUOKA, Y.
& HARADA, S. 2003. Use of multi-beam sonar to map seagrass beds in Otsuchi
Bay on the Sanriku Coast of Japan. Aquatic Living Resources, 16, 223-230.
KWAN, D. 2002. Towards a sustainable indigenous fishery for dugongs in Torres
Strait : a contribution of empirical data analysis and process. . PhD thesis,
James Cook University.
LAIST, D. W. & REYNOLDS, III J. E. 2005. Influence of power plants and other
warm-water refuges on florida manatees. Marine Mammal Science, 21, 739-764.
LAIST, D. W. & SHAW, C. 2006. Preliminary evidence that boat speed restrictions
reduce deaths of Florida manatees. Marine Mammal Science, 22, 472-479.
LANYON, J. M. 2003. Distribution and abundance of dugongs in Moreton Bay,
Queensland, Australia. Wildlife Research, 30, 397-409.
LANYON, J. M., JOHNS, T. & SNEATH, H. L. 2005. Year-round presence of dugongs
in Pumicestone Passage, south-east Queensland, examined in relation to water
temperature and seagrass distribution. Wildlife Research, 32, 361-368.
LANYON, J. M., SLADE, R. W., SNEATH, H. L., BRODERICK, D., KIRKWOOD, J.
M., LIMPUS, D., LIMPUS, C. J. & JESSOP, T. 2006. A method for capturing
dugongs (Dugong dugong) in open water Aquatic Mammals, 32, 196-201.
LEBLIC, I., 2008. Vivre de la mer, vivre avec le terre… en pays kanak. Savoirs et
techniques des pêcheurs kanak du sud de la Nouvelle-Calédonie, Collection
Travaux et documents océanistes, Société des Océanistes Quai Branly, Paris, pp.
283.
LE BORGNE, R., DOUILLET, P., FICHEZ, R. & TORRÉTON, J.-P. 2010.
Hydrography and plankton temporal variabilities at different time scales in the
Christophe Cleguer
156
southwest lagoon of New Caledonia: A review. Marine Pollution Bulletin, 61,
297-308.
LEFEBVRE, L., ACKERMAN, B., PORTIER, K. & POLLOCK, K. 1995. Aerial
survey as a technique for estimating trends in manatee population size-problems
and prospects. Population biology of the Florida manatee. National Biological
Service Information and Technology Report, 1, 63-74.
LEFEBVRE, L. W., REID, J. P., KENWORTHY, W. J. & POWELL, J. A. 2000.
Characterizing manatee habitat use and seagrass grazing in Florida and Puerto
Rico: implications for conservation and management. Pacific Conservation
Biology, 5, 289-298.
LEGIFRANCE 2015. Consitution du 4 octobre 1958. Available:
http://www.legifrance.gouv.fr/affichTexte.do?cidTexte=LEGITEXT000006071
194#0
LEVIN, M. J. & PFEIFFER, C. J. 2002. Gross and microscopic observations on the
lingual structure of the Florida manatee Trichechus manatus latirostris.
Anatomia,Histologia, Embryologia, 31, 278–285.
LOCKWOOD, M., WORBOYS, G. & KOTHARI, A. 2012. Managing protected areas:
a global guide, Routledge.
LOUIS-HARRIS 2005. Etude de la consommation des tortues et dugong en province
Nord.
LOURIE, S. A. & VINCENT, A. C. 2004. Using biogeography to help set priorities in
marine conservation. Conservation Biology, 18, 1004-1020.
LOVVORN, J. R., GREBMEIER, J. M., COOPER, L. W., BUMP, J. K. & RICHMAN,
S. E. 2009. Modeling marine protected areas for threatened eiders in a
climatically changing Bering Sea. Ecological Applications, 19, 1596-1613.
MAITLAND, R., LAWLER, I. & SHEPPARD, J. 2006. Assessing the risk of boat
strike on Dugongs Dugong dugon at Burrum Heads, Queensland, Australia.
Pacific Conservation Biology, 12, 321-326.
MANN, D. A., COLBERT, D. E., GASPARD, J. C., CASPER, B. M., COOK, M. L.,
REEP, R. L. & BAUER, G. B. 2005. Temporal resolution of the Florida
manatee (Trichechus manatus latirostris) auditory system. Journal of
Comparative Physiology A, 191, 903-908.
References
157
MARCOTTE, M. 2006. Steller watch: Timing of weaning and seasonal patterns in
numbers and activities of Steller sea lions (Eumetopias jubatus) at a year-round
haulout site in southeast Alaska.
MARGULES, C. R. & PRESSEY, R. L. 2000. Systematic conservation planning.
Nature, 405, 243-253.
MARSH, H. 1980. Age Determination of the Dugong (Dugong dugon (Müller))
Northern Australia and its Biological Implications. In: COMMISSION, R. O. T.
I. W. (ed.).
MARSH, H. 1986. The status of the dugong in Torres Strait. In: HAINES, A. K.,
WILLIAMS, G. C. & COATES, D. (eds.) Torres Strait Fisheries Seminar.
Canberra.
MARSH, H. 1995. The life history, pattern of breeding, and population dynamics of the
dugong. Proceedings of a workshop on manatee population biology. US Fish
and Wildlife. Service Technical Report.
MARSH, H. 2008. Dugong dugon. In: IUCN red list of threatened species [Online].
Available: http://www.iucnredlist.org/apps/redlist/details/6909/0 (accessed 02
nov 2013).
MARSH, H. & KWAN, D. 2008. Temporal variability in the life history and
reproductive biology of female dugongs in Torres Strait: The likely role of sea
grass dieback. Continental Shelf Research, 28, 2152-2159.
MARSH, H. & LAWLER, I. R. 2000. Dugong distribution and abundance in the
northern Great Barrier Reef Marine Park. In: AUTHORITY, G. B. R. M. P.
(ed.).
MARSH, H. & LAWLER, I. R. 2002. Dugong distribution and abundance in the
northern Great Barrier Reef Marine Park-November 2000.
MARSH, H. & MORALES-VELA, B. 2012. Guidelines for developing protected areas
for sirenians. In: HINES, E., REYNOLDS, III J. E., MIGNUCCI-GIANNONI,
A., ARAGONES, L. & MARMONTEL, M. (eds.) Sirenian conservation: issues
and strategies in developing countries. Gainesville: University Press of Florida.
MARSH, H. & RATHBUN, G. B. 1990. Development and Application of Conventional
and Satellite Radio Tracking Techniques for Studying Dugong Movements and
Habitat Use. Australian Wildlife Research, 17, 83-100.
Christophe Cleguer
158
MARSH, H. & SAALFELD, W. K. 1989. Distribution and Abundance of Dugongs in
the Northern Great Barrier-Reef Marine Park. Australian Wildlife Research, 16,
429-440.
MARSH, H. & SINCLAIR, D. F. 1989a. Correcting for visibility bias in strip transect
aerial surveys of aquatic fauna. Journal of Wildlife Management, 53, 1017-1024.
MARSH, H. & SINCLAIR, D. F. 1989b. An experimental evaluation of dugong and sea
turtle aerial survey techniques. Australian Wildlife Research, 16, 639-650.
MARSH, H., GARDNER, B. R. & HEINSOHN, G. E. 1981. Present-day hunting and
distribution of dugongs in the Wellesley Islands (Queensland): implications for
conservation. Biological Conservation, 19, 255-267.
MARSH, H., CHANNELLS, P. W., HEINSOHN, G. E. & MORRISSEY, J. 1982.
Analysis of Stomach Contents of Dugongs from Queensland. Australian Wildlife
Research, 9, 55-67.
MARSH, H., HEINSOHN, G. E. & MARSH, L. M. 1984. Breeding Cycle, Life-History
and Population-Dynamics of the Dugong, Dugong-Dugon (Sirenia,
Dugongidae). Australian Journal of Zoology, 32, 767-788.
MARSH, H., PRINCE, R. I. T., SAAFELD, W. K. & SHEPHERD, R. 1994. The
distribution and abundance of the dugong in Shark Bay, Western Australia.
Wildlife Research, 21, 149-161.
MARSH, H., EROS, C., CORKERON, P. & BREEN, B. 1999. A conservation strategy
for dugongs: implications of Australian research. Marine and Freshwater
Research, 50, 979-990.
MARSH, H., PENROSE, H., EROS, C. & HUGUES, J. 2002. Dugong: status reports
and action plans for countries and territories. . In: UNEP (ed.) Early warning
and assessment report series. Nairobi :United Nations Environement
Programme.
MARSH, H., ARNOLD, P. A., FREEMAN, M., HAYNES, D., LAIST, D., READ, A.
J., REYNOLDS, J. & KASUYA, T. 2003. Strategies for conserving marine
mammals. In: GALES, N., HINDELL, M. & KIRKWOOD , J. (eds.) Marine
mammals: Fisheries, Tourism and Management issues. Victoria, Australia.
MARSH, H., LAWLER, I. R., KWAN, D., DELEAN, S., POLLOCK, K. &
ALLDREDGE, M. 2004. Aerial surveys and the potential biological removal
References
159
technique indicate that the Torres Strait dugong fishery is unsustainable. Animal
Conservation, 7, 435-443.
MARSH, H., O'SHEA, T. J. & REYNOLDS III, J. E. 2012. Ecology and conservation
of the sirenia: dugongs and manatees, Cambridge Univ Pr.
MASINI, R. J., ANDERSON, P. K. & MCCOMB, A. J. 2001. A Halodule-dominated
community in a subtropical embayment: physical environment, productivity,
biomass, and impact of dugong grazing. Aquatic Botany, 71, 179-197.
MCCOOK, L. J., AYLING, T., CAPPO, M., CHOAT, J. H., EVANS, R. D., DE
FREITAS, D. M., HEUPEL, M., HUGHES, T. P., JONES, G. P., MAPSTONE,
B., MARSH, H., MILLS, M., MOLLOY, F. J., PITCHER, C. R., PRESSEY, R.
L., RUSS, G. R., SUTTON, S., SWEATMAN, H., TOBIN, R.,
WACHENFELD, D. R. & WILLIAMSON, D. H. 2010. Adaptive management
of the Great Barrier Reef: A globally significant demonstration of the benefits of
networks of marine reserves. Proceedings of the National Academy of Sciences
of the United States of America, 107, 18278-18285.
MCCULLOUGH, P. & NELDER, J. A. 1989. Generalized linear models. London:
Chapman & Hall.
MCMAHON, K. 2005. Recovery of Subtropical Seagrasses from Natural Disturbances,
University of Queensland.
MEAGER, J. J. & LIMPUS, C. 2014. Mortality of inshore marine mammals in eastern
Australia is predicted by freshwater discharge and air temperature. Plos One, 9,
e94849.
MEAGER, J. J., LIMPUS, C. J. & SUMPTON, W. 2013. A review of the population
dynamics of dugongs in southern Queensland: 1830-2012. CJ and Sumpton, W.
Brisbane: Department of Environment and Heritage Protection, Queensland
Government.
MÉTÉO-FRANCE 2014. Climat en Nouvelle-Caledonie [Online]. Available:
http://www.meteo.nc/climat/climat-en-nc [Accessed 8 July 2014].
MIKSIS-OLDS, J. L., DONAGHAY, P. L., MILLER, J. H., TYACK, P. L. &
REYNOLDS, J. E. 2007. Simulated vessel approaches elicit differential
responses from manatees. Marine Mammal Science, 23, 629-649.
MILLS, M., PRESSEY, R. L., WEEKS, R., FOALE, S. & BAN, N. C. 2010. A
mismatch of scales: challenges in planning for implementation of marine
protected areas in the Coral Triangle. Conservation Letters, 3, 291-303.

Christophe Cleguer
160
MORRISON, P., ROSENMANN, M. & ESTES, J. A. 1974. Metabolism and
thermoregulation in the sea otter. Physiological zoology, 218-229.
MoU 2007. Memorandum of Understanding on the conservation and management of
dugongs (Dugong dugon) and their habitats throughout their range [Online].
Available: http://www.cms.int/species/dugong/index.htm. [Accessed 25 June
2015].
NIETSCHMANN, B. 1984. Hunting and ecology of dugongs and green turtles, Torres
Strait, Australia. In: REPORTS, N. G. S. R. (ed.).
NIETSCHMANN, B. & NIETSCHMANN, J. 1981. Good dugong, bad dugong-bad
turtle, good turtle. Natural History, 90, 54-62.
NISHI, J. S., BUCKLAND, L. & TERRITORIES, N. 2000. An aerial survey of caribou
on western Victoria Island (5-17 June 1994), Department of Resources,
Wildlife, and Economic Development, Government of the Northwest Territories.
NORRIS, A. L. & KUNZ, T. H. 2012. Effects of solar radiation on animal
thermoregulation, INTECH Open Access Publisher.
NORTON-GRIFFITHS, M. 1978. Counting animals, African Wildlife Leadership
Foundation.
ODELL, D. K. 1974. Behavioral thermoregulation in the California sea lion. Behavioral
biology, 10, 231-237.
OLAVO, G., COSTA, P. A., MARTINS, A. S. & FERREIRA, B. P. 2011. Shelf‐edge
reefs as priority areas for conservation of reef fish diversity in the tropical
Atlantic. Aquatic conservation: marine and freshwater ecosystems, 21, 199-209.
OREMUS, M., GARRIGUE, C. & CLEGUER, C. 2011. Isolement et diversité
génétique des dugongs de Nouvelle-Calédonie. Rapport final.
OREMUS, M., GARRIGUE, C. & CLEGUER, C. 2015. Etude genetique
complementaire sur le statut de la population de dugong de Nouvelle-Caledonie.
Rapport final. 44p. + annexes.
ORTH, R. J., CARRUTHERS, T. J., DENNISON, W. C., DUARTE, C. M.,
FOURQUREAN, J. W., HECK, K. L., HUGHES, A. R., KENDRICK, G. A.,
KENWORTHY, W. J. & OLYARNIK, S. 2006. A global crisis for seagrass
ecosystems. Bioscience, 56, 987-996.
PABST, D., ROMMEL, S. & MCLELLAN, W. 1999. The functional morphology of
marine mammals. Biology of marine mammals, 15-72.

References
161
PALKA, D. & HAMMOND, P. 2001. Accounting for responsive movement in line
transect estimates of abundance. Canadian journal of fisheries and aquatic
sciences, 58, 777-787.
PAULY, D., CHRISTENSEN, V., GUENETTE, S., PITCHER, T. J., SUMAILA, U.
R., WALTERS, C. J., WATSON, R. & ZELLER, D. 2002. Towards
sustainability in world fisheries. Nature, 418, 689-695.
PAYRI, C. 2006. Revised checklist of marine algae (Chlorophyta, Rhodophyta and
Ochrophyta) and seagrasses (Marine Angiosperma) of New Caledonia. In:
PAYRI, C. & RICHER DE FORGES, B. (eds.) Compendium of marine species
from New Caledonia.
PAYRI, C., ANDREFOUET, S., MENOU, J. L. & WABNITZ, C. 2005. Inventaire
floristique des phanérogames des herbiers de la région du Cap Goulevain. In:
ZONECO, R. (ed.).
PILCHER, N. J., WILLIAMS, J., HOPKINS, G., HESS, D. & JAOUEN, L. 2014.
CMS-UNEP Questionnaire Survey: Assessment of Dugong Distribution and
interactions with small-scale fisheries. CMS-UNEP Office Abu Dhabi, United
Arab Emirates
PINET, P. R. 2011. Invitation to oceanography, Jones & Bartlett Publishers.
POLLOCK, K., MARSH, H., LAWLER, I. R. & ALLDREDGE, M. 2006. Estimating
Animal Abundance in Heterogeneous Environments: An Application to Aerial
Surveys for Dugongs. Journal of Wildlife Management, 70, 255-262.
POMEROY, R. & DOUVERE, F. 2008. The engagement of stakeholders in the marine
spatial planning process. Marine Policy, 32, 816-822.
POMPA, S., EHRLICH, P. R. & CEBALLOS, G. 2011. Global distribution and
conservation of marine mammals. Proceedings of the National Academy of
Sciences, 108, 13600-13605.
POPLE, A., CLANCY, T., THOMPSON, J. & BOYD-LAW, S. 1998. Aerial survey
methodology and the cost of control for feral goats in western Queensland.
Wildlife Research, 25, 393-407.
POPOV, V. & SUPIN, A. 1990. Electrophysiological studies of hearing in some
cetaceans and a manatee. Sensory abilities of cetaceans. Springer.
PREEN, A. 1989. The status and conservation of dugongs in the Arabian region. MEPA
coastal and marine management series report, No. 10.
Christophe Cleguer
162
PREEN, A. 1992. Interactions between dugongs and seagrasses in subtropical
environment. PhD Thesis, James Cook University.
PREEN, A. 1995. Diet of Dugongs: Are They Omnivores? Journal of Mammalogy, 76,
163-171.
PREEN, A. & MARSH, H. 1995. Response of Dugongs to Large-Scale Loss of
Seagrass from Hervey Bay, Queensland, Australia. Wildlife Research, 22, 507-
519.
PREEN, A., MARSH, H., LAWLER, I., PRINCE, R. & SHEPHERD, R. 1997.
Distribution and abundance of dugongs, turtles, dolphins and other megafauna in
Shark Bay, Ningaloo Reef and Exmouth Gulf, Western Australia. Wildlife
Research, 24, 185-208.
PREEN, A., DAS, H., AL-RUMAIDH, M. & HODGSON, A. 2012. Dugongs in
Arabia. In: HINES, E., REYNOLDS, III J. E., MIGNUCCI-GIANNONI, A.,
ARAGONES, L. & MARMONTEL, M. (eds.) Sirenian conservation: Issues
and Strategies in Developping Countries. Gainesville: University Press of
Florida.
PRESSEY, R. L. & BOTTRILL, M. C. 2009. Approaches to landscape-and seascape-
scale conservation planning: convergence, contrasts and challenges. Oryx, 43,
464-475.
PRESSEY, R. L., CABEZA, M., WATTS, M. E., COWLING, R. M. & WILSON, K.
A. 2007. Conservation planning in a changing world. Trends in Ecology &
Evolution, 22, 583-592.
PROVINCE NORD 2008. Code de l'environnement de la Province nord.
http://www.province-
nord.nc/documents/deliberations/DDEE/Code%20Environnement.pdf.
PROVINCE SUD 2009. Code de l'environnement de la province Sud.
http://www.province-sud.nc/sites/default/files/CODE%20ENVIRONNEMENT-
MAI.pdf.
PULLIN, A. S. & KNIGHT, T. M. 2003. Support for decision making in conservation
practice: an evidence-based approach. Journal for Nature Conservation, 11, 83-
90.
PULLIN, A. S., KNIGHT, T. M., STONE, D. A. & CHARMAN, K. 2004. Do
conservation managers use scientific evidence to support their decision-making?
Biological Conservation, 119, 245-252.
References
163
PURVIS, A., AGAPOW, P. M., GITTLEMAN, J. L. & MACE, G. M. 2000.
Nonrandom extinction and the loss of evolutionary history. Science, 288, 328-
330.
QUANG, P. X. & BECKER, E. F. 1996. Line transect sampling under varying
conditions with application to aerial surveys. Ecology, 1297-1302.
RADFORD, C., STANLEY, J., TINDLE, C., MONTGOMERY, J. & JEFFS, A. 2010.
Localised coastal habitats have distinct underwater sound signatures. Mar Ecol
Prog Ser, 401, 21-29.
RANDS, M. R., ADAMS, W. M., BENNUN, L., BUTCHART, S. H., CLEMENTS, A.,
COOMES, D., ENTWISTLE, A., HODGE, I., KAPOS, V. &
SCHARLEMANN, J. P. 2010. Biodiversity conservation: challenges beyond
2010. Science, 329, 1298-1303.
REDFERN, J. V., MCKENNA, M. F., MOORE, T. J., CALAMBOKIDIS, J.,
DEANGELIS, M. L., BECKER, E. A., BARLOW, J., FORNEY, K. A.,
FIEDLER, P. C. & CHIVERS, S. J. 2013. Assessing the Risk of Ships Striking
Large Whales in Marine Spatial Planning. Conservation Biology, 27, 292-302.
REEP, R. & SARKO, D. K. 2009. Tactile hair in Manatees. Scholarpedia, 4, 6831.
REEP, R., MARSHALL, C. & STOLL, M. 2002. Tactile hairs on the postcranial body
in Florida manatees: A mammalian lateral line? Brain, behavior and evolution,
59, 141-154.
REEP, R. L., GASPARD, J. C., SARKO, D., RICE, F. L., MANN, D. A. & BAUER, G.
B. 2011. Manatee vibrissae: evidence for a “lateral line” function. Annals of the
New York Academy of Sciences, 1225, 101-109.
REID, J. P., BONDE, R. K. & O'SHEA, T. J. 1995. Reproduction and mortality of
radio-tagged and recognizable manatees on the Atlantic Coast of Florida. In:
O'SHEA, T. J., ACKERMAN, B. B. & PERCIVAL, H. F. (eds.) Information
and Technology Report. National Biological Service.
REYNOLDS III, J. E., MARSH, H. & RAGEN, T. J. 2009. Marine mammal
conservation. Endangered Species Research, 7, 23-28.
RIDGWAY, S. H. 1998. Handbook of marine mammals: the second book of dolphins
and the porpoises, Elsevier.
RIZZARI, J. R., FRISCH, A. J. & MAGNENAT, K. A. 2014. Diversity, abundance,
and distribution of reef sharks on outer-shelf reefs of the Great Barrier Reef,
Australia. Marine Biology, 161, 2847-2855.
Christophe Cleguer
164
ROBBINS, B. D. & BELL, S. S. 2000. Dynamics of a subtidal seagrass landscape:
seasonal and annual change in relation to water depth. Ecology, 81, 1193-1205.
ROJAS-BRACHO, L., REEVES, R. R. & JARAMILLO-LEGORRETA, A. 2006.
Conservation of the vaquita Phocoena sinus. Mammal Review, 36, 179-216.
ROSEN, D. A., WINSHIP, A. J. & HOOPES, L. A. 2007. Thermal and digestive
constraints to foraging behaviour in marine mammals. Philosophical
Transactions of the Royal Society of London B: Biological Sciences, 362, 2151-
2168.
ROWAT, D., GORE, M., MEEKAN, M. G., LAWLER, I. R. & BRADSHAW, C. J.
2009. Aerial survey as a tool to estimate whale shark abundance trends. Journal
of Experimental Marine Biology and Ecology, 368, 1-8.
SANDBROOK, C. 2015. What is conservation? Oryx, 49, 565-566.
SATINOFF, E. 2011. Behavioral thermoregulation in the cold. Comprehensive
Physiology.
SCHOFIELD, G., SCOTT, R., DIMADI, A., FOSSETTE, S., KATSELIDIS, K. A.,
KOUTSOUBAS, D., LILLEY, M. K. S., PANTIS, J. D., KARAGOUNI, A. D.
& HAYS, G. C. 2013. Evidence-based marine protected area planning for a
highly mobile endangered marine vertebrate. Biological Conservation, 161, 101-
109.
SCOTT, J. M., DAVIS, F. W., MCGHIE, R. G., WRIGHT, R. G., GROVES, C. &
ESTES, J. 2001. Nature reserves: Do they capture the full range of America's
biological diversity? Ecological Applications, 11, 999-1007.
SECRETARIAT 2009. Regional Plan of Action–Coral Triangle Initiative on coral reefs,
fisheries and food security (CTI-CFF). Interim Coral Triangle Initiative
Secretariat, Jakarta.
SHEPPARD, J. K. 2008. The spatial ecology of dugongs: applications to conservation
management. PhD, James Cook University.
SHEPPARD, J. K., PREEN, A. R., MARSH, H., LAWLER, I. R., WHITING, S. D. &
JONES, R. E. 2006. Movement heterogeneity of dugongs, Dugong dugong
(Müller), over large spatial scales. Journal of Experimental Biology and
Ecology, 334, 64-83.
SHEPPARD, J. K., LAWLER, I. R. & MARSH, H. 2007. Seagrass as pasture for
seacows: Landscape-level dugong habitat evaluation. Estuarine Coastal and
Shelf Science, 71, 117-132.
References
165
SHEPPARD, J. K., JONES, R. E., MARSH, H. & LAWLER, I. R. 2009. Effects of
Tidal and Diel Cycles on Dugong Habitat Use. Journal of Wildlife Management,
73, 45-59.
SHEPPARD, J. K., MARSH, H., JONES, R. E. & LAWLER, I. R. 2010. Dugong
habitat use in relation to seagrass nutrients, tides, and diel cycles. Marine
Mammal Science, 26, 855-879.
SHIMADA, T., JONES, R., LIMPUS, C. & HAMANN, M. 2012. Improving data
retention and home range estimates by data-driven screening. Marine Ecology
Progress Series.
SHORT, F. T. & WYLLIE-ECHEVERRIA, S. 1996. Natural and human-induced
disturbance of seagrasses. Environmental conservation, 23, 17-27.
SHORT, F., CARRUTHERS, T., DENNISON, W. & WAYCOTT, M. 2007. Global
seagrass distribution and diversity: a bioregional model. Journal of
Experimental Marine Biology and Ecology, 350, 3-20.
SINGLETON, R. L. & ROBERTS, C. M. 2014. The contribution of very large marine
protected areas to marine conservation: Giant leaps or smoke and mirrors?
Marine Pollution Bulletin.
SOBTZICK, S., HAGIHARA, R., GRECH, A. & MARSH, H. 2012. Aerial survey of
the urban coast of Queensland to evaluate the response of the dugong population
to the widespread effects of the January 2011 floods and Cyclone Yasi.
SOBTZICK, S., HAGIHARA, R., PENROSE, H., GRECH, A., CLEGUER, C. &
MARSH, H. 2014. An assessment of the distribution and abundance of dugongs
in the Northern Great Barrier Reef and Torres Strait. A Report for the
Department of the Environment, National Environmental Research Program
(NERP).
SOURISSEAU, J.-M., PESTAÑA, G., GÉRONIMI, V. & SCHEMBRI, P. 2010.
Politiques publiques et développement durable dans le monde rural calédonien.
Économie rurale. Agricultures, alimentations, territoires, 9-23.
SPREP 2012. Pacific Islands Regional Marine Species Programme. SPREP (ed.). Apia,
Samoa: Secretariat of the Pacific Regional Environment Programme 2013.
STEJNEGER, L. 1887. How the Great Northern Sea-Cow (Rytina) Became
Exterminated. The American Naturalist, 21, 1047-1054.
STITH, B. M., REID, J. P., LANGTIMM, C. A., SWAIN, E. D., DOYLE, T. J.,
SLONE, D. H., DECKER, J. D. & SODERQVIST, L. E. 2011. Temperature
Christophe Cleguer
166
inverted haloclines provide winter warm-water refugia for manatees in
southwest Florida. Estuaries and Coasts, 34, 106-119.
SUTHERLAND, W. J. 2008. The conservation handbook: research, management and
policy, John Wiley & Sons.
SUTHERLAND, W. J., PULLIN, A. S., DOLMAN, P. M. & KNIGHT, T. M. 2004.
The need for evidence-based conservation. Trends in Ecology & Evolution, 19,
305-308.
TAYLOR, B. L. & GERRODETTE, T. 1993. The uses of statistical power in
conservation biology: the vaquita and northern spotted owl. Conservation
Biology, 7, 489-500.
TAYLOR, B. L., MARTINEZ, M., GERRODETTE, T., BARLOW, J. & HROVAT, Y.
N. 2007. Lessons from monitoring trends in abundance of marine mammals
Marine Mammal Science, 23, 157-175.
TAYLOR, H. A. & RASHEED, M. 2010. Torres Strait Dugong Sanctuary seagrass
baseline survey, Department of employment, Economic Development and
Innovation.
TELONICS. 2013. GEN GPS systems manual. Available at:
http://www.telonics.com/documents.php?mode=requestForm&document=GPSG
EN4-8383J.PDF.
TERRIEN, J., PERRET, M. & AUJARD, F. 2011. Behavioral thermoregulation in
mammals: a review. Frontiers in Bioscience, 1428-44.
THEOBALD, D. M. 2003. Targeting conservation action through assessment of
protection and exurban threats. Conservation Biology, 17, 1624-1637.
TNS 2005. Enquête sur la consommation des dugongs en province Sud.
UNDP 2010. Human Development Report. The Real Wealth of Nations: Pathways to
Human Development. In: PROGRAMME, U. N. D. (ed.).
UNESCO 2009. Lagoons of New Caledonia: Reef Diversity and Associated Ecosystems
[Online]. Available at: whc.unesco.org/en/list/1115/documents/. [Accessed 17
January 2012].
UNSWORTH, R. K., TAYLOR, J. D., POWELL, A., BELL, J. J. & SMITH, D. J.
2007. The contribution of scarid herbivory to seagrass ecosystem dynamics in
the Indo-Pacific. Estuarine, Coastal and Shelf Science, 74, 53-62.
UPTON, G. J. 1992. Fisher's exact test. Journal of the Royal Statistical Society. Series A
(Statistics in Society), 395-402.
References
167
WADE, P. R. 1998. Calculating limits to the allowable human-caused mortality of
cetaceans and pinnipeds. Marine Mammal Science, 14, 1-37.
WAYCOTT, M., DUARTE, C. M., CARRUTHERS, T. J. B., ORTH, R. J.,
DENNISON, W. C., OLYARNIK, S., CALLADINE, A., FOURQUREAN, J.
W., HECK, K. L., HUGHES, A. R., KENDRICK, G. A., KENWORTHY, W. J.,
SHORT, F. T. & WILLIAMS, S. L. 2009. Accelerating loss of seagrasses across
the globe threatens coastal ecosystems. Proceedings of the National Academy of
Sciences, 106, 12377-12381.
WEAVER, P. & JOHNSON, D. 2012. Biodiversity: think big for marine conservation.
Nature, 483, 399-399.
WHITE, F. N. & ODELL, D. K. 1971. Thermoregulatory behavior of the northern
elephant seal, Mirounga angustirostris. Journal of Mammalogy, 52, 758-774.
WHITING, S. D. 2002. Rocky Reefs Provide Foraging Habitat For Dugongs In The
Darwin Region Of Northern Australia. Australian Mammalogy, 24, 147-150.
WHITING, S. D. 2008. Movements and distribution of dugongs (Dugong dugon) in a
macro-tidal environment in northern Australia. Australian Journal of Zoology,
56, 215-222.
WIRSING, A. J., HEITHAUS, M. R. & DILL, L. M. 2007a. Can measures of prey
availability improve our ability to predict the abundance of large marine
predators? Oecologia, 153, 563-568.
WIRSING, A. J., HEITHAUS, M. R. & DILL, L. M. 2007b. Can you dig it? Use of
excavation, a risky foraging tactic, by dugongs is sensitive to predation danger.
Animal Behaviour, 74, 1085-1091.
WIRSING, A. J., HEITHAUS, M. R. & DILL, L. M. 2007c. Fear factor: do dugongs
(Dugong dugon) trade food for safety from tiger sharks (Galeocerdo cuvier)?
Oecologia, 153, 1031-1040.
WIRSING, A. J., HEITHAUS, M. R. & DILL, L. M. 2007d. Living on the edge:
dugongs prefer to forage in microhabitats that allow escape from rather than
avoidance of predators. Animal Behaviour, 74, 93-101.
ZACHARIAS, M. A. & ROFF, J. C. 2001. Use of focal species in marine conservation
and management: a review and critique. Aquatic conservation: marine and
freshwater ecosystems, 11, 59-76.
ZAR, J. H. 1998. Spearman rank correlation. Encyclopedia of Biostatistics.
Christophe Cleguer
168
ZEH, D. R., HEUPEL, M. R., LIMPUS, C. J., HAMANN, M., FUENTES, M. M.,
BABCOCK, R. C., PILLANS, R. D., TOWNSEND, K. A. & MARSH, H. 2015.
Is acoustic tracking appropriate for air-breathing marine animals? Dugongs as a
case study. Journal of Experimental Marine Biology and Ecology, 464, 1-10.
ZEH, D. R., HEUPEL, M., HAMANN, M., LIMPUS, C. J. & MARSH, H. in review.
Quick Fix GPS technology highlights risk to marine animals moving between
protected areas. Endangered Species Research.
ZEILEIS, A., KLEIBER, C. & JACKMAN, S. 2007. Regression models for count data
in R. Research Report Series . Department of Statistics and Mathematics, 53.
ZIELINSKI, W. J. & STAUFFER, H. B. 1996. Monitoring Martes populations in
California: survey design and power analysis. Ecological Applications, 1254-
1267.
ZUUR, A. F., SAVELIEV, A. A. & IENO, E. N. 2012. Zero inflated models and
generalized linear mixed models with R, Highland Statistics Limited Newburgh.

Appendix A
169
Appendix A
Table A.1: Details of the survey design used for the dugong relative abundance and density
analysis.
Block Area
covered (km2)
Distance between transects (NM)
Sampling Intensity (%)
Number of transects surveyed
Jun 2003-Jan 2008
Jun & Nov 2011-2012
Jun 2003-Jan 2008
Jun & Nov 2011-2012
Jun 2003-Jan 2008
Jun & Nov 2011-2012
1 1841 2.50 2.50 16.04 16.82 22 22
2 1300 2.50 1.25 16.92 34.00 32 63
3 1948 2.50 2.50 15.92 16.88 24 24
4 1749 2.50 2.50 15.23 17.35 23 23
Total 6838 - - - - 101 132
Table A.2: Availability probability estimates (SEs) for various strata of survey depths and
turbidities calculated from data on artificial dugong models and the individual dive profiles
of telemetered wild dugongs. (Extracted from Pollock et al. 2006).
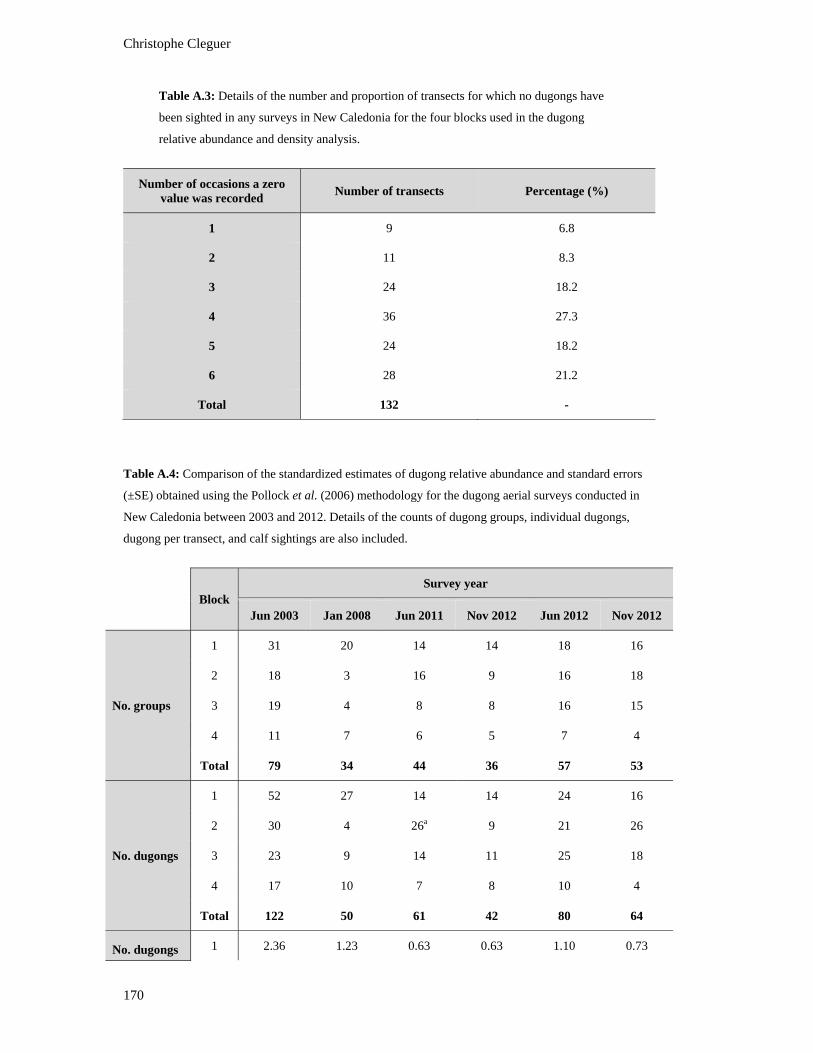
Christophe Cleguer
170
Table A.3: Details of the number and proportion of transects for which no dugongs have
been sighted in any surveys in New Caledonia for the four blocks used in the dugong
relative abundance and density analysis.
Number of occasions a zero value was recorded
Number of transects Percentage (%)
1 9 6.8
2 11 8.3
3 24 18.2
4 36 27.3
5 24 18.2
6 28 21.2
Total 132 -
Table A.4: Comparison of the standardized estimates of dugong relative abundance and standard errors
(±SE) obtained using the Pollock et al. (2006) methodology for the dugong aerial surveys conducted in
New Caledonia between 2003 and 2012. Details of the counts of dugong groups, individual dugongs,
dugong per transect, and calf sightings are also included.
Block
Survey year
Jun 2003 Jan 2008 Jun 2011 Nov 2012 Jun 2012 Nov 2012
No. groups
1 31 20 14 14 18 16
2 18 3 16 9 16 18
3 19 4 8 8 16 15
4 11 7 6 5 7 4
Total 79 34 44 36 57 53
No. dugongs
1 52 27 14 14 24 16
2 30 4 26a 9 21 26
3 23 9 14 11 25 18
4 17 10 7 8 10 4
Total 122 50 61 42 80 64
No. dugongs 1 2.36 1.23 0.63 0.63 1.10 0.73
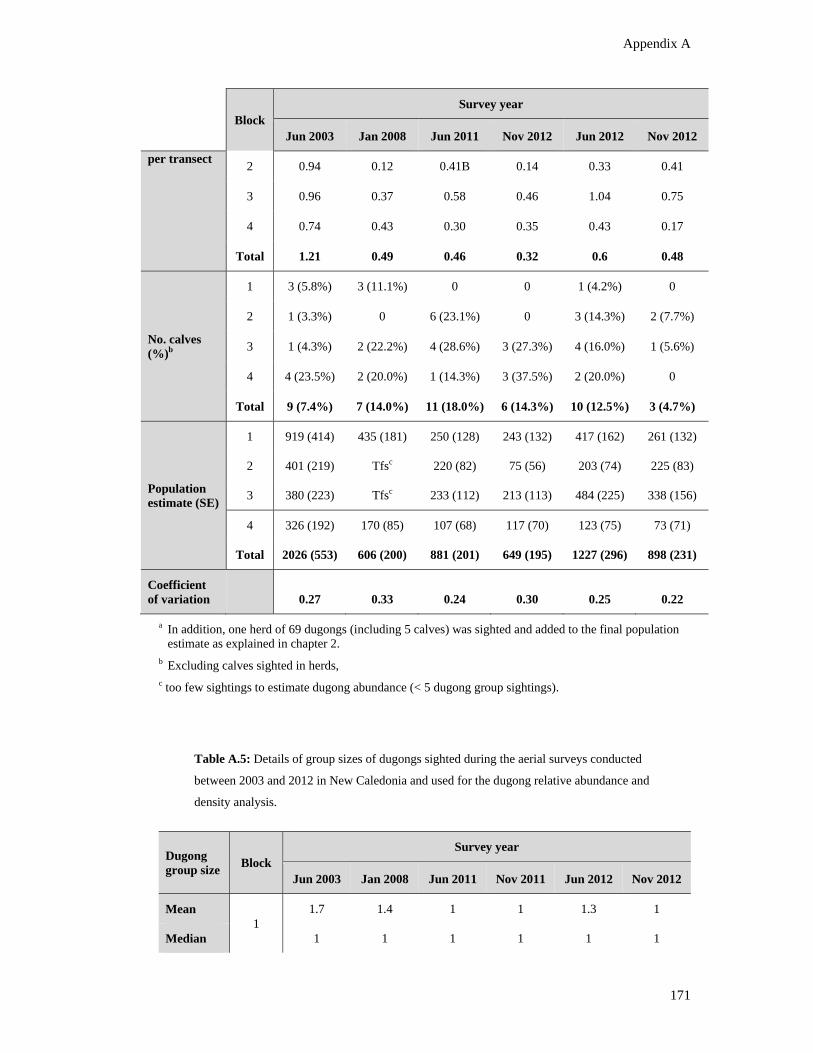
Appendix A
171
Block
Survey year
Jun 2003 Jan 2008 Jun 2011 Nov 2012 Jun 2012 Nov 2012
per transect 2 0.94 0.12 0.41B 0.14 0.33 0.41
3 0.96 0.37 0.58 0.46 1.04 0.75
4 0.74 0.43 0.30 0.35 0.43 0.17
Total 1.21 0.49 0.46 0.32 0.6 0.48
No. calves (%)b
1 3 (5.8%) 3 (11.1%) 0 0 1 (4.2%) 0
2 1 (3.3%) 0 6 (23.1%) 0 3 (14.3%) 2 (7.7%)
3 1 (4.3%) 2 (22.2%) 4 (28.6%) 3 (27.3%) 4 (16.0%) 1 (5.6%)
4 4 (23.5%) 2 (20.0%) 1 (14.3%) 3 (37.5%) 2 (20.0%) 0
Total 9 (7.4%) 7 (14.0%) 11 (18.0%) 6 (14.3%) 10 (12.5%) 3 (4.7%)
Population estimate (SE)
1 919 (414) 435 (181) 250 (128) 243 (132) 417 (162) 261 (132)
2 401 (219) Tfsc 220 (82) 75 (56) 203 (74) 225 (83)
3 380 (223) Tfsc 233 (112) 213 (113) 484 (225) 338 (156)
4 326 (192) 170 (85) 107 (68) 117 (70) 123 (75) 73 (71)
Total 2026 (553) 606 (200) 881 (201) 649 (195) 1227 (296) 898 (231)
Coefficient of variation 0.27 0.33 0.24 0.30 0.25 0.22
a In addition, one herd of 69 dugongs (including 5 calves) was sighted and added to the final population estimate as explained in chapter 2.
b Excluding calves sighted in herds, c too few sightings to estimate dugong abundance (< 5 dugong group sightings).
Table A.5: Details of group sizes of dugongs sighted during the aerial surveys conducted
between 2003 and 2012 in New Caledonia and used for the dugong relative abundance and
density analysis.
Dugong group size
Block Survey year
Jun 2003 Jan 2008 Jun 2011 Nov 2011 Jun 2012 Nov 2012
Mean 1
1.7 1.4 1 1 1.3 1
Median 1 1 1 1 1 1

Christophe Cleguer
172
Max 5 3 1 1 4 1
Mean
2
1.7 1.3 1.6a 1 1.3 1.4
Median 1 1 1 1 1 1
Max 7 2 4 1 2 5
Mean
3
1.2 2.3 1.8 1.4 1.6 1.2
Median 1 1.5 1 1.5 1 1
Max 3 5 4 2 3 3
Mean
4
1.5 1.4 1.2 1.6 1.4 1
Median 1 1 1 1 1 2
Max 3 2 2 2 4 1
a Dugong herd of 69 individuals excluded from the table.
Table A.6: Count (A) and zero-inflation (B) model coefficients with Negative Binomial
distribution of dugong relative density across survey years and blocks. The reference level
for year is 2003 and 1 for block.
(A) Count model coefficients
Estimates Std. Error Z value Pr(> |z|) Sig.
(Intercept) -0.5009 0.1864 -2.687 0.00721 **b
year2008 -0.5431 0.2496 -2.176 0.02959 *
year2011 -0.8622 0.2132 -4.043 5.27E-05 ***
year2012 -0.7409 0.204 -3.633 0.00028 ***
block2 0.6623 0.218 3.038 0.00238 **
block3 0.3827 0.1921 1.992 0.04637 *
block4 -0.2597 0.2173 -1.195 0.23207
(B) Zero-inflation model coefficient
Estimates Std. Error Z value Pr(> |z|) Sig.
(Intercept) -3.23253 0.34439 -9.386 < 2e-16 ***
year2008 0.47777 0.36533 1.308 0.190947
year2011 0.44278 0.32027 1.383 0.166815
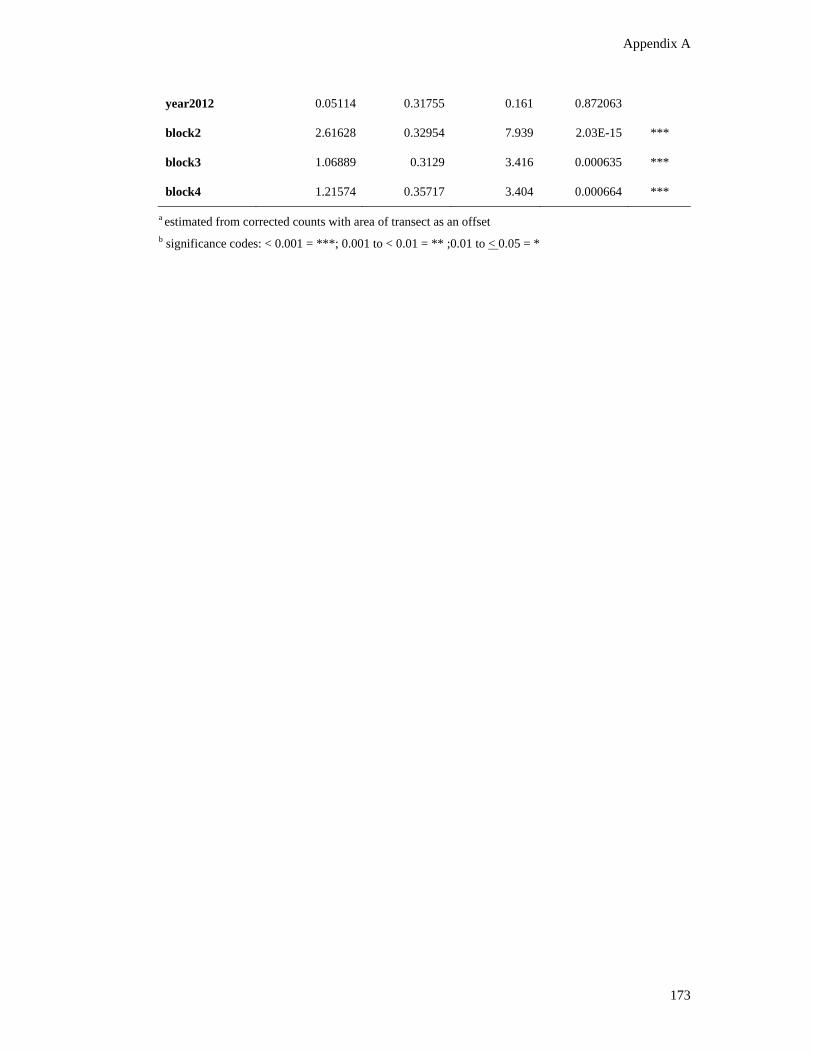
Appendix A
173
year2012 0.05114 0.31755 0.161 0.872063
block2 2.61628 0.32954 7.939 2.03E-15 ***
block3 1.06889 0.3129 3.416 0.000635 ***
block4 1.21574 0.35717 3.404 0.000664 ***
a estimated from corrected counts with area of transect as an offset b significance codes: < 0.001 = ***; 0.001 to < 0.01 = ** ;0.01 to < 0.05 = *
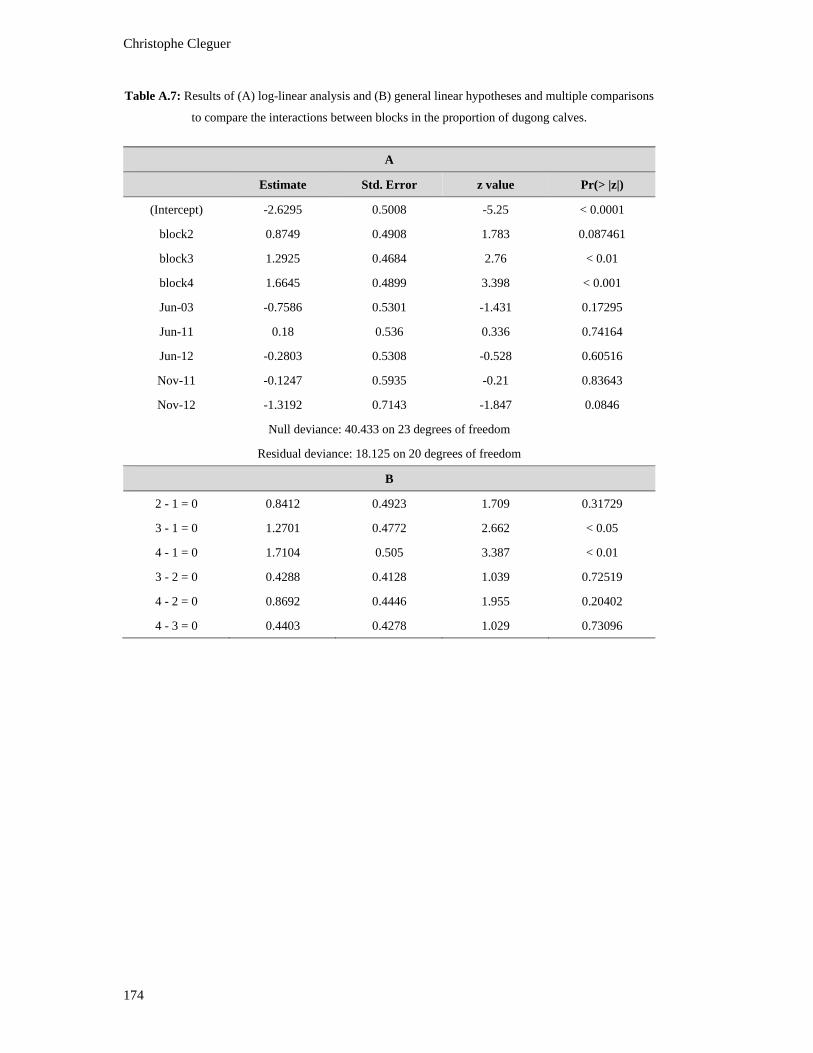
Christophe Cleguer
174
Table A.7: Results of (A) log-linear analysis and (B) general linear hypotheses and multiple comparisons
to compare the interactions between blocks in the proportion of dugong calves.
A
Estimate Std. Error z value Pr(> |z|)
(Intercept) -2.6295 0.5008 -5.25 < 0.0001
block2 0.8749 0.4908 1.783 0.087461
block3 1.2925 0.4684 2.76 < 0.01
block4 1.6645 0.4899 3.398 < 0.001
Jun-03 -0.7586 0.5301 -1.431 0.17295
Jun-11 0.18 0.536 0.336 0.74164
Jun-12 -0.2803 0.5308 -0.528 0.60516
Nov-11 -0.1247 0.5935 -0.21 0.83643
Nov-12 -1.3192 0.7143 -1.847 0.0846
Null deviance: 40.433 on 23 degrees of freedom
Residual deviance: 18.125 on 20 degrees of freedom
B
2 - 1 = 0 0.8412 0.4923 1.709 0.31729
3 - 1 = 0 1.2701 0.4772 2.662 < 0.05
4 - 1 = 0 1.7104 0.505 3.387 < 0.01
3 - 2 = 0 0.4288 0.4128 1.039 0.72519
4 - 2 = 0 0.8692 0.4446 1.955 0.20402
4 - 3 = 0 0.4403 0.4278 1.029 0.73096

Appendix A
175
Table A.8: Results of log-linear model developed to analyze the relationship between the proportion of
dugong sightings and water depth categories and survey year during the time series of dugong aerial
surveys in New Caledonia.
Analysis of deviance
Df Deviance Residual Df Residual Deviance
Pr (> Chi)
Null 272 471.84
Year 5 15.702 267 456.14 0.06231
Depth 4 154.074 263 302.07 < 0.0001
Year x Depth 20 21.044 243 281.02 0.82698
Table A.9: Estimated sustainable levels of mortalities from anthropogenic sources for dugongs in New
Caledonia.
Date of Survey
Recovery Factor (R.F.)
N SE CV Nmin
Potential Biological Removal (PBR)
Rmax=0.01
Rmax=0.02
Rmax =0.03
Rmax =0.04
Rmax=0.05
Jun-03 0.5 2026 553 0.27 1617 4 8 12 16 20
Jan-08 0.5 606 200 0.33 462 1 2 3 5 6
Jun-11 0.5 881 201 0.23 728 2 4 5 7 9
Nov-11 0.5 649 195 0.30 507 1 3 4 5 6
Jun-12 0.5 1227 898 0.24 1005 3 5 8 10 13
Nov-12 0.5 898 231 0.26 724 2 4 5 7 9
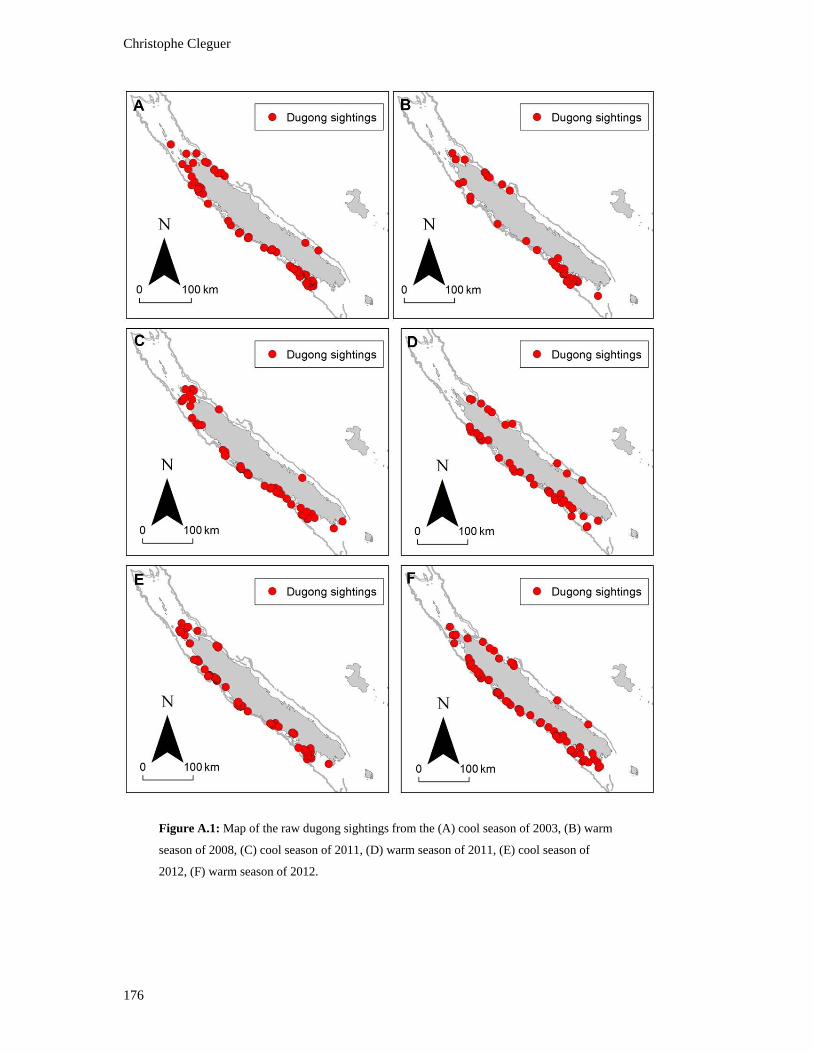
Christophe Cleguer
176
Figure A.1: Map of the raw dugong sightings from the (A) cool season of 2003, (B) warm
season of 2008, (C) cool season of 2011, (D) warm season of 2011, (E) cool season of
2012, (F) warm season of 2012.

Appendix B
177
Appendix B
Satellite tag attachment device for dugong tracking studies
Details of design
Version 1.0, November 2014
Overview
The dugong belt assembly was developed to deploy TMT 462 GPS/ARGOS tags on adult
dugongs for tracking purposes. This system allows the tag to float at the water surface when the
animal is in shallow waters, increasing the frequency of transmission of signals to passing
satellites. The apparatus was developed by Helene Marsh’s research group in collaboration with
Dr. James Powell (Sea to Shore Alliance, Florida, USA).
The satellite tag is attached to the animal’s peduncle near the tail via a three-meter long flexible
tether fitted with a padded belt. This belt assembly incorporates: (1) a weak link at the peduncle
end of the tether that can be broken by the animal if it becomes entangled in marine obstructions
such as coral or mangroves; and (2) a backup corroding link comprised of a zinc bolt in a
stainless steel shackle. The weak link breaks when subjected to a force of around 160kg
(average adult weight of a dugong is above 300kg and ranges up to 530kg). The breakage point
was determined empirically in collaboration with James Cook University engineers. The zinc
bolt slowly corrodes in a galvanic reaction in seawater and releases the belt to ensure the
satellite tag is eventually detached from the dugong.
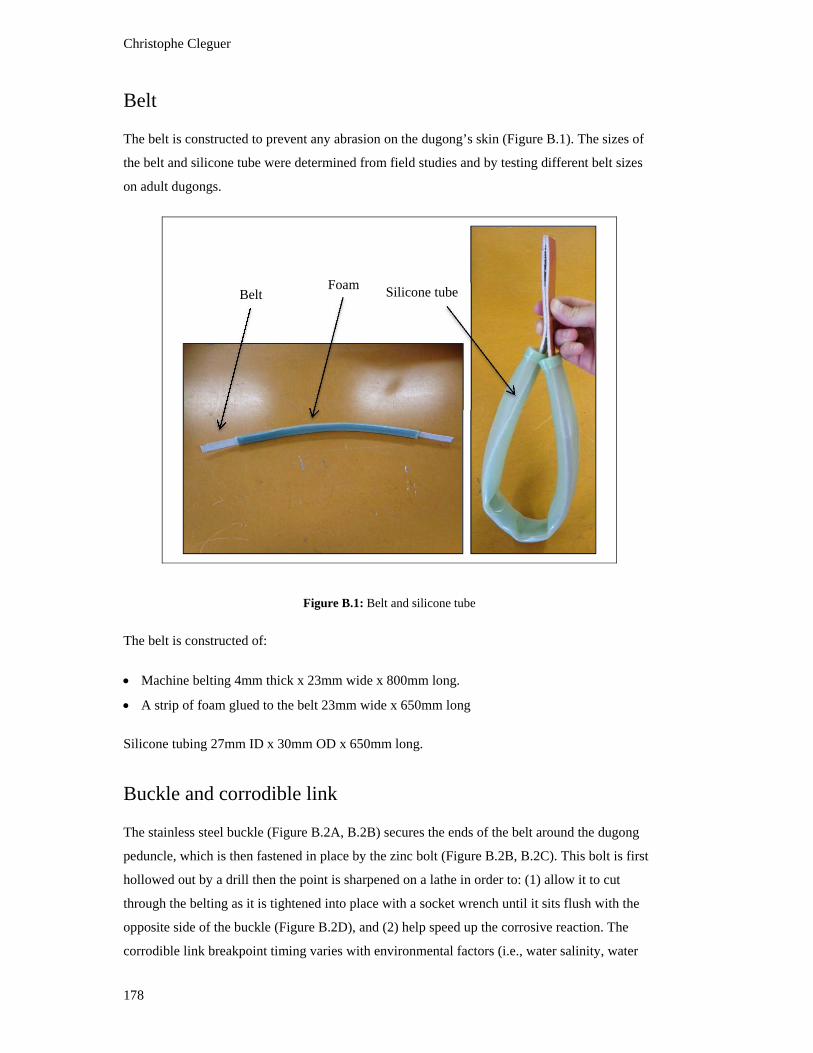
Christophe Cleguer
178
Belt
The belt is constructed to prevent any abrasion on the dugong’s skin (Figure B.1). The sizes of
the belt and silicone tube were determined from field studies and by testing different belt sizes
on adult dugongs.
Figure B.1: Belt and silicone tube
The belt is constructed of:
Machine belting 4mm thick x 23mm wide x 800mm long.
A strip of foam glued to the belt 23mm wide x 650mm long
Silicone tubing 27mm ID x 30mm OD x 650mm long.
Buckle and corrodible link
The stainless steel buckle (Figure B.2A, B.2B) secures the ends of the belt around the dugong
peduncle, which is then fastened in place by the zinc bolt (Figure B.2B, B.2C). This bolt is first
hollowed out by a drill then the point is sharpened on a lathe in order to: (1) allow it to cut
through the belting as it is tightened into place with a socket wrench until it sits flush with the
opposite side of the buckle (Figure B.2D), and (2) help speed up the corrosive reaction. The
corrodible link breakpoint timing varies with environmental factors (i.e., water salinity, water
Belt Foam Silicone tube
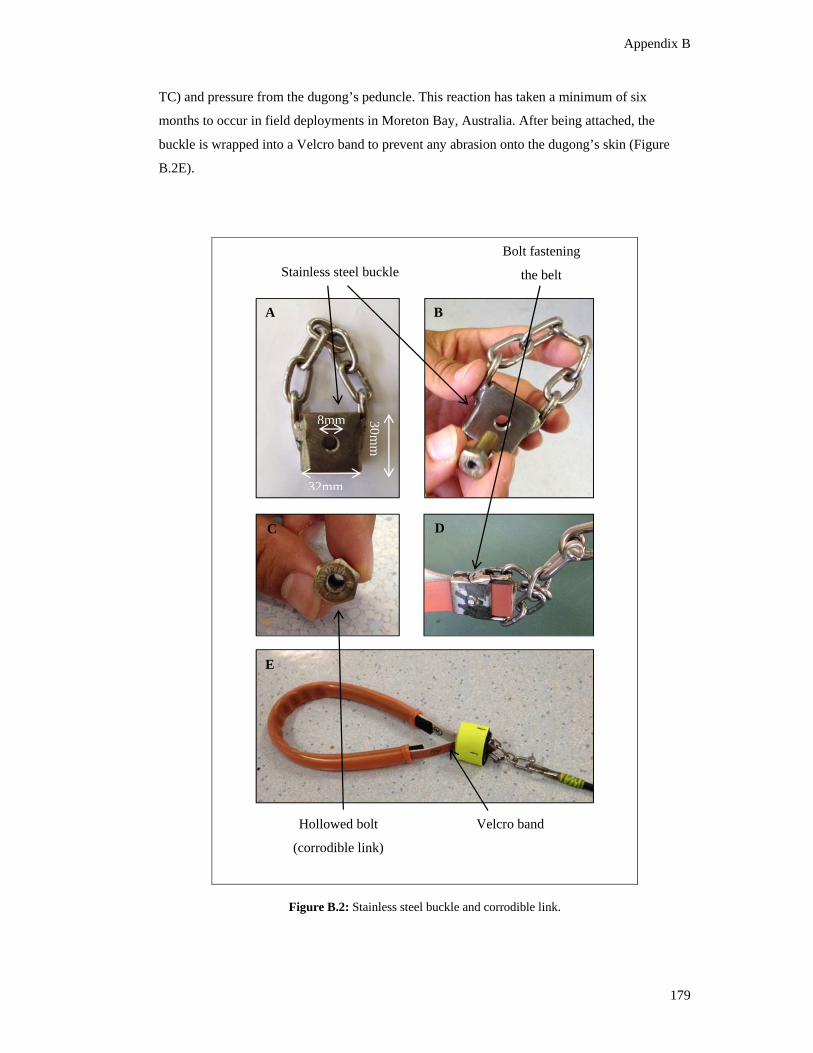
Appendix B
179
TC) and pressure from the dugong’s peduncle. This reaction has taken a minimum of six
months to occur in field deployments in Moreton Bay, Australia. After being attached, the
buckle is wrapped into a Velcro band to prevent any abrasion onto the dugong’s skin (Figure
B.2E).
Figure B.2: Stainless steel buckle and corrodible link.
Stainless steel buckle
30mm
Velcro band
A
8mm
B
D C
E
Hollowed bolt
(corrodible link)
Bolt fastening
the belt
32mm
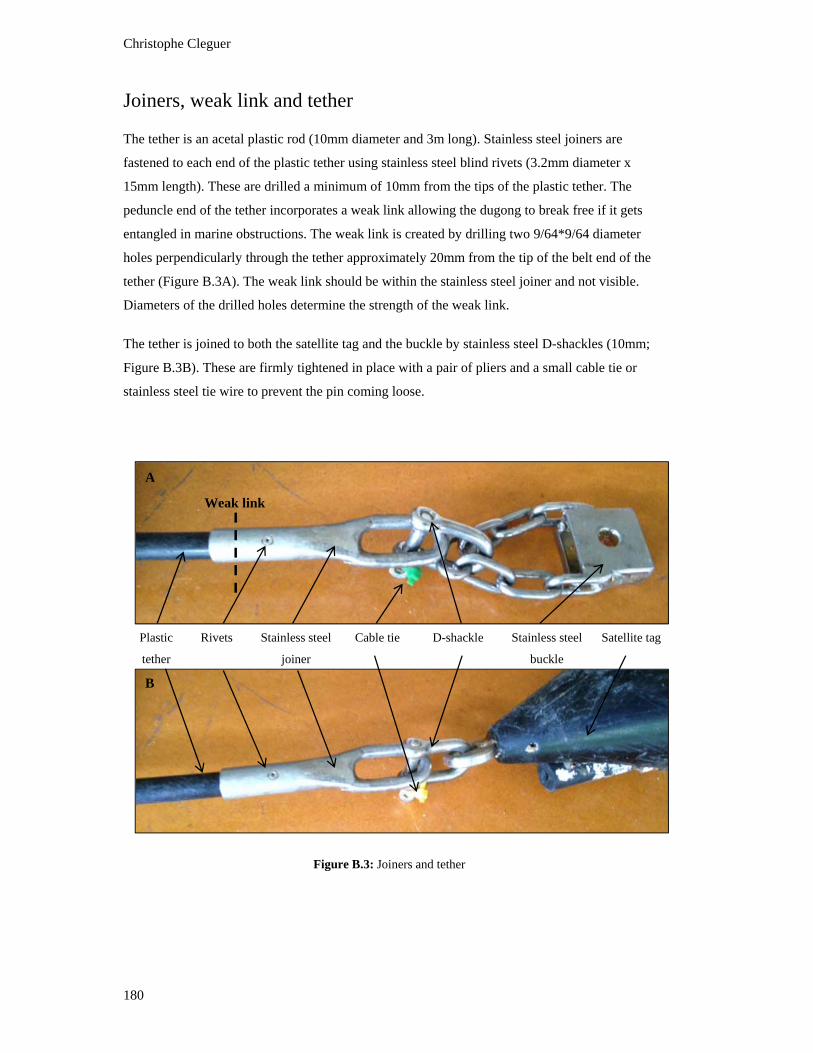
Christophe Cleguer
180
Joiners, weak link and tether
The tether is an acetal plastic rod (10mm diameter and 3m long). Stainless steel joiners are
fastened to each end of the plastic tether using stainless steel blind rivets (3.2mm diameter x
15mm length). These are drilled a minimum of 10mm from the tips of the plastic tether. The
peduncle end of the tether incorporates a weak link allowing the dugong to break free if it gets
entangled in marine obstructions. The weak link is created by drilling two 9/64*9/64 diameter
holes perpendicularly through the tether approximately 20mm from the tip of the belt end of the
tether (Figure B.3A). The weak link should be within the stainless steel joiner and not visible.
Diameters of the drilled holes determine the strength of the weak link.
The tether is joined to both the satellite tag and the buckle by stainless steel D-shackles (10mm;
Figure B.3B). These are firmly tightened in place with a pair of pliers and a small cable tie or
stainless steel tie wire to prevent the pin coming loose.
Figure B.3: Joiners and tether
Plastic
tether
Stainless steel
joiner
Rivets Cable tie D-shackle Satellite tag Stainless steel
buckle
A
B
Weak link
Appendix C
181
Appendix C
Dugong (Dugong dugon) Monitoring Protocols
for determining pursuit and capture during research
June 2013
Dr Mark Flint
BVSc, BSc(Hons), MApplSc, MPhil, PhD, MAIBiol
Director, Vet-MARTI unit
School of Veterinary Science
The University of Queensland
Gatton, Queensland, 4343
Christophe Cleguer
182
Introduction
The capture of wild sirenia for biological sampling can be a stressful event for the animal
involved. These species are at risk of stress-induced morbidity and mortality initiated by pursuit
and capture. As such, to minimise risks of adverse events occurring during biological
investigations, it is imperative only healthy animals from within the population are sampled and
all efforts are made to minimise the restraint period. The caveat to this risk-minimisation
strategy is when the sampling of sick or injured animals is required to obtain a disease diagnosis
or to provide medical intervention.
The following are external clinical signs for veterinarians and biologists to assess at the start of
pursuit to determine whether a dugong should be excluded from capture, requires immediate
release during restraint, or requires medical intervention post release. This list is not meant to be
exhaustive, rather provide a baseline of indicators that can be developed and further defined for
specific locations and environmental conditions.
These clinical signs are used under the assumption the dugong will remain in the water during
restraint. For dugongs that are held out of the water during restraint, additional monitoring is
required.
Assessment should only be performed by an appropriately qualified veterinarian or senior
biologist.
Indicators for exclusion to be assessed at the start of pursuit
Assessment during pursuit should be the first stage of diligence and rapid health assessment.
Biological criteria for exclusion includes:
Presence of an attendant calf with target animal.
Target animal is less than 2.2m in length.
The dugong shows evidence of recent capture (e.g., flagging tape applied to the titanium tag,
as is the practice for those caught in Moreton Bay by UQ/ Sea World).
To identify if animals are medically compromised and the cessation of pursuit is required,
exclusion criteria should incorporate at least:
Evidence of overt skin conditions such as lesions, sloughing of skin, hyperkeratosis and
depigmentation of the skin;
Appendix C
183
An assessment of body condition including visual estimation of loss of soft tissue mass
(predominantly adipose tissue) around the peduncle and neck resulting in the vertebral
column appearing more prominent;
Evidence of abnormal behaviour such as:
o Accelerated respiration rate
o Prolonged periods of resting on the bottom of the water column during pursuit and/or
o Erratic behaviour.
Indicators for immediate release to be assessed during restraint
On capture (restraint), the above criteria should be reassessed by an appropriately qualified
veterinarian or senior biologist as the animal is being secured to the vessel. This will minimise
the risk of restraining an animal that should have been excluded but was not due to missing
indicators during the often-rapid pursuit stage.
In addition, based on ongoing monitoring, restraint should incorporate exclusion criteria of:
Heart and respiration rates:
o Heart rate should be between 40-100bpm. Outside of this range is a criterion for release.
o Development of cardiac arrhythmias.
o Respiration rate should be between 1-15 breaths every TWO minutes. Outside of this
range is a criterion for release.
o Development of laboured or staccatic respiration.
o If the heart or breathing stops, this is a medical emergency and veterinary intervention is
required immediately.
Posture:
o Curling up
o Lethargy or flaccid (limp- loss of muscle tone) behaviour
o Inability to maintain buoyancy or position in the water column
Other key indicators:
o Muscle tremors
o Loss of consciousness
Indicators for the need for medical intervention during post-release
monitoring
On release, the dugong should be observed to be swimming normally, breathing and actively
moving away from the boat until it is out of sight. If there is any evidence of compromise, the
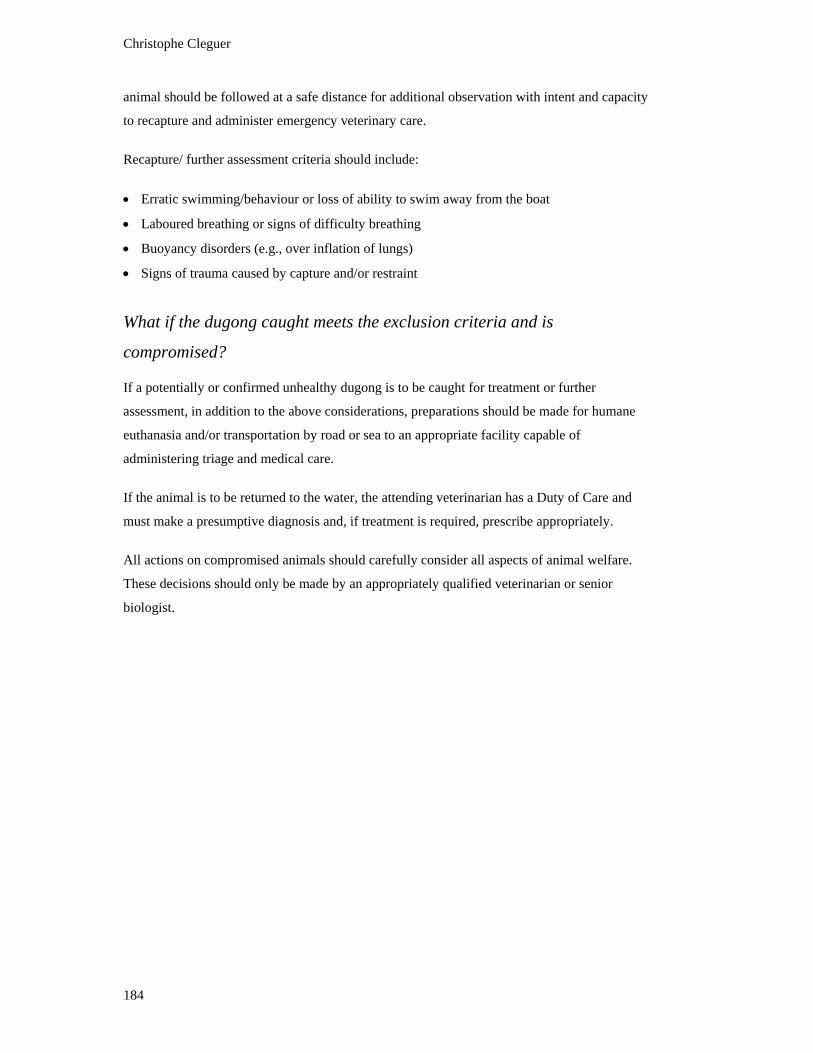
Christophe Cleguer
184
animal should be followed at a safe distance for additional observation with intent and capacity
to recapture and administer emergency veterinary care.
Recapture/ further assessment criteria should include:
Erratic swimming/behaviour or loss of ability to swim away from the boat
Laboured breathing or signs of difficulty breathing
Buoyancy disorders (e.g., over inflation of lungs)
Signs of trauma caused by capture and/or restraint
What if the dugong caught meets the exclusion criteria and is
compromised?
If a potentially or confirmed unhealthy dugong is to be caught for treatment or further
assessment, in addition to the above considerations, preparations should be made for humane
euthanasia and/or transportation by road or sea to an appropriate facility capable of
administering triage and medical care.
If the animal is to be returned to the water, the attending veterinarian has a Duty of Care and
must make a presumptive diagnosis and, if treatment is required, prescribe appropriately.
All actions on compromised animals should carefully consider all aspects of animal welfare.
These decisions should only be made by an appropriately qualified veterinarian or senior
biologist.
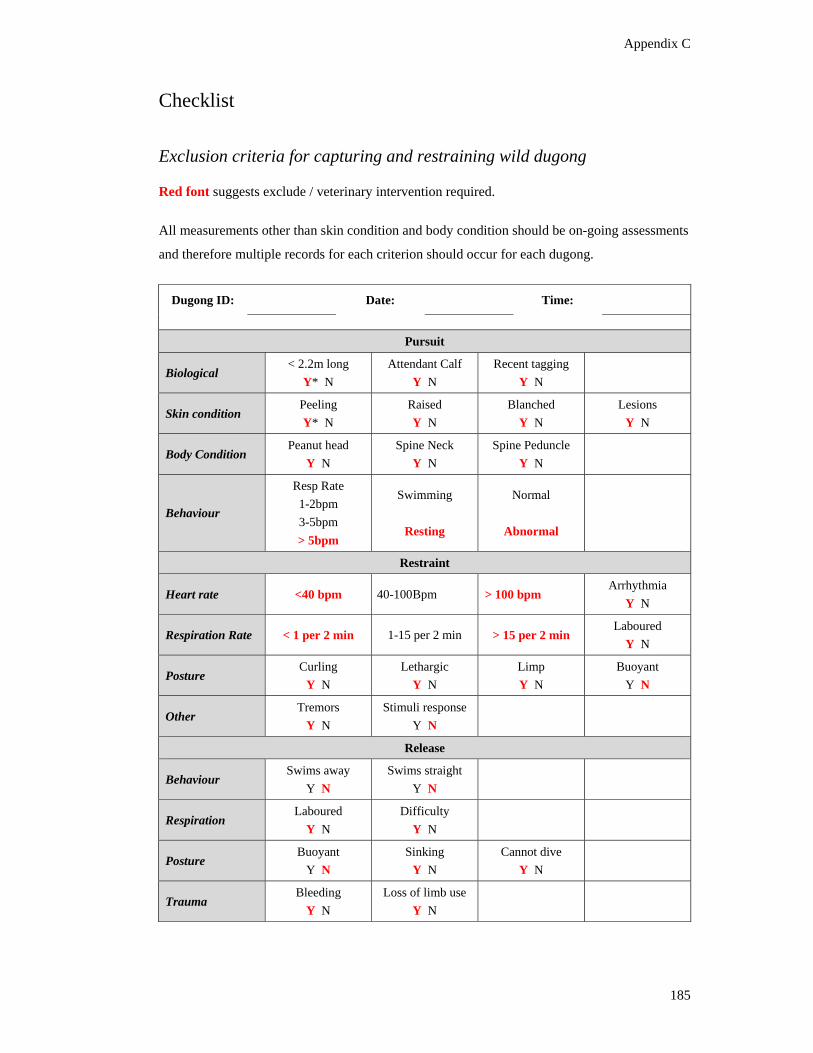
Appendix C
185
Checklist
Exclusion criteria for capturing and restraining wild dugong
Red font suggests exclude / veterinary intervention required.
All measurements other than skin condition and body condition should be on-going assessments
and therefore multiple records for each criterion should occur for each dugong.
Dugong ID: Date: Time:
Pursuit
Biological < 2.2m long
Y* N
Attendant Calf
Y N
Recent tagging
Y N
Skin condition Peeling
Y* N
Raised
Y N
Blanched
Y N
Lesions
Y N
Body Condition Peanut head
Y N
Spine Neck
Y N
Spine Peduncle
Y N
Behaviour
Resp Rate
1-2bpm
3-5bpm
> 5bpm
Swimming
Resting
Normal
Abnormal
Restraint
Heart rate <40 bpm 40-100 Bpm > 100 bpm Arrhythmia
Y N
Respiration Rate < 1 per 2 min 1-15 per 2 min > 15 per 2 min Laboured
Y N
Posture Curling
Y N
Lethargic
Y N
Limp
Y N
Buoyant
Y N
Other Tremors
Y N
Stimuli response
Y N
Release
Behaviour Swims away
Y N
Swims straight
Y N
Respiration Laboured
Y N
Difficulty
Y N
Posture Buoyant
Y N
Sinking
Y N
Cannot dive
Y N
Trauma Bleeding
Y N
Loss of limb use
Y N

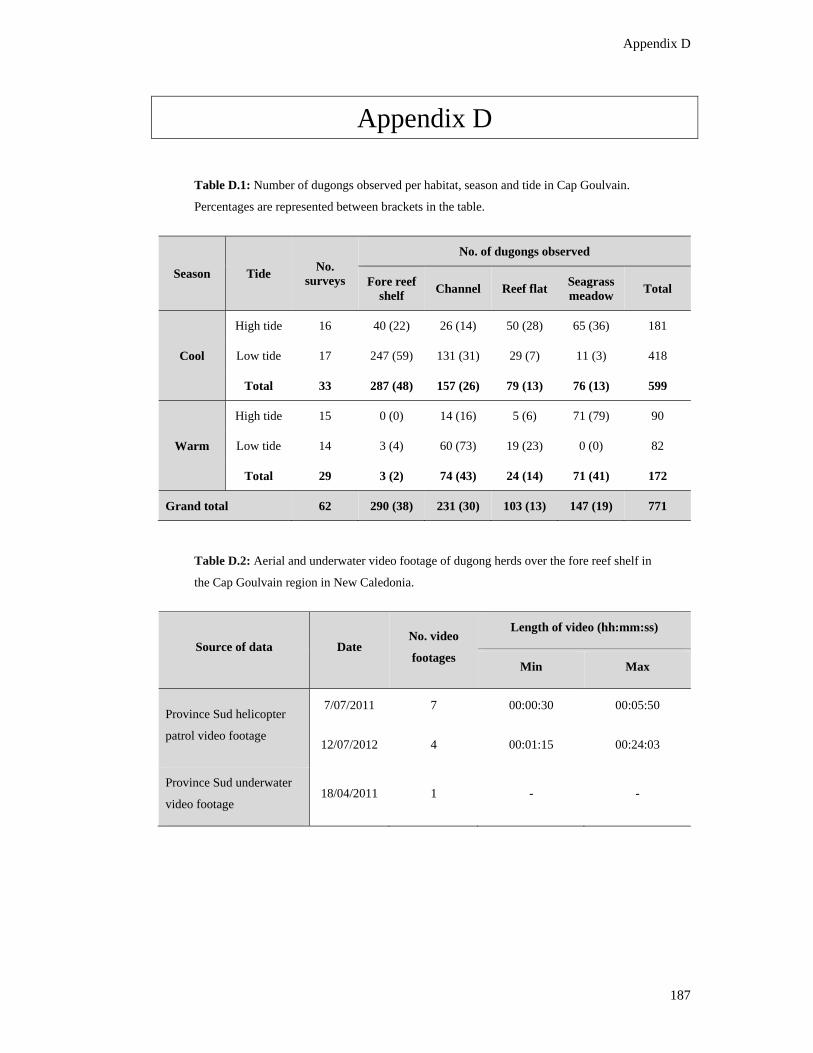
Appendix D
187
Appendix D
Table D.1: Number of dugongs observed per habitat, season and tide in Cap Goulvain.
Percentages are represented between brackets in the table.
Season Tide No.
surveys
No. of dugongs observed
Fore reef shelf
Channel Reef flat Seagrass meadow
Total
Cool
High tide 16 40 (22) 26 (14) 50 (28) 65 (36) 181
Low tide 17 247 (59) 131 (31) 29 (7) 11 (3) 418
Total 33 287 (48) 157 (26) 79 (13) 76 (13) 599
Warm
High tide 15 0 (0) 14 (16) 5 (6) 71 (79) 90
Low tide 14 3 (4) 60 (73) 19 (23) 0 (0) 82
Total 29 3 (2) 74 (43) 24 (14) 71 (41) 172
Grand total 62 290 (38) 231 (30) 103 (13) 147 (19) 771
Table D.2: Aerial and underwater video footage of dugong herds over the fore reef shelf in
the Cap Goulvain region in New Caledonia.
Source of data Date No. video
footages
Length of video (hh:mm:ss)
Min Max
Province Sud helicopter
patrol video footage
7/07/2011 7 00:00:30 00:05:50
12/07/2012 4 00:01:15 00:24:03
Province Sud underwater
video footage 18/04/2011 1 - -
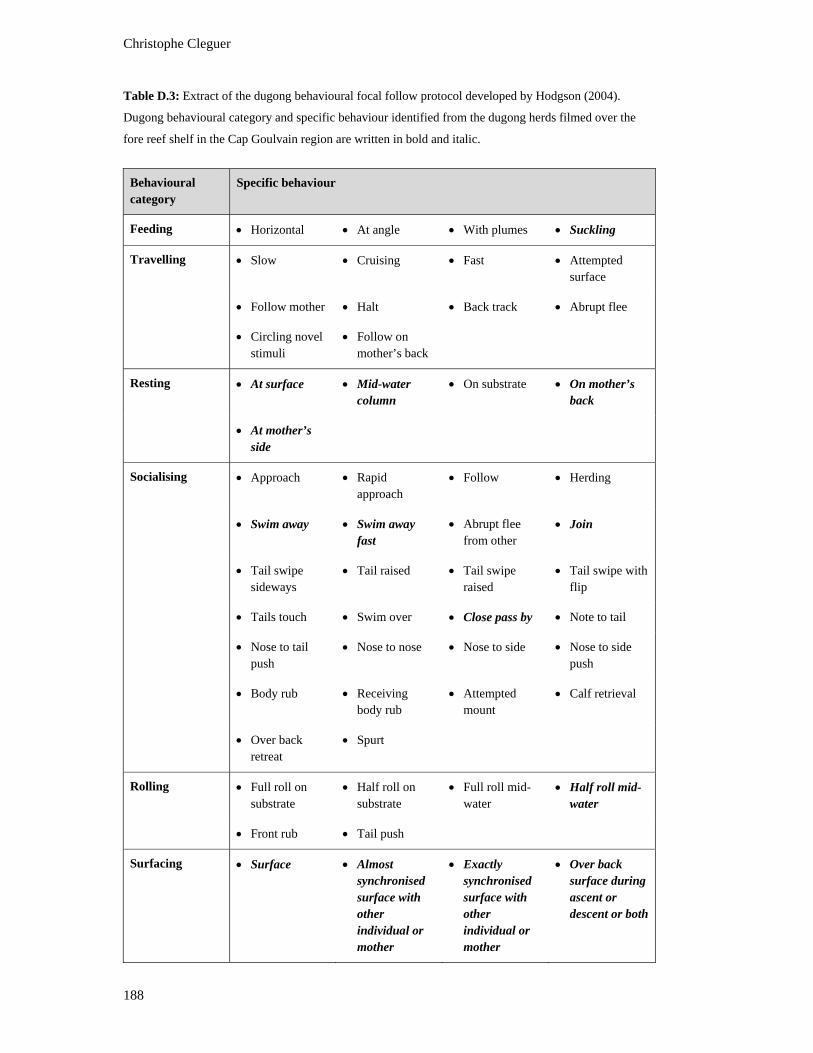
Christophe Cleguer
188
Table D.3: Extract of the dugong behavioural focal follow protocol developed by Hodgson (2004).
Dugong behavioural category and specific behaviour identified from the dugong herds filmed over the
fore reef shelf in the Cap Goulvain region are written in bold and italic.
Behavioural category
Specific behaviour
Feeding Horizontal At angle With plumes Suckling
Travelling Slow Cruising Fast Attempted surface
Follow mother Halt Back track Abrupt flee
Circling novel stimuli
Follow on mother’s back
Resting At surface Mid-water column
On substrate On mother’s back
At mother’s side
Socialising Approach Rapid approach
Follow Herding
Swim away Swim away fast
Abrupt flee from other
Join
Tail swipe sideways
Tail raised Tail swipe raised
Tail swipe with flip
Tails touch Swim over Close pass by Note to tail
Nose to tail push
Nose to nose Nose to side Nose to side push
Body rub Receiving body rub
Attempted mount
Calf retrieval
Over back retreat
Spurt
Rolling Full roll on substrate
Half roll on substrate
Full roll mid-water
Half roll mid-water
Front rub Tail push
Surfacing Surface Almost synchronised surface with other individual or mother
Exactly synchronised surface with other individual or mother
Over back surface during ascent or descent or both
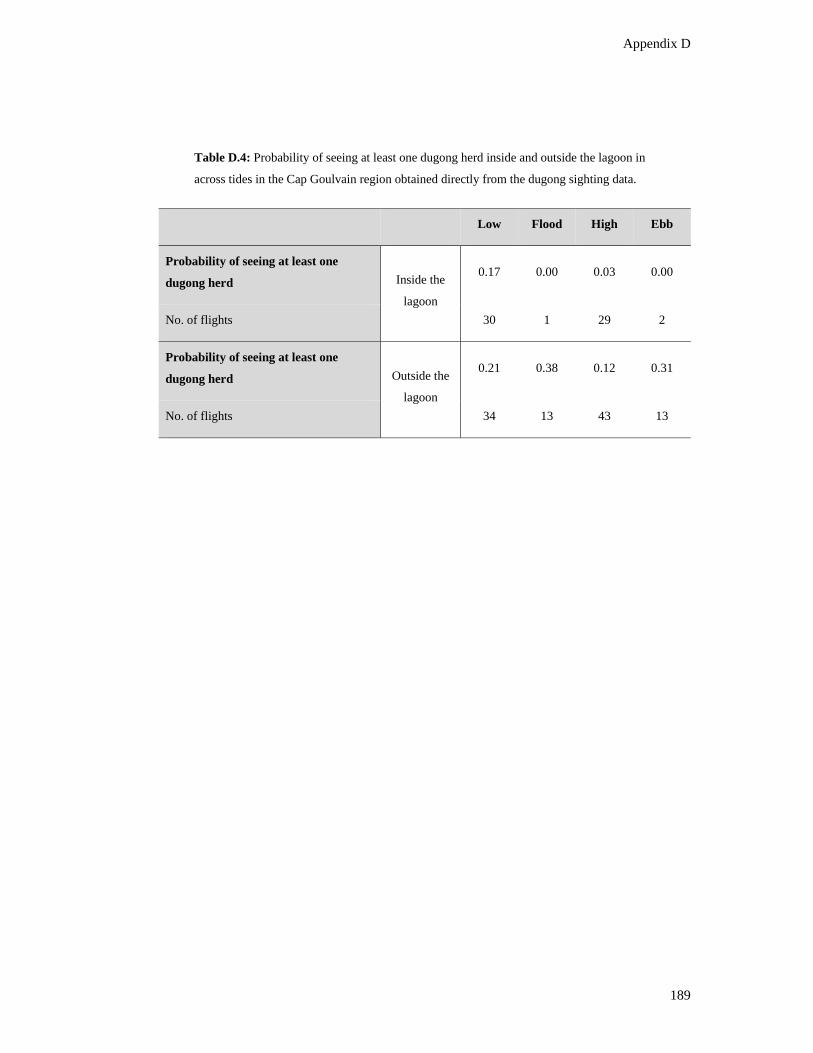
Appendix D
189
Table D.4: Probability of seeing at least one dugong herd inside and outside the lagoon in
across tides in the Cap Goulvain region obtained directly from the dugong sighting data.
Low Flood High Ebb
Probability of seeing at least one
dugong herd Inside the
lagoon
0.17 0.00 0.03 0.00
No. of flights 30 1 29 2
Probability of seeing at least one
dugong herd Outside the
lagoon
0.21 0.38 0.12 0.31
No. of flights 34 13 43 13
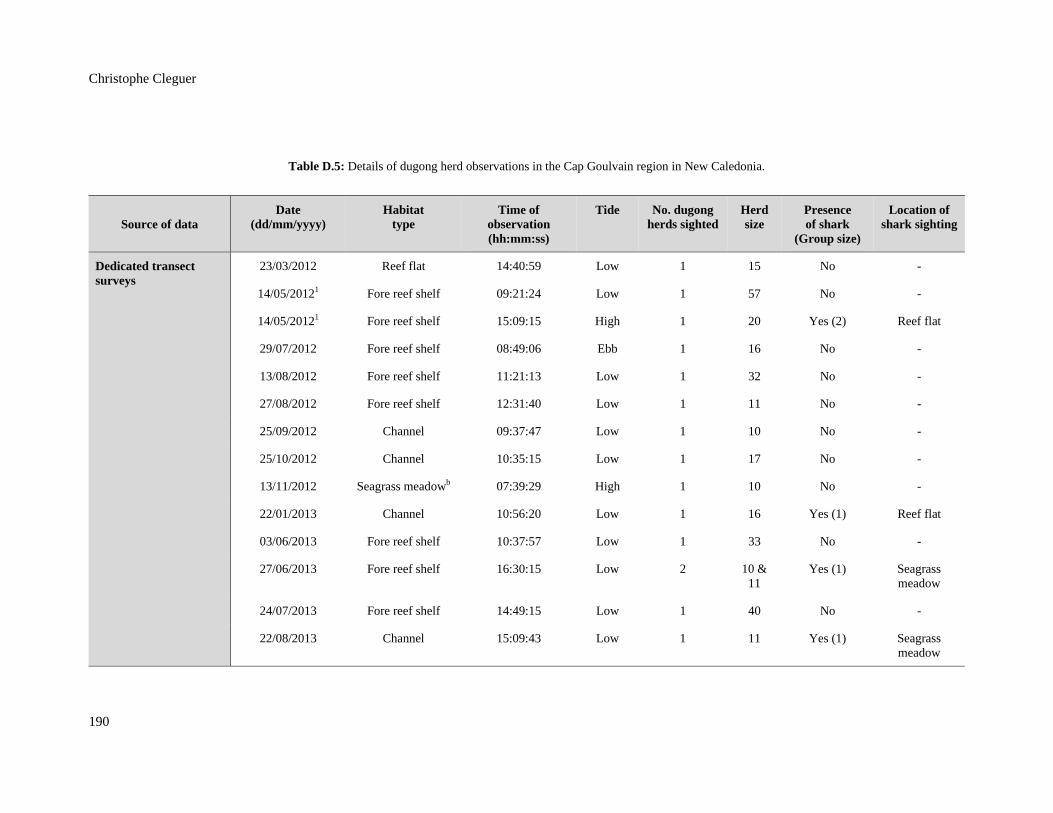
Christophe Cleguer
190
Table D.5: Details of dugong herd observations in the Cap Goulvain region in New Caledonia.
Source of data Date
(dd/mm/yyyy) Habitat
type Time of
observation (hh:mm:ss)
Tide No. dugong herds sighted
Herd size
Presence of shark
(Group size)
Location of shark sighting
Dedicated transect surveys
23/03/2012 Reef flat 14:40:59 Low 1 15 No -
14/05/20121 Fore reef shelf 09:21:24 Low 1 57 No -
14/05/20121 Fore reef shelf 15:09:15 High 1 20 Yes (2) Reef flat
29/07/2012 Fore reef shelf 08:49:06 Ebb 1 16 No -
13/08/2012 Fore reef shelf 11:21:13 Low 1 32 No -
27/08/2012 Fore reef shelf 12:31:40 Low 1 11 No -
25/09/2012 Channel 09:37:47 Low 1 10 No -
25/10/2012 Channel 10:35:15 Low 1 17 No -
13/11/2012 Seagrass meadowb 07:39:29 High 1 10 No -
22/01/2013 Channel 10:56:20 Low 1 16 Yes (1) Reef flat
03/06/2013 Fore reef shelf 10:37:57 Low 1 33 No -
27/06/2013 Fore reef shelf 16:30:15 Low 2 10 & 11
Yes (1) Seagrass meadow
24/07/2013 Fore reef shelf 14:49:15 Low 1 40 No -
22/08/2013 Channel 15:09:43 Low 1 11 Yes (1) Seagrass meadow
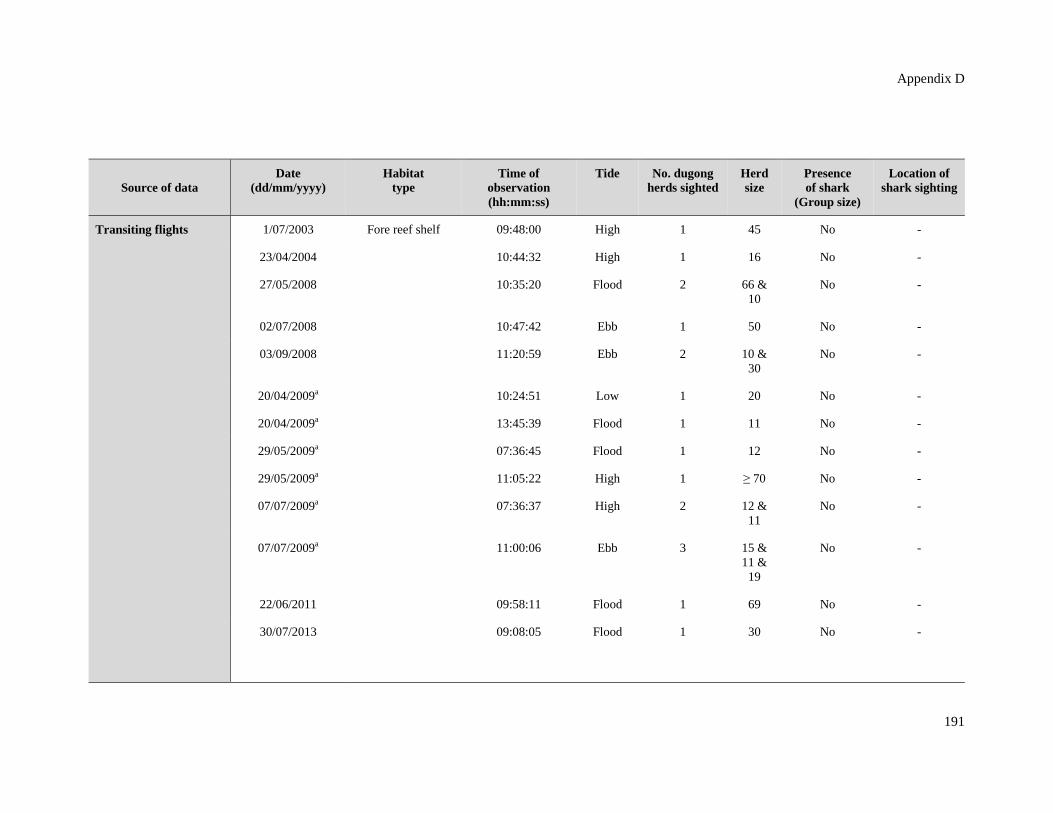
Appendix D
191
Source of data Date
(dd/mm/yyyy) Habitat
type Time of
observation (hh:mm:ss)
Tide No. dugong herds sighted
Herd size
Presence of shark
(Group size)
Location of shark sighting
Transiting flights 1/07/2003 Fore reef shelf 09:48:00 High 1 45 No -
23/04/2004 10:44:32 High 1 16 No -
27/05/2008 10:35:20 Flood 2 66 & 10
No -
02/07/2008 10:47:42 Ebb 1 50 No -
03/09/2008 11:20:59 Ebb 2 10 & 30
No -
20/04/2009a 10:24:51 Low 1 20 No -
20/04/2009a 13:45:39 Flood 1 11 No -
29/05/2009a 07:36:45 Flood 1 12 No -
29/05/2009a 11:05:22 High 1 ≥ 70 No -
07/07/2009a 07:36:37 High 2 12 & 11
No -
07/07/2009a 11:00:06 Ebb 3 15 & 11 &
19
No -
22/06/2011 09:58:11 Flood 1 69 No -
30/07/2013 09:08:05 Flood 1 30 No -

Christophe Cleguer
192
Source of data Date
(dd/mm/yyyy) Habitat
type Time of
observation (hh:mm:ss)
Tide No. dugong herds sighted
Herd size
Presence of shark
(Group size)
Location of shark sighting
Province Sud helicopter patrol video footage
07/07/2011 Fore reef shelf Unknown - 2 17 & 51
No -
12/07/2012 Unknown - 1 ≥ 28 No -
Province Sud underwater video footage
18/04/2011 10:00:00 Low 1 Un-known
No -
a Another dugong herd was sighted on the same day but at a different stage of the tide.
b The only dugong herd observed on the seagrass meadow was characterised as a feeding herd creating sediment plumes.
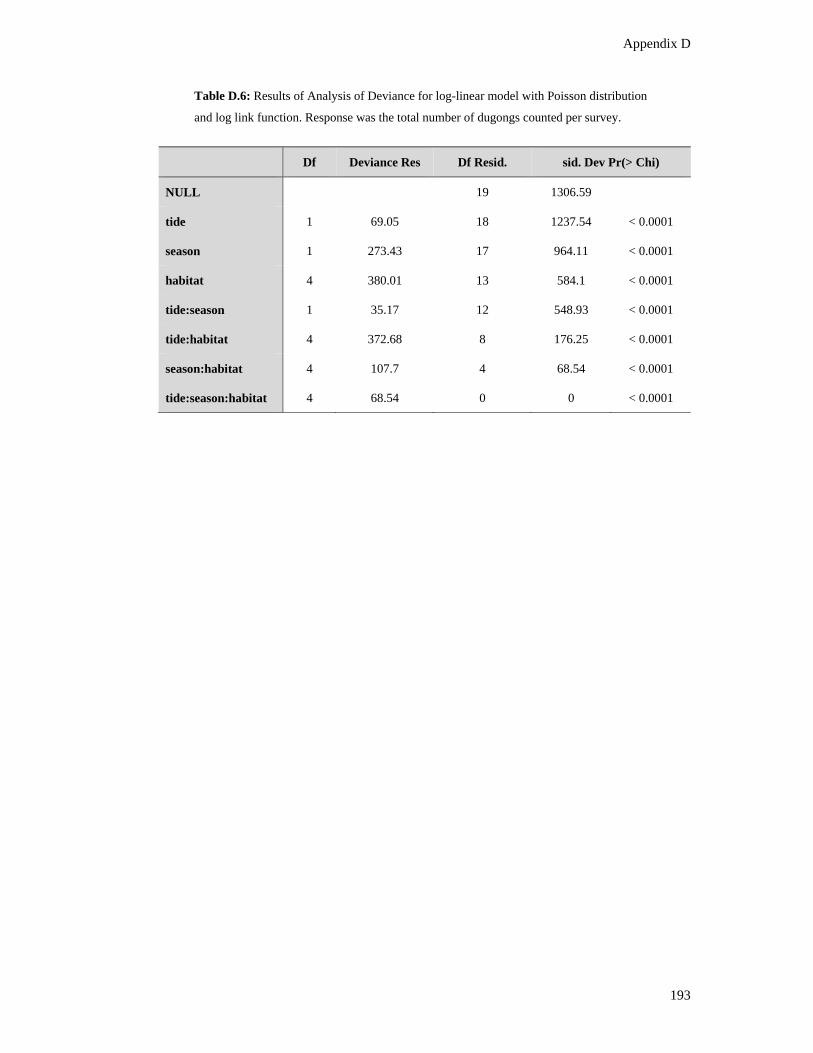
Appendix D
193
Table D.6: Results of Analysis of Deviance for log-linear model with Poisson distribution
and log link function. Response was the total number of dugongs counted per survey.
Df Deviance Res Df Resid. sid. Dev Pr(> Chi)
NULL 19 1306.59
tide 1 69.05 18 1237.54 < 0.0001
season 1 273.43 17 964.11 < 0.0001
habitat 4 380.01 13 584.1 < 0.0001
tide:season 1 35.17 12 548.93 < 0.0001
tide:habitat 4 372.68 8 176.25 < 0.0001
season:habitat 4 107.7 4 68.54 < 0.0001
tide:season:habitat 4 68.54 0 0 < 0.0001

Appendix E
195
Appendix E
Aerial and underwater footage of dugong aggregations on the fore reef
shelf in Cap Goulvain, New Caledonia
Included as DVD in hard copy of the thesis and provided as a separate file for e-thesis users.

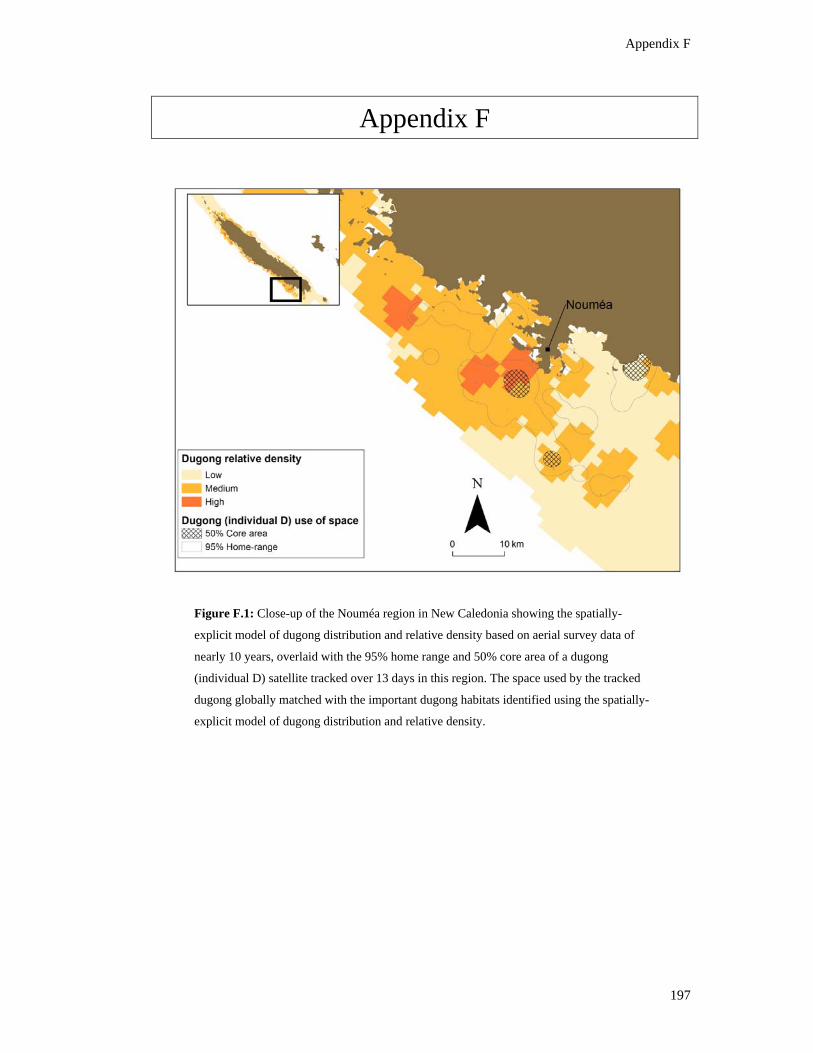
Appendix F
197
Appendix F
Figure F.1: Close-up of the Nouméa region in New Caledonia showing the spatially-
explicit model of dugong distribution and relative density based on aerial survey data of
nearly 10 years, overlaid with the 95% home range and 50% core area of a dugong
(individual D) satellite tracked over 13 days in this region. The space used by the tracked
dugong globally matched with the important dugong habitats identified using the spatially-
explicit model of dugong distribution and relative density.
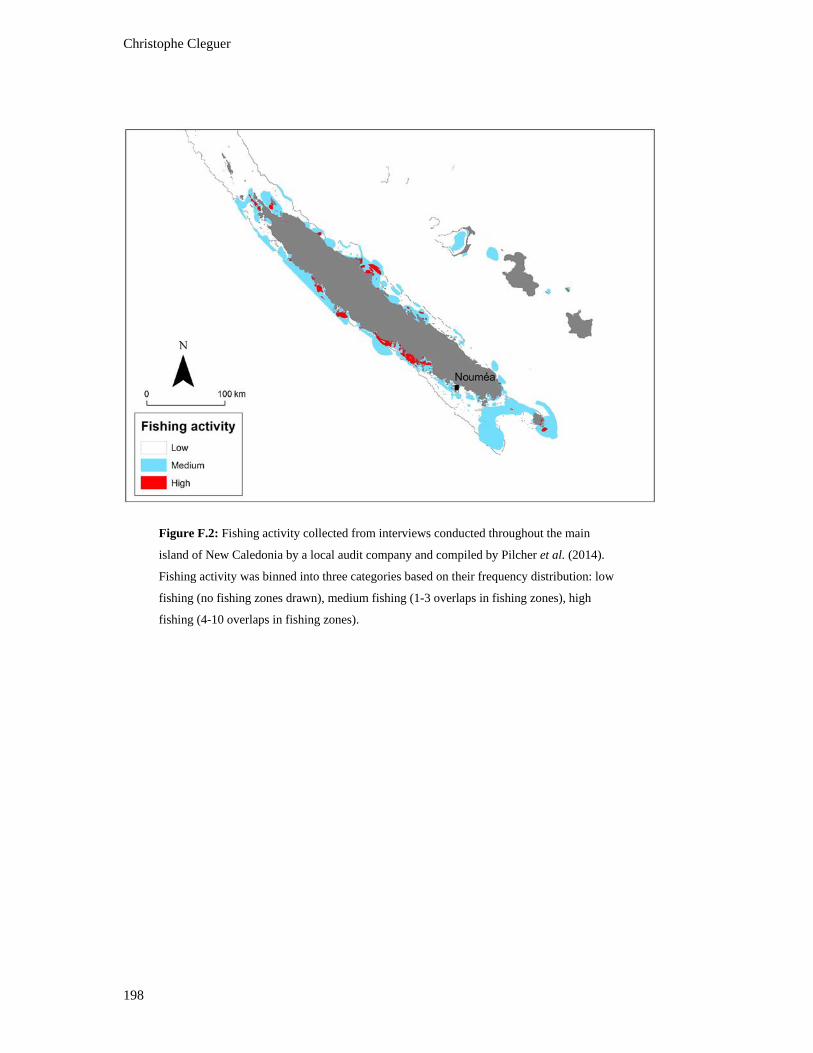
Christophe Cleguer
198
Figure F.2: Fishing activity collected from interviews conducted throughout the main
island of New Caledonia by a local audit company and compiled by Pilcher et al. (2014).
Fishing activity was binned into three categories based on their frequency distribution: low
fishing (no fishing zones drawn), medium fishing (1-3 overlaps in fishing zones), high
fishing (4-10 overlaps in fishing zones).