Informe de Política Monetaria - bcra.gov.ar · Índice del informe 1 | Contexto internacional 2...
30
BCRA | BCRA | BCRA | BCRA | BCRA | BCRA | BCRA | BCRA | BCRA | BCRA | BCRA | BCRA | BCRA | BCRA | BCRA | BCRA | BCRA | BCRA | BCRA | BCRA | BCRA | BCRA | BCRA | BCRA | BCRA | BCRA | BCRA | BCRA Informe de Política Monetaria Abril de 2018
Transcript of Informe de Política Monetaria - bcra.gov.ar · Índice del informe 1 | Contexto internacional 2...

BCRA | BCRA | BCRA | BCRA | BCRA | BCRA | BCRA | BCRA | BCRA | BCRA | BCRA | BCRA | BCRA | BCRA | BCRA | BCRA | BCRA | BCRA | BCRA | BCRA | BCRA | BCRA | BCRA | BCRA | BCRA | BCRA | BCRA | BCRA
Informe de Política Monetaria Abril de 2018
BCRA | BCRA | BCRA | BCRA | BCRA | BCRA | BCRA | BCRA | BCRA | BCRA | BCRA | BCRA | BCRA | BCRA | BCRA | BCRA | BCRA | BCRA | BCRA | BCRA | BCRA | BCRA | BCRA | BCRA | BCRA | BCRA | BCRA | BCRA
Índice del informe
1 | Contexto internacional
2 | Actividad económica
3 | Inflación
4 | Política monetaria
BCRA | BCRA | BCRA | BCRA | BCRA | BCRA | BCRA | BCRA | BCRA | BCRA | BCRA | BCRA | BCRA | BCRA | BCRA | BCRA | BCRA | BCRA | BCRA | BCRA | BCRA | BCRA | BCRA | BCRA | BCRA | BCRA | BCRA | BCRA
Índice de la presentación
1 | Crecimiento y desinflación en 2017
2 | Análisis y perspectivas 2018
3 | Política monetaria

BCRA | BCRA | BCRA | BCRA | BCRA | BCRA | BCRA | BCRA | BCRA | BCRA | BCRA | BCRA | BCRA | BCRA | BCRA | BCRA | BCRA | BCRA | BCRA | BCRA | BCRA | BCRA | BCRA | BCRA | BCRA | BCRA | BCRA | BCRA
1. Crecimiento y desinflación en 2017
BCRA | BCRA | BCRA | BCRA | BCRA | BCRA | BCRA | BCRA | BCRA | BCRA | BCRA | BCRA | BCRA | BCRA | BCRA | BCRA | BCRA | BCRA | BCRA | BCRA | BCRA | BCRA | BCRA | BCRA | BCRA | BCRA | BCRA | BCRA
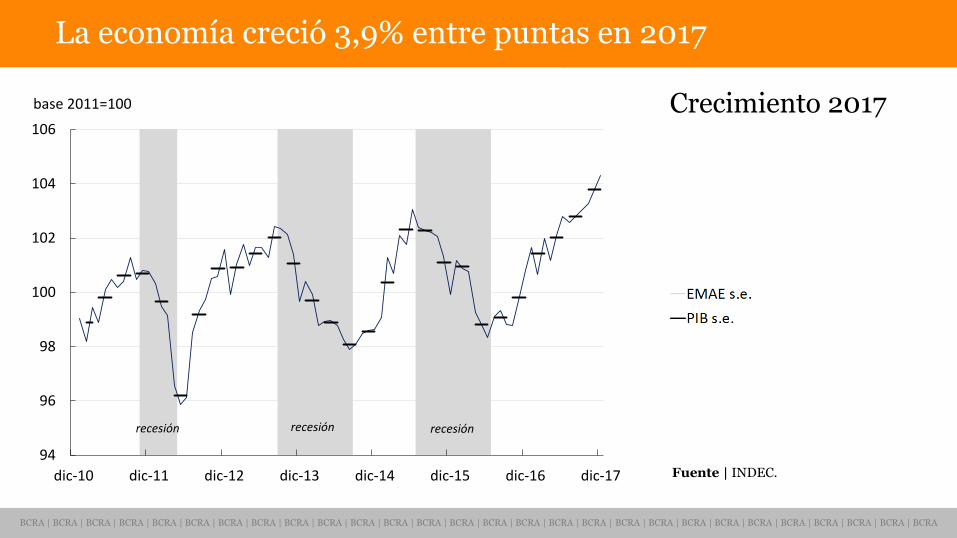
La economía creció 3,9% entre puntas en 2017
Crecimiento 2017
Fuente | INDEC.
94
96
98
100
102
104
106
dic-10 dic-11 dic-12 dic-13 dic-14 dic-15 dic-16 dic-17
base 2011=100
recesiónrecesiónrecesión
BCRA | BCRA | BCRA | BCRA | BCRA | BCRA | BCRA | BCRA | BCRA | BCRA | BCRA | BCRA | BCRA | BCRA | BCRA | BCRA | BCRA | BCRA | BCRA | BCRA | BCRA | BCRA | BCRA | BCRA | BCRA | BCRA | BCRA | BCRA
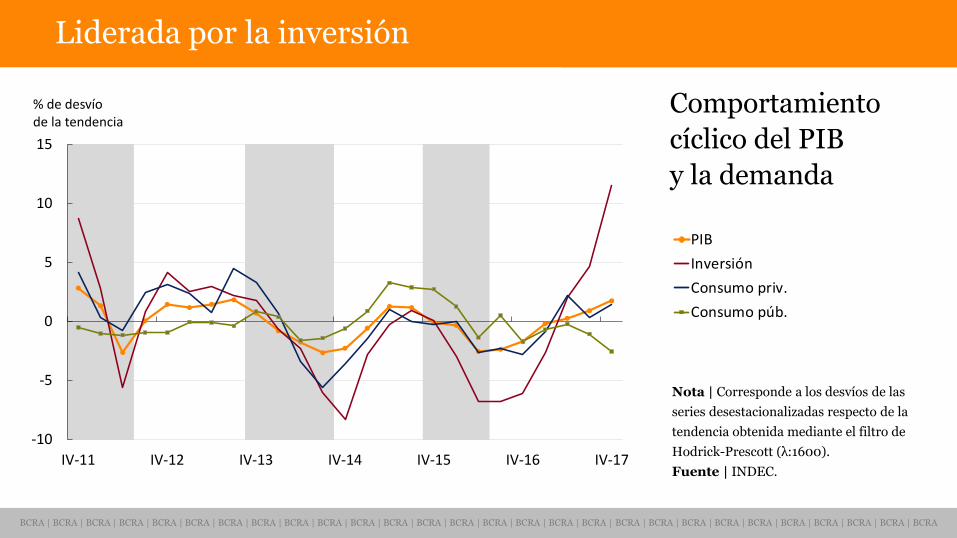
Liderada por la inversión
Comportamiento
cíclico del PIB
y la demanda
Nota | Corresponde a los desvíos de las
series desestacionalizadas respecto de la
tendencia obtenida mediante el filtro de
Hodrick-Prescott (λ:1600).
Fuente | INDEC.
-0,10
-0,05
0,00
0,05
0,10
0,15
IV-11 IV-12 IV-13 IV-14 IV-15 IV-16 IV-17
desvío respecto de la tendencia (en log)
PIB
Inversión
Consumo priv.
Consumo púb.
-10
-5
0
5
10
15
IV-11 IV-12 IV-13 IV-14 IV-15 IV-16 IV-17
% de desvío de la tendencia
BCRA | BCRA | BCRA | BCRA | BCRA | BCRA | BCRA | BCRA | BCRA | BCRA | BCRA | BCRA | BCRA | BCRA | BCRA | BCRA | BCRA | BCRA | BCRA | BCRA | BCRA | BCRA | BCRA | BCRA | BCRA | BCRA | BCRA | BCRA
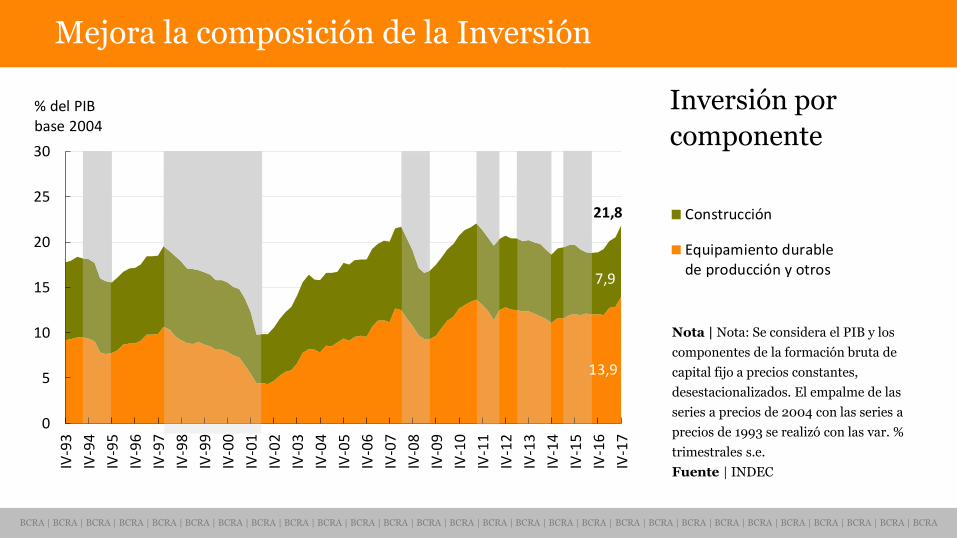
Mejora la composición de la Inversión
Inversión por
componente
Nota | Nota: Se considera el PIB y los
componentes de la formación bruta de
capital fijo a precios constantes,
desestacionalizados. El empalme de las
series a precios de 2004 con las series a
precios de 1993 se realizó con las var. %
trimestrales s.e.
Fuente | INDEC
0
5
10
15
20
25
30
IV-9
3
IV-9
4
IV-9
5
IV-9
6
IV-9
7
IV-9
8
IV-9
9
IV-0
0
IV-0
1
IV-0
2
IV-0
3
IV-0
4
IV-0
5
IV-0
6
IV-0
7
IV-0
8
IV-0
9
IV-1
0
IV-1
1
IV-1
2
IV-1
3
IV-1
4
IV-1
5
IV-1
6
IV-1
7
% del PIB base 2004
13,9
7,9
21,8
0
5
10
15
20
25
30
IV-9
3
IV-9
4
IV-9
5
IV-9
6
IV-9
7
IV-9
8
IV-9
9
IV-0
0
IV-0
1
IV-0
2
IV-0
3
IV-0
4
IV-0
5
IV-0
6
IV-0
7
IV-0
8
IV-0
9
IV-1
0
IV-1
1
IV-1
2
IV-1
3
IV-1
4
IV-1
5
IV-1
6
IV-1
7
Construcción
Equipamiento durablede producción y otros
% del PIB base 2004
13,9
7,9
21,8
BCRA | BCRA | BCRA | BCRA | BCRA | BCRA | BCRA | BCRA | BCRA | BCRA | BCRA | BCRA | BCRA | BCRA | BCRA | BCRA | BCRA | BCRA | BCRA | BCRA | BCRA | BCRA | BCRA | BCRA | BCRA | BCRA | BCRA | BCRA
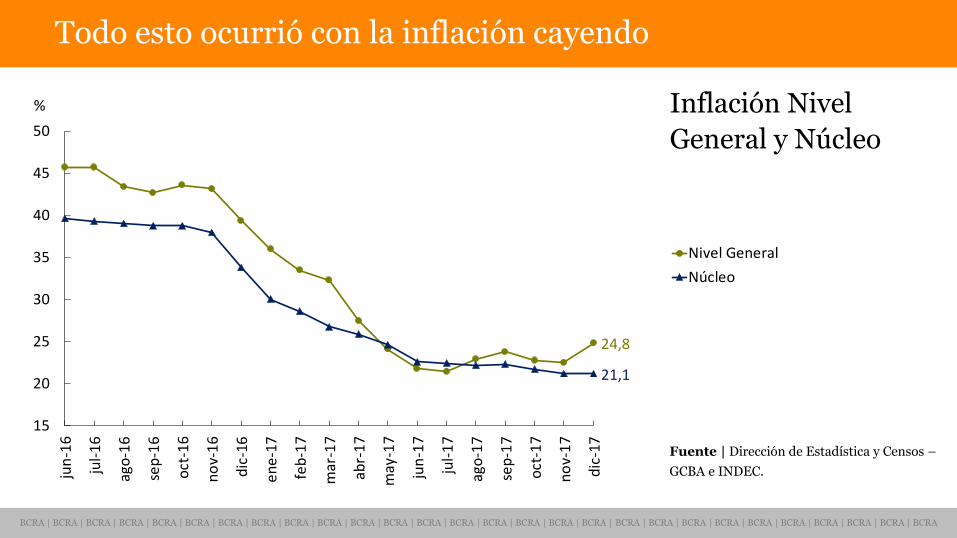
Todo esto ocurrió con la inflación cayendo
Inflación Nivel
General y Núcleo
Fuente | Dirección de Estadística y Censos –
GCBA e INDEC.
24,8
21,1
15
20
25
30
35
40
45
50
jun
-16
jul-
16
ago
-16
sep
-16
oct
-16
no
v-1
6
dic
-16
en
e-1
7
feb
-17
mar
-17
abr-
17
may
-17
jun
-17
jul-
17
ago
-17
sep
-17
oct
-17
no
v-1
7
dic
-17
%
Nivel General
Núcleo
24,8
21,1
15
20
25
30
35
40
45
50
jun
-16
jul-
16
ago
-16
sep
-16
oct
-16
no
v-1
6
dic
-16
en
e-1
7
feb
-17
mar
-17
abr-
17
may
-17
jun
-17
jul-
17
ago
-17
sep
-17
oct
-17
no
v-1
7
dic
-17
%
BCRA | BCRA | BCRA | BCRA | BCRA | BCRA | BCRA | BCRA | BCRA | BCRA | BCRA | BCRA | BCRA | BCRA | BCRA | BCRA | BCRA | BCRA | BCRA | BCRA | BCRA | BCRA | BCRA | BCRA | BCRA | BCRA | BCRA | BCRA
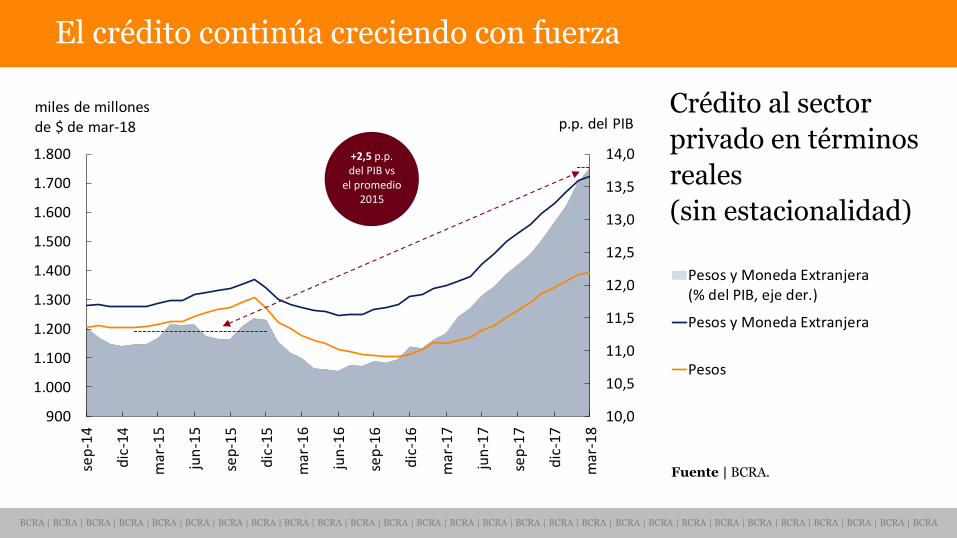
El crédito continúa creciendo con fuerza
Crédito al sector
privado en términos
reales
(sin estacionalidad)
Fuente | BCRA.
10,0
10,5
11,0
11,5
12,0
12,5
13,0
13,5
14,0
14,5
15,0
900
1.000
1.100
1.200
1.300
1.400
1.500
1.600
1.700
1.800
sep
-14
dic
-14
mar
-15
jun
-15
sep
-15
dic
-15
mar
-16
jun
-16
sep
-16
dic
-16
mar
-17
jun
-17
sep
-17
dic
-17
mar
-18
p.p. del PIBmiles de millones de $ de mar-18
Pesos y Moneda Extranjera(% del PIB, eje der.)
Pesos y Moneda Extranjera
Pesos
10,0
10,5
11,0
11,5
12,0
12,5
13,0
13,5
14,0
900
1.000
1.100
1.200
1.300
1.400
1.500
1.600
1.700
1.800
sep
-14
dic
-14
mar
-15
jun
-15
sep
-15
dic
-15
mar
-16
jun
-16
sep
-16
dic
-16
mar
-17
jun
-17
sep
-17
dic
-17
mar
-18
p.p. del PIBmiles de millones de $ de mar-18
+2,5 p.p. del PIB vs
el promedio 2015
BCRA | BCRA | BCRA | BCRA | BCRA | BCRA | BCRA | BCRA | BCRA | BCRA | BCRA | BCRA | BCRA | BCRA | BCRA | BCRA | BCRA | BCRA | BCRA | BCRA | BCRA | BCRA | BCRA | BCRA | BCRA | BCRA | BCRA | BCRA
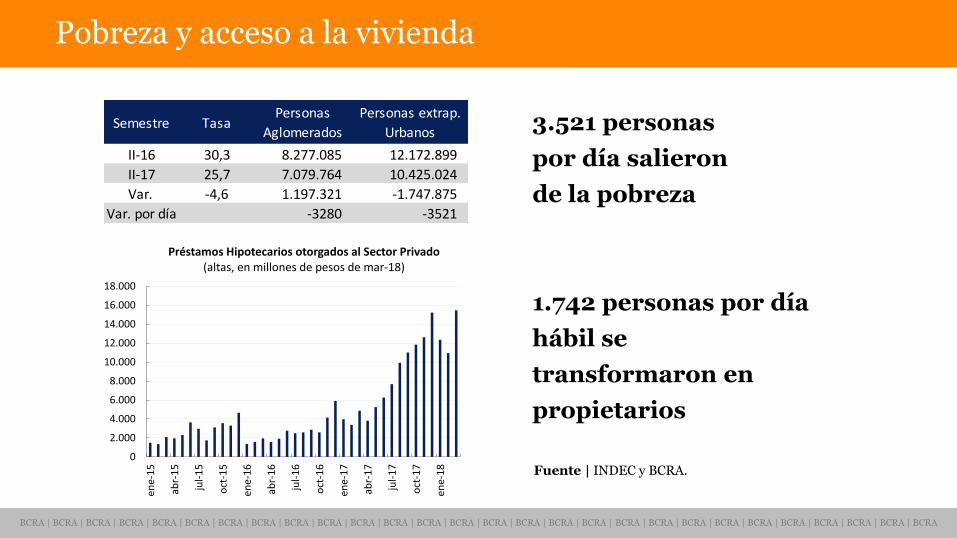
Pobreza y acceso a la vivienda
Fuente | INDEC y BCRA.
1.742 personas por día
hábil se
transformaron en
propietarios
3.521 personas
por día salieron
de la pobreza
0
2.000
4.000
6.000
8.000
10.000
12.000
14.000
16.000
18.000
ene-
15
abr-
15
jul-
15
oct
-15
ene-
16
abr-
16
jul-
16
oct
-16
ene-
17
abr-
17
jul-
17
oct
-17
ene-
18
Préstamos Hipotecarios otorgados al Sector Privado(altas, en millones de pesos de mar-18)
Semestre TasaPersonas
Aglomerados
Personas extrap.
Urbanos
II-16 30,3 8.277.085 12.172.899
II-17 25,7 7.079.764 10.425.024
Var. -4,6 1.197.321 -1.747.875
Var. por día -3280 -3521
BCRA | BCRA | BCRA | BCRA | BCRA | BCRA | BCRA | BCRA | BCRA | BCRA | BCRA | BCRA | BCRA | BCRA | BCRA | BCRA | BCRA | BCRA | BCRA | BCRA | BCRA | BCRA | BCRA | BCRA | BCRA | BCRA | BCRA | BCRA
2. Análisis y perspectivas 2018
BCRA | BCRA | BCRA | BCRA | BCRA | BCRA | BCRA | BCRA | BCRA | BCRA | BCRA | BCRA | BCRA | BCRA | BCRA | BCRA | BCRA | BCRA | BCRA | BCRA | BCRA | BCRA | BCRA | BCRA | BCRA | BCRA | BCRA | BCRA
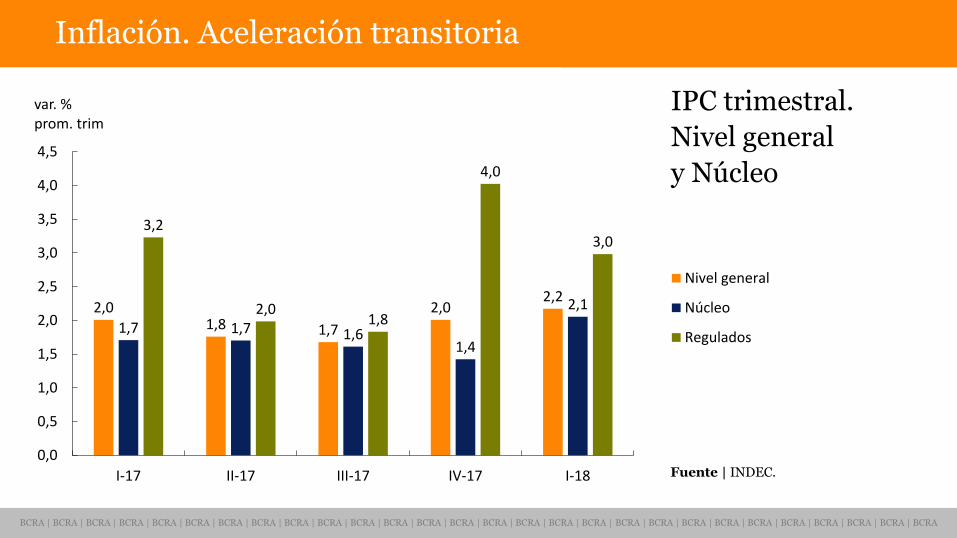
Fuente | INDEC.
Inflación. Aceleración transitoria
IPC trimestral.
Nivel general
y Núcleo
2,01,8 1,7
2,02,2
1,7 1,7 1,61,4
2,1
3,2
2,01,8
4,0
3,0
0,0
0,5
1,0
1,5
2,0
2,5
3,0
3,5
4,0
4,5
I-17 II-17 III-17 IV-17 I-18
var. % prom. trim
2,01,8 1,7
2,02,2
1,7 1,7 1,61,4
2,1
3,2
2,01,8
4,0
3,0
0,0
0,5
1,0
1,5
2,0
2,5
3,0
3,5
4,0
4,5
I-17 II-17 III-17 IV-17 I-18
var. % prom. trim
Nivel general
Núcleo
Regulados
BCRA | BCRA | BCRA | BCRA | BCRA | BCRA | BCRA | BCRA | BCRA | BCRA | BCRA | BCRA | BCRA | BCRA | BCRA | BCRA | BCRA | BCRA | BCRA | BCRA | BCRA | BCRA | BCRA | BCRA | BCRA | BCRA | BCRA | BCRA
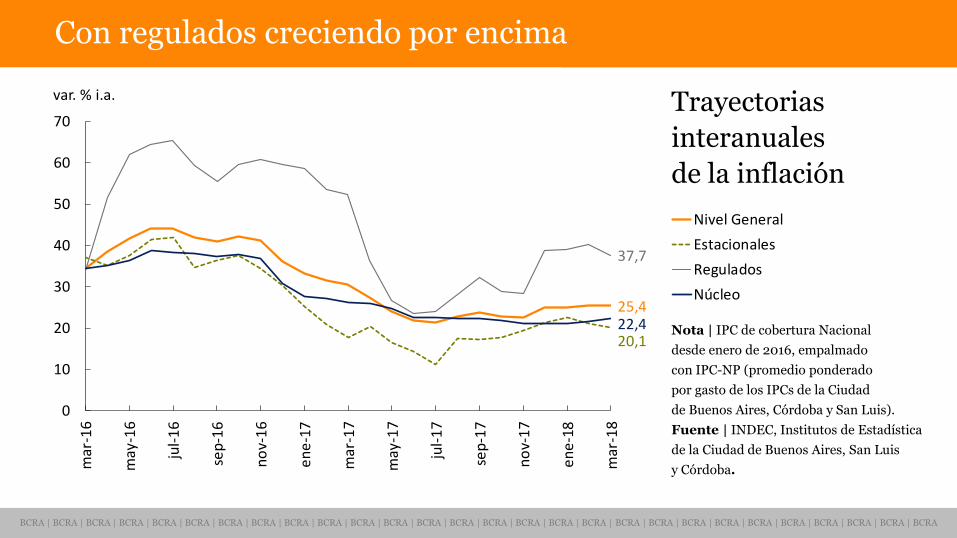
Con regulados creciendo por encima
Nota | IPC de cobertura Nacional
desde enero de 2016, empalmado
con IPC-NP (promedio ponderado
por gasto de los IPCs de la Ciudad
de Buenos Aires, Córdoba y San Luis).
Fuente | INDEC, Institutos de Estadística
de la Ciudad de Buenos Aires, San Luis
y Córdoba.
Trayectorias
interanuales
de la inflación
25,2
19,6
37,0
22,2
0
10
20
30
40
50
60
70
mar
-16
may
-16
jul-
16
sep
-16
no
v-1
6
en
e-1
7
mar
-17
may
-17
jul-
17
sep
-17
no
v-1
7
en
e-1
8
mar
-18
var. % i.a.
Nivel General
Estacionales
Regulados
Núcleo25,4
20,1
37,7
22,4
0
10
20
30
40
50
60
70
mar
-16
may
-16
jul-
16
sep
-16
no
v-1
6
en
e-1
7
mar
-17
may
-17
jul-
17
sep
-17
no
v-1
7
en
e-1
8
mar
-18
var. % i.a.
BCRA | BCRA | BCRA | BCRA | BCRA | BCRA | BCRA | BCRA | BCRA | BCRA | BCRA | BCRA | BCRA | BCRA | BCRA | BCRA | BCRA | BCRA | BCRA | BCRA | BCRA | BCRA | BCRA | BCRA | BCRA | BCRA | BCRA | BCRA
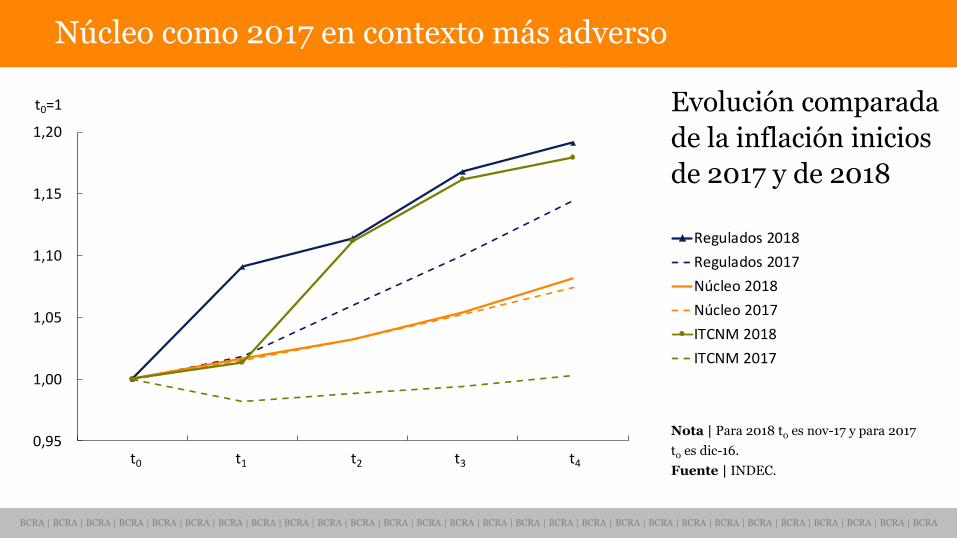
Núcleo como 2017 en contexto más adverso
Nota | Para 2018 t0 es nov-17 y para 2017
t0 es dic-16.
Fuente | INDEC.
Evolución comparada
de la inflación inicios
de 2017 y de 2018
0,95
1,00
1,05
1,10
1,15
1,20
t0 t1 t2 t3 t4
t0=1 Regulados 2018
Regulados 2017
Núcleo 2018
Núcleo 2017
ITCNM 2018
ITCNM 2017
0,95
1,00
1,05
1,10
1,15
1,20
t0 t1 t2 t3 t4
t0=1
t0 t1 t2 t3 t4
BCRA | BCRA | BCRA | BCRA | BCRA | BCRA | BCRA | BCRA | BCRA | BCRA | BCRA | BCRA | BCRA | BCRA | BCRA | BCRA | BCRA | BCRA | BCRA | BCRA | BCRA | BCRA | BCRA | BCRA | BCRA | BCRA | BCRA | BCRA
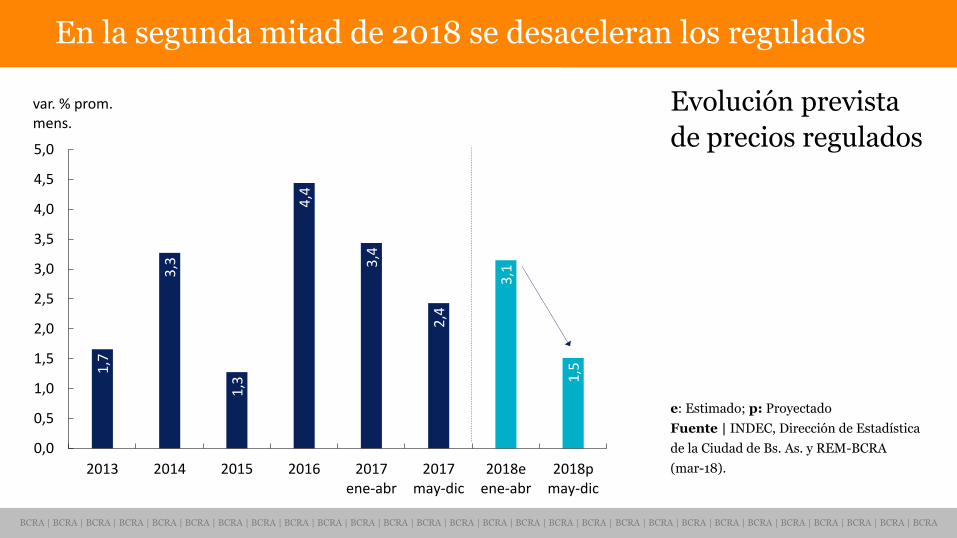
En la segunda mitad de 2018 se desaceleran los regulados
e: Estimado; p: Proyectado
Fuente | INDEC, Dirección de Estadística
de la Ciudad de Bs. As. y REM-BCRA
(mar-18).
Evolución prevista
de precios regulados
1,7
3,3
1,3
4,4
3,4
2,4
3,1
1,5
0,0
0,5
1,0
1,5
2,0
2,5
3,0
3,5
4,0
4,5
5,0
2013 2014 2015 2016 2017ene-abr
2017may-dic
2018eene-abr
2018pmay-dic
var. % prom. mens.
BCRA | BCRA | BCRA | BCRA | BCRA | BCRA | BCRA | BCRA | BCRA | BCRA | BCRA | BCRA | BCRA | BCRA | BCRA | BCRA | BCRA | BCRA | BCRA | BCRA | BCRA | BCRA | BCRA | BCRA | BCRA | BCRA | BCRA | BCRA
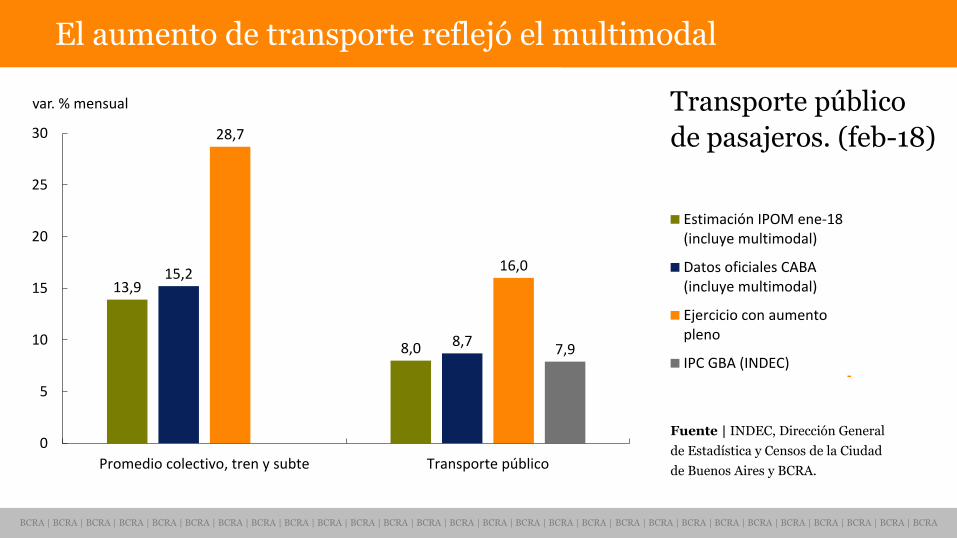
El aumento de transporte reflejó el multimodal
Transporte público
de pasajeros. (feb-18)
Fuente | INDEC, Dirección General
de Estadística y Censos de la Ciudad
de Buenos Aires y BCRA.
13,9
8,0
15,2
8,7
28,7
16,0
7,9
0
5
10
15
20
25
30
Promedio colectivo, tren y subte Transporte público
var. % mensual
13,9
8,0
15,2
8,7
28,7
16,0
7,9
0
5
10
15
20
25
30
Promedio colectivo, tren y subte Transporte público
var. % mensualEstimación IPOM ene-18(incluye multimodal)
Datos oficiales CABA(incluye multimodal)
Ejercicio con aumentopleno
IPC GBA (INDEC)
BCRA | BCRA | BCRA | BCRA | BCRA | BCRA | BCRA | BCRA | BCRA | BCRA | BCRA | BCRA | BCRA | BCRA | BCRA | BCRA | BCRA | BCRA | BCRA | BCRA | BCRA | BCRA | BCRA | BCRA | BCRA | BCRA | BCRA | BCRA
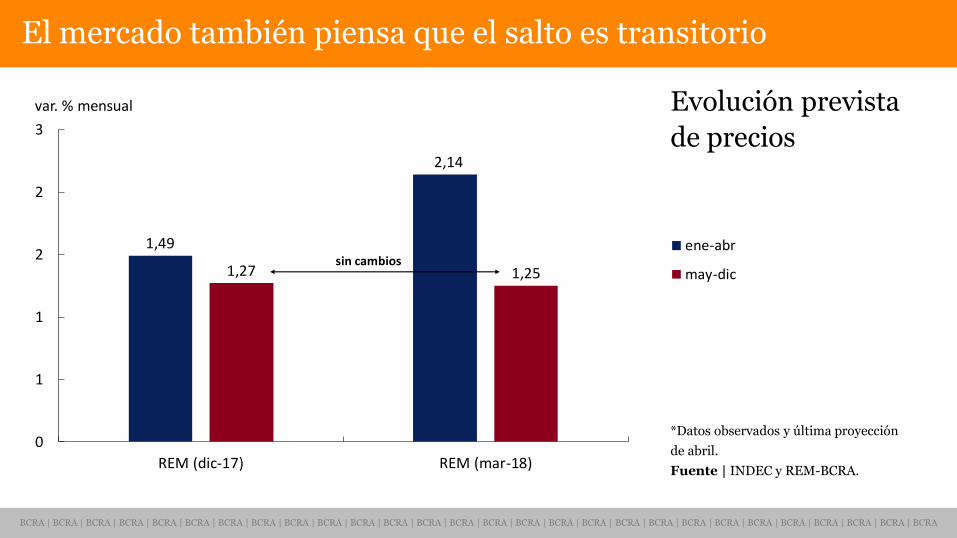
El mercado también piensa que el salto es transitorio
*Datos observados y última proyección
de abril.
Fuente | INDEC y REM-BCRA.
Evolución prevista
de precios
6,1
8,7*
10,6 10,6
17,4
20,3
0
5
10
15
20
25
REM (dic-17) REM (mar-18)
var. % acum.ene-abr
may-dic
2018
sin cambios
1,49
2,14
1,27 1,25
0
1
1
2
2
3
REM (dic-17) REM (mar-18)
var. % mensual
sin cambios
BCRA | BCRA | BCRA | BCRA | BCRA | BCRA | BCRA | BCRA | BCRA | BCRA | BCRA | BCRA | BCRA | BCRA | BCRA | BCRA | BCRA | BCRA | BCRA | BCRA | BCRA | BCRA | BCRA | BCRA | BCRA | BCRA | BCRA | BCRA
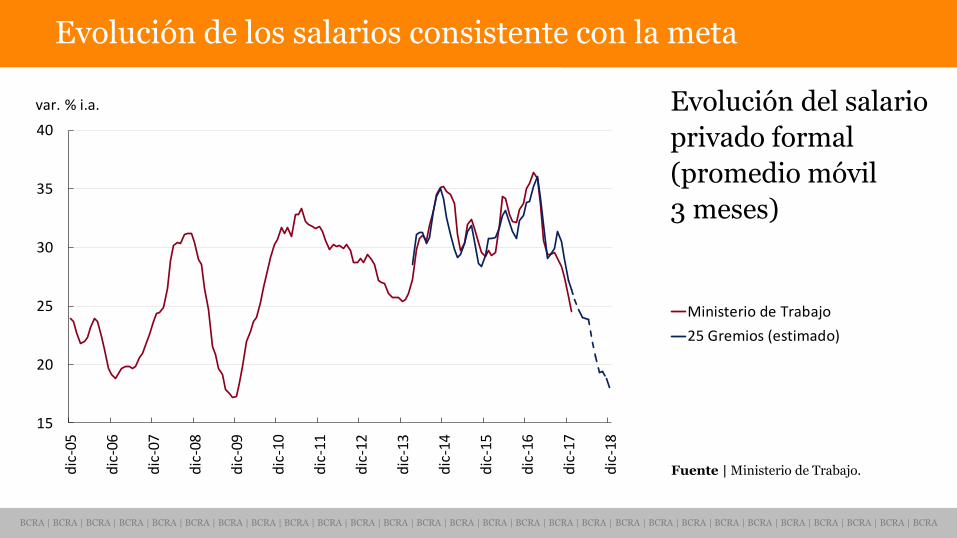
Evolución de los salarios consistente con la meta
Evolución del salario
privado formal
(promedio móvil
3 meses)
Fuente | Ministerio de Trabajo.
24,6
18,1
15
20
25
30
35
40
dic
-05
dic
-06
dic
-07
dic
-08
dic
-09
dic
-10
dic
-11
dic
-12
dic
-13
dic
-14
dic
-15
dic
-16
dic
-17
dic
-18
Ministerio de Trabajo
25 Gremios (estimado)
var. % i.a.
15
20
25
30
35
40
dic
-05
dic
-06
dic
-07
dic
-08
dic
-09
dic
-10
dic
-11
dic
-12
dic
-13
dic
-14
dic
-15
dic
-16
dic
-17
dic
-18
var. % i.a.
BCRA | BCRA | BCRA | BCRA | BCRA | BCRA | BCRA | BCRA | BCRA | BCRA | BCRA | BCRA | BCRA | BCRA | BCRA | BCRA | BCRA | BCRA | BCRA | BCRA | BCRA | BCRA | BCRA | BCRA | BCRA | BCRA | BCRA | BCRA
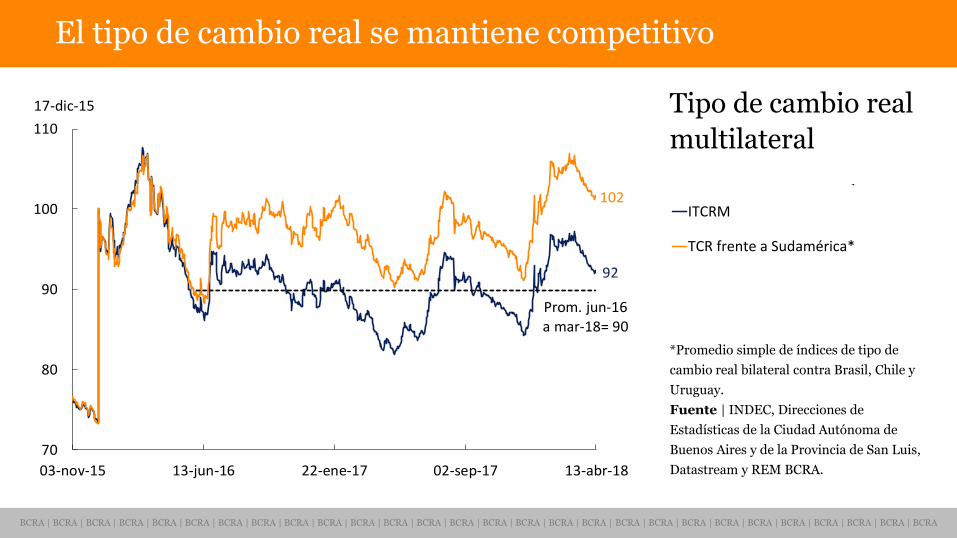
*Promedio simple de índices de tipo de
cambio real bilateral contra Brasil, Chile y
Uruguay.
Fuente | INDEC, Direcciones de
Estadísticas de la Ciudad Autónoma de
Buenos Aires y de la Provincia de San Luis,
Datastream y REM BCRA.
Tipo de cambio real
multilateral
El tipo de cambio real se mantiene competitivo
92
102
Prom. jun-17 a mar-18= 90
70
80
90
100
110
03-nov-15 13-jun-16 22-ene-17 02-sep-17 13-abr-18
17-dic-15
ITCRM
TCR frente a Sudamérica*
92
102
Prom. jun-16 a mar-18= 90
70
80
90
100
110
03-nov-15 13-jun-16 22-ene-17 02-sep-17 13-abr-18
17-dic-15
BCRA | BCRA | BCRA | BCRA | BCRA | BCRA | BCRA | BCRA | BCRA | BCRA | BCRA | BCRA | BCRA | BCRA | BCRA | BCRA | BCRA | BCRA | BCRA | BCRA | BCRA | BCRA | BCRA | BCRA | BCRA | BCRA | BCRA | BCRA
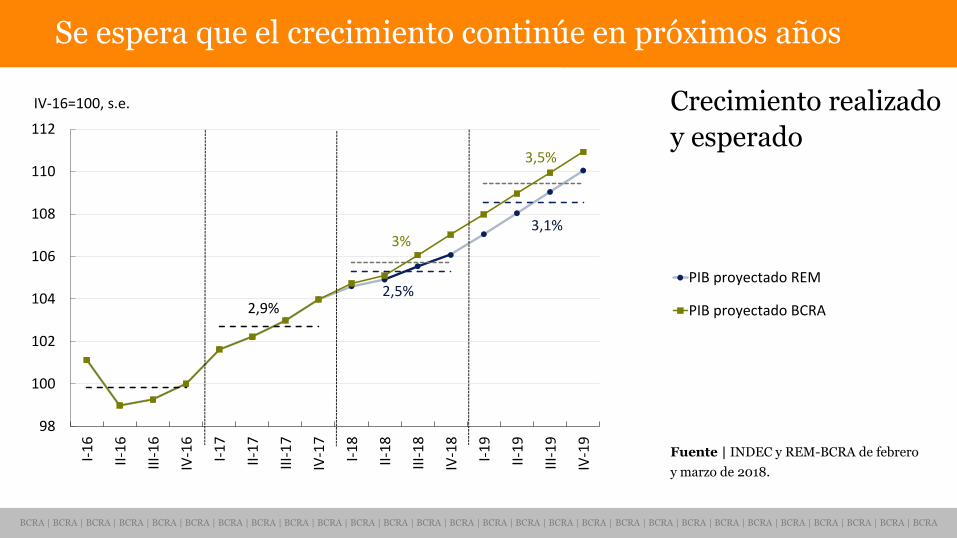
Se espera que el crecimiento continúe en próximos años
Fuente | INDEC y REM-BCRA de febrero
y marzo de 2018.
Crecimiento realizado
y esperado
98
100
102
104
106
108
110
112
I-1
6
II-1
6
III-
16
IV-1
6
I-1
7
II-1
7
III-
17
IV-1
7
I-1
8
II-1
8
III-
18
IV-1
8
I-1
9
II-1
9
III-
19
IV-1
9
IV-16=100, s.e.
2,9%2,5%
3,1%3%
3,5%
98
100
102
104
106
108
110
112
I-1
6
II-1
6
III-
16
IV-1
6
I-1
7
II-1
7
III-
17
IV-1
7
I-1
8
II-1
8
III-
18
IV-1
8
I-1
9
II-1
9
III-
19
IV-1
9
PIB proyectado REM
PIB proyectado BCRA
IV-16=100, s.e.
2,9%2,5%
3,1%3%
3,5%
BCRA | BCRA | BCRA | BCRA | BCRA | BCRA | BCRA | BCRA | BCRA | BCRA | BCRA | BCRA | BCRA | BCRA | BCRA | BCRA | BCRA | BCRA | BCRA | BCRA | BCRA | BCRA | BCRA | BCRA | BCRA | BCRA | BCRA | BCRA
3. Política monetaria
BCRA | BCRA | BCRA | BCRA | BCRA | BCRA | BCRA | BCRA | BCRA | BCRA | BCRA | BCRA | BCRA | BCRA | BCRA | BCRA | BCRA | BCRA | BCRA | BCRA | BCRA | BCRA | BCRA | BCRA | BCRA | BCRA | BCRA | BCRA
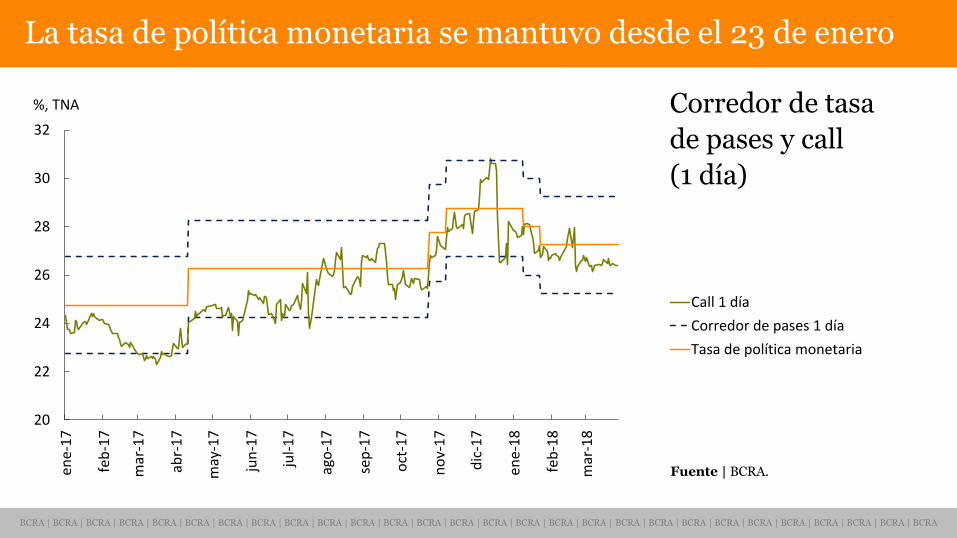
La tasa de política monetaria se mantuvo desde el 23 de enero
Corredor de tasa
de pases y call
(1 día)
Fuente | BCRA.
20
22
24
26
28
30
32
ene-
17
feb
-17
mar
-17
abr-
17
may
-17
jun
-17
jul-
17
ago
-17
sep
-17
oct
-17
no
v-1
7
dic
-17
ene-
18
feb
-18
mar
-18
%, TNA
20
22
24
26
28
30
32
ene-
17
feb
-17
mar
-17
abr-
17
may
-17
jun
-17
jul-
17
ago
-17
sep
-17
oct
-17
no
v-1
7
dic
-17
ene-
18
feb
-18
mar
-18
%, TNA
Call 1 día
Corredor de pases 1 día
Tasa de política monetaria
BCRA | BCRA | BCRA | BCRA | BCRA | BCRA | BCRA | BCRA | BCRA | BCRA | BCRA | BCRA | BCRA | BCRA | BCRA | BCRA | BCRA | BCRA | BCRA | BCRA | BCRA | BCRA | BCRA | BCRA | BCRA | BCRA | BCRA | BCRA
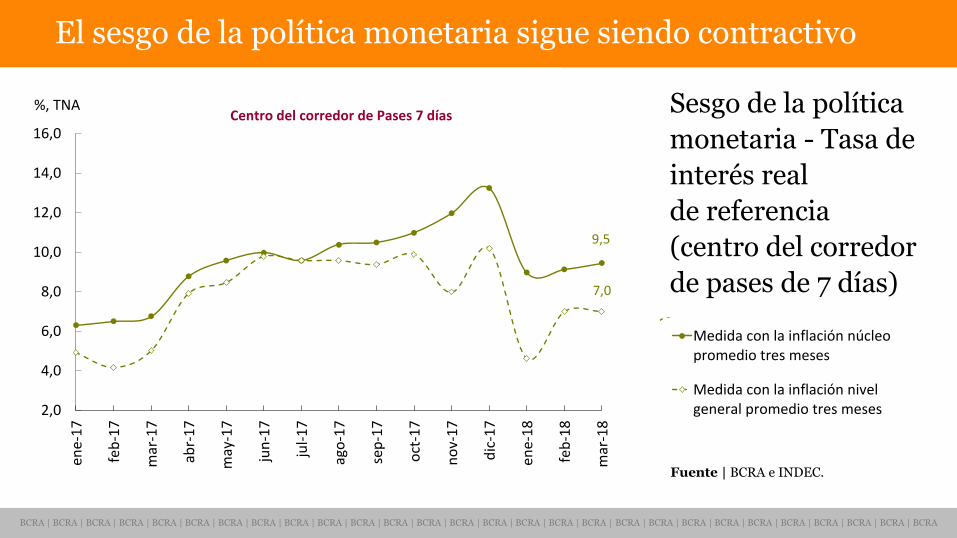
El sesgo de la política monetaria sigue siendo contractivo
Sesgo de la política
monetaria - Tasa de
interés real
de referencia
(centro del corredor
de pases de 7 días)
Fuente | BCRA e INDEC.
2,0
4,0
6,0
8,0
10,0
12,0
14,0
16,0
ene-
17
feb
-17
mar
-17
abr-
17
may
-17
jun
-17
jul-
17
ago
-17
sep
-17
oct
-17
no
v-1
7
dic
-17
ene-
18
feb
-18
mar
-18
%, TNACentro del corredor de Pases 7 días
9,5
7,0
2,0
4,0
6,0
8,0
10,0
12,0
14,0
16,0
ene-
17
feb
-17
mar
-17
abr-
17
may
-17
jun
-17
jul-
17
ago
-17
sep
-17
oct
-17
no
v-1
7
dic
-17
ene-
18
feb
-18
mar
-18
%, TNA
Medida con la inflación núcleopromedio tres meses
Medida con la inflación nivelgeneral promedio tres meses
Centro del corredor de Pases 7 días
9,5
7,0
BCRA | BCRA | BCRA | BCRA | BCRA | BCRA | BCRA | BCRA | BCRA | BCRA | BCRA | BCRA | BCRA | BCRA | BCRA | BCRA | BCRA | BCRA | BCRA | BCRA | BCRA | BCRA | BCRA | BCRA | BCRA | BCRA | BCRA | BCRA
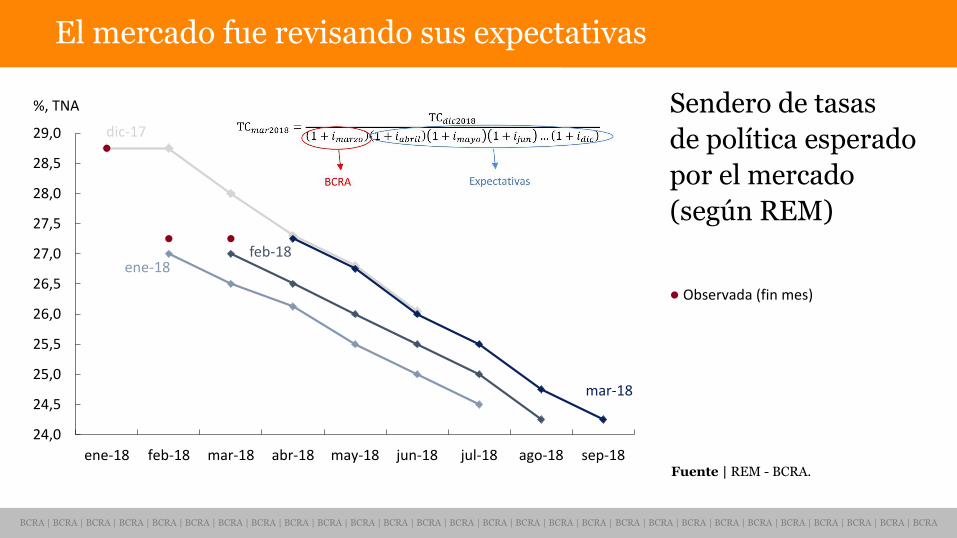
El mercado fue revisando sus expectativas
Sendero de tasas
de política esperado
por el mercado
(según REM)
Fuente | REM - BCRA.
24,0
24,5
25,0
25,5
26,0
26,5
27,0
27,5
28,0
28,5
29,0
ene-18 feb-18 mar-18 abr-18 may-18 jun-18 jul-18 ago-18 sep-18
%, TNA
24,0
24,5
25,0
25,5
26,0
26,5
27,0
27,5
28,0
28,5
29,0
ene-18 feb-18 mar-18 abr-18 may-18 jun-18 jul-18 ago-18 sep-18
%, TNA
Observada (fin mes)
dic-17
ene-18
feb-18
mar-18
ene-18 feb-18
mar-18
dic-17
BCRA | BCRA | BCRA | BCRA | BCRA | BCRA | BCRA | BCRA | BCRA | BCRA | BCRA | BCRA | BCRA | BCRA | BCRA | BCRA | BCRA | BCRA | BCRA | BCRA | BCRA | BCRA | BCRA | BCRA | BCRA | BCRA | BCRA | BCRA
Fuente | BCRA e INDEC.
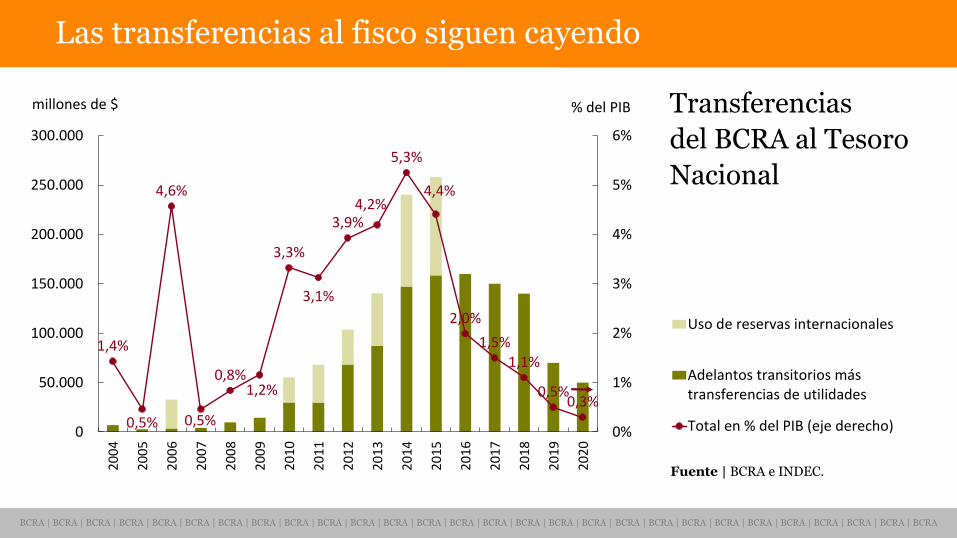
Las transferencias al fisco siguen cayendo
Transferencias
del BCRA al Tesoro
Nacional
1,4%
0,5%
4,6%
0,5%
0,8%
1,2%
3,3%
3,1%
3,9%4,2%
5,3%4,4%
2,0%1,5%
1,1%0,5%0,3%
0
50.000
100.000
150.000
200.000
250.000
300.000
0%
1%
2%
3%
4%
5%
6%
20
04
20
05
20
06
20
07
20
08
20
09
20
10
20
11
20
12
20
13
20
14
20
15
20
16
20
17
20
18
20
19
20
20
millones de $ % del PIB
Uso de reservas internacionales
Adelantos transitorios mástransferencias de utilidades
Total en % del PIB (eje derecho)
1,4%
0,5%
4,6%
0,5%
0,8%1,2%
3,3%
3,1%
3,9%4,2%
5,3%
4,4%
2,0%
1,5%1,1%
0,5%0,3%
0
50.000
100.000
150.000
200.000
250.000
300.000
0%
1%
2%
3%
4%
5%
6%
20
04
20
05
20
06
20
07
20
08
20
09
20
10
20
11
20
12
20
13
20
14
20
15
20
16
20
17
20
18
20
19
20
20
millones de $ % del PIB
BCRA | BCRA | BCRA | BCRA | BCRA | BCRA | BCRA | BCRA | BCRA | BCRA | BCRA | BCRA | BCRA | BCRA | BCRA | BCRA | BCRA | BCRA | BCRA | BCRA | BCRA | BCRA | BCRA | BCRA | BCRA | BCRA | BCRA | BCRA
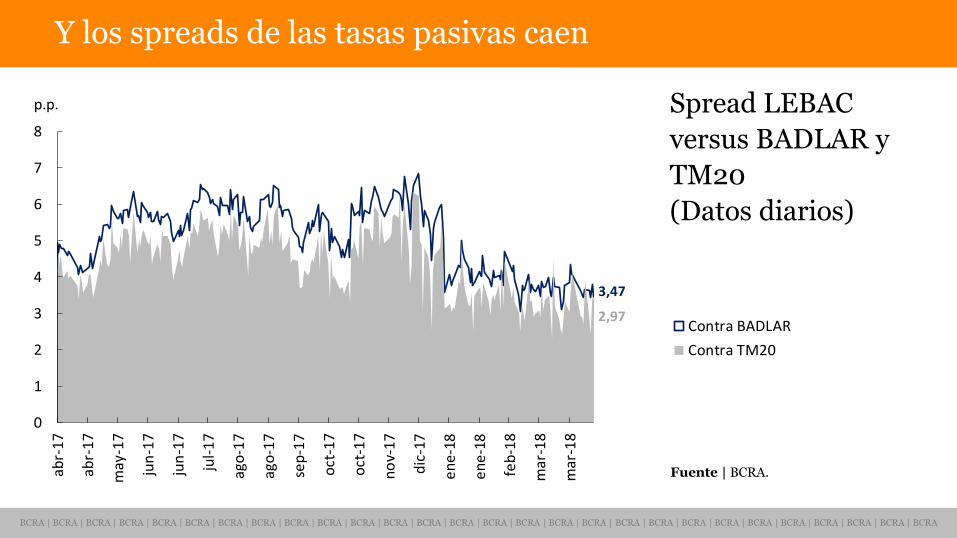
Y los spreads de las tasas pasivas caen
Spread LEBAC
versus BADLAR y
TM20
(Datos diarios)
Fuente | BCRA.
0
1
2
3
4
5
6
7
8
abr-
17
abr-
17
may
-17
jun
-17
jun
-17
jul-
17
ago
-17
ago
-17
sep
-17
oct
-17
oct
-17
no
v-1
7
dic
-17
en
e-1
8
en
e-1
8
feb
-18
mar
-18
p.p.Contra BADLAR
Contra TM20
0
1
2
3
4
5
6
7
8
abr-
17
abr-
17
may
-17
jun
-17
jun
-17
jul-
17
ago
-17
ago
-17
sep
-17
oct
-17
oct
-17
no
v-1
7
dic
-17
en
e-1
8
en
e-1
8
feb
-18
mar
-18
mar
-18
p.p.
2,97
3,47
BCRA | BCRA | BCRA | BCRA | BCRA | BCRA | BCRA | BCRA | BCRA | BCRA | BCRA | BCRA | BCRA | BCRA | BCRA | BCRA | BCRA | BCRA | BCRA | BCRA | BCRA | BCRA | BCRA | BCRA | BCRA | BCRA | BCRA | BCRA
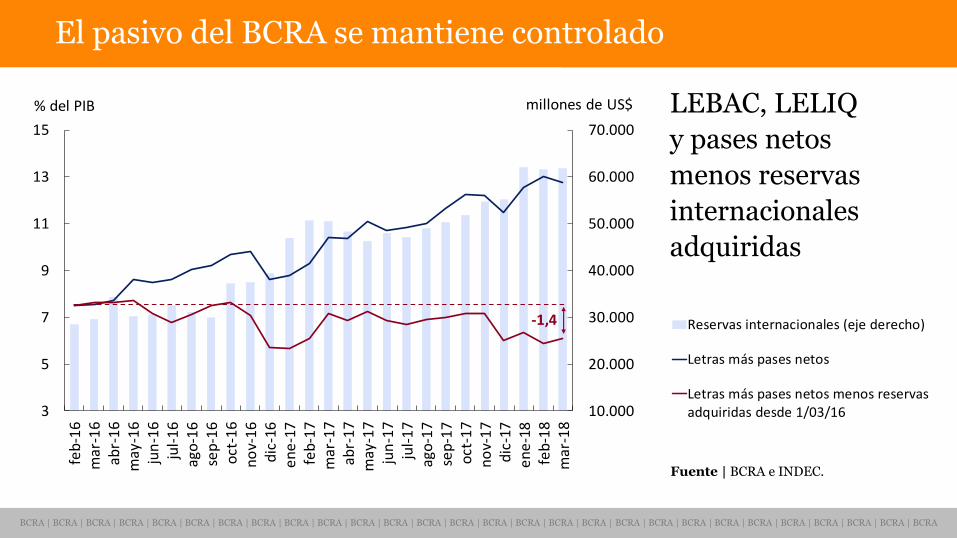
El pasivo del BCRA se mantiene controlado
LEBAC, LELIQ
y pases netos
menos reservas
internacionales
adquiridas
Fuente | BCRA e INDEC.
10.000
20.000
30.000
40.000
50.000
60.000
70.000
3
5
7
9
11
13
15
feb
-16
mar
-16
abr-
16
may
-16
jun
-16
jul-
16
ago
-16
sep
-16
oct
-16
no
v-1
6d
ic-1
6e
ne
-17
feb
-17
mar
-17
abr-
17
may
-17
jun
-17
jul-
17
ago
-17
sep
-17
oct
-17
no
v-1
7d
ic-1
7e
ne
-18
feb
-18
mar
-18
millones de US$% del PIB Reservas internacionales (eje derecho)
Letras más pases netos
Letras más pases netos menos reservasadquiridas desde 1/03/16
-1,4
10.000
20.000
30.000
40.000
50.000
60.000
70.000
3
5
7
9
11
13
15
feb
-16
mar
-16
abr-
16
may
-16
jun
-16
jul-
16
ago
-16
sep
-16
oct
-16
no
v-1
6d
ic-1
6e
ne
-17
feb
-17
mar
-17
abr-
17
may
-17
jun
-17
jul-
17
ago
-17
sep
-17
oct
-17
no
v-1
7d
ic-1
7e
ne
-18
feb
-18
mar
-18
millones de US$% del PIB
-1,4
BCRA | BCRA | BCRA | BCRA | BCRA | BCRA | BCRA | BCRA | BCRA | BCRA | BCRA | BCRA | BCRA | BCRA | BCRA | BCRA | BCRA | BCRA | BCRA | BCRA | BCRA | BCRA | BCRA | BCRA | BCRA | BCRA | BCRA | BCRA
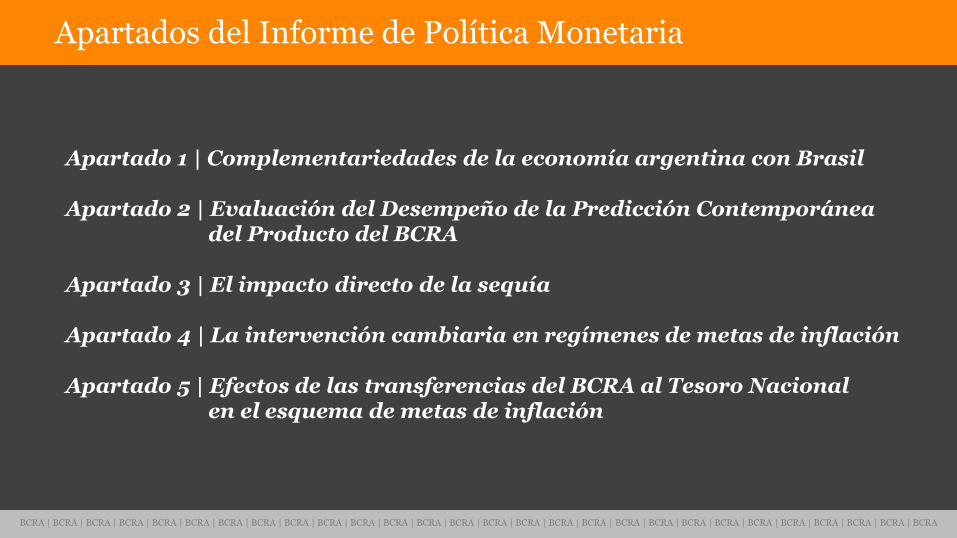
Apartado 1 | Complementariedades de la economía argentina con Brasil Apartado 2 | Evaluación del Desempeño de la Predicción Contemporánea del Producto del BCRA Apartado 3 | El impacto directo de la sequía Apartado 4 | La intervención cambiaria en regímenes de metas de inflación Apartado 5 | Efectos de las transferencias del BCRA al Tesoro Nacional en el esquema de metas de inflación
Apartados del Informe de Política Monetaria
BCRA | BCRA | BCRA | BCRA | BCRA | BCRA | BCRA | BCRA | BCRA | BCRA | BCRA | BCRA | BCRA | BCRA | BCRA | BCRA | BCRA | BCRA | BCRA | BCRA | BCRA | BCRA | BCRA | BCRA | BCRA | BCRA | BCRA | BCRA
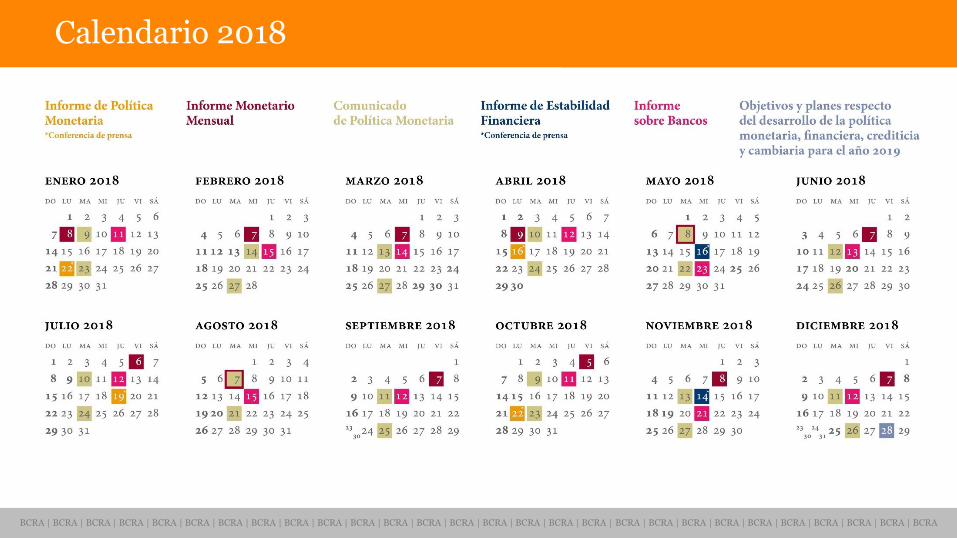
Calendario 2018

BCRA | BCRA | BCRA | BCRA | BCRA | BCRA | BCRA | BCRA | BCRA | BCRA | BCRA | BCRA | BCRA | BCRA | BCRA | BCRA | BCRA | BCRA | BCRA | BCRA | BCRA | BCRA | BCRA | BCRA | BCRA | BCRA | BCRA | BCRA
Muchas gracias


![INFORME CORPORATIVO INTEGRADO ANEXO: ANÁLISIS DE … · 2018-03-15 · AEO DE IFORME CORPORATIVO ITEGRADO [2017]2 ÍNDICE 1 Criterios y alcance del informe 3 1 Análisis de temas](https://static.fdocuments.us/doc/165x107/5e5bffc20d78c36c9a40f539/informe-corporativo-integrado-anexo-anlisis-de-2018-03-15-aeo-de-iforme-corporativo.jpg)