
Visualization Basics cs5764: Information Visualization Chris North.
Information Visualization
Pictures worth 1000 words...
Fall 2017 PSYCH / CS 6755 2
Agenda
ØInformation Visualization overviewv Definitionv Principlesv Examplesv Techniques
Fall 2017 PSYCH / CS 6755 3
Data, Data Everywhere
ØOur world is bustling in dataØComputers, internet and web have given
people more access to it (but it’s been here all along)
ØHow do we make sense of it?ØHow do we harness this data in decision-
making processes?

Fall 2017 PSYCH / CS 6755 4
Three Approaches
ØSoftware Agentsv Computational agent that carries out user’s
requestØData Mining
v Software that analyzes database and extracts “interesting” features
ØInformation Visualizationv Visual tools to help users better examine the
data themselves

Fall 2017 PSYCH / CS 6755 5
Atlanta Flight Traffic
AJC

Fall 2017 PSYCH / CS 6755 6
London Underground
Fall 2017 PSYCH / CS 6755 7
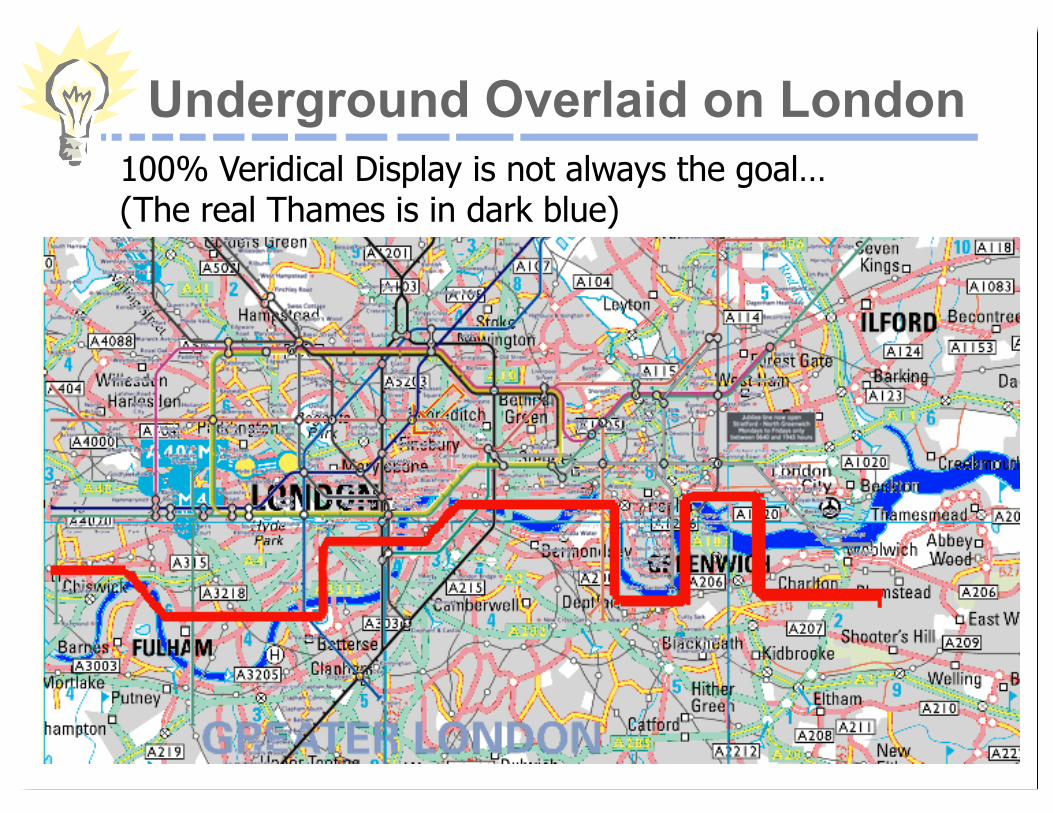
Underground Overlaid on London100% Veridical Display is not always the goal…(The real Thames is in dark blue)
Fall 2017 PSYCH / CS 6755 8
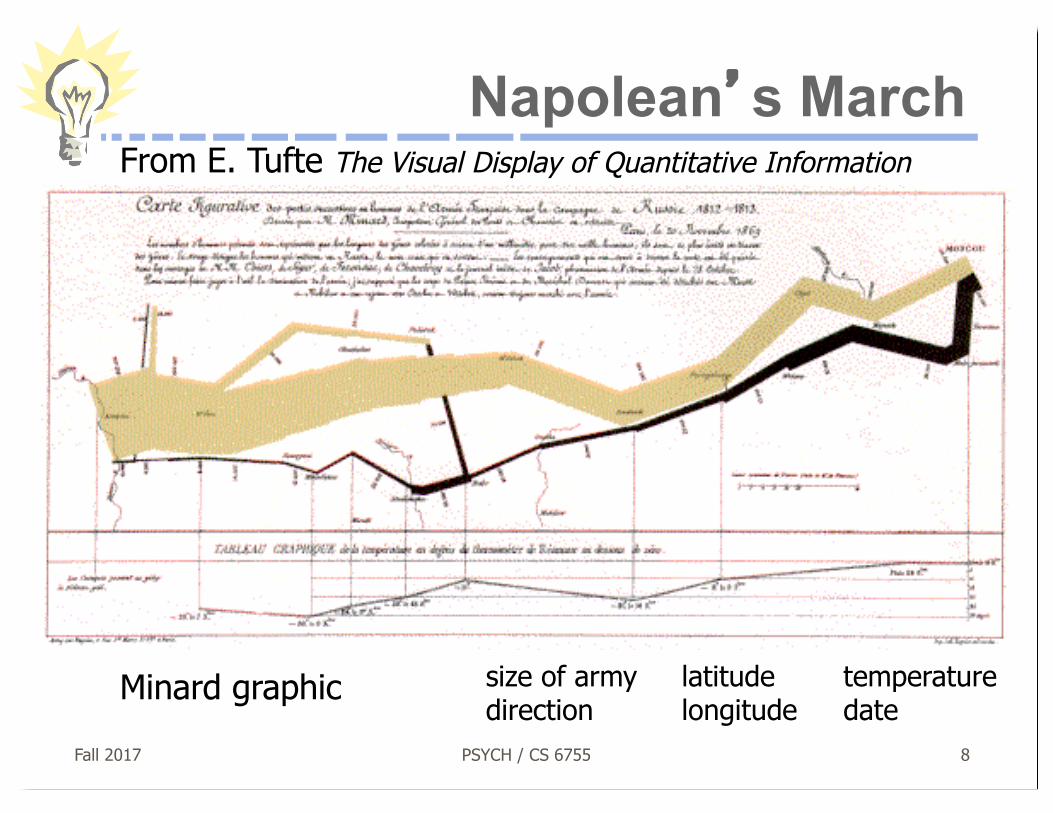
Napolean’s March
size of armydirection
latitudelongitude
temperaturedate
From E. Tufte The Visual Display of Quantitative Information
Minard graphic

Fall 2017 PSYCH / CS 6755 9
Information Visualization
ØWhat is “Information”?v Items, entities, things which do not have a
direct physical correspondencev Notion of abstractness of the entities is
important too

Fall 2017 PSYCH / CS 6755 10
Information Visualization
ØWhat is “visualization”?v The use of computer-supported, interactive
visual representations of data to amplify cognition.
• From [Card, Mackinlay Shneiderman ‘98]

Fall 2017 PSYCH / CS 6755 11
Information Visualization
ØEssence:v Taking items without a physical
correspondence and mapping them to a 2-D or 3-D physical space.
v Giving information a visual representation that is useful for analysis and decision-making

Fall 2017 PSYCH / CS 6755 12
Main Idea
Ø“The purpose of visualization is insight, not pictures”
ØVisuals help us thinkv External cognition v Provide a frame of reference, a temporary
storage area
Fall 2017 PSYCH / CS 6755 13
Domains for Info Vis
ØTextØStatisticsØFinancial/business dataØInternet informationØSoftwareØ...

Fall 2017 PSYCH / CS 6755 14
Components of Study
ØData analysisv Data items with attributes or variablesv Generate data tables
ØVisual structuresv Spatial substrate, marks, graphical properties
of marksØUI and interactionØAnalytic tasks to be performed

Fall 2017 PSYCH / CS 6755 15
Tasks in Info Vis 1ØSearch
v Finding a specific piece of information• How many games did the Braves win in 1995?• What novels did Ian Fleming author?
ØBrowsev Look over or inspect something in a more
casual manner, seek interesting information• Learn about crystallography• What has Jane been up to lately?
Fall 2017 PSYCH / CS 6755 16
Tasks in Info Vis 2
ØAnalysisv Comparison-Differencev Outliers, Extremesv Patterns
ØAssimilateØCategorizeØLocate

Fall 2017 PSYCH / CS 6755 17
Tasks in Info Vis 3
ØIdentifyØRankØAssociateØRevealØMonitorØMaintain awarenessØ...
Fall 2017 PSYCH / CS 6755 18
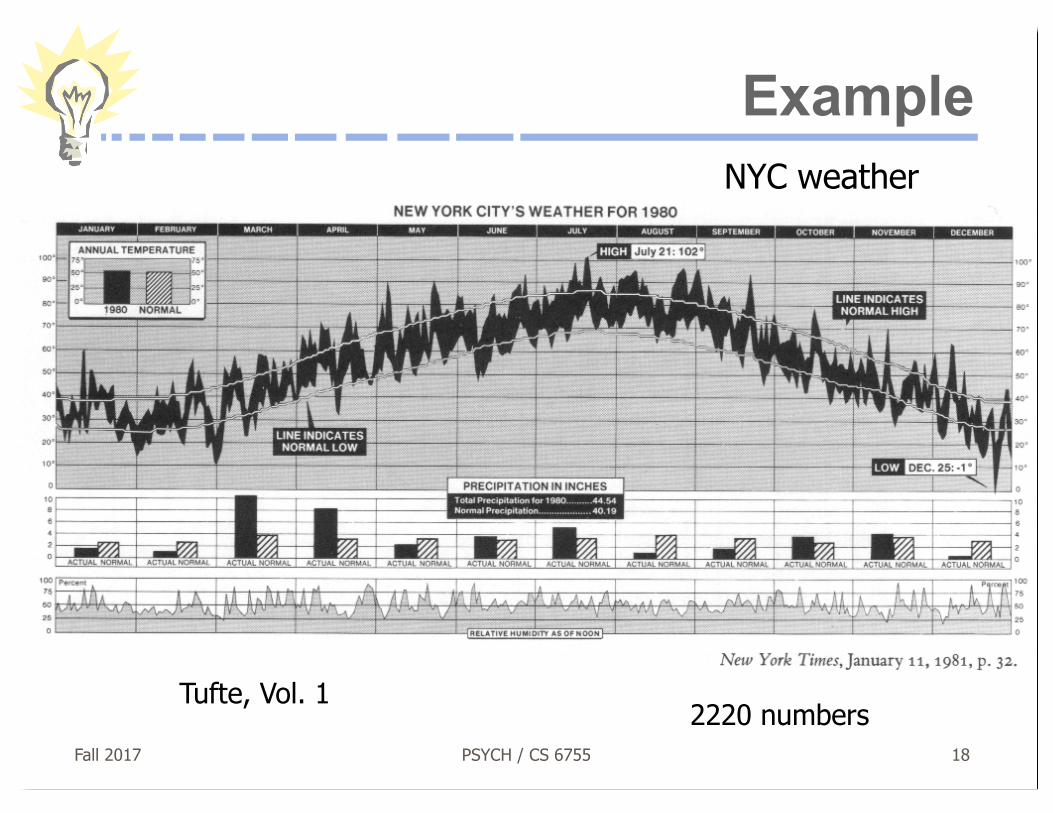
ExampleNYC weather
2220 numbersTufte, Vol. 1
Fall 2017 PSYCH / CS 6755 19
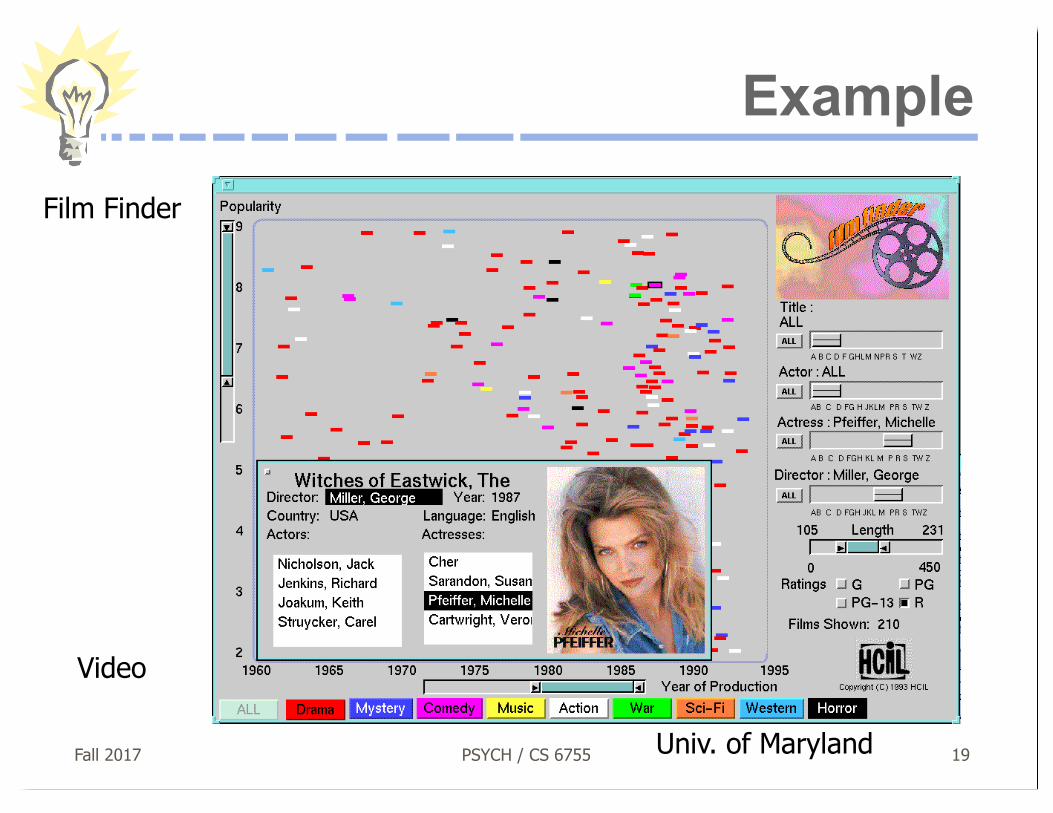
Example
Univ. of Maryland
Film Finder
Video
Fall 2017 PSYCH / CS 6755 20
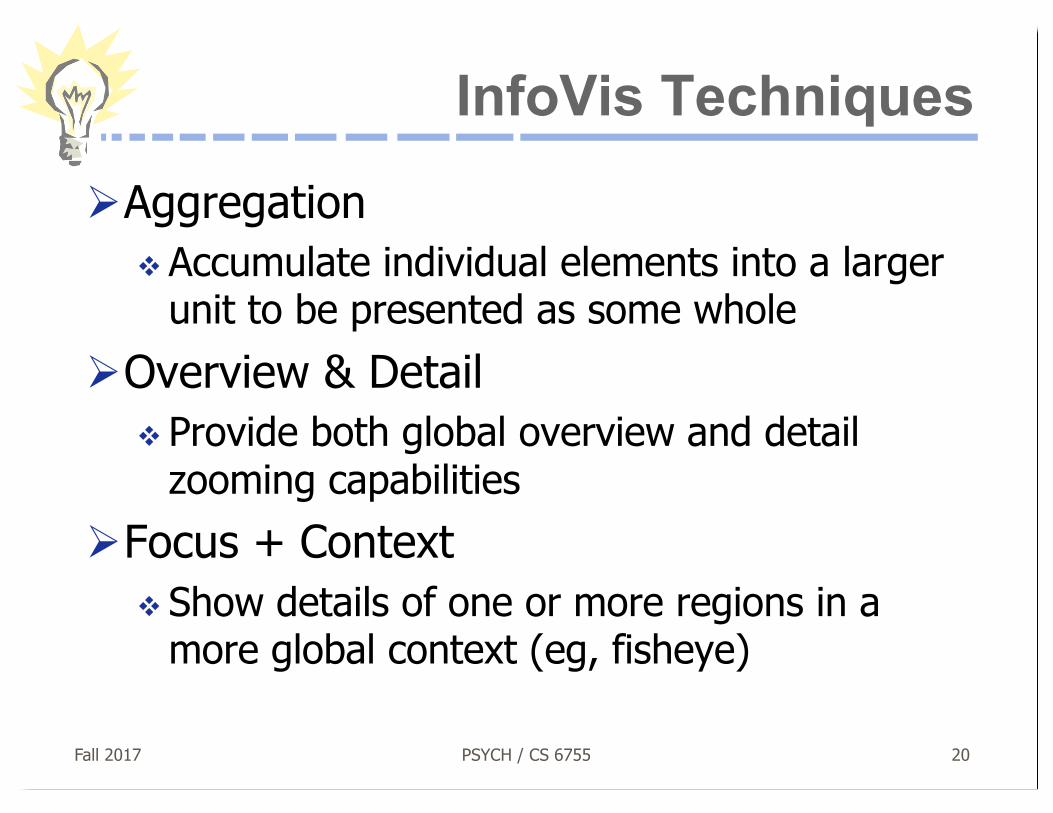
InfoVis Techniques
ØAggregationv Accumulate individual elements into a larger
unit to be presented as some wholeØOverview & Detail
v Provide both global overview and detail zooming capabilities
ØFocus + Contextv Show details of one or more regions in a
more global context (eg, fisheye)

Fall 2017 PSYCH / CS 6755 21
InfoVis Techniques
ØDrill-downv Select individual item or smaller set of items
from a display for a more detailed view/analysis
ØBrushingv Select or designate/specify value, then see
pertinent items elsewhere on the display
Fall 2017 PSYCH / CS 6755 22
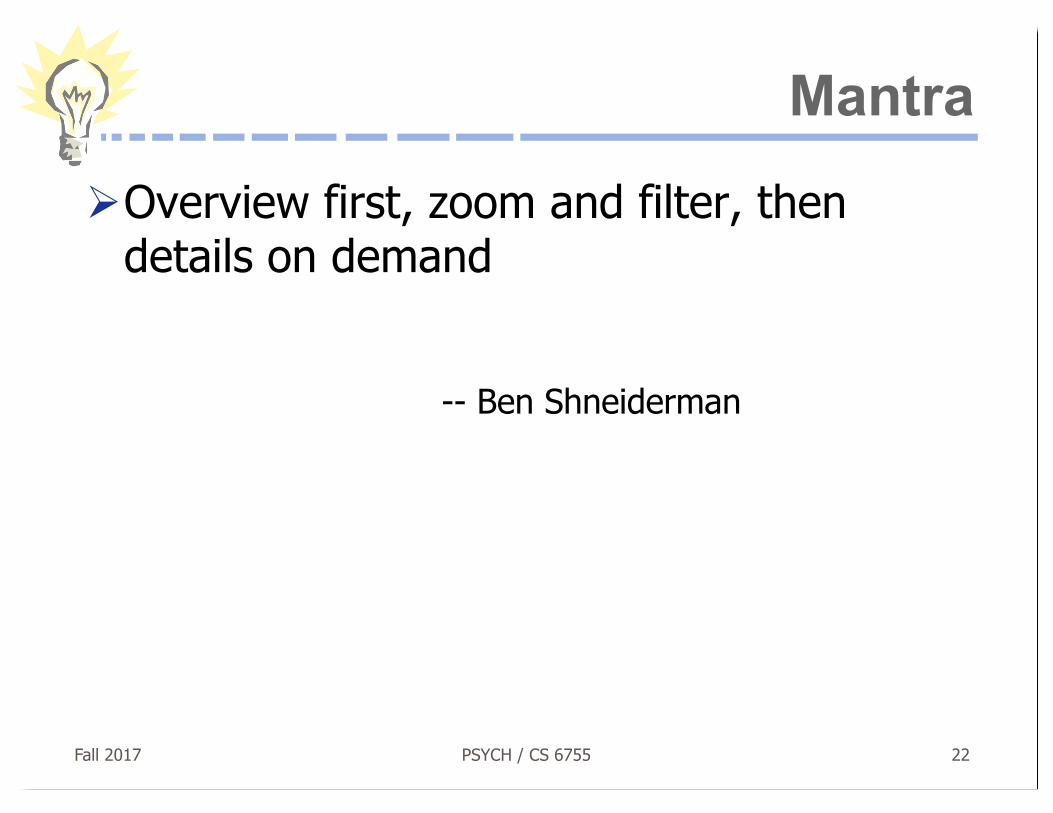
Mantra
ØOverview first, zoom and filter, then details on demand
-- Ben Shneiderman
Fall 2017 PSYCH / CS 6755 23
Issues
ØGraphic designv Extremely important in information
visualizationv Should reveal data and relationships, not
obscure themv Tufte books provide many guidelines
Fall 2017 PSYCH / CS 6755 24
Issues
ØScalabilityv Presentation of information becomes really
interesting as the size of the data growsv Run out of pixels at some pointv Requires aggregation, navigation, …

Fall 2017 PSYCH / CS 6755 25
Issues
ØInteractionv Computer provides interactive capability that
we do not have in printed pagev Often, must navigate and examine different
views of data to gain insight

Fall 2017 PSYCH / CS 6755 26
More Exampleshttp://www.smartmoney.com/marketmap
Demo

Fall 2017 PSYCH / CS 6755 27
More ExamplesData Mountain
Microsoft Research
Video
Fall 2017 PSYCH / CS 6755 28
Visualizing Hierarchies
ØVariety of techniquesv Traditional tree views, alternatives, space-
filling views
Fall 2017 PSYCH / CS 6755 29
Hierarchies
ØDefinitionv Ordering of items in which particular items
are parents or ancestors of others
ØExample: File Systemv Folders/Directories with
folders/subdirectories and files inside
Fall 2017 PSYCH / CS 6755 30
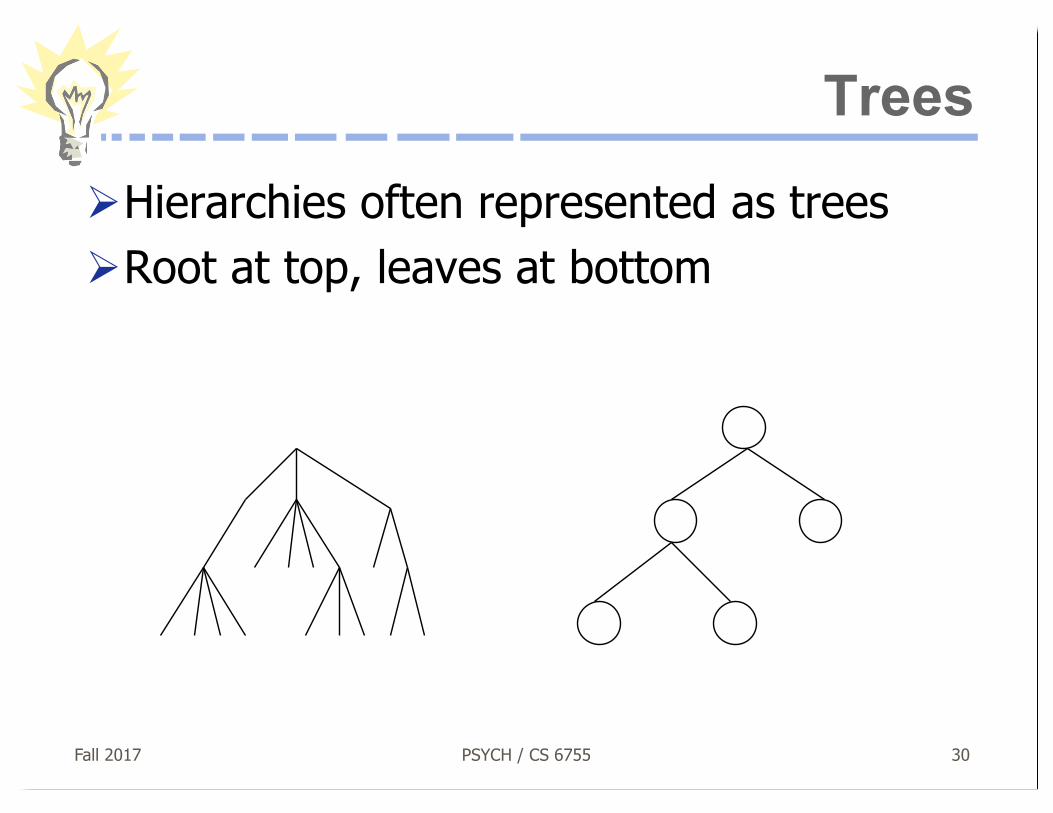
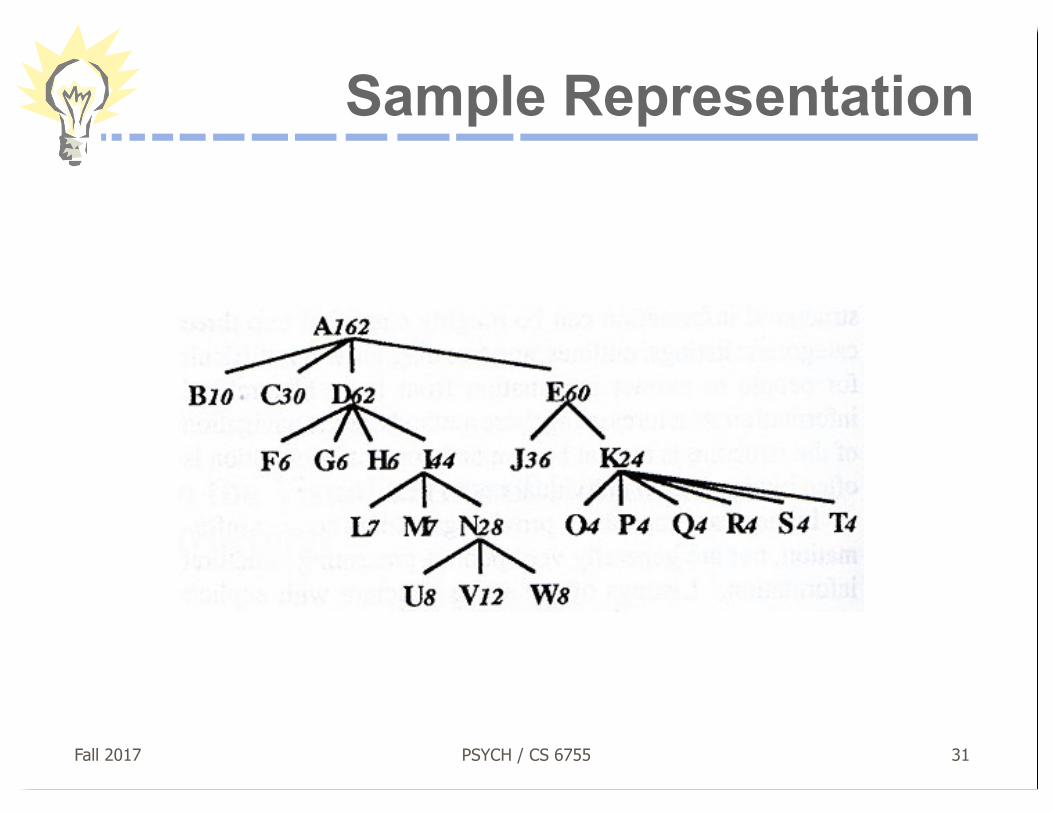
Trees
ØHierarchies often represented as treesØRoot at top, leaves at bottom
Fall 2017 PSYCH / CS 6755 31
Sample Representation

Fall 2017 PSYCH / CS 6755 32
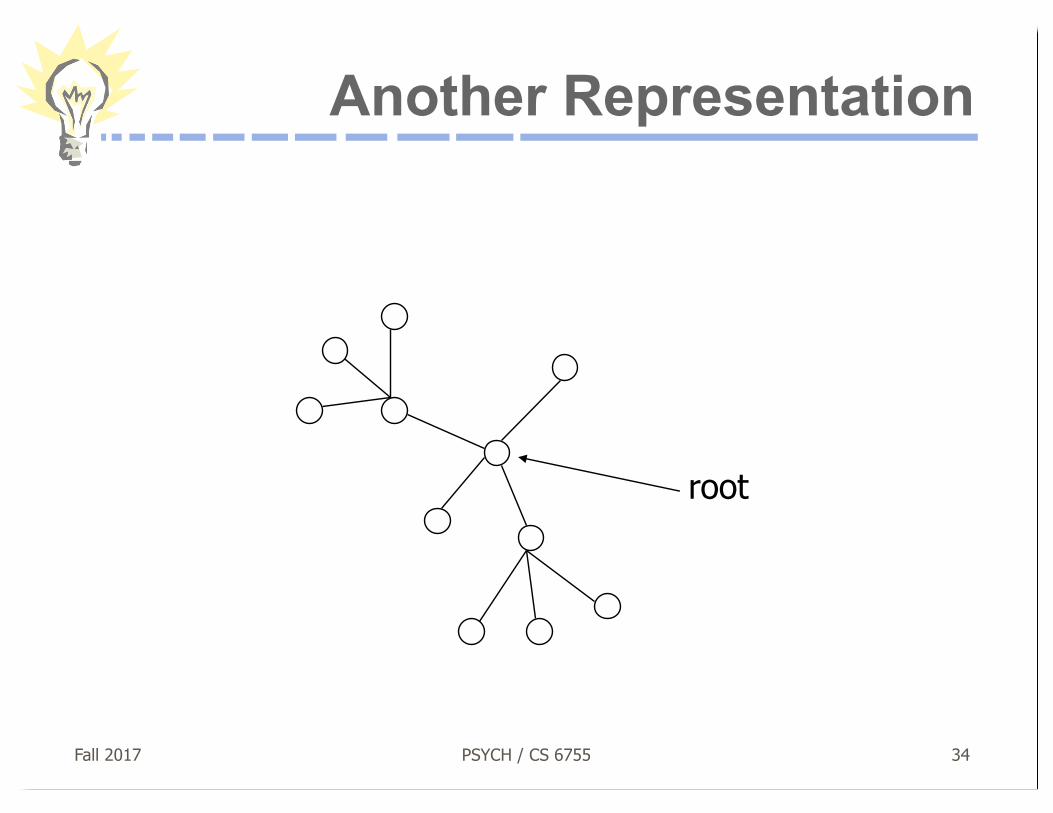
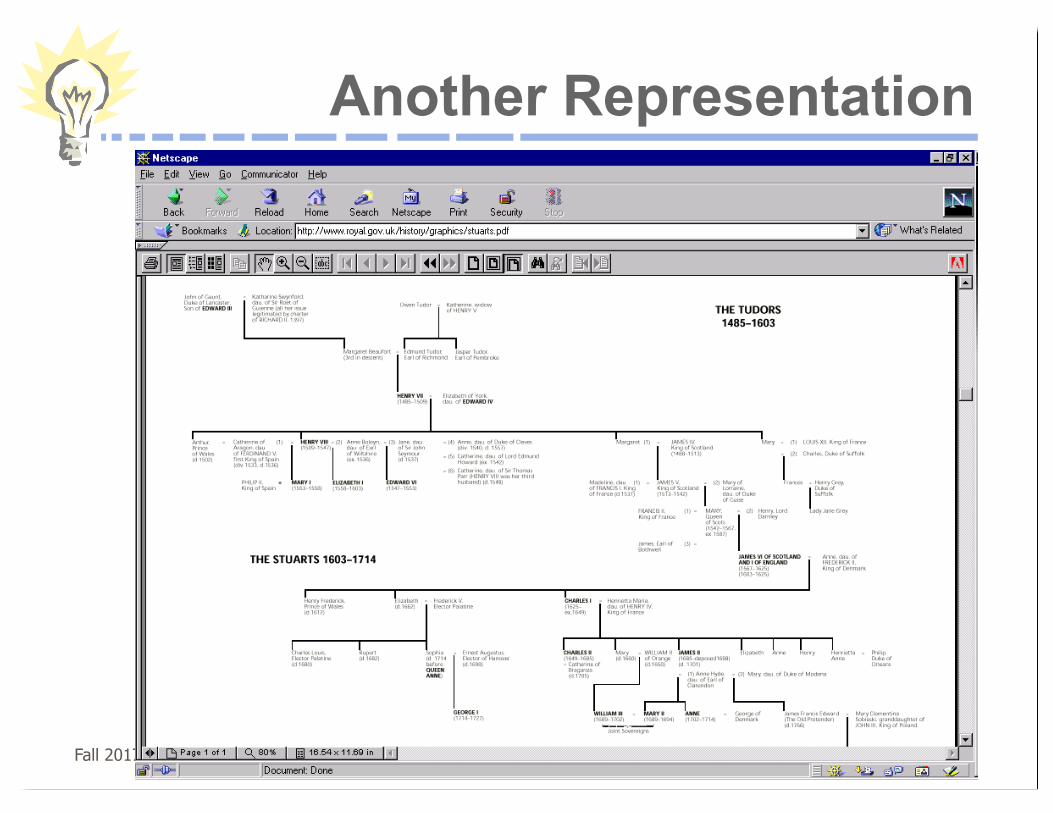
Another Representation

Fall 2017 PSYCH / CS 6755 33
Another Representation
Fall 2017 PSYCH / CS 6755 34
Another Representation
root
Fall 2017 PSYCH / CS 6755 35
Another Representation

Fall 2017 PSYCH / CS 6755 36
Potential Problems
ØWidth of fan-out uses real estatev Run out of room quickly

Fall 2017 PSYCH / CS 6755 37
Another Idea
CHEOPS
Beaudoin, Parent & Vroomen

Fall 2017 PSYCH / CS 6755 38
Another Idea
Card, Mackinlay & Robertson
ConeTree

Fall 2017 PSYCH / CS 6755 39
Another Idea
ØUse hyperbolic geometryØHyperbolic tree
ØHere: Site Lens fromwww.inxight.com
ØDemo
Lamping & Rao

Fall 2017 PSYCH / CS 6755 40
Space-Filling Representation
Each item occupies an area
Children are “contained” under parent

Fall 2017 PSYCH / CS 6755 41
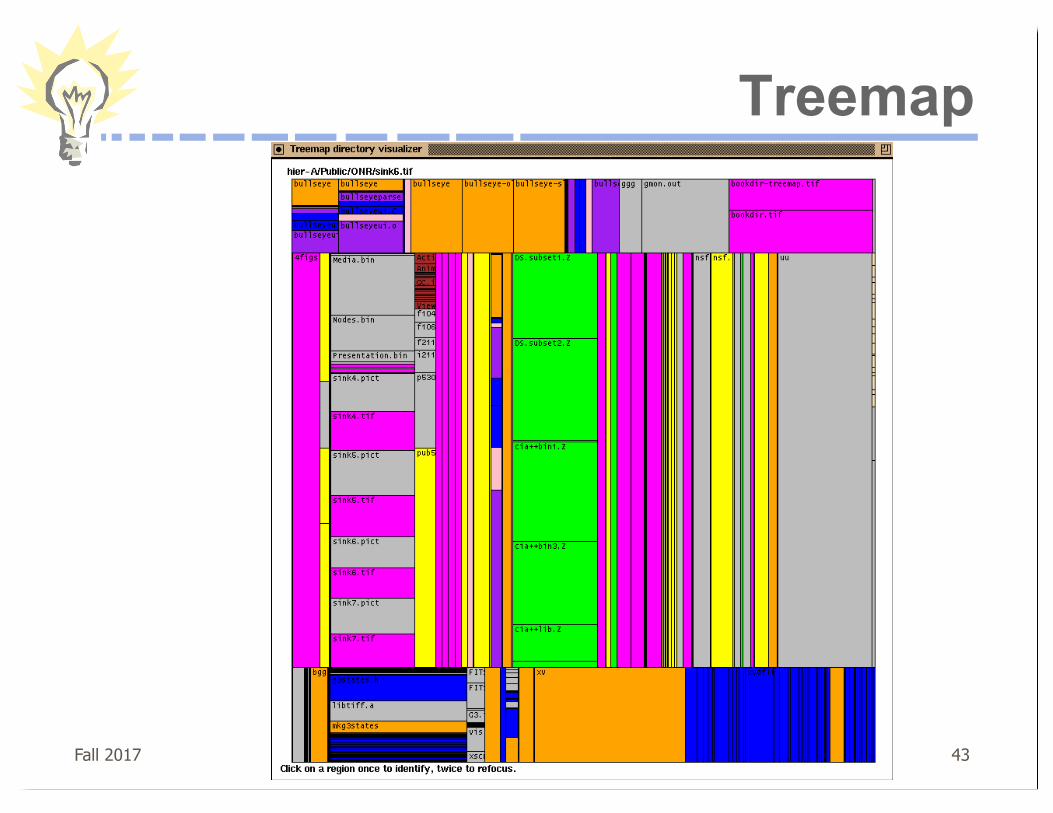
Treemap
ØSpace-filling representation developed by Shneiderman and Johnson
ØChildren are drawn inside their parentØAlternate horizontal and vertical slicing at
each successive level

Fall 2017 PSYCH / CS 6755 42
Treemap
File and directory visualizer
white-directoriescolor-files
level 1dirs
Fall 2017 PSYCH / CS 6755 43
Treemap

Fall 2017 PSYCH / CS 6755 44
Nested vs. Non-nested Treemaps
Nested Tree-Map Non-nested Tree-Map

Fall 2017 PSYCH / CS 6755 45
Treemap Affordances
ØGood representation of two attributes: color and area
ØNot as good at representing structurev What happens if it’s a perfectly balanced
tree of items all the same size?v Also can get long-thin aspect ratios
Fall 2017 PSYCH / CS 6755 46
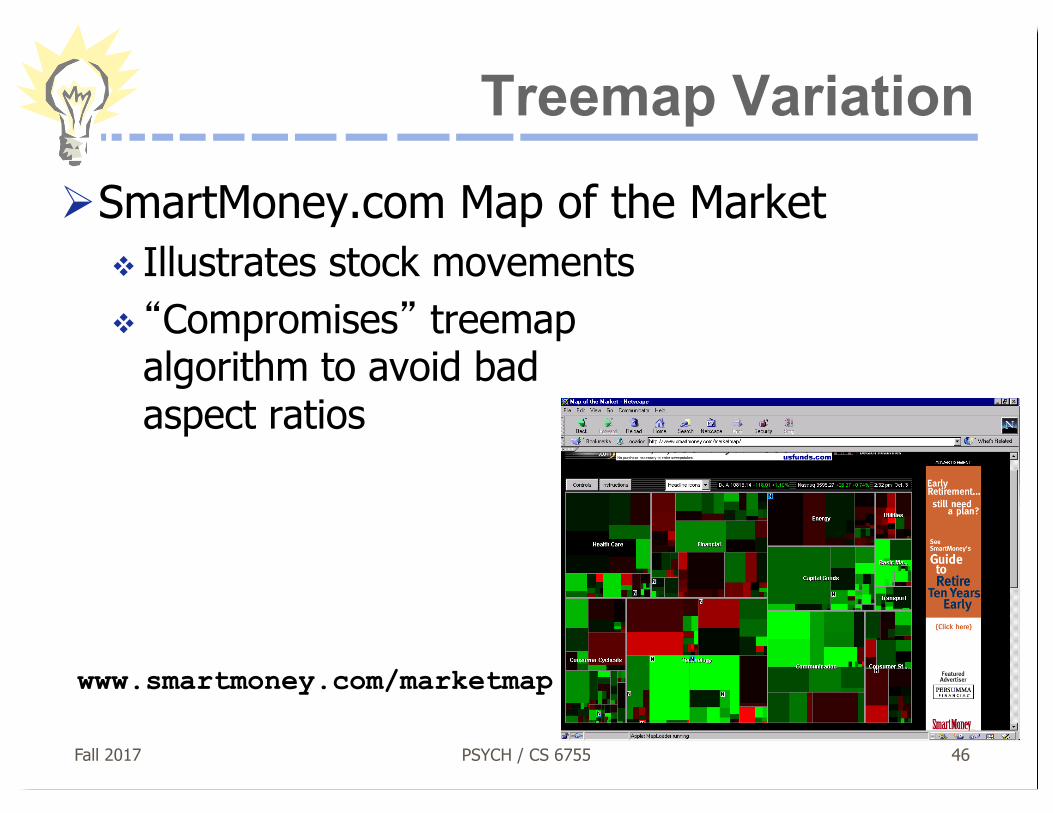
Treemap Variation
ØSmartMoney.com Map of the Marketv Illustrates stock movementsv “Compromises” treemap
algorithm to avoid badaspect ratios
www.smartmoney.com/marketmap

Fall 2017 PSYCH / CS 6755 47
Treemap Variation
ØUse 3Dshadingcues tohelpconveystructure
SequoiaViewfile viewer forWindows
Demo
Fall 2017 PSYCH / CS 6755 48
Another Technique
ØWhat if we used a radial rather than a rectangular space-filling technique?

Fall 2017 PSYCH / CS 6755 49
Sunburst
Visualizing fileand directorystructures
Root dir at centerColor - file typeAngle - file/dir size
Fall 2017 PSYCH / CS 6755 50
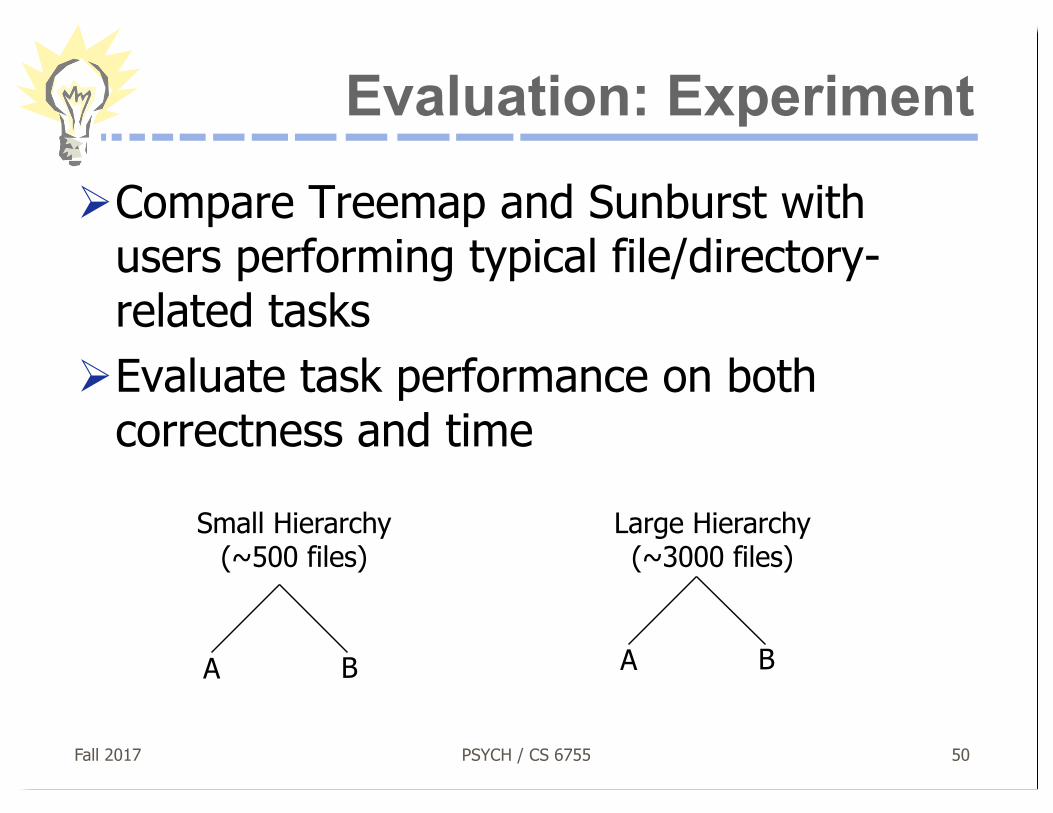
Evaluation: Experiment
ØCompare Treemap and Sunburst with users performing typical file/directory-related tasks
ØEvaluate task performance on both correctness and time
Small Hierarchy(~500 files)
Large Hierarchy(~3000 files)
A B A B
Fall 2017 PSYCH / CS 6755 51
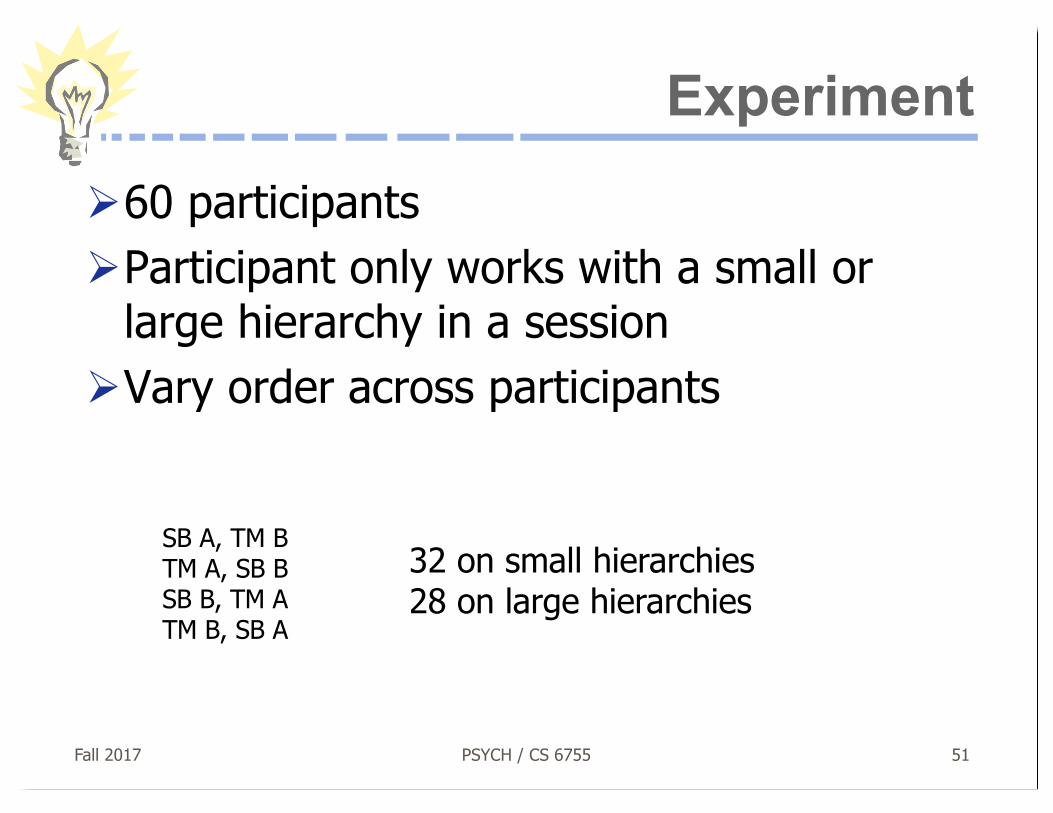
Experiment
Ø60 participantsØParticipant only works with a small or
large hierarchy in a sessionØVary order across participants
SB A, TM BTM A, SB BSB B, TM ATM B, SB A
32 on small hierarchies28 on large hierarchies

Fall 2017 PSYCH / CS 6755 52
Tasks• Identification (naming or pointing out) of a file based on size,
specifically, the largest and second largest files (Questions 1-2)• Identification of a directory based on size, specifically, the largest (Q3) • Location (pointing out) of a file, given the entire path and name (Q4-7) • Location of a file, given only the file name (Q8-9)• Identification of the deepest subdirectory (Q10)• Identification of a directory containing files of a particular type (Q11) • Identification of a file based on type and size, specifically, the largest
file of a particular type (Q12)• Comparison of two files by size (Q13)• Location of two duplicated directory structures (Q14)• Comparison of two directories by size (Q15)• Comparison of two directories by number of files contained (Q16)
Fall 2017 PSYCH / CS 6755 53
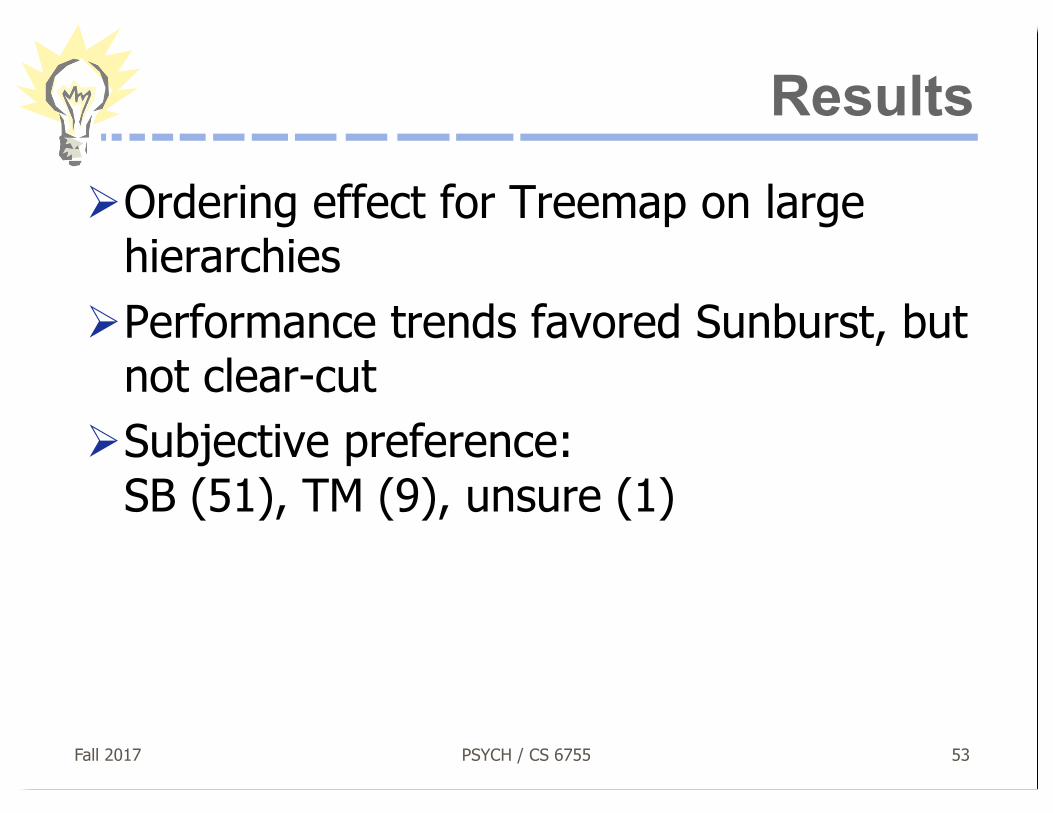
Results
ØOrdering effect for Treemap on large hierarchies
ØPerformance trends favored Sunburst, but not clear-cut
ØSubjective preference:SB (51), TM (9), unsure (1)
Fall 2017 PSYCH / CS 6755 54
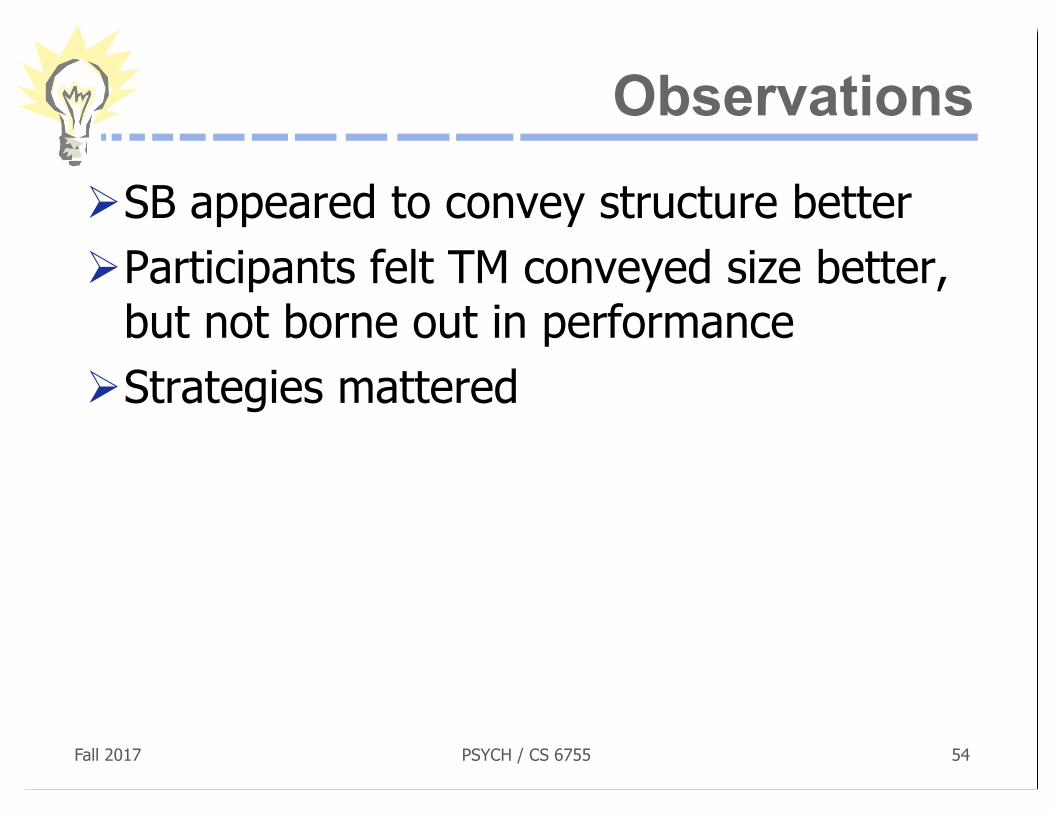
Observations
ØSB appeared to convey structure betterØParticipants felt TM conveyed size better,
but not borne out in performanceØStrategies mattered

Fall 2017 PSYCH / CS 6755 55
SunBurst Negative
ØIn large hierarchies, files at the periphery are usuallytiny and verydifficult todistinguish
examples

Fall 2017 PSYCH / CS 6755 56
Fix: ObjectivesØMake small slices
biggerØMaintain full circular
space-filling ideaØAllow detailed
examination of small files within context of entire hierarchy
ØDon’t alter ratios of sizes
ØAvoid use of multiple windows or lots of scrollbars
ØProvide an aesthetically pleasing interface in which it is easy to track changes in focus
Fall 2017 PSYCH / CS 6755 57
Stasko & ZhangProceedings of Information Visualization 2000,Oct. 2000, pp. 57-65.
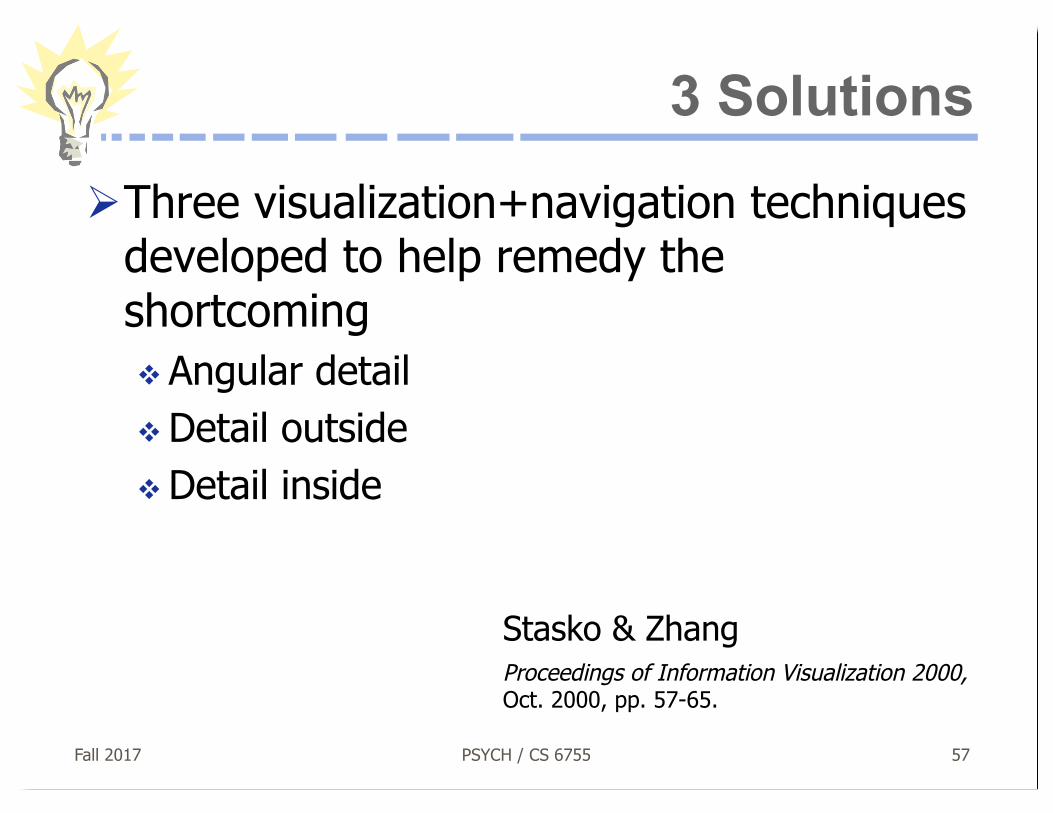
3 Solutions
ØThree visualization+navigation techniques developed to help remedy the shortcomingv Angular detailv Detail outsidev Detail inside

Fall 2017 PSYCH / CS 6755 58
Angular Detail
• Most “natural”• Least space-efficient• Most configurable by
user
Fall 2017 PSYCH / CS 6755 59
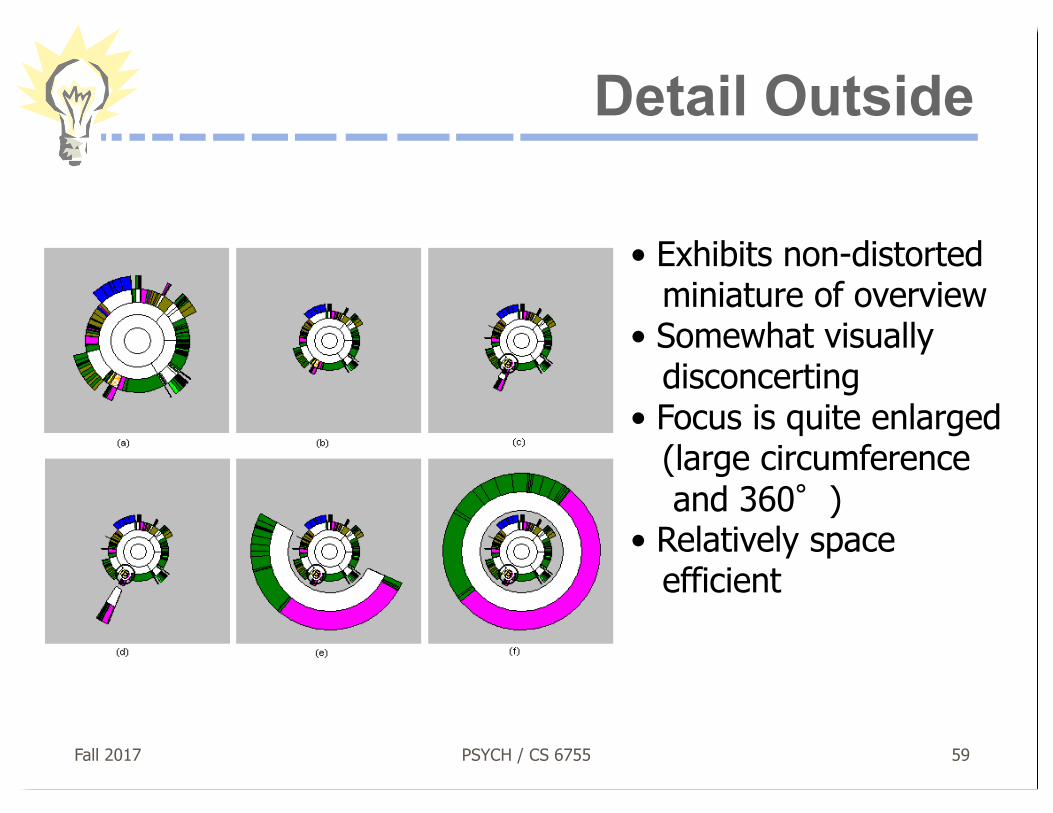
Detail Outside
• Exhibits non-distortedminiature of overview
• Somewhat visuallydisconcerting
• Focus is quite enlarged(large circumference and 360°)
• Relatively spaceefficient

Fall 2017 PSYCH / CS 6755 60
Detail Inside
• Perhaps least intuitiveand most distorting
• Items in overview aremore distinct (largercircumference)
• Interior 360° for focusis often sufficient
Fall 2017 PSYCH / CS 6755 61
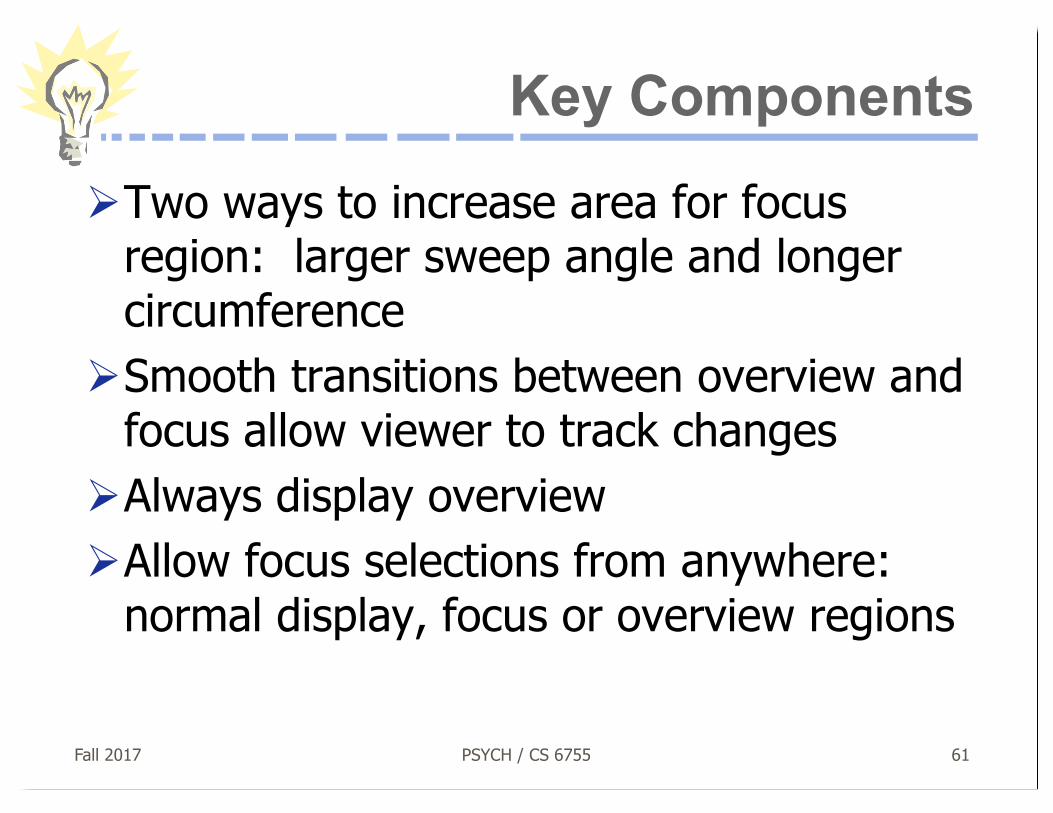
Key Components
ØTwo ways to increase area for focus region: larger sweep angle and longer circumference
ØSmooth transitions between overview and focus allow viewer to track changes
ØAlways display overviewØAllow focus selections from anywhere:
normal display, focus or overview regions
Fall 2017 PSYCH / CS 6755 62
Good ReferencesBooks
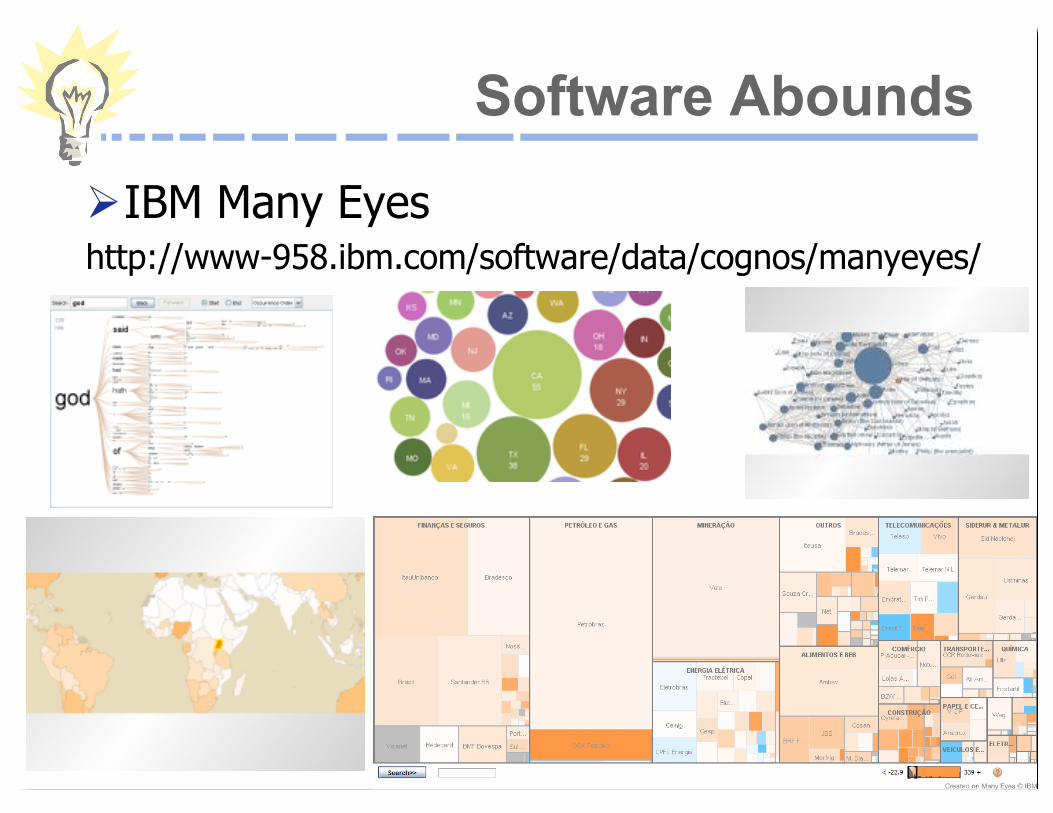
Software Abounds
Fall 2017 PSYCH / CS 6755 63
ØIBM Many Eyeshttp://www-958.ibm.com/software/data/cognos/manyeyes/
Fall 2017 PSYCH / CS 6755 64
Interested in more...Course
ØCS 7450ØJohn StaskoØCourse foci
v Look at research ideas v Work with commercial systemsv Assignments and term project


![Defining the EU [Uyumluluk Modu] - AB Bakanlığı · DEFINING THE EU AS A PECULIAR LEGAL ENTITY: ... ØWHAT ARE THE SPECIFIC FEATURES OF THE EU? ... legally binding instruments](https://static.fdocuments.us/doc/165x107/5ad5bfb17f8b9a075a8d4968/defining-the-eu-uyumluluk-modu-ab-bakanligi-the-eu-as-a-peculiar-legal-entity.jpg)
