INFORMATION TO USERS - Open...
122
Nurse case management and hospital length of stay Item Type text; Thesis-Reproduction (electronic) Authors Chapman, Evelyn A., 1929- Publisher The University of Arizona. Rights Copyright © is held by the author. Digital access to this material is made possible by the University Libraries, University of Arizona. Further transmission, reproduction or presentation (such as public display or performance) of protected items is prohibited except with permission of the author. Download date 14/07/2018 14:04:22 Link to Item http://hdl.handle.net/10150/291813
Transcript of INFORMATION TO USERS - Open...
Nurse case management and hospital length of stay
Item Type text; Thesis-Reproduction (electronic)
Authors Chapman, Evelyn A., 1929-
Publisher The University of Arizona.
Rights Copyright © is held by the author. Digital access to this materialis made possible by the University Libraries, University of Arizona.Further transmission, reproduction or presentation (such aspublic display or performance) of protected items is prohibitedexcept with permission of the author.
Download date 14/07/2018 14:04:22
Link to Item http://hdl.handle.net/10150/291813
INFORMATION TO USERS
The most advanced technology has been used to photograph and
reproduce this manuscript from the microfilm master. UMI films the
text directly from the original or copy submitted. Thus, some thesis and
dissertation copies are in typewriter face, while others may be from any
type of computer printer.
The quality of this reproduction is dependent upon the quality of the
copy submitted. Broken or indistinct print, colored or poor quality
illustrations and photographs, print bleedthrough, substandard margins,
and improper alignment can adversely affect reproduction.
In the unlikely event that the author did not send UMI a complete
manuscript and there are missing pages, these will be noted. Also, if
unauthorized copyright material had to be removed, a note will indicate
the deletion.
Oversize materials (e.g., maps, drawings, charts) are reproduced by
sectioning the original, beginning at the upper left-hand corner and
continuing from left to right in equal sections with small overlaps. Each
original is also photographed in one exposure and is included in
reduced form at the back of the book.
Photographs included in the original manuscript have been reproduced
xerographically in this copy. Higher quality 6" x 9" black and white
photographic prints are available for any photographs or illustrations
appearing in this copy for an additional charge. Contact UMI directly to order.
University Microfilms International A Bell & Howell Information Company
300 North Zeeb Road, Ann Arbor, Ml 48106-1346 USA 313/761-4700 800/521-0600

Order Number 1341266
Nurse case management and hospital length of stay
Chapman, Evelyn Alice, M.S.
The University of Arizona, 1990
U M I 300 N. Zeeb Rd. Ann Arbor, MI 48106

NURSE CASE MANAGEMENT AND HOSPITAL LENGTH OF STAY
by
EVELYN AUCE CHAPMAN
A Thesis Submitted to the Faculty of the
COLLEGE OF NURSING
in Partial Fulfillment of the Requirements For the Degree of
MASTER OF SCIENCE
In the Graduate College
THE UNIVERSITY OF ARIZONA
1990
2
STATEMENT BY AUTHOR
This thesis has been submitted in partial fulfillment of requirements for an advanced degree at the University of Arizona and is deposited in the University Library to be made available to borrowers under rules of the library.
Brief quotations from this thesis are allowable without special permission, provided that accurate acknowledgement of source is made. Requests for permission for extended quotation from or reproduction of this manuscript in whole or in part may be granted by the head of the major department or the Dean of the Graduate College when in his or her judgement the proposed use of the material is in the interests of scholarship. In all other instances, however, permission may be obtained from the author.
SIGNED:
APPROVAL BY THESIS DIRECTOR
This thesis has been approved on the date shown below.
(A, Jovjzfe AT Verran, RN, PhD, FAAN Associate Professor College of Nursing
f
DEDICATION
This work is dedicated to my daughter, Lynn. Her special understanding, as a daughter, regarding the quest for continued learning and her constant willingness to share her expert systems and computer skills have helped make this endeavor possible.
ACKNOWLEDGEMENTS
4
I wish to express my appreciation to the following individuals for their assistance and support.
To the members of my thesis committee: Dr. Joyce Verran, Dr. Linda Phillips, Dr. Rose Gerber, and Dr. Gerri Lamb, my community representative, for their expert help and advice. A special thanks to my chair, Dr. Joyce Verran.
To Phyllis Ethridge, R.N., Vice President for Patient Care Services and numerous other staff at the study institution, who are continuously supportive and helpful.
Finally, to my husband, Bill, for his continuous patience and understanding.

TABLE OF CONTENTS
5
Page
LIST OF ILLUSTRATIONS 7
LIST OF TABLES 8
ABSTRACT 10
1. OVERVIEW OF THE PROBLEM 11 Statement of the Problem 13 Significance of the Problem 15 Purpose 16 Summary 17
2. CONCEPTUAL FRAMEWORK AND LITERATURE REVIEW 19 Conceptual Framework 19
Constructs 21 Nurse Case Management 21 Undesirable Patient Outcomes 22
Concepts 23 Duration of Nurse Case Management 23 Intensity of Nurse Case Management . . . 23 Hospitalization 23
Operational Indicators 24 Number of Weeks of NCM 24 Number of Contacts of NCM 24 Length of Stay 24
Review of the Literature 24 Nurse Case Management 24 Length of Stay 28 Studies of NCM and LOS 32 Studies of LOS and Non-NCM 34
Summary 35
3. METHODOLOGY OF THE STUDY 37 Design And Setting 37 The Sample 38 Protection of Human Subjects 41 Measurement Instruments 41
Number of Weeks of NCM 41 Number of Contacts by the Professional Nurse Case Manager 42 Number of Patient Days 42
6
Page
Data Form 43 Data Collection Procedure 44 Data Analysis Plan 45 Summary 46
4. PRESENTATION OF THE DATA 47 Description of the Sample 47 Description of the Variables 71 Findings and Discussion Based on the Research Questions 77 Presentation and Discussion of Additional Findings 83 Summary 87
5. INTERPRETATIONS AND IMPLICATIONS 90 Interpretation of the Findings 90 Limitations of the Study 99 Implications for Nursing 100 Implications for Future Nursing Research 102 Summary 103
APPENDIX A: Human Subjects Approval 104 APPENDIX B: Study Agency Approval 106 APPENDIX C: Data Form 108 APPENDIX D: Case Mix Index of Subgroups within Total Group 110 APPENDIX E: Case Mix Index of Subgroups within Respiratory MDC 112 APPENDIX F: Case Mix Index of Groups within the Circulatory MDC 113
LIST OF REFERENCES 114
7
UST OF ILLUSTRATIONS
Figure Page
1 Conceptual Framework: Nurse Case Management and Hospital Length of Stay , 20
2 LOS and Number of NCM Contacts within Six Months 88

8
LIST OF TABLES
Table Page
1 Relationship of Variables to LOS . . 29
2 DRGs within the Respiratory System and the Circulatory MDCs 39
3 Distribution of DRGs by Frequency and Percent 48
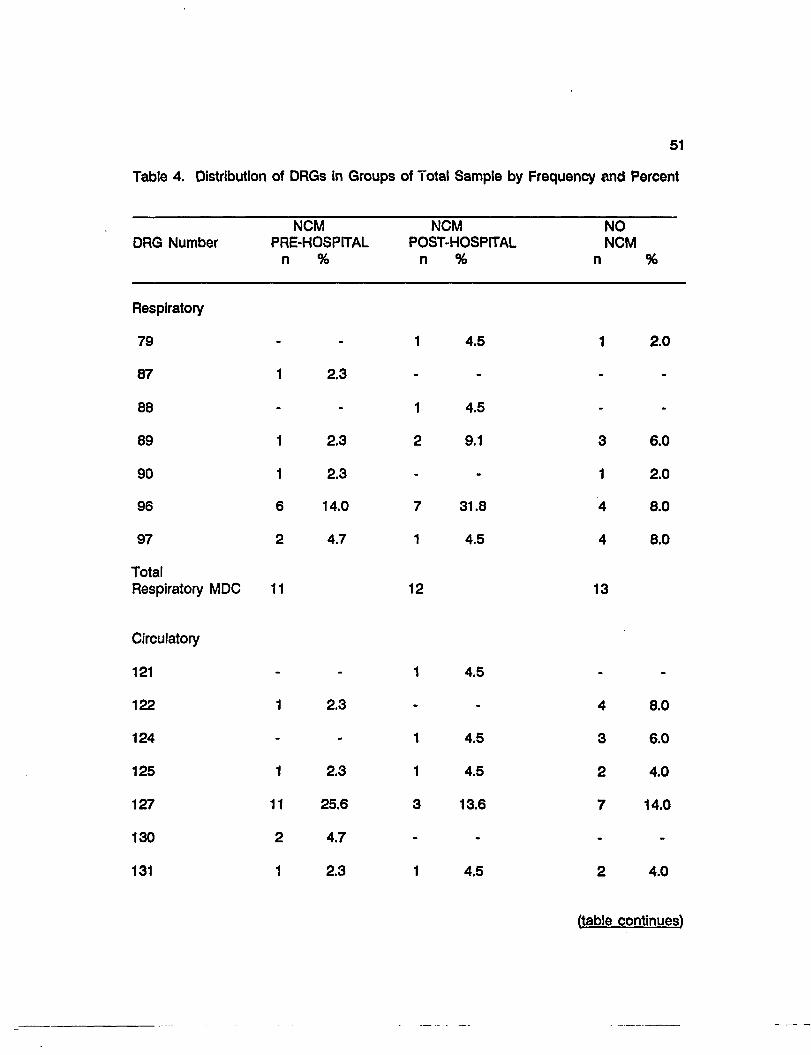
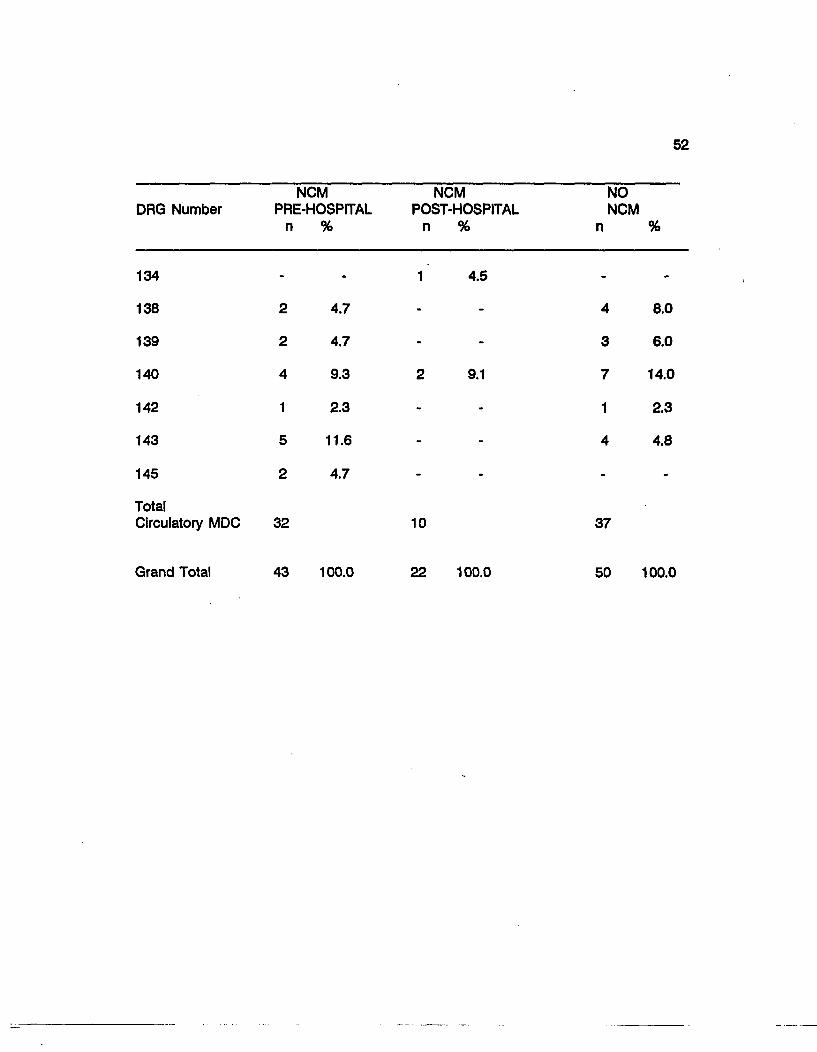
4 Distribution of DRGs in Groups of Total Sample by Frequency and Percent 51
5 Age of Total Sample, Groups, MDCs, and MDC Subgroups 53
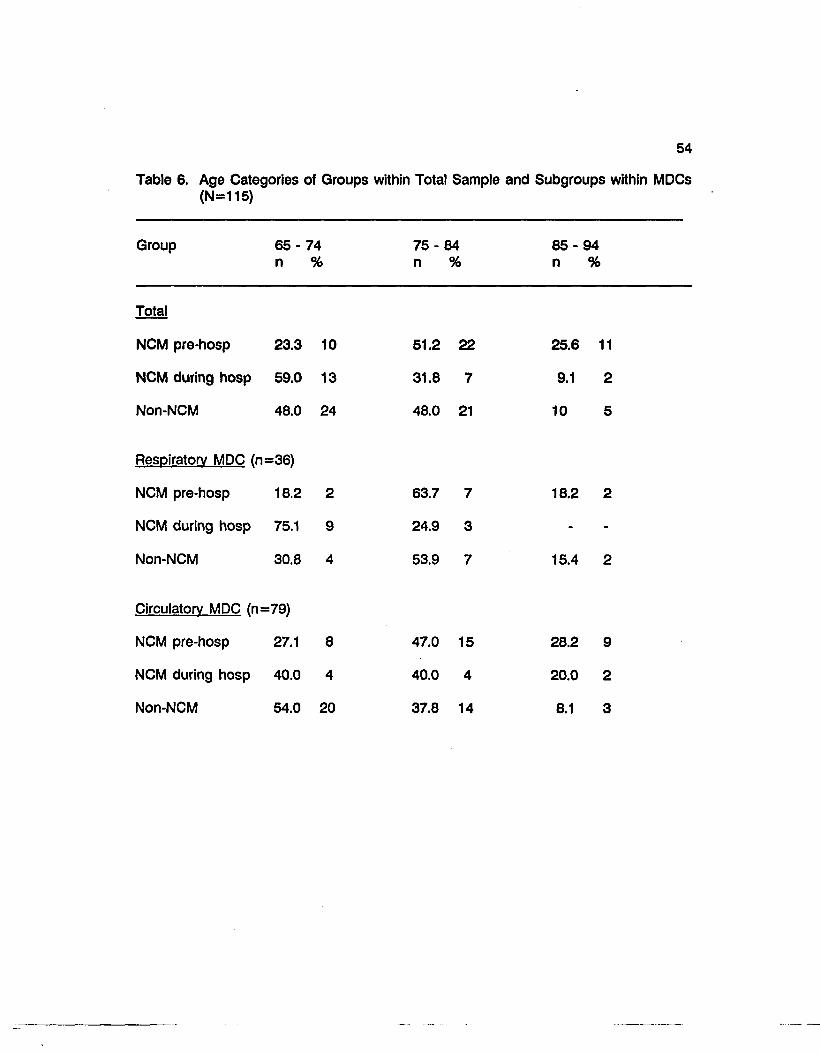
6 Age Categories of Groups within Total Group and Subgroups within MDCs . 54
7 Sex of Total Sample, Groups, MDCs, and MDC Subgroups 56
8 Race of Total Sample, Groups, MDCs, and MDC Subgroups 57
9 Marital Status of Total Sample, Groups, MDCs, and MDC Subgroups 59
10 Living Situation of Total Sample, Groups, MDCs, and MDC Subgroups .... 60
11 Admission Acuity of Total Sample, Groups, MDCs, and MDC Subgroups 62
12 Levels of Admission Acuities of Total Sample, Groups, MDCs, and MDC Subgroups 63
13 Admission Via Emergency Department for Study's Hospitalization of Total Sample, Groups, MDCs, and MDC Subgroups 65
14 Admissions to Critical Care for Study's Hospitalization of Total Sample, Groups, MDCs, and MDC Subgroups 66
15 Number of Hospitalizations in the 60 Days Previous to Admission of Total Sample, Groups, MDCs, and MDC Subgroups 68
16 Number of Hospitalizations Admitted Via Emergency Department 60 Days Previous to Admission of Total Sample, Groups, MDCs, and MDC Subgroups 70

Table
9
Page
17 Number of Emergency Department Visits in Previous 60 Days of Admission of Total Sample, Groups, MDCs, and MDC Subgroups 72
18 Number of Weeks of NCM Previous to Hospitalization of Total Sample and MDCs 73
19 Number of NCM Contacts Previous to Hospitalization of Total Sample and MDCs 75
20 Length of Stay and Deviation from HCFA LOS of Total Sample, Groups, MDCs, and MDC Subgroups 76
21 Analysis of Variance of LOS and the Groups within Total Sample and Subgroups within MDCs 78
22 Correlation Between LOS and Number of NCM Contacts Pre-hospitalization 79
23 Correlation Between LOS and Number of Weeks of NCM Pre-hospitalization 81
24 Multiple Regression Analysis: Variables 82
25 Analysis of Variance: DLOS 85
ABSTRACT
10
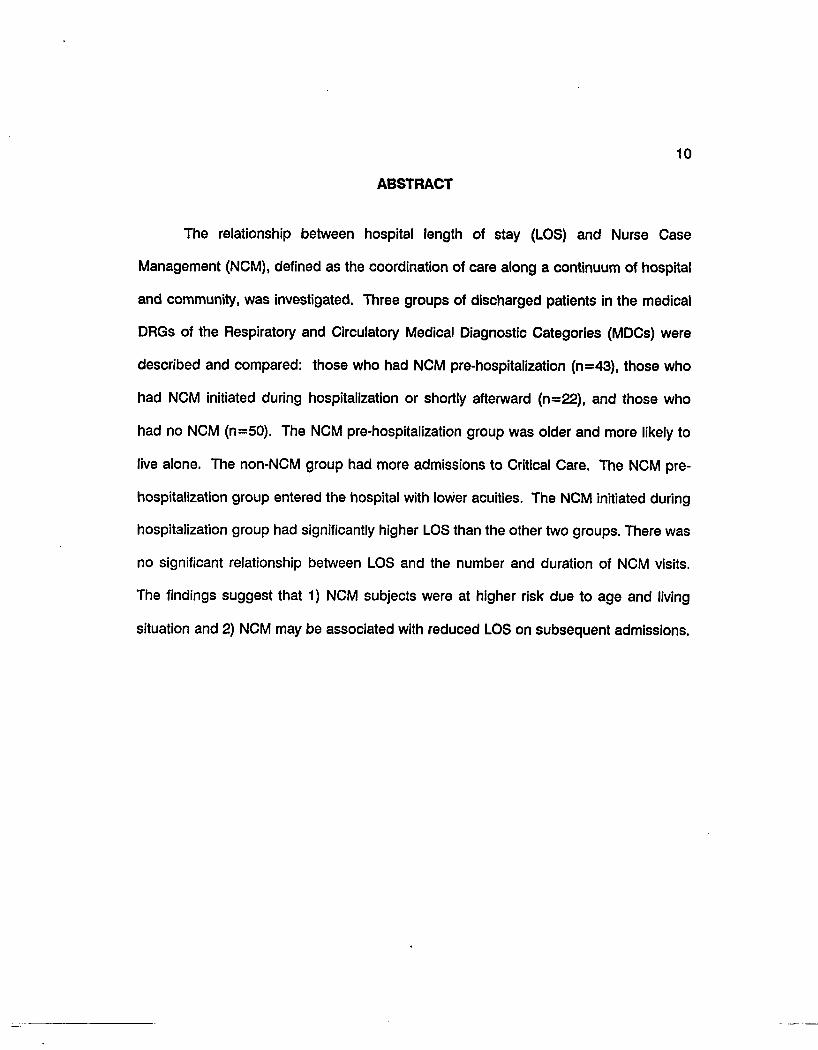
The relationship between hospital length of stay (LOS) and Nurse Case
Management (NCM), defined as the coordination of care along a continuum of hospital
and community, was investigated. Three groups of discharged patients in the medical
DRGs of the Respiratory and Circulatory Medical Diagnostic Categories (MDCs) were
described and compared: those who had NCM pre-hospitalization (n=43), those who
had NCM initiated during hospitalization or shortly afterward (n=22), and those who
had no NCM (n=50). The NCM pre-hospitalization group was older and more likely to
live alone. The non-NCM group had more admissions to Critical Care. The NCM pre-
hospitalization group entered the hospital with lower acuities. The NCM initiated during
hospitalization group had significantly higher LOS than the other two groups. There was
no significant relationship between LOS and the number and duration of NCM visits.
The findings suggest that 1) NCM subjects were at higher risk due to age and living
situation and 2) NCM may be associated with reduced LOS on subsequent admissions.
11
CHAPTER ONE
OVERVIEW OF THE PROBLEM
This study focused on Nurse Case Management (NCM) and its relationship with
the hospital length of stay (LOS) of Medicare patients in the medical Diagnostic Related
Groups (DRGs) within two Medical Diagnostic Categories (MDCs), the Respiratory
System and the Circulatory System. Length of stay is a major factor contributing to the
cost of a hospitalization.
The Medicare Prospective Payment System (PPS) and DRGs, which were created
by Congress in 1983 for reimbursing hospitals for health services for the elderly, have
resulted in reduced reimbursement to hospitals. Under PPS, the Health Care Financing
Administration (HCFA) reimburses hospitals based on predetermined rates as opposed
to the cost based retroactive reimbursement used in the past. The newer
predetermined rates are set using national average costs of DRGs. The Medicare
payment is determined by the patients' DRG classification regardless of their length of
stay or resource consumption (Shaffer, 1983, Hines, 1988). Because of lower payments
by Medicare and spiraling health care costs, hospitals across the United States are
struggling financially for their survival, since 'the difference between reimbursement and
actual cost of hospitalization becomes the hospital's profit or loss" (Marchette &
Holloman, 1986, p.12).
There are multiple factors which may affect the actual cost of a hospitalization,
some of which are physician referral patterns, severity of illness, inefficiencies of the
system, resource consumption, and length of stay (LOS). According to Carolyne Davis,

12
former Administrator of the Health Care Financing Administration, 'Ihe success of any
hospital under the DRG, requires cutting the length of stay of Medicare patients" (Lee,
1984, p.71). For the purpose of this study, LOS is the factor being studied but with the
acknowledgement that other factors also may have an impact on the cost of
hospitalization.
To increase cost effectiveness, nursing administrators are searching for and, in
turn, attempting to implement strategies which may decrease patients' in-hospital LOS
while providing quality of patient care. One of these strategies has been the
development of the nurse case manager role. In this study, NCM is defined as a
system of nursing care that emphasizes planning, coordination, and evaluation of
services. Care is provided to clients along a continuum of services which includes the
acute care setting and the community (Lamb, 1988). Nurse case management (NCM)
and the LOS of Medicare patients, 65 years of age and above, who had been
categorized within medical DRGs of two high volume Medical Diagnostic Categories
were examined. MDCs and DRGs represent "a classification system in which patients
are assigned to groups based on some common characteristics and then to subgroups
distinguished by variations in the major organizing principle" (Joel, 1984, p.42). Medical
Diagnostic Category refers to the anatomical body systems affected most by the
disease process; DRG assignment is affected by principal diagnosis, secondary
diagnoses, procedure, age, and discharge disposition (American Hospital Association,
1983). There are currently 23 Major Diagnostic Categories (MDCs) with 477
subcategories or DRGs. In this study, the patients who had NCM previous to their
13
admission were compared with corresponding patients who had NCM initiated during
the hospitalization or up to 10 days afterward, and those who had no NCM.
Statement of the Problem
Today, 50-60 percent of many communities' acute care hospitals are filled with
the elderly. The elderly population in the United States has been increasing
dramatically. In 1940 the 65 and over group was 6.9 percent of the population; in 1980
it was 11.3 percent; and it is projected that by 2000 it will be 13.1 percent. Because
of the tremendous breakthrough in diagnostic medicine, antibiotics, and immunizations,
infectious diseases have been nearly eliminated. Control in infectious diseases has
resulted in increased life expectancy and a population of elderly with chronic, disabling
diseases.
This "graying" of America has made a tremendous impact on the health care
system (Brotman, 1982). Previous studies of acute care hospitalizations have found
that high-cost users of medical care are more likely to be persons with chronic medical
problems (Schroeder, Showstack, & Roberts, 1979). This high-cost group has been
found to have a large proportion of persons over 65 years of age (Zook & Moore,
1980). Cost containment may be facilitated by using available resources in "more
intensive, but less expensive, ambulatory care to reduce some of the morbidity resulting
in nonelective hospital readmissions" (Smith, Roberts, & Gross, 1981, p.21).
Nurse Case Management is one method to provide more intensive, less
expensive care. There are two basic models of NCM: the acute care model and NCM
along a continuum of hospital to community. In this study, the case manager is
14
associated with Carondelet St. Mary's Hospital's model where the nurse case manager
provides care along the continuum of service including the acute care setting, the
community, and the home environment. Since this model of NCM Is a unique one,
there is a dearth of literature relating to the model. Additional systematic research is
necessary to document the effectiveness of this model of NCM. To meet this need, the
identification, description, and analysis of the intensity (number of contacts) and
duration (number of weeks) of NCM and the LOS of two high volume MDCs and their
medical DRGs were examined. Comparison was then made among the LOSs of those
patients who had NCM previous to the hospitalization, those patients who had NCM
initiated during the hospitalization or up to 10 days afterward, and those who had no
NCM. Potential primary predictors of increased length of stay were also examined.
Nurse Case Management System
A brief description of the NCM system under study follows. The nurse case
manager provides continuous monitoring and assessment of the patient in the
community, and coordinates necessary services. During the hospital stay, the nurse
case manager collaborates with the primary nurse and other members of the
interdisciplinary team in the establishment of the nursing care plan. She/he coordinates
sen/ices and, if the patient had NCM previous to hospitalization, shares possible
precipitating factors which may have been associated with the patient's need for
hospitalization. When the patient is admitted to NCM during the hospital stay, the
nurse case manager spends time developing a relationship with the patient and family
to establish an open, working relationship and collects comprehensive data to identify
15
with the patient and family current and potential problems, and to contribute to the plan
of care and to discharge planning. The goal is to keep the patient out of the hospital
or lessen the severity of illness and to shorten the LOS if readmission is necessary
(Ethridge & Rusch, 1989).
In contrast, NCM, associated with the New England Medical Center model, is
provided totally within the acute care setting except for telephone calls to the patient
pre- and post- hospitalization. The nurse case manager is the primary nurse
throughout the hospitalization and monitors the patient's progress using a critical path
(ANA, 1988). Critical paths are defined as "collaborative guidelines which time and
sequence the major interventions of nurses, physicians, and other key departments for
a particular case-type or condition" (Zander, 1989, p.1). They are used as
communication tools to identify "critical, or key incidents that must occur in a
predictable and timely order to achieve an appropriate LOS" (Zander, 1988, p.25). At
Hillcrest Medical Center in Tulsa, Oklahoma, a variation of the New England Model is
used. Emphasis is on the selection of patients' DRGs which are of high volume and
from which the hospital will have a financial benefit (McKenzie, Torkelson & Holt, 1989).
Significance of the Problem
A hospital is reimbursed a fixed amount for every patient in a particular DRG
regardless of the LOS or actual cost of treating the patient. If the cost of the patient's
hospitalization is less than that fixed amount reimbursed by Medicare, the hospital
profits, but if the cost is higher then the hospital must absorb the losses (Hines, 1988).
16
According to Ethridge (1988), "Nursing case management may have a substantial
impact on cost through reduction in length of stays and acuity levels" (p.7). Elderly
patients are often admitted to the hospital with high acuities which result in longer
LOSs. With NCM being available across the continuum of care, patients are being
monitored in the community and medical services are obtained as needed. The
question is, when nurse case managed patients need hospitalization, are their LOSs
shorter than those patients who have not had NCM? Strong (1986) showed that NCM
patients with chronic respiratory diseases entered the hospital with lower acuities and
had shorter lengths of stays than those who did not have NCM; the average LOS for
NCM patients was 3.5 patient days less than those with no NCM.
The NCM model provides an innovative strategy for professional nurses to be
the "brokers" of health care for high risk populations and individuals. It is the
opportunity for professional nurses to strengthen linkages to consumers and to increase
nursing's image as essential health care professionals while making a positive impact
on quality, cost, and access to care.
Purpose
The purpose of this study was to identify whether those Medicare patients, in
the medical DRGs of the high volume MDCs, who had NCM previous to the
hospitalization had a shorter hospital stay than those who did not. Three groups were
described and compared: 1) the patients who had NCM previous to the hospitalization,
2) the patients who had NCM initiated during the hospitalization or 10 days after
17
discharge, and 3) the patients who had no NCM at all. Specific research questions
addressed in this study were the following:
1. Is there a difference in the LOS of those Medicare patients, in selected
DRGs, who had a nurse case manager pre-hospitalization, those who
did not, and those who had NCM initiated during the hospitalization or
up to 10 days afterward?
2. Is there a relationship between LOS and the number of NCM contacts,
one month, two months, and six months pre-hospitalization, of patients
in selected DRGs?
3. Is there a relationship between LOS, of patients in selected DRGs and
the number of weeks of NCM, pre-hospitalization?
4. What are the primary prodictors of LOS of patients in the selected DRGs
of the three groups?
5. Is there a difference in the background characteristics of the three
groups?
Summary
The Medicare PPS and DRGs have resulted in reduced reimbursement to
hospitals and, with the exploding elderly population, are threatening the survival of
acute care hospitals. Factors identified which may affect the cost of hospitalization are
physician referral patterns, severity of illness, inefficiencies of the system and hospital
LOS. Hospital LOS is the factor being considered in this study. Nurse Case
Management was described as a strategy which has been developed by nursing
18
administrators to decrease hospital LOS. Two basic models of NCM were delineated:
the acute care model and NCM on the continuum of hospital to community.
Preliminary research using the St. Mary's NCM Model suggests that those
patients with chronic respiratory diseases who had NCM had shorter lengths of stay
than those patients who had no NCM. Continuing research is essential to identify what
impact NCM has on the cost of hospital stays within DRGs.
Research questions are: 1) Is there a difference in the hospital LOS of those
patients who had NCM, those who did not, and those who had NCM initiated during
the hospitalization or 10 days afterward? 2) Is there a relationship between LOS and
the number of NCM contacts pre-hospitalization of patients in selected DRGs? 3) Is
there a relationship between LOS of patients in selected DRGs and the number of
weeks of NCM? 4) What are the primary predictors of LOS of patients in selected
DRGs of the three groups? and 5) Is there a difference in the background
characteristics of the three groups?
CHAPTER TWO
CONCEPTUAL FRAMEWORK AND LITERATURE REVIEW
19
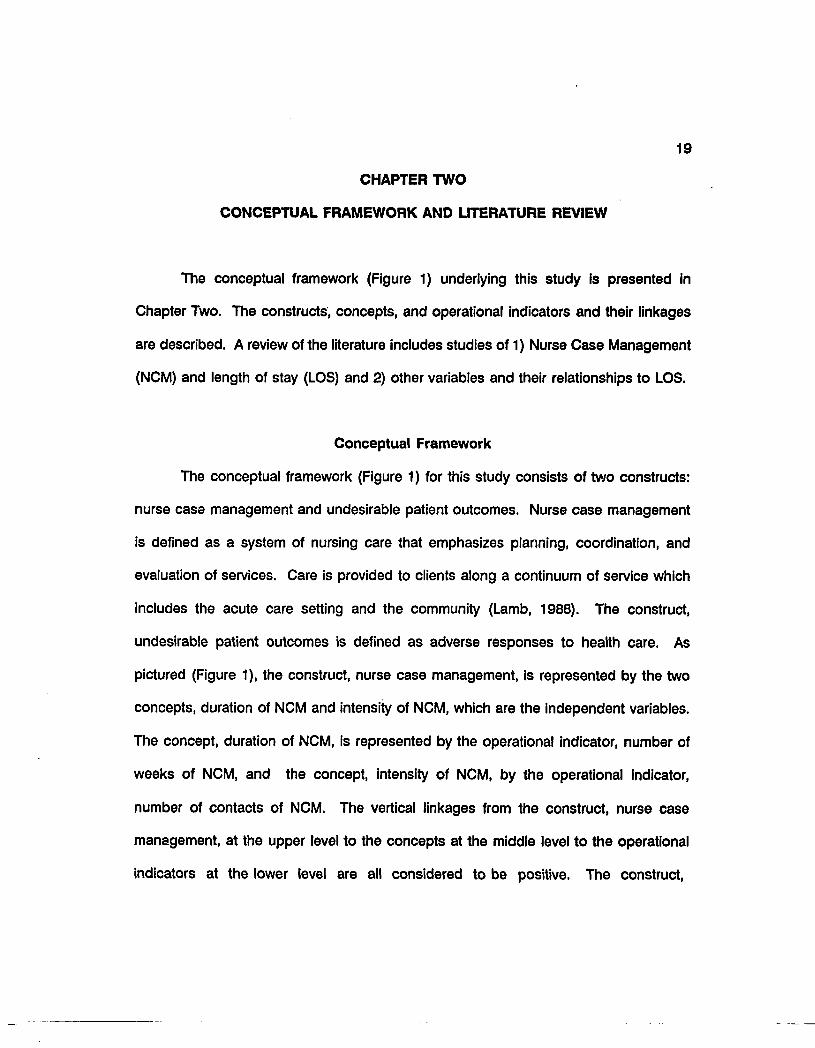
The conceptual framework (Figure 1) underlying this study is presented in
Chapter Two. The constructs, concepts, and operational indicators and their linkages
are described. A review of the literature includes studies of 1) Nurse Case Management
(NCM) and length of stay (LOS) and 2) other variables and their relationships to LOS.
Conceptual Framework
The conceptual framework (Figure 1) for this study consists of two constructs:
nurse case management and undesirable patient outcomes. Nurse case management
is defined as a system of nursing care that emphasizes planning, coordination, and
evaluation of services. Care is provided to clients along a continuum of service which
includes the acute care setting and the community (Lamb, 1988). The construct,
undesirable patient outcomes is defined as adverse responses to health care. As
pictured (Figure 1), the construct, nurse case management, is represented by the two
concepts, duration of NCM and intensity of NCM, which are the independent variables.
The concept, duration of NCM, is represented by the operational indicator, number of
weeks of NCM, and the concept, intensity of NCM, by the operational indicator,
number of contacts of NCM. The vertical linkages from the construct, nurse case
management, at the upper level to the concepts at the middle level to the operational
indicators at the lower level are all considered to be positive. The construct,

20
Construct Level
Concept Level
Operational
Level
Nurse Case Management
Duration NCM
# Weeks ot NCM
Intensity NCM D-
# of ncWL Contacts |
Undesirable Patient outcomes
. Hospitalization
J
LOS as # of Patient Days
Legend: NCM = Nurse Case Management LOS = Length of Stay # = Number
Figure 1. Conceptual Framework Nurse Case Management and Hospital Length of Stay
21
undesirable patient outcomes, is represented by the concept, hospitalization, which is
the dependent variable. Hospitalization is considered a factor contributing to the high
cost of health care. Hospitalization is defined as the individuals^ stay as an inpatient
in the hospital (Weinberger, Smith, Katz & Moore, 1988). The operational indicator for
the concept, hospitalization, is LOS as measured by the number of patient days in one
hospital stay. The vertical linkage from the construct, patient outcomes, to the concept,
hospitalization, is considered to be positive as is the linkage from the concept,
hospitalization, to the operational indicator LOS. Horizontally, the construct, nurse case
management, is depicted as having a negative relationship with the construct,
undesirable patient outcomes. There are negative relationships between the concepts,
intensity of NCM and duration of NCM with the concept, hospitalization. They are
considered negative since it was expected that the amount and duration of NCM pre-
hospitalization would have an inverse relationship with the length of hospitalization.
The relationships between the operational indicators, also, are considered negative.
Constructs
Nurse Case Management
In this conceptual framework nurse case management refers to a system in
which care is provided to clients along a continuum of service which includes the acute
care setting and the community. This continuum of service into the community from
the acute care setting, which is provided by a nurse case manager, may include the
home care environment, boarding homes, supervisory care facilities, extended care

22
facilities, and nurse wellness centers. Nurse case management may be instituted at any
point on the continuum.
The Professional Nurse Case Manager is responsible for
developing a long-term relationship with the client and family for
the purpose of planning, service utilization, facilitating patient and
family access to various services and monitoring patient progress
toward the attainment of health goals (Lamb, 1988, p. 1).
Patients who are chosen for case management are considered to be at high risk for
readmission to the hospital; the criteria for high risk include the age of the patient, the
age of the caregiver, the frequency of previous admissions, the potential for
complications based on the presence of multiple health or social problems, and the
need for education to facilitate self-help. While the patient is in the hospital, the nurse
case manager collaborates with the primary care nurse and the interdisciplinary team
in the development of the nursing care plan, the timely coordination of services,
continuous assessment and monitoring, early discharge planning, and goal identification
with the patient, family, and physician. Post-hospitalization the nurse case manager
continues the assessment and monitoring, and collaborates with the patient and family
in meeting the mutually set goals.
Undesirable Patient Outcomes
Undesirable patient outcomes, in this study, refers to patient outcomes to the
extent that there is a reduction of access to health care, lower quality of health care,
and increased cost of health care. Nursing actions or interventions are expected to
result in beneficial patient outcomes (ANA, 1980).

23
Concepts
Duration of Nurse Case Management
The duration of NCM is defined as the amount of time the Nurse Case Manager
was involved in the care of the patient prior to this hospitalization.
Intensity of Nurse Case Management
The intensity of NCM is defined as the amount of NCM service the patient has
had prior to this hospitalization. This service includes home visits and telephone calls
to the client.
Hospitalization
Hospitalization is defined as the individual's stay as an inpatient in the hospital
(Weinberger et al., 1988). Since hospitalization is a major factor of the spiraling health
care costs, hospitals have responded by implementing strategies to reduce the length
of the hospital stay. Nurse Case Management is one of those strategies. Brooten,
Brown, Munro, York, Cohen, Roncoli, & Hollingsworth (1988) described hospitalization
as hospital care and a hospital stay. Another method suggested to reduce hospital
stay is the substitution of a program of transitional home follow-up by nurse specialists
for a portion of the hospital care (Brooten et al., 1988).
24
Operational Indicators
Number of Weeks of NCM
For this study, the number of weeks of NCM is defined as the number of weeks
between the patient's first NCM contact and the patient's date of admission to the
hospital.
Number of Contacts of NCM
The number of contacts of NCM is defined as the number of home visits and
telephone calls which were made one month, two months, and six months prior to this
hospitalization by the nurse case manager.
Length of Stay
Length of stay is considered a major indicator which influences the cost of a
hospitalization. Medicare reimbursement Is determined by the patient's DRG
classification regardless of the LOS. If the LOS is longer than the designated LOS for
that DRG, those additional days of hospitalization result in loss of dollars for the
hospital (Marchette et al, 1986). Length of stay is defined as the number of days that
the patient is an inpatient for one hospital stay.
Review of the Literature
Nurse Case Management
Case management is a term which was first used in the social welfare literature
in the early 1970s. Case managers were to coordinate services to assure accessibility,
25
availability, and responsiveness to the needs of the people being served (Green, 1984).
According to the American Nurses Association (1988) -
Case management is a system with many elements:
o Health Assessment
o Planning
o Procurement, delivery, and coordination of services, and
o Monitoring to assure that the multiple service needs of the client
are met.
Case management optimizes the client's self-care capabilities, promotes efficient
use of resources, and stimulates the creation of new services...Case
management serves both facilitating and gatekeeping functions...The gatekeeping
functions of case management assure that clients receive appropriate and cost-
effective care within a system of service (ANA, 1988, p.1).
A forerunner of case management was the coordination of community services
provided by public health nurses since the turn of the century. The coordination of
services has always been a major part of public health nursing (Grau, 1984). The
coordination functions have been traced back to the settlement house and community
center focus on the family (Green, 1984). For example, Lillian Wald and Mary Brewster
were two nurses who established the Henry Street Settlement House in New York to
coordinate multiple services for the poor. These services included health care, food
kitchens, sanitation and health education, and home care (Christy, 1970).
Another term associated with case management is continuum of care.
Continuum of care refers to ongoing services for patients discharged from the hospital
26
to the community. This term can be found in the literature of the 1950s when new
medications for psychiatric disorders allowed numerous patients to be discharged from
psychiatric hospitals (Green, 1984). Comprehensive, coordinated care at the community
level was encouraged by the U.S. government in the 1970s; grants financed many early
programs. Community based alternatives to institutional care were also encouraged by
the 1981 Omnibus Budget Reconciliation Act and the Medicare prospective payment
system. These legislations facilitated the continued development of case management.
The goals of case management are to provide quality health care along a continuum
to decrease fragmentation of care across settings, to enhance the client's quality of life,
and to contain costs (ANA, 1988).
As hospital nursing directors across the country became aware of the impact
of the lower Medicare payments, some of them began to investigate and implement
NCM programs in an attempt to contain costs. One type of NCM has been
implemented at the New England Medical Center where the nurse case manager is the
central caregiver and works with the attending physician in individualizing a case
management plan and a critical path for the patient. A major goal is to facilitate "early"
discharge or discharge within an "appropriate" LOS (Zander, 1987). Nurse case
management begins with a telephone call before entry into the hospital system and
ends with follow-up phone calls after discharge. Other essential components of this
model are 'Ihe achievement of clinical and financial outcomes within the DRG allotted
time frame,...and active participation by the patient and family in goal setting and
evaluation" (Zander, 1988, p. 509). The critical path is emphasized in this model. The
critical path is defined as "collaborative guidelines which time and sequence the major
27
interventions of nurses, physicians, and other key departments for a particular case-
type or condition" (Zander, 1989, p.1 ). This model has demonstrated a decrease in
LOS for multiple DRGs (Zander 1988).
A second NCM program, developed at Hillcrest Medical Center of Tulsa,
Oklahoma, is defined as a "set of logical steps and a process of interaction with service
networks which assures that a patient receives needed services in a supportive, and
cost-effective manner" (McKenzie et al, 1989, p.30). This model is a variation of the
New England Medical Center Model. It also emphasizes the selection of patients' DRGs
which are high volume and from which NCM may provide a financial benefit for the
hospital. The NCM begins with a pre-admission phone call and continues through to
discharge. "In 1988, approximately $960,000 of billed charges and 430 patient days
were saved through Hillcrest's Nursing Case Management Program" (McKenzie et al.,
1989, p.34).
A third NCM program is that at St. Mary's Hospital and Health Center, Tucson,
Arizona, where the setting for this study takes place. As a program of Professional
Nurse Case Management, all nurse case managers are required to have Bachelor of
Science in Nursing degrees. Professional NCM is based on an underlying model of
professional accountability. The nurse case managers "are placed in the position of
being independent practitioners who are individually accountable for the quality of the
services rendered and for the realization of positive health outcomes" (Ethridge, 1987,
p.3). The nurse case managers follow their patients along a continuum between
hospital and community. Patients may gain access to NCM at any point. Referrals may
be received from physicians, staff nurses, social workers, and the community. High risk
28
criteria for hospital admission or readmission are the factors which identify the need for
NCM. The Professional Nurse Case Manager assesses and monitors the patient inside
and outside the hospital to assure that necessary support and services are in place.
A long term relationship is established between the nurse and the patient and family
which enhances trust, communication, and problem solving. The goal of this program
is to increase access to healthcare and the quality of care while decreasing costs
(Lamb, 1988).
Length of Stay
With the development of the DRG system and prospective reimbursement,
Medicare's payment became linked to LOS. If the LOS is lower than the average LOS
as defined by HCFA, the hospital makes a profit. However, if the LOS is longer, then
the hospital has a loss. 'The DRG system makes decreased LOS essential" (Trofino,
1988, p.29). Before the DRG system was implemented, the longer patients stayed in
the hospital, the higher the profits. There are many opinions about what factors affect
LOS. One opinion is that physician practice patterns are a major factor since patient
discharges are ordered by the physician. Another opinion is that there is a strong
relationship between nursing care hours and LOS (Trofino, 1988). Age, over 65 years,
is one factor which has been found in a number of studies to increase LOS. There are
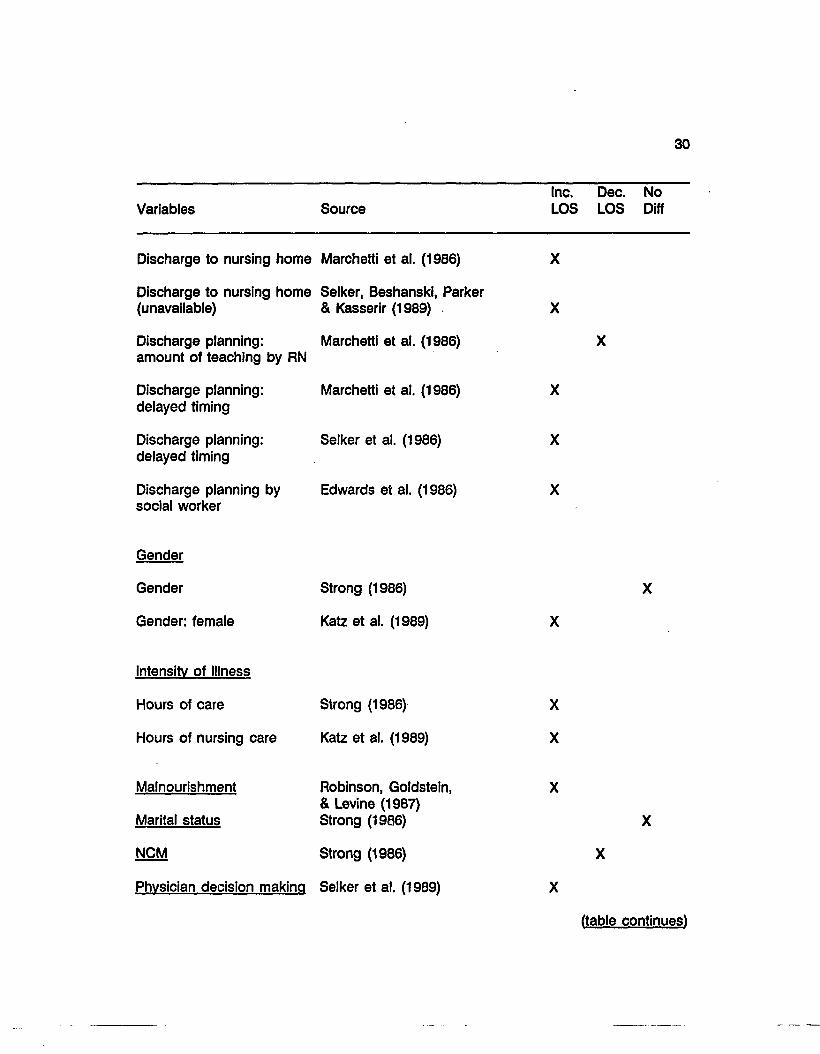
many additional factors which have been studied, as shown on Table 1, but there are
either conflicting results or too few studies to support them. Some of the factors which
have been shown to increase LOS are scheduling of tests, socioeconomic status,
malnourishment, complications, unavailability of post-discharge facilities, presence of
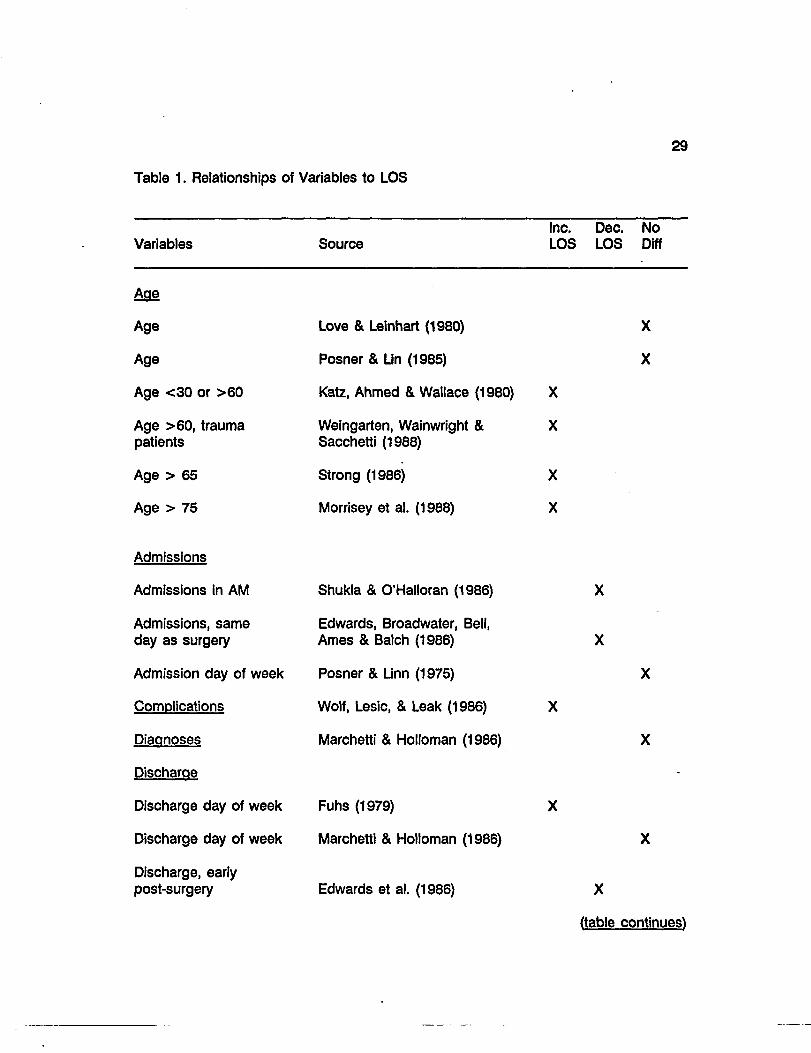
Table 1. Relationships of Variables to LOS
29
Variables Source Inc. Dec. No LOS LOS Diff
Age
Age
Age
Age <30 or >60
Age >60, trauma patients
Age > 65
Age > 75
Love & Leinhart (1980)
Posner & Lin (1985)
Katz, Ahmed & Wallace (1980) X
Weingarten, Wainwright & X Sacchetti (1988)
Strong (1986) X
Morrisey et al. (1988) X
X
X
Admissions
Admissions in AM
Admissions, same day as surgery
Admission day of week
Complications
Diagnoses
Discharge
Discharge day of week
Discharge day of week
Discharge, early post-surgery
Shukla & O'Halloran (1986)
Edwards, Broadwater, Bell, Ames & Batch (1986)
Posner & Linn (1975)
Wolf, Lesic, & Leak (1986)
Marchetti & Holloman (1986)
Fuhs (1979)
Marchetti & Holloman (1986)
Edwards et al. (1986)
X
X
(table continues)
30
Inc. Dec. No Variables Source LOS LOS Diff
Discharge to nursing home Marchetti et al. (1986) X
Discharge to nursing home Selker, Beshanski, Parker (unavailable) & Kasserir (1989) X
Discharge planning: Marchetti et al. (1986) X amount of teaching by RN
Discharge planning: Marchetti et al. (1986) X delayed timing
Discharge planning: Selker et al. (1986) X delayed timing
Discharge planning by Edwards et al. (1986) X social worker
Gender
Gender Strong (1986) X
Gender: female Katz et al. (1989) X
Intensity of Illness
Hours of care Strong (1986) X
Hours of nursing care Katz et al. (1989) X
Malnourishment Robinson, Goldstein, X & Levine (1987)
Marital status Strong (1986) X
NCM Strong (1986) X
Physician decision making Selker et al. (1989) X
(table continues)

31
Variables Source Inc. Dec. No LOS LOS Diff
Race
Race
Race (Hispanic except for pneumonia)
Strong (1986)
Morrisey et al. (1988)
Scheduling
Scheduling of diagnostic, Selker et al. (1989) tests, delay
Scheduling of surgery, Selker et al. (1989) delay
Smoking
Smoking
Smoking
Katz et al. (1988)
Strong (1986)
X
X
X
X
Social support system Strong (1986)
Socioeconomic status
Transitional home care
Epstein, Stern, Tognetti, Bigg, Hartley, Cumella, & Ayanian (1988)
Brooten, Brown, Munro, York, Cohen, Roncoli, & Hollingsworth (1988)

32
secondary diagnosis, and hours of nursing care. Factors found which decreased LOS
are nurse discharge planning, morning discharges, and NCM. Those factors which
showed no difference at all in LOS are sex, marital status, heavy body weight, smoking,
intensity of illness, race, and social support system.
Studies of NCM and LOS
Strong (1987) evaluated the cost efficiency of NCM as measured by Emergency
Department visits, rehospitalization, and LOS. The population included 48 nurse case
managed patients with chronic medical problems. This group was compared with a
similar group of patients who were not nurse case managed. The three independent
variables were NCM, nursing time, and length of follow-up. Nursing time was defined
as the number of hours spent with the patient and family or in communication with
other health professionals. Length of follow-up referred to the number of days which
the client had NCM. The results of the study suggested the following. The patients
who had NCM had a shorter LOS than those who had no NCM, although there was no
significant relationship between the length of NCM (# of days) and LOS. As the
number of hours of NCM increased, the LOS increased. This appears to be in conflict,
but the length of days of NCM may include few hours of NCM as the intensity of
services required may be different according to the acuteness or chronicity of the
patient's condition. Case managed patients spent less time in the hospital, but they
were found to be older and sicker. There was no significant relationship between use
of the Emergency Department and NCM. Rehospitalization was found to be positively
related to the frequency of use of the Emergency Department and being of male

33
gender. Gender, marital status, intensity of illness (measured by hours of care), race,
the distance the client lived from the hospital, smoking, and social network were not
found to be significant predictors of hospital stay.
Chapman (1989), in a pilot study, described two indicators of cost, acuity (hours
of care) and LOS, for 44 patients who had a Professional Nurse Case Manager. All of
these patients had been discharged in a one month period. Because the sample size
for each DRG was quite small (n=1 to 5), description was done by Medical Diagnostic
Category (MDC). The highest volume DRGs were bronchitis and asthma (DRG 96, n=5)
and heart failure and shock (DRG 127, n=4). The highest volume MDCs were the
Circulatory System with twelve discharges and the Respiratory System with nine
discharges. Chapman (1989) concluded that LOS was positively related to admission
acuities and that 50 percent of all patient discharges followed admission through the
Emergency Department. Questions were raised regarding the relationships between
the amount of involvement of NCM and LOS and between the duration (# of weeks)
of NCM and LOS. Further review of the records was recommended to clarify if there
were any specific procedures which required additional nursing hours of care. The
majority of those patients admitted through the Emergency Department also had a co
morbidity which could have had a strong link to the increased LOS. Co-morbidity is
defined as "a pre-existing condition which, because of its presence with the condition
identified as the principal diagnosis, will increase the LOS by at least one day in
approximately 75 percent of the cases" (American Hospital Association, 1983, p.viii-6).
These two previous studies were done using the St. Mary's NCM model with a
continuum of care between the hospital and community.

34
Zander (1988) reported that the average ICU days for nurse case managed
patients with subarachnoid hemorrhage dropped by 10 percent; for NCM patients with
ischemic stroke there was a 29 percent drop in the average number LOS and a 47
percent drop in the average number of ICU days. Zander's (1988) case management
model, designed for the acute care setting, uses the critical path method and the case
management plan. No data-based studies of this model were available.
There is scant literature to describe the relationships between NCM and LOS but
many new models of NCM are being introduced and the effects of these models on a
variety of outcomes should be examined.
Studies of LOS and Non-NCM
A study by Marchette and Hoiloman (1986) investigated the relationships
between 10 patient variables and LOS. The 10 variables were the number of areas of
nurses' discharge planning, the timing of nurses' discharge planning, whether patients
received discharge planning, the timing of social workers' discharge planning, admission
day of the week, discharge day of the week, discharge destination, age, gender, and
diagnosis. A retrospective chart review was done of 500 patients at a major medical
center. Five diagnostic categories of 100 patients each were selected: arteriosclerotic
heart disease, myocardial infarction, cerebrovascular accident, congestive heart failure,
and asthma. They found that 1) for every area of discharge planning the nurse carried
out, there was a decrease of 0.8 days of LOS; 2) for everyday that discharge planning
was delayed, there was an increase of 0.8 days of LOS; 3) admission day and
discharge day of the week were not related to LOS; 4) patient discharges to nursing
35
homes increased the LOS by 10-12 days more than expected; 5) the older the patient
was, the longer the LOS; 6) gender was unrelated to LOS; and 7) there was no
significant relationship between diagnoses and LOS, which was unexpected. Only
twenty one percent of the variation in LOS could be predicted by this study's variables;
therefore there were 79 percent of the variations in LOS which could be due to other
variables such as co-morbidities, complications, etc.
A study was conducted by Epstein, Stern, Tognetti, Begg, Hartly, Cumella, and
Ayanian (1988) to determine the association of patients' socioeconomic characteristics
with the LOS and hospital charges, Four hundred and two patients with connective
tissue disorders were interviewed to identify their socioeconomic status, and severity of
illness was measured with an activities of daily living scale. Hospital charges were
found to be higher and LOSs were significantly longer for lower socioeconomic groups.
Summary
The conceptual framework and review of the literature were presented in this
chapter. The independent variables were identified as intensity of NCM and duration
of NCM. The dependent variable was hospitalization as measured by LOS. The review
of the literature was scant in numbers of studies to support the relationship of NCM and
LOS. Nurse case managed patients were found to have a shorter LOS than those
patients who did not have NCM. There was no significant relationship between the
number of days of NCM and LOS. There was a positive relationship between the
number of hours of NCM and LOS. As hospitals' nursing directors are now in process
of developing various models of NCM, the next few years should allow the time
36
necessary for systematic research to be conducted. Studies were also found which
examined the relationships between LOS and non-case management variables.
CHAPTER THREE
METHODOLOGY OF THE STUDY
37
A description of the study design, setting, sample, protection of human subjects,
data collection measurements and procedures, and data analysis plan is presented in
Chapter Three.
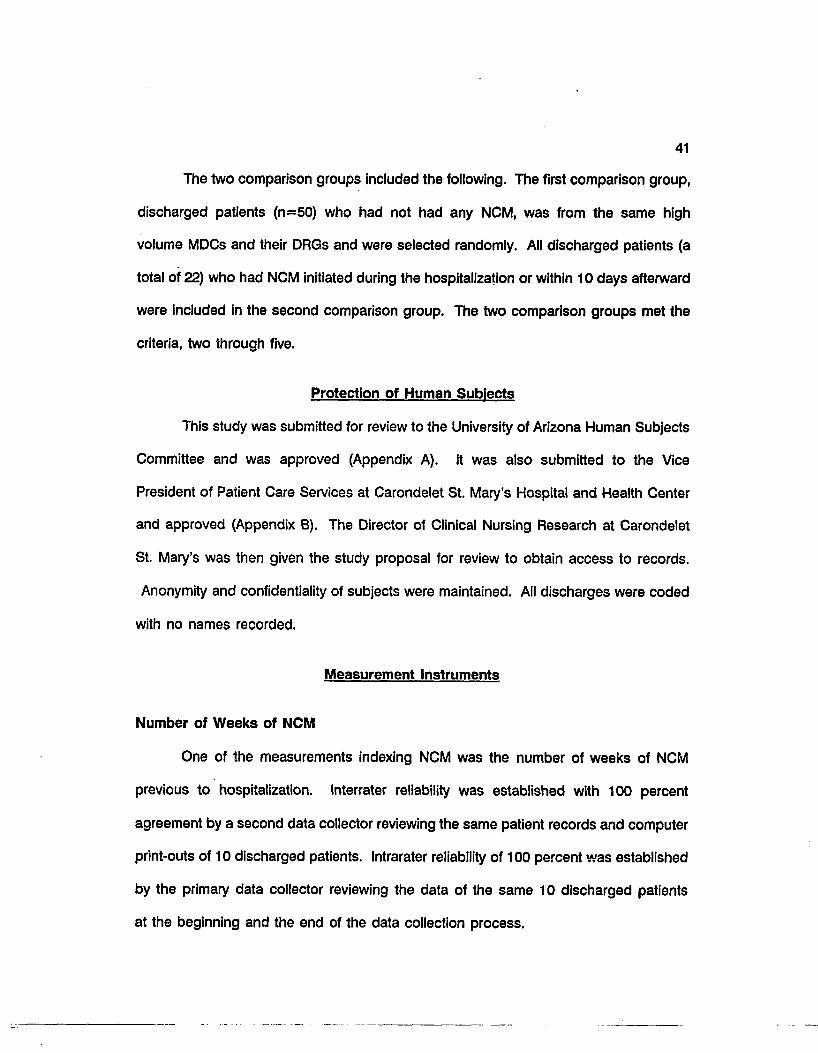
Design And Setting
An ex post facto descriptive correlational design was utilized in this study. A
retrospective record review methodology was used. Charts were selected for review
based upon sample selection criteria.
The study took place in a non-profit community hospital of 374 beds in a city
in southwestern United States. This hospital's census routinely consists of 50-60
percent Medicare patients of which the majority are elderly, age 65 and over.
The purpose of this study was to identify whether those patients in the medical
Diagnostic Related Groups (DRGs) of the two Medical Diagnostic Categories (MDCs),
the Respiratory and Circulatory Systems, who had NCM previous to hospitalization, had
a shorter LOS than those who had not had NCM and those who had NCM initiated
during or shortly after hospitalization, it was anticipated that those patients who had
NCM initiated during the hospitalization or shortly afterward would be similar in
background characteristics to those patients who had NCM prior to hospitalization. The
patients in these two groups would have been selected by using high risk criteria.
With NCM prior to hospitalization, the LOS was expected to be shorter. These two

38
groups were also expected to be different in background characteristics from the non-
NCM group since this group was not selected using high risk criteria.
The Sample
The study population consisted of nurse case managed patients, age 65 and
over, who were in the medical DRGs of the two highest volume MDCs, the Respiratory
System and the Circulatory System. The patients had been discharged during the
period of July 1, 1988 to June 30, 1989. All discharges from these MDCs were
reviewed. The medical DRGs within the two MDCs were those as shown in Table 2.
Forty four discharged patients met the criteria which was used for the selection of the
sample. The criteria was the following:
1) They had NCM prior to admission to the hospital.
2) They were classified by medical DRGs only, within the Respiratory and
Circulatory MDCs.
3) They survived the hospital stay.
4) They were not discharged to Hospice.
5) Payment was by Medicare.
Medical DRGs were chosen since these were primarily the DRGs which had NCM and
they included patients with chronic diseases who were at increased risk for readmission
to the hospital. Surgical DRGs were considered to be a "different" group from the
medical DRGs since the surgical DRG patients were less likely to have NCM, had high
costs for operative procedures, and were less likely to be readmitted to the hospital.
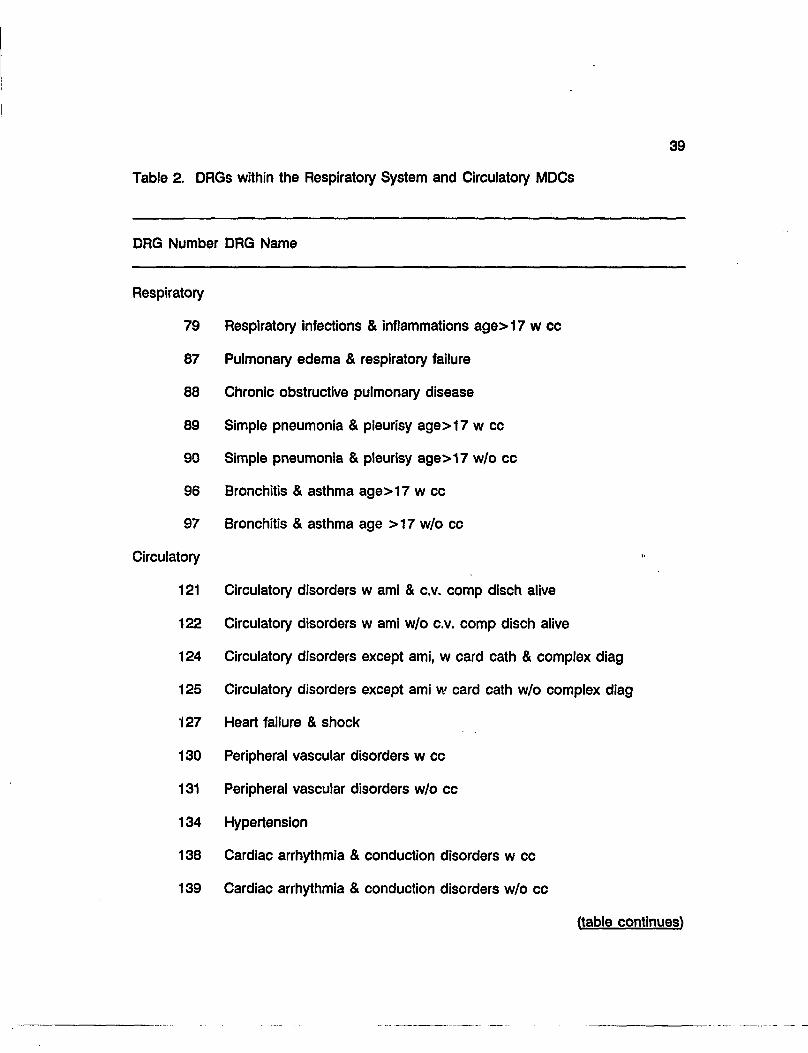
Table 2. DRGs within the Respiratory System and Circulatory MDCs
39
DRG Number DRG Name
Respiratory
79 Respiratory infections & inflammations age>17 w cc
87 Pulmonary edema & respiratory failure
88 Chronic obstructive pulmonary disease
89 Simple pneumonia & pleurisy age>17 w cc
90 Simple pneumonia & pleurisy age>17 w/o cc
96 Bronchitis & asthma age>17 w cc
97 Bronchitis & asthma age >17 w/o cc
Circulatory
121 Circulatory disorders w ami & c.v. comp disch alive
122 Circulatory disorders w ami w/o c.v. comp disch alive
124 Circulatory disorders except ami, w card cath & complex diag
125 Circulatory disorders except ami w card cath w/o complex diag
127 Heart failure & shock
130 Peripheral vascular disorders w cc
131 Peripheral vascular disorders w/o cc
134 Hypertension
138 Cardiac arrhythmia & conduction disorders w cc
139 Cardiac arrhythmia & conduction disorders w/o cc
(table continues!
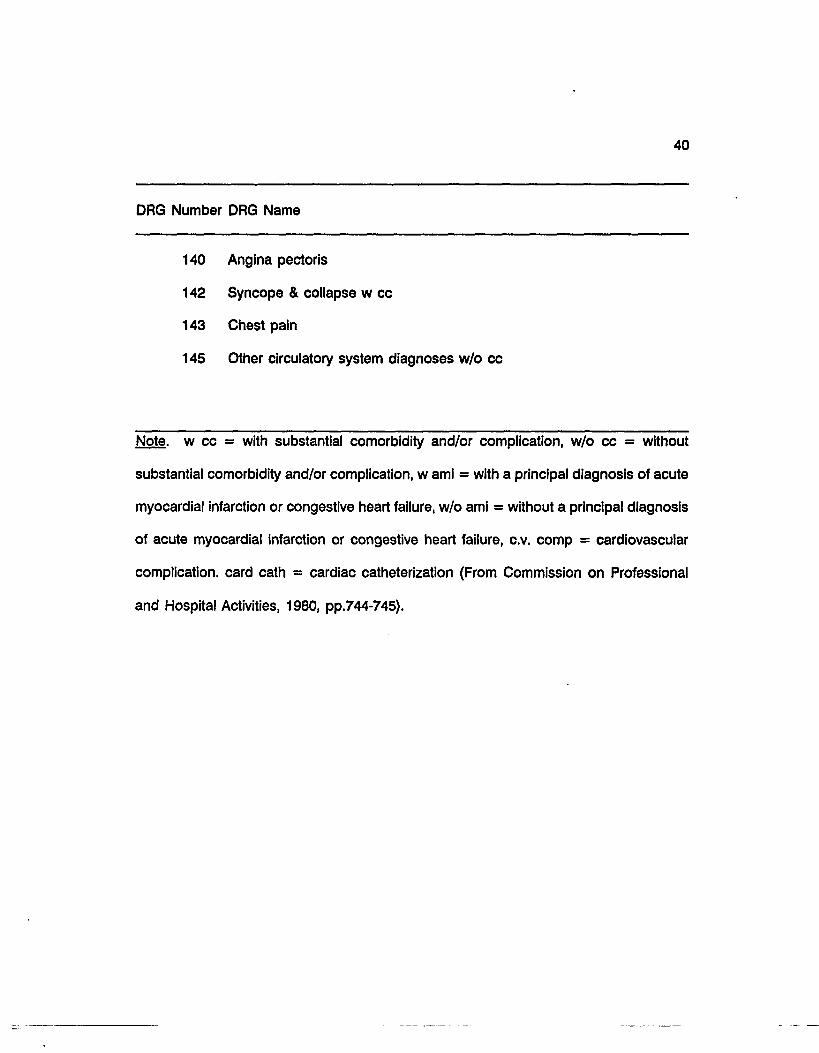
40
DRG Number DRG Name
140 Angina pectoris
142 Syncope & collapse w cc
143 Chest pain
145 Other circulatory system diagnoses w/o cc
Note, w cc = with substantial comorbidity and/or complication, w/o cc = without
substantial comorbidity and/or complication, w ami = with a principal diagnosis of acute
myocardial infarction or congestive heart failure, w/o ami = without a principal diagnosis
of acute myocardial infarction or congestive heart failure, c.v. comp = cardiovascular
complication, card cath = cardiac catheterization (From Commission on Professional
and Hospital Activities, 1980, pp.744-745).
41
The two comparison groups included the following. The first comparison group,
discharged patients (n=50) who had not had any NCM, was from the same high
volume MDCs and their DRGs and were selected randomly. All discharged patients (a
total of 22) who had NCM initiated during the hospitalization or within 10 days afterward
were included in the second comparison group. The two comparison groups met the
criteria, two through five.
Protection of Human Sublects
This study was submitted for review to the University of Arizona Human Subjects
Committee and was approved (Appendix A). It was also submitted to the Vice
President of Patient Care Services at Carondelet St. Mary's Hospital and Health Center
and approved (Appendix B). The Director of Clinical Nursing Research at Carondelet
St. Mary's was then given the study proposal for review to obtain access to records.
Anonymity and confidentiality of subjects were maintained. All discharges were coded
with no names recorded.
Measurement Instruments
Number of Weeks of NCM
One of the measurements indexing NCM was the number of weeks of NCM
previous to hospitalization. Interrater reliability was established with 100 percent
agreement by a second data collector reviewing the same patient records and computer
print-outs of 10 discharged patients. Intrarater reliability of 100 percent was established
by the primary data collector reviewing the data of the same 10 discharged patients
at the beginning and the end of the data collection process.
42
Number of Contacts by the Professional Nurse Case Manager
The number of pre-hospitalization contacts by the nurse case manager was the
second measurement referencing NCM. This measurement was obtained at one, two,
and six month intervals prior to the hospitalization. Interrater reliability, with 100
percent agreement, was also obtained by a second data collector reviewing the same
data of 10 discharged patients as had the primary data collector. Intrarater reliability,
with 100 percent agreement, was also obtained by the primary data collector reviewing
the same data of 10 discharge patients at the beginning and the end of the data
collection process.
Number of Patient Days
Length of stay is measured by the number of patient days during hospitalization.
Length of stay is what drives the DRG prospective payment system and was the basis
for the original research on resource consumption at Yale-New Haven Hospital and the
Yale University Center for Health Studies in the late 1960s and middle 1970s. This
study led to the DRG system (Plomann & Shaffer, 1983). LOS is the method by which
hospitals receive payment for Medicare patients' hospitalization. This measurement is
considered to be valid since it is the actual measure of the concept, LOS, based on the
literature. Though, there are other factors which may impact the total cost of a
hospitalization, LOS is clearly one of the costs. Interrater reliability was achieved with
100 percent agreement by a second data collector reviewing the same data of 10
discharged patients as had the primary data collector. Intrarater reliability, with 100%
43
agreement, was obtained by the primary data collector reviewing the same data of 10
discharged patients at the beginning and the end of the data collection process.
Data Form
A twenty-five item tool (Appendix C) was designed to organize data representing
the two concepts of this study and background information of the three groups of
patients under examination. All of the information was retrieved retrospectively from
computer printouts, patients' hospital records, and nurse case managers' patient
community records. The hospital records referencing NCM and LOS were the primary
data. Based on the literature, the background data included age, sex, ethnicity, if living
alone, admission acuity (based on hours of care per patient day) of the hospitalization,
and the number of days since the previous admission. The number of hospitalizations
and number of admissions through the Emergency Department and Critical Care Units
in the 60 days previous to this hospital stay were obtained from the Medical Records
Department. These were considered since Medicare's "spell of illness" definition is:
"Initial visits are first admissions or those that occur after the beneficiary has been
discharged from a hospital for at least 60 days" (Prospective Payment Assessment
Commission, 1989, p.2). The number of emergency department visits in the 60 days
previous to admission was also obtained. Data were obtained by one data collector.
Interrater reliability, as stated previously, was established for the data collection method
by a second data collector reviewing the same computer printouts, hospital patient
records, and community patient records with 100 percent agreement for 10 discharged
patients. Intrarater reliability was established by the primary data collector reviewing,
44
at the beginning and the end of the data collection, the data of the same 10 discharged
patients. One hundred percent agreement was obtained.
Data Collection Procedure
Clients were initially identified using computer printouts, obtained from the Fiscal
Services Division, of all patient discharges from the period of July 1,1988 to June 30,
1989. Medical DRGs in the Respiratory and Circulatory MDCs were identified and
exclusion criteria utilized.
Data collection included information relating to 44 nurse case managed
discharged patients, 50 non-nurse case managed discharged patients, and 22
discharged patients who had NCM initiated during the hospitalization or within 10 days
afterward. The computer printouts were then reviewed to obtain all data available for
each discharge identified by the medical record number. This information included the
DRG number, LOS, age, ethnicity and marital status. This information was recorded on
the Data Form. Second, medical records for all patients were obtained from the
Medical Records Department. The information retrieved was: the patient's living
situation, the admission acuity, the number of days since the last hospitalization, and
the number of hospitalizations and Emergency Department and Critical Care admissions
in the 60 days previous to this hospitalization. The number of Emergency Department
visits 60 days prior to hospitalization was also obtained. This information was then
recorded on the Data Form. Third, the community patient records were obtained from
the nurse case managers for the 44 discharged patients who had NCM prior to the
hospitalization. The information collected was the number of weeks, pre-hospitalization,
45
the patient had NCM, and the number of nurse case manager contacts one, two, and
six months previous to the hospitalization. The accuracy of the community patient
records is in question relating to the number of contacts by the nurse case manager
may be questionable since the number of contacts included telephone calls, it is
suspected that all telephone calls may not have been documented. These data were
recorded on the Data Form. All data was coded on a Fortran Coding Form and data
were entered into the computer system to facilitate data analysis.
Data Analysis Plan
Measurements of central tendency and standard deviation were obtained for the
1) the LOS of the three groups, 2) the number of weeks of nurse case management
and the number of contacts by the nurse case manager (one, two, and six months pre-
hospitalization) of the nurse case managed group, and 3) background variables of the
three groups. To respond to research questions two and three, the Pearson Moment
Correlation (r) was used to describe the direction and magnitude of the relationship
between NCM, as measured by number of contacts and weeks of NCM, and LOS, as
measured by the number of patient days. Research question four was also answered
by the Pearson Moment Correlation to identify those background characteristics which
were correlated with LOS in each group. The level of significance was set at <.05.
Regression analysis was used to identify the primary predictors of LOS of patients in
the selected DRGs. Analysis of variance was used for continuous data and chi square
for categorical data to provide the answer to research question five, is there a difference
among the background characteristics of the three groups? Analysis of variance was
also used to identify differences in LOS of the three groups (research question one).
46
Summary
The study design, sample, protection of human subjects, data collection
measurements and procedures, and the data analysis plan were described. Data was
collected of the medical DRGs of the two highest volume MDCs of 44 discharged nurse
case managed patients, 50 non-case managed discharged patients, and 22 discharged
patients who had NCM initiated during the hospitalization or within 10 days afterward.
The data analysis plan was described.
47
CHAPTER FOUR
PRESENTATION OF THE DATA
The presentation, analysis, and discussion of the study's findings are included
in Chapter Four. Descriptive statistics are used to describe the sample and the
variables. Findings from correlations, analysis of variance, chi-square, and multiple
regression are related to the research questions. A discussion of additional data and
findings is also included.
Description of the Sample
The sample characteristics and the differences among the groups will be
discussed. The total sample consisted of 115 discharged patients from seven medical
Diagnostic Related Groups (DRGs) of the Respiratory System Medical Diagnostic
Category (MDC) and 14 medical DRGs of the Circulatory System MDC (Table 3). One
discharged patient who fit the inclusion criteria was later excluded because he was
considered an outlier as the number of NCM contacts were grossly different from the
other subjects under study. The outlier was larger than three standard deviations from
the average mean of the other subjects. This patient had 36 contacts more (total
number=83) than the patient who had the next highest number of contacts (n=47)
within the six months previous to hospitalization. An outlier is defined as being atypical,
exceeding the average number of contacts by an extreme number. There were 36
subjects in the Respiratory MDC and 79 subjects in the Circulatory MDC. The largest
volume DRGs were DRG 127: Heart Failure and Shock (n=21), DRG 96: Bronchitis and
Asthma Age >17 w/o cc (n=17), and DRG 140: Angina Pectoris (n=13). Of the 115
patients, a total of 43 had NCM before hospitalization, 22 had NCM initiated during

Table 3. Distribution of DRGs by Frequency and Percent
48
DRG Number DRG Name Frequency Percent
Respiratory
79 Respiratory infections & inflammations age>17 w cc 2 1.7
87 Pulmonary edema & respiratory failure 1 .9
88 Chronic obstructive pulmonary disease 1 .9
89 Simple pneumonia & pleurisy age>17 w cc 6 5.2
90 Simple pneumonia & pleurisy age> 17 w/o cc 2 1.7
96 Bronchitis & asthma age>17 w cc 17 14.8
97 Bronchitis & asthma age >17 w/o cc 7 6.1
Total Respiratory MDC 36 31.3
Circulatory
121 Circulatory disorders w ami & c.v. comp disch alive 1 .9
122 Circulatory disorders w ami w/o c.v. comp disch alive 5 4.3
124 Circulatory disorders except ami, w card cath & complex diag 4 3.5
125 Circulatory disorders except ami w card cath w/o complex diag 4 3.5
127 Heart failure & shock 21 18.3
130 Peripheral vascular disorders w cc 2 1.7
131 Peripheral vascular disorders w/o cc 4 3.5
134 Hypertension 1 .9
(table continues)
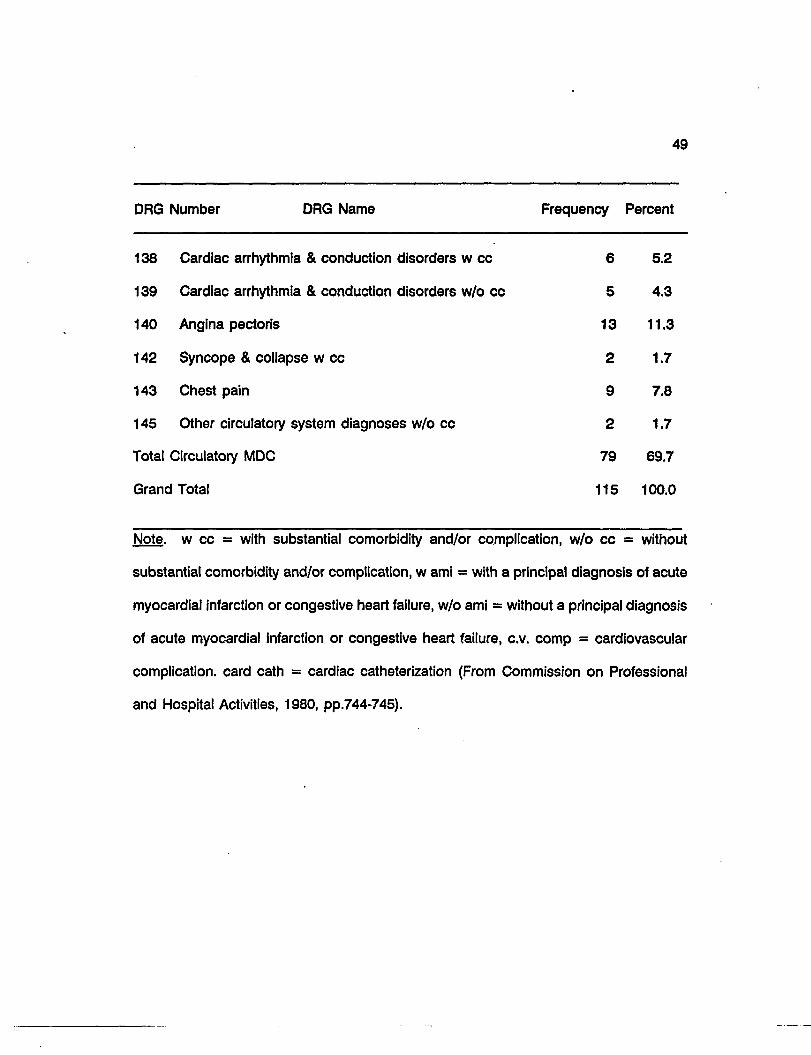
49
DRG Number DRG Name Frequency Percent
138 Cardiac arrhythmia & conduction disorders w cc 6 5.2
139 Cardiac arrhythmia & conduction disorders w/o cc 5 4.3
140 Angina pectoris 13 11.3
142 Syncope & collapse w cc 2 1.7
143 Chest pain 9 7.8
145 Other circulatory system diagnoses w/o cc 2 1.7
Total Circulatory MDC 79 69.7
Grand Total 115 100.0
Note, w cc = with substantial comorbidity and/or complication, w/o cc = without
substantial comorbidity and/or complication, w ami = with a principal diagnosis of acute
myocardial infarction or congestive heart failure, w/o ami = without a principal diagnosis
of acute myocardial infarction or congestive heart failure, c.v. comp = cardiovascular
complication, card cath = cardiac catheterization (From Commission on Professional
and Hospital Activities, 1980, pp.744-745).
50
the hospitalization or up to 10 days after discharge, and 50, who were selected
randomly, had no NCM. The distribution of DRGs within each of the three groups is
displayed in Table 4.
Age and Sex
The mean ages of the groups within the total sample and the subgroups within
the two MDCs are illustrated in Table 5. The groups within the total sample are
identified as "groups", and the groups within the MDCs are identified as "subgroups".
The mean age of the NCM pre-hospitalization group was highest at 78.9 years, the
NCM initiated during or shortly after hospitalization group was 75.2 years, and the non-
NCM group was 75.5 years. There was a statistically significant difference in mean age
(p = 0.013), befween the NCM pre-hospitalization group and the non-NCM group; the
NCM pre-hospitalization group was older than the non-NCM group. The mean ages of
the subgroups within the Respiratory MDC was highest at 77.4 years for the non-NCM
subgroup; the NCM pre-hospitalization subgroup was 77.0 years; and the NCM initiated
during the hospitalization subgroup was 73.3 years. The NCM pre-hospitalization
subgroup were older in the Circulatory System with a mean age of 79.6 years; the
mean age was 77.5 years for the NCM initiated during the hospitalization subgroup, and
74.8 years for the non-NCM subgroup. Within the Circulatory MDC, there was a
statistically significant difference (p=0.007) between the NCM pre-hospitalization
subgroup and the non-NCM subgroup. The NCM pre-hospitalization subgroup was
significantly older. Table 6 displays that the NCM pre-hospitalization group had the
51
Table 4. Distribution of DRGs in Groups of Total Sample by Frequency and Percent
DRG Number NCM
PRE-HOSPITAL n %
NCM POST-HOSPITAL
n %
NO NCM
n %
Respiratory
79 - - 1 4.5 1 2.0
87 1 2.3 - - - -
88 - - 1 4.5 - -
89 1 2.3 2 9.1 3 6.0
90 1 2.3 - - 1 2.0
96 6 14.0 7 31.8 4 8.0
97 2 4.7 1 4.5 4 8.0
Total Respiratory MDC 11 12 13
Circulatory
121 - - 1 4.5 - -
122 1 2.3 - - 4 8.0
124 - - 1 4.5 3 6.0
125 1 2.3 1 4.5 2 4.0
127 11 25.6 3 13.6 7 14.0
130 2 4.7 - - - -
131 1 2.3 1 4.5 2 4.0
(table continues)
52
NCM NCM NO DRG Number PRE-HOSPITAL POST-HOSPITAL NCM
n % n % n %
134 1 4.5 -
138 2 4.7 4 8.0
139 2 4.7 3 6.0
140 4 9.3 2 9.1 7 14.0
142 1 2.3 1 2.3
143 5 11.6 - 4 4.8
145 2 4.7 -
Total Circulatory MDC 32 10 37
Grand Total 43 100.0 22 100.0 50 100.0

53
Table 5. Age of Total Sample, Groups, MDCs, and MDC Subgroups (N=115)
Group n Mean Standard Deviation
Total1
NCM pre-hospitalization
NCM during hospitalization
Non-NCM
115
43
22
50
76.704
78.930
75.182
75.460
6.330
6.681
5.637
5.863
Respiratory MDC
NCM pre-hospitalization
NCM during hospitalization
Non-NCM
36
11
12
13
75.889
77.000
73.250
77.385
6.032
6.116
4.372
6.850
Circulatory MDC2
NCM pre-hospitalization
NCM during hospitalization
Non-NCM
79
32
10
37
77.076
79.594
77.500
74.784
6.463
6.829
6.311
5.417
Note. NCM = Nurse Case Management. MDC = Medical Diagnostic Category
1 ANOVA significant at < .05. Significant difference was between the NCM pre-hospitalization group and the non-NCM group.
2 ANOVA significant < .05. Significant difference between the NCM pre-hospitalization subgroup and the non-NCM subgroup.
54
Table 6. Age Categories of Groups within Total Sample and Subgroups within MDCs (N=115)
Group 65 - 74 n %
75 - 84 n %
85 - 94 n %
Total
NCM pre-hosp 23.3 10
NCM during hosp 59.0 13
Non-NCM 48.0 24
51.2 22
31.8
48.0 21
25.6 11
9.1 2
10 5
Respiratory MDC (n=36)
NCM pre-hosp 18.2 2
NCM during hosp 75.1 9
Non-NCM 30.8 4
63.7
24.9
53.9
7
3
7
18.2 2
15.4 2
Circulatory MDC (n=79)
NCM pre-hosp 27.1 8
NCM during hosp 40.0 4
47.0 15
40.0 4
28.2 9
20.0 2
Non-NCM 54.0 20 37.8 14 8.1 3
55
highest number of subjects in the 85-94 age category. As a total group 25.6 percent
were in this category. Within the Respiratory MDC, 18.2 percent of the NCM pre-
hospitalization subgroup were in the 85-94 age category; and within the Circulatory
MDC, 28.2 percent of the NCM pre-hospitalization subgroup were in this age category.
This is higher than either of the other two subgroups but dramatically higher than the
non-NCM subgroup.
There was a higher percentage (63.6 percent) of males in the NCM initiated
during hospitalization group of the total sample, a lower percentage (36.4 percent) of
males in the NCM pre-hospitalization subgroup of the Respiratory MDC, and a slightly
lower percentage (48.6 percent) of males in the non-NCM subgroup of the Circulatory
MDC (Table 7). There were no statistically significant differences between the groups
of the total sample or the subgroups of the MDCs.
Race
Ninety three (80.9 percent) of the total sample were Caucasian, 10 (8.7 percent)
were Hispanics, 6 (5.2 percent) were Black, 3 (2.6 percent) were Indian, 2 (1.7 percent)
were Asian) and 1 (0.9) percent) were other (Table 8). Two (5.6 percent) of the
Hispanic subgroup in the Respiratory MDC were Hispanic and 8 (10.1 percent) in the
Circulatory MDC. There were no statistically significant differences between the
subgroups of the total sample or between the groups within the MDCs.
Marital Status and Living Situation
The NCM pre-hospitalization group had the most widowed subjects. Twenty
one (48.8 percent) of this group were widowed. In comparison eight (36.4 percent) of

56
Table 7. Sex of Total Sample, Groups, MDCs, and MDC Subgroups (N=115)
Group Male Female % n % n
Total
NCM pre-hosp (n=43)
NCM during hosp (n=22)
Non-NCM (n=50)
Respiratory MDC (n=36)
NCM pre-hosp (n=11)
NCM during hosp (n=12)
Non-NCM (n=13)
Circulatory MDC (n=79)
NCM pre-hosp (n=32)
NCM during hosp (n=10)
Non-NCM (n=37)
53.0 61
48.8 21
63.6 14
52.0 26
55.6 20
36.4 4
66.7 8
61.5 8
51.9 41
53.1 17
60.0 6
48.6 18
47.0 54
51.2 22
36.4 8
48.0 24
44.4 16
63.6 7
33.3 4
38.5 5
48.1 38
46.9 15
40.0 4
51.4 19
Note. NCM = Nurse Case Management. MDC = Medical Diagnostic Category.

57
Table 8. Race of Total Sample, Groups, MDCs, and MDC Subgroups (N=115)
American Group Hispanic White Black Indian Asian Other
% n % n % n % n % n % n
Total 8.7 10 80.9 93 5.2 6 2.6 3 1.7 2 0.9 1
NCM pre-hosp (n=43)
7.0 3 83.7 36 9.3 1
NCM during hosp (n=22)
4.5 1 81.8 18 4.5 1 4.5 1 4.5 1 - -
Non-NCM (n=50)
12.0 6 78.0 39 2.0 1 4.0 2 2.0 1 2.0 1
ResDiratorv MDC (n=36)
5.6 2 83.3 30 5.6 2 2.8 1 2.8 1 - -
NCM pre-hosp (n=11)
- - 90.9 10 9.1 1 - - - - - -
NCM during hosp (n=12)
8.3 1 91.7 11
Non-NCM (n=13)
7.7 1 69.2 9 7.7 1 7.7 1 7.7 1 - -
Circulatorv MDC (n=79)
10.1 8 79.7 63 5.1 4 3.8 1 1.3 1 - -
NCM pre-hosp (n=32)
9.4 3 81.3 26 9.4 3 9.4 3 - - - -
NCM during hosp (n=10)
- - 70.0 7 10.0 1 10.0 1 10.0 1 10.0 1
Non-NCM (n=37)
13.5 5 81.1 30 - - - 5.4 2 - -
Note. NCM = Nurse Case Management. MDC = Medical Diagnostic Category.
58
the NCM initiated during hospitalization group were widowed and only 10 (20 percent)
of the non-NCM group (Table 9). Within the Respiratory MDC, the NCM pre-
hospitalization subgroup and the NCM initiated during hospitalization subgroup were
close in number of widowed persons with 36.4 percent and 33.3 percent respectively
while the non-NCM subgroup had 23.1 percent. Within the Circulatory MDC the NCM
pre-hospitalization subgroup had 53.1 percent widowed, the NCM initiated during
hospitalization subgroup had 40 percent, and the non-NCM subgroup 20 percent.
There were no statistically significant differences among the groups in marital status.
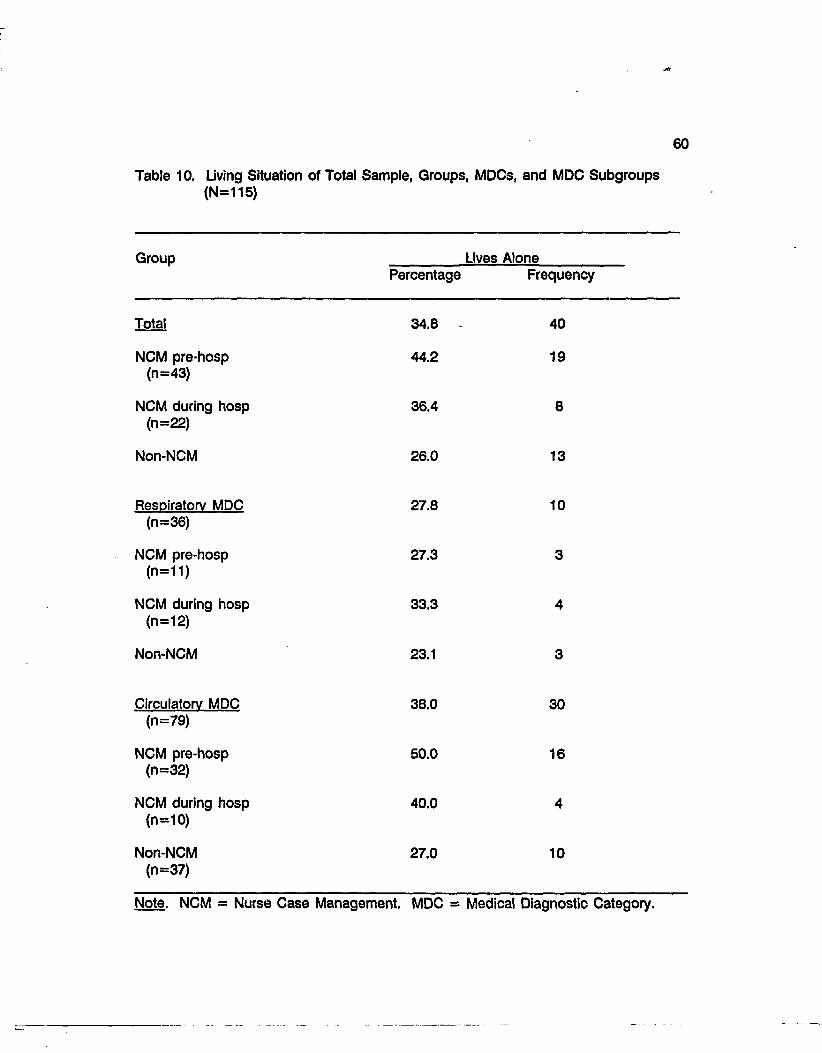
The NCM pre-hospitalization group also had more subjects who lived alone (Table 10).
Within the total sample 19 (44.2 percent) of the NCM pre-hospitalization group lived
alone, 36.4 percent of the NCM initiated during hospitalization group lived alone, and
26 percent of the non-NCM group lived alone. Within the Circulatory MDC, 50 percent
of the NCM pre-hospitalization subgroup lived alone, 40 percent of the NCM initiated
during hospitalization subgroup lived alone, and 27 percent of the non-NCM subgroup
lived alone. There were no statistically significant differences in living situation among
the groups within the total sample or the subgroups within the MDCs.
Admission Acuity
Patient acuity at the study's site is determined by measuring "the hours of
nursing care and skill level required for each of eight acuity levels to construct a matrix
for costing out nursing care" (Ethridge, 1985). The first five categories of acuity are for
med/surg patients with the more acute patients being in category 6. Category 6
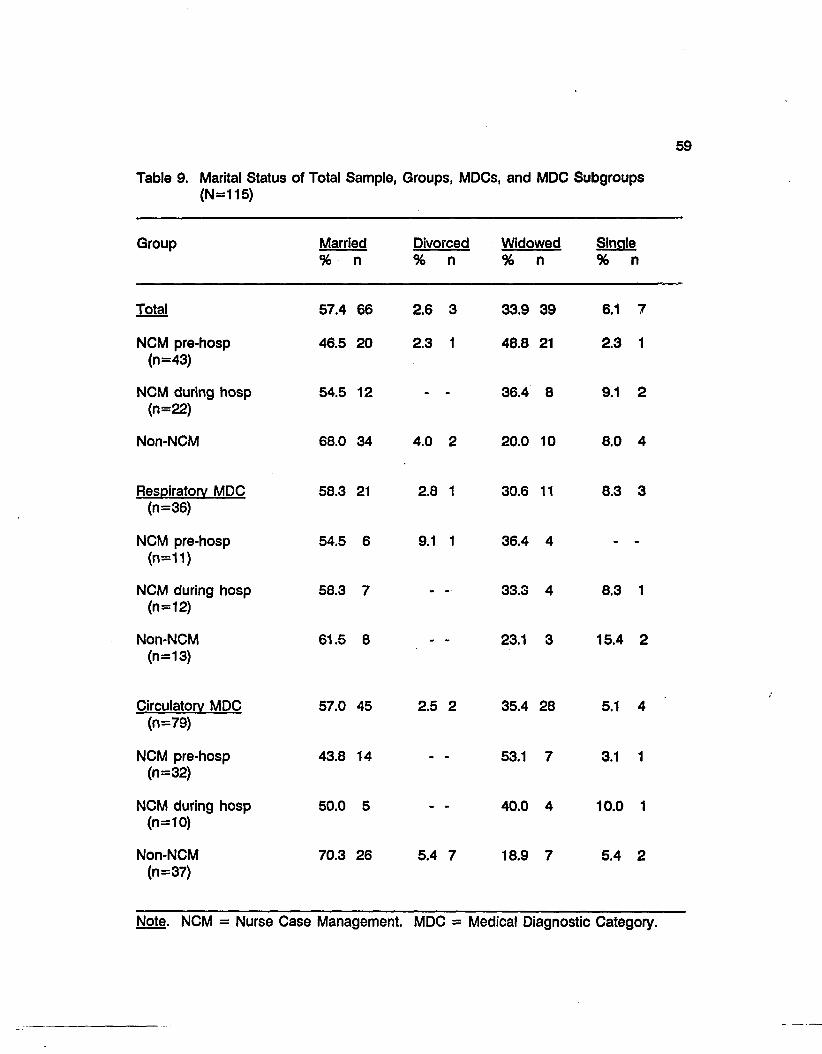
Table 9. Marital Status of Total Sample, Groups, MDCs, and MDC Subgroups (N=115)
Group Married Divorced Widowed Single % n % n % n % n
Total
NCM pre-hosp (n=43)
NCM during hosp (n=22)
Non-NCM
Respiratory MDC (n=36)
NCM pre-hosp (n=11)
NCM during hosp (n=12)
Non-NCM (n=13)
Circulatory MDC (n=79)
NCM pre-hosp (n=32)
NCM during hosp (n=10)
Non-NCM (n=37)
57.4 66 2.6 3
46.5 20 2.3 1
54.5 12 - -
68.0 34 4.0 2
58.3 21 2.8 1
54.5 6 9.1 1
58.3 7 - -
61.5 8 - -
57.0 45 2.5 2
43.8 14 - -
50.0 5 - -
70.3 26 5.4 7
33.9 39 6.1 7
48.8 21 2.3 1
36.4 8 9.1 2
20.0 10 8.0 4
30.6 11 8.3 3
36.4 4 - -
33.3 4 8.3 1
23.1 3 15.4 2
35.4 28 5.1 4
53.1 7 3.1 1
40.0 4 10.0 1
18.9 7 5.4 2
Note. NCM = Nurse Case Management. MDC = Medical Diagnostic Category.
•jtS
60
Table 10. Living Situation of Total Sample, Groups, MDCs, and MDC Subgroups (N=115)
Group Lives Alone Percentage Frequency
Total 34.8 40
NCM pre-hosp 44.2 19 (n=43)
NCM during hosp 36.4 8 (n=22)
Non-NCM 26.0 13
Respiratory MDC 27.8 10 (n=36)
NCM pre-hosp 27.3 3 (n=11)
NCM during hosp 33.3 4 (n=12)
Non-NCM 23.1 3
Circulatory MDC 38.0 30 (n=79)
NCM pre-hosp 50.0 16 (n=32)
NCM during hosp 40.0 4 (n=10)
Non-NCM 27.0 10 (n=37)
Note. NCM = Nurse Case Management. MDC = Medical Diagnostic Category.
61
patients may be in either med/surg units or critical care units. The critical care patients
are categorized in levels 6 through 8, with 8 being the most critical.
Table 11 illustrates that of the total sample, the mean admission acuity was
5.03. The NCM pre-hospitalization group was lowest at 4.81; the NCM initiated during
hospitalization group was 4.91, and the non-NCM group was highest at 5.26. Within
the Respiratory MDC, the lowest admission acuity was 4.50 for the NCM initiated during
hospitalization subgroup; the NCM pre-hospitalization subgroup was slightly higher at
4.55, and the non-NCM subgroup was highest at 4.85. Within the Circulatory MDC,
the NCM pre-hospitalization subgroup was lowest at 4.91, the NCM initiated during
hospitalization subgroup was higher at 5.40, and the non-NCM subgroup was highest
at 5.41. There were no statistically significant differences in admission acuity among
the groups within the total sample or subgroups of the MDCs.
The percentage and frequency of the distribution of the levels of acuity (1-8)
within the total sample, groups, MDCs, and subgroups are displayed in Table 12.
Within the Respiratory MDC, 23.1 percent of the non-NCM subgroup were in the highest
recorded level of acuity (acuity level 7), as were 11.1 percent of the NCM pre-
hospitalization subgroup and 8.3 percent of the NCM initiated during hospitalization
subgroup. Within the Circulatory MDC, 2.7 percent of the non-NCM subgroup were in
the highest level of acuity (acuity level 8) and 43.2 percent were in the second highest
level of acuity (acuity level 7). The NCM pre-hospitalization subgroup had the lowest
percentage (31.3 percent) in acuity level 7 and the NCM initiated during hospitalization
subgroup had 40 percent in acuity level 7.
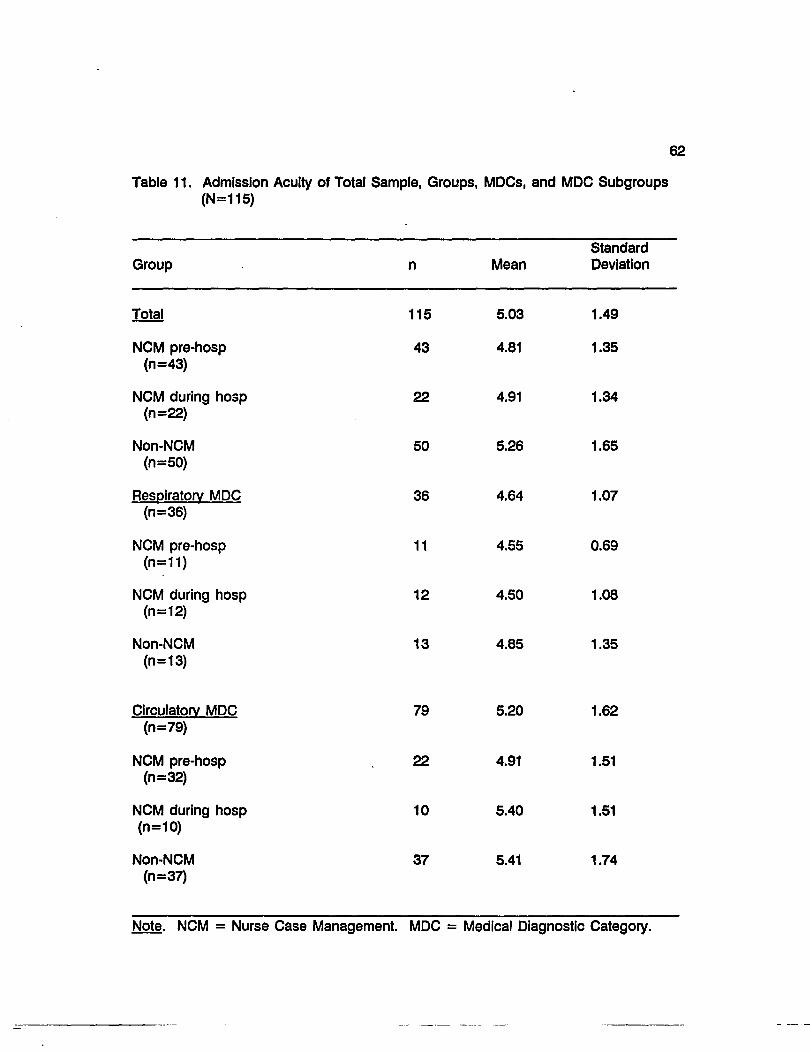
62
Table 11. Admission Acuity of Total Sample, Groups, MDCs, and MDC Subgroups (N=115)
Standard Group n Mean Deviation
Total 115 5.03 1.49
NCM pre-hosp 43 4.81 1.35 (n=43)
NCM during hosp 22 4.91 1.34 (n=22)
Non-NCM 50 5.26 1.65 (n=50)
Respiratory MDC 36 4.64 1.07 (n=36)
NCM pre-hosp 11 4.55 0.69 (n=11)
NCM during hosp 12 4.50 1.08 (n=12)
Non-NCM 13 4.85 1.35 (n=13)
Circulatory MDC 79 5.20 1.62 (n=79)
NCM pre-hosp 22 4.91 1.51 (n=32)
NCM during hosp 10 5.40 1.51 (n=10)
Non-NCM 37 5.41 1.74 (n=37)
Note. NCM = Nurse Case Management. MDC = Medical Diagnostic Category.
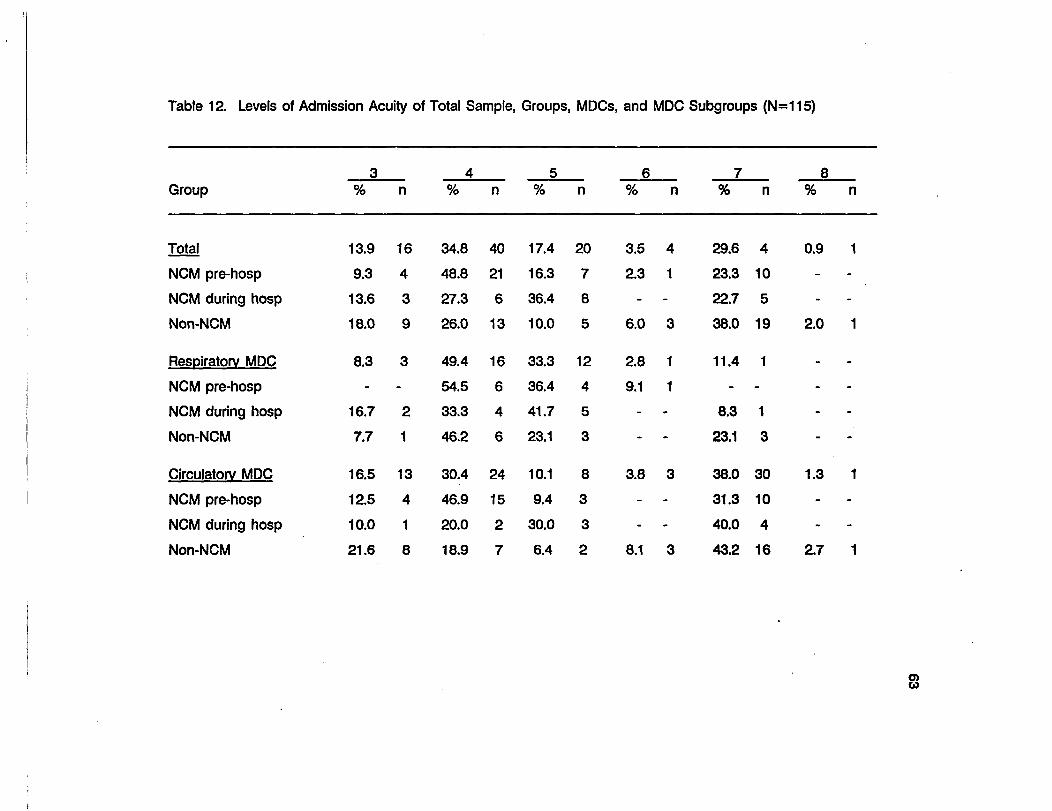
Table 12. Levels of Admission Acuity of Total Sample, Groups, MDCs, and MDC Subgroups (N=115)
Group 3 4 5 6 7 8
Group % n % n % n % n % n % n
Total 13.9 16 34.8 40 17.4 20 3.5 4 29.6 4 0.9 1
NCM pre-hosp 9.3 4 48.8 21 16.3 7 2.3 1 23.3 10 - -
NCM during hosp 13.6 3 27.3 6 36.4 8 - - 22.7 5 - -
Non-NCM 18.0 9 26.0 13 10.0 5 6.0 3 38.0 19 2.0 1
Respiratory MDC 8.3 3 49.4 16 33.3 12 2.8 1 11.4 1 - -
NCM pre-hosp - - 54.5 6 36.4 4 9.1 1 - - - -
NCM during hosp 16.7 2 33.3 4 41.7 5 - - 8.3 1 - -
Non-NCM 7.7 1 46.2 6 23.1 3 - - 23.1 3 - -
Circulatory MDC 16.5 13 30.4 24 10.1 8 3.8 3 38.0 30 1.3 1
NCM pre-hosp 12.5 4 46.9 15 9.4 3 - - 31.3 10 - -
NCM during hosp 10.0 1 20.0 2 30.0 3 - - 40.0 4 - -
Non-NCM 21.6 8 18.9 7 6.4 2 8.1 3 43.2 16 2.7 1
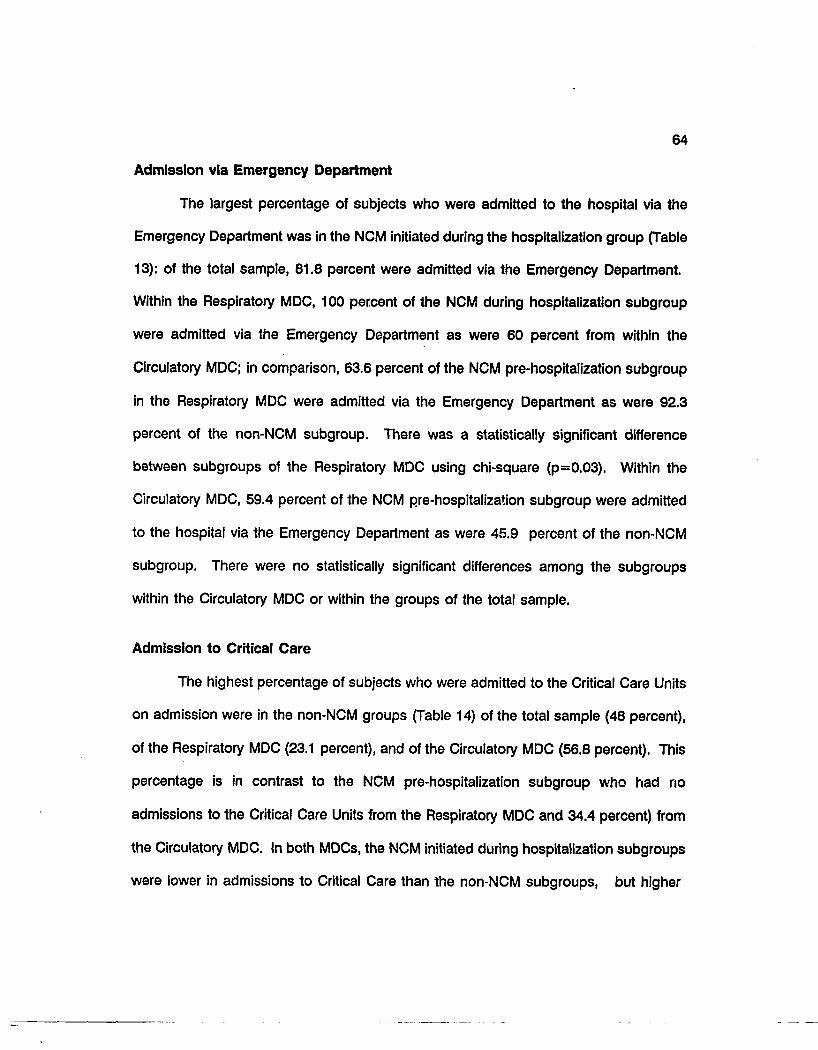
64
Admission via Emergency Department
The largest percentage of subjects who were admitted to the hospital via the
Emergency Department was in the NCM initiated during the hospitalization group (Table
13): of the total sample, 81.8 percent were admitted via the Emergency Department.
Within the Respiratory MDC, 100 percent of the NCM during hospitalization subgroup
were admitted via the Emergency Department as were 60 percent from within the
Circulatory MDC; in comparison, 63.6 percent of the NCM pre-hospitalization subgroup
in the Respiratory MDC were admitted via the Emergency Department as were 92.3
percent of the non-NCM subgroup. There was a statistically significant difference
between subgroups of the Respiratory MDC using chi-square (p=0.03). Within the
Circulatory MDC, 59.4 percent of the NCM pre-hospitalization subgroup were admitted
to the hospital via the Emergency Department as were 45.9 percent of the non-NCM
subgroup. There were no statistically significant differences among the subgroups
within the Circulatory MDC or within the groups of the total sample.
Admission to Critical Care
The highest percentage of subjects who were admitted to the Critical Care Units
on admission were in the non-NCM groups (Table 14) of the total sample (48 percent),
of the Respiratory MDC (23.1 percent), and of the Circulatory MDC (56.8 percent). This
percentage is in contrast to the NCM pre-hospitalization subgroup who had no
admissions to the Critical Care Units from the Respiratory MDC and 34.4 percent) from
the Circulatory MDC. In both MDCs, the NCM initiated during hospitalization subgroups
were lower in admissions to Critical Care than the non-NCM subgroups, but higher
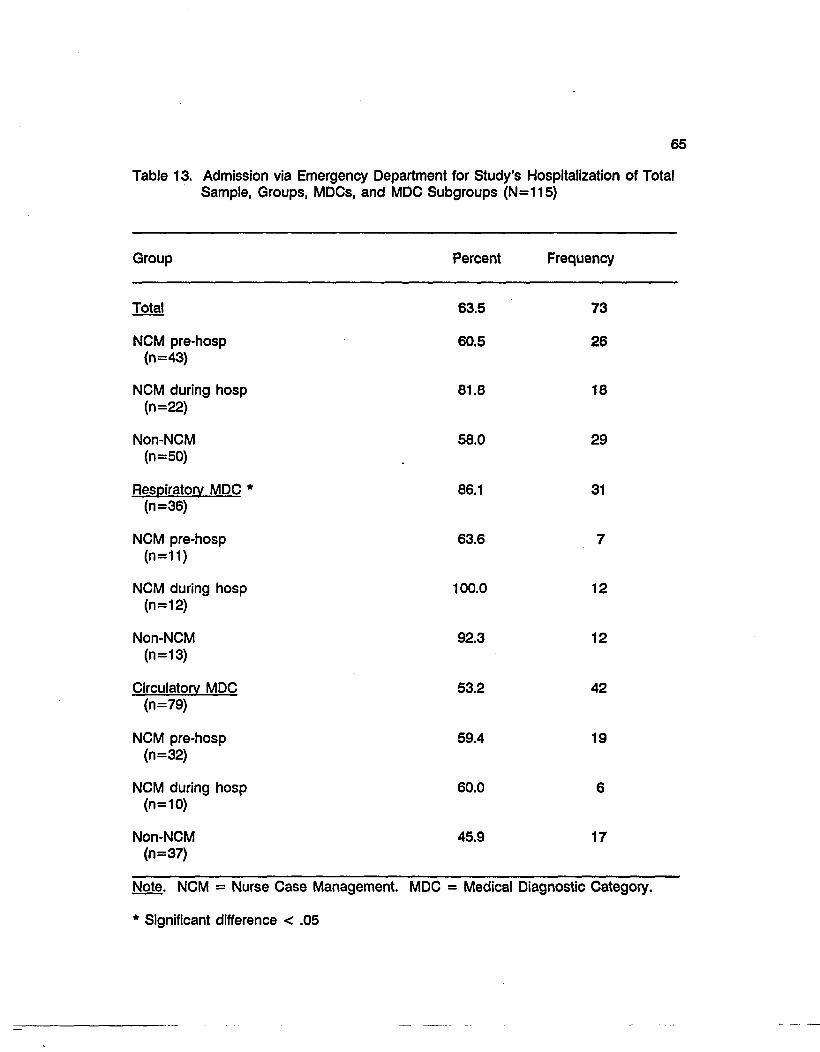
65
Table 13. Admission via Emergency Department for Study's Hospitalization of Total Sample, Groups, MDCs, and MDC Subgroups (N=115)
Group Percent Frequency
Total 63.5 73
NCM pre-hosp 60.5 26 (n=43)
NCM during hosp 81.8 18 (n=22)
Non-NCM 58.0 29 (n=50)
Respiratory MDC * 86.1 31 (n=36)
NCM pre-hosp 63.6 7 (n=11)
NCM during hosp 100.0 12 (n=12)
Non-NCM 92.3 12 (n=13)
Circulatory MDC 53.2 42 (n=79)
NCM pre-hosp 59.4 19 (n=32)
NCM during hosp 60.0 6 (n=10)
Non-NCM 45.9 17 (n=37)
Note. NCM = Nurse Case Management. MDC = Medical Diagnostic Category.
* Significant difference < .05
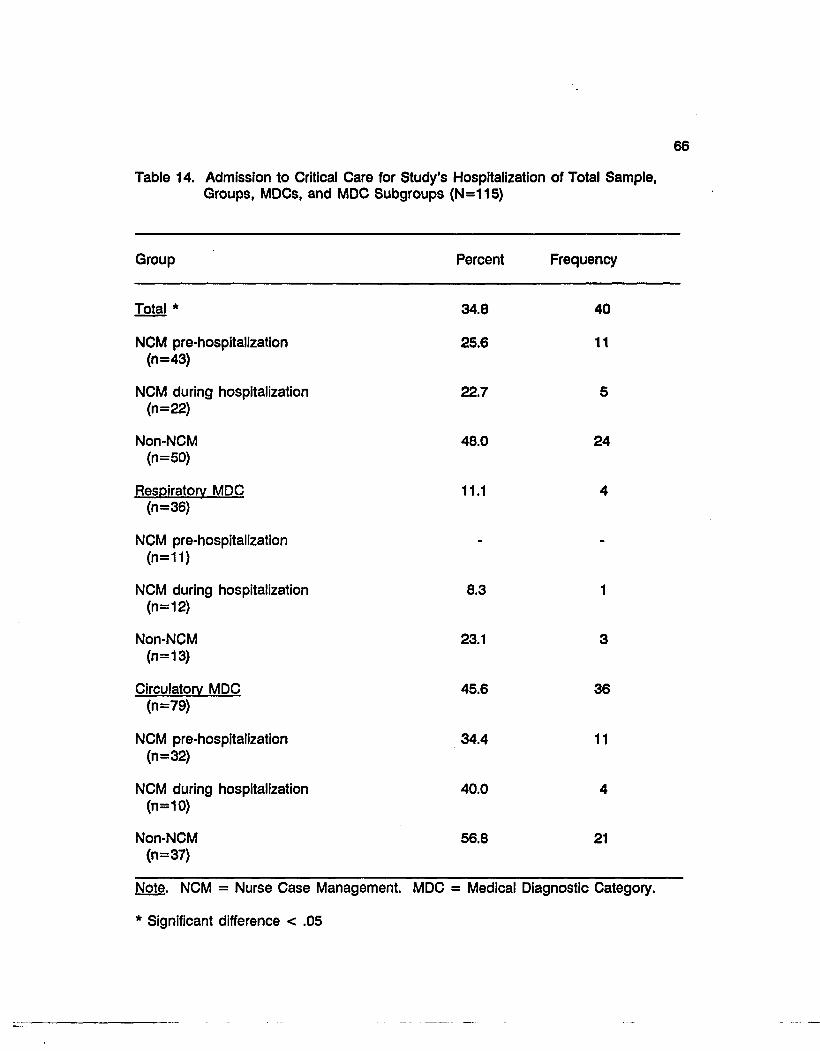
66
Table 14. Admission to Critical Care for Study's Hospitalization of Total Sample, Groups, MDCs, and MDC Subgroups (N=115)
Group Percent Frequency
Total * 34.8 40
NCM pre-hospitalization 25.6 11 (n=43)
NCM during hospitalization 22.7 5 (n=22)
Non-NCM 48.0 24 (n=50)
Respiratory MDC 11.1 4 (n=36)
NCM pre-hospitalization (n=11)
NCM during hospitalization 8.3 1 (n=12)
Non-NCM 23.1 3 (n=13)
Circulatory MDC 45.6 36 (n=79)
NCM pre-hospitalization 34.4 11 (n=32)
NCM during hospitalization 40.0 4 (n=10)
Non-NCM 56.8 21 (n=37)
Note. NCM = Nurse Case Management. MDC = Medical Diagnostic Category.
* Significant difference < .05
67
in admissions to critical care than the NCM pre-hospitalization subgroup. There were
statistically significant differences among the groups within the total sample (p=0.03)
and no statistically significant differences among the subgroups of the MDCs.
Number of Hospitalizations 60 Days Prior to Study's Hospitalization
The NCM pre-hospitalization group had the highest percentage of
hospitalizations in the 60 days previous to the hospitalization (Table 15). Of the total
sample, 30.2 percent of the NCM pre-hospitalization group had one hospitalization and
16.3 percent had two hospitalizations. There was a statistically significant difference
(p=0.002) between the NCM pre-hospitalization group and the non-NCM group of the
total sample. The highest number of hospitalizations 60 days prior to the study's
hospitalization was two. Within the Respiratory MDC, the NCM initiated during
hospitalization subgroup had 41.7 percent, with one hospitalization and none had two
hospitalizations; 27.3 percent of the NCM pre-hospitalization subgroup had one
hospitalization and 27.3 percent had two hospitalizations; and 15.4 percent of the non-
NCM subgroup had one hospitalization and none had two hospitalizations. There was
a statistically significant difference (p=0.04) within the Respiratory MDC, between the
NCM pre-hospitalization subgroup and the non-NCM subgroup. Within the Circulatory
MDC, the NCM pre-hospitalization subgroup had 31.3 percent with one hospitalization
and 7.6 percent with two' hospitalizations; the NCM initiated during hospitalization
subgroup had the highest percentage (20 percent) having two hospitalizations. There
was also a statistically significant difference (p=0.04) between the NCM pre-
hospitalization subgroup and the non-NCM subgroup within the Respiratory MDC.

68
Table 15. Number of Hospitalizations in the 60 Days Previous to Admission of Total Sample, Groups, MDCs, and MDC Subgroups (N=115)
Group % % %
Total1 68.7 79 23.5 27 7.8 9
NCM pre-hosp 53.5 23 30.2 13 16.3 7 NCM during hosp 68.2 15 22.7 5 9.1 2 Non-NCM 82.0 41 18.0 9 -
Respiratory MDC2 63.9 23 27.8 10 8.3 3
NCM pre-hosp 45.5 5 27.3 3 27.3 3 NCM during hosp 58.3 7 41.7 5 -Non-NCM 84.6 11 15.4 2 -
Circulatory MDC3 70.9 56 21.5 17 7.6 6
NCM pre-hosp 56.3 18 31.3 10 12.5 4 NCM during hosp 80.0 8 - - 20.0 2 Non-NCM 81.1 30 18.9 7 - -
Note. ANOVA significant at < .05
1 Significant difference between NCM pre-hospitalization group and non-NCM group of the total sample.
2 Significant difference between the NCM pre-hospitalization subgroup and the non-NCM subgroup of the Respiratory MDC.
3 Significant difference between the NCM pre-hospitalization subgroup and the non-NCM subgroup of the Circulatory MDC.
69
Admissions via the Emergency Department in the 60 Days Prior to Study's Hospitalization
Of the total sample and the Respiratory and Circulatory MDCs, the NCM pre-
hospitalization group had the most admissions via the Emergency Department in the
60 days prior to the current hospitalization (Table 16). Twenty three percent of the pre-
hospitalization group of the total sample had one admission via the Emergency
Department and 2.3 percent had two admissions. This compared with 12 percent of
the non-NCM admissions having one admission and none having two admissions. Only
4.5 percent of the NCM initiated during hospitalization had two admissions and none
had one admission. Within the Respiratory MDC, 27.3 percent of the NCM pre-
hospitalization subgroup had one admission and 9.1 percent had two. None of the
NCM initiated during hospitalization subgroup were admitted via the Emergency
Department while 15.4 percent of the non-NCM subgroup had one admission via the
Emergency Department. Within the Circulatory MDC, 21.9 percent of the NCM pre-
hospitalization had one admission via the Emergency Department while 10.8 percent of
the non-NCM subgroup had one admission via the Emergency Department. Ten
percent of the NCM initiated during hospitalization subgroup had two admissions via
the Emergency Department. There were no statistically significant differences between
the groups of the total sample or between the subgroups of the MDCs.
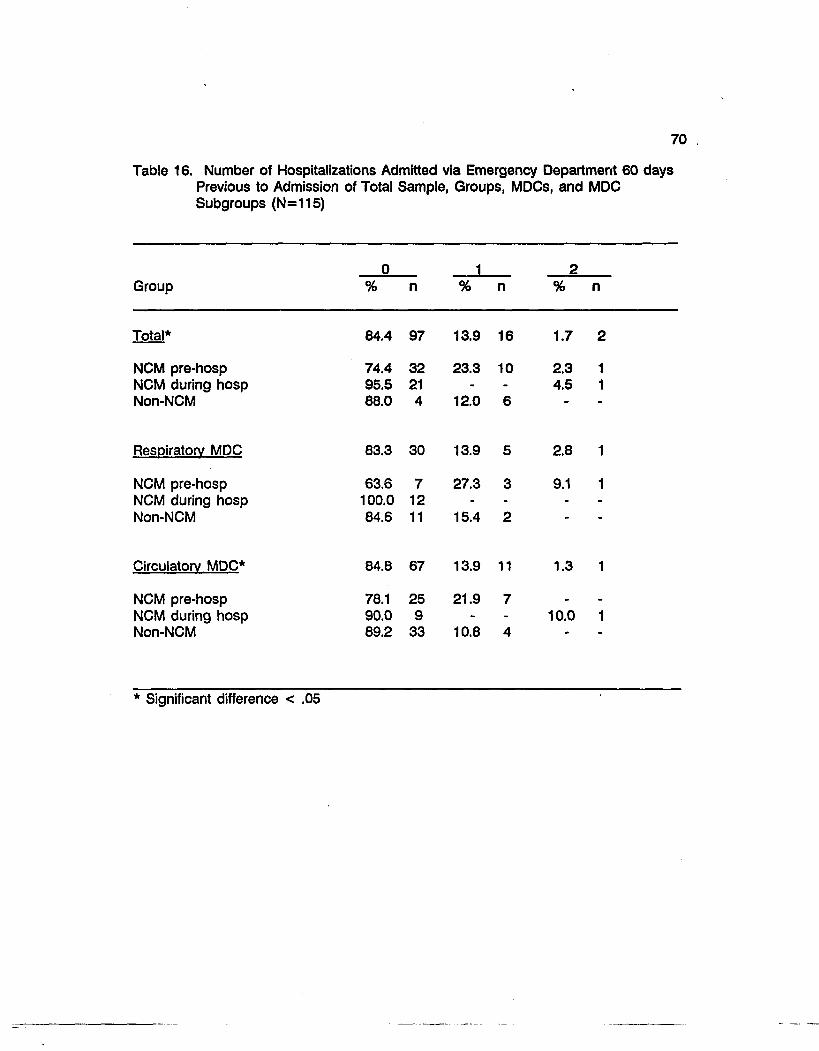
70
Table 16. Number of Hospitalizations Admitted via Emergency Department 60 days Previous to Admission of Total Sample, Groups, MDCs, and MDC Subgroups (N=115)
Group 0 1 2
Group % n % n % n
Total* 84.4 97 13.9 16 1.7 2
NCM pre-hosp 74.4 32 23.3 10 2.3 1 NCM during hosp 95.5 21 - - 4.5 1 Non-NCM 88.0 4 12.0 6 " "
Resoiratorv MDC 83.3 30 13.9 5 2.8 1
NCM pre-hosp 63.6 7 27.3 3 9.1 1 NCM during hosp 100.0 12 - - - -
Non-NCM 84.6 11 15.4 2 -
Circulatorv MDC* 84.8 67 13.9 11 1.3 1
NCM pre-hosp 78.1 25 21.9 7 - -
NCM during hosp 90.0 9 - - 10.0 1 Non-NCM 89.2 33 10.8 4 - -
* Significant difference < .05

71
Number of Emergency Department Visits 60 Days Prior to Hospitalization
The NCM initiated during hospitalization group had the most visits to the
Emergency Department in the 60 days prior to the study's hospitalization (Table 17).
Sixteen and seventenths percent of the Respiratory MDC had one visit and 20 percent
of the Circulatory MDC had one visit. The NCM pre-hospitalization subgroup had 9.1
percent in the Respiratory MDC who had two visits to the Emergency Department and,
in the Circulatory MDC, 15.6 percent had one visit and 3.1 percent had two visits. The
non-NCM subgroup had the lowest percentage of Emergency Department visits. There
were no statistically significant differences among the groups of the total sample and
the subgroups of the MDCs.
Description of the Variables
Number of Weeks of NCM
Table 18 illustrates the mean, standard deviation and range of the number of
weeks of NCM of the NCM pre-hospitalization group of the total sample and the
subgroups of the MDCs. The NCM pre-hospitalization subgroup within the Respiratory
MDC had the largest mean number of weeks of NCM at 47.36 weeks. It had a range
of seven to seventy eight weeks. Its sample was considered small (n=11) compared
to the sample size (n=32) of the Circulatory MDC which had a mean number of weeks
of NCM of 37.69 with a range of one to eighty nine weeks.
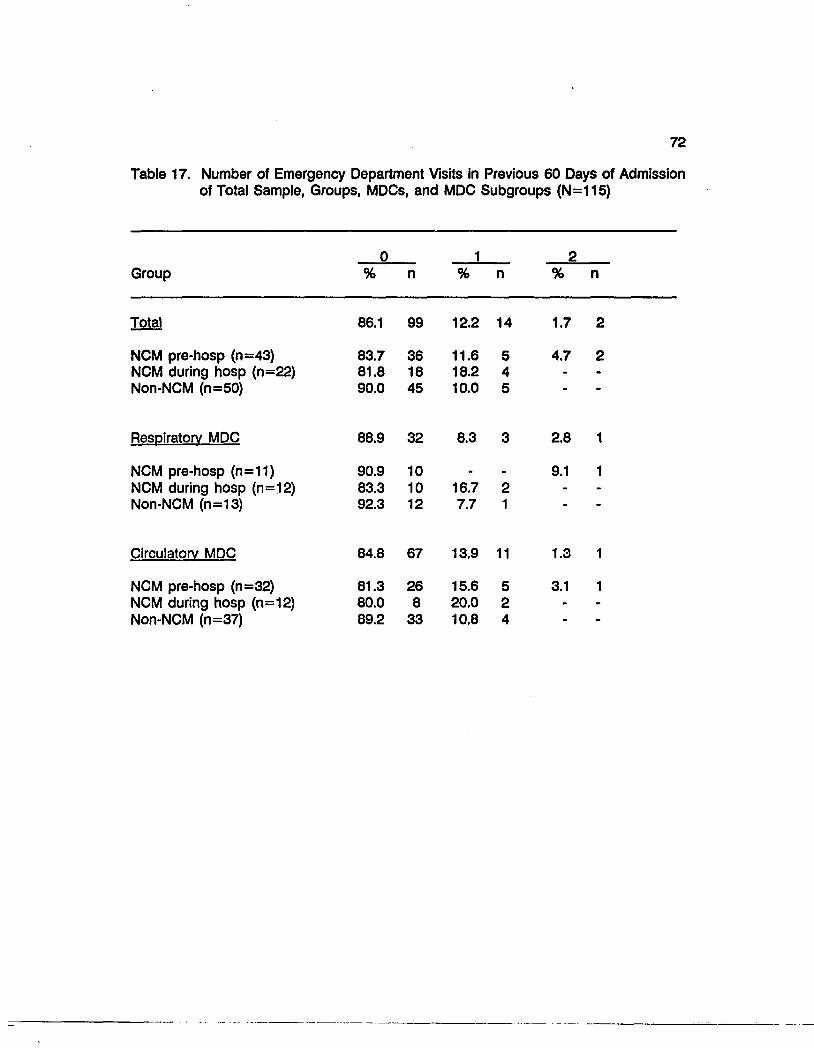
72
Table 17. Number of Emergency Department Visits in Previous 60 Days of Admission of Total Sample, Groups, MDCs, and MDC Subgroups (N=115)
Group % n % % n
Total 86.1 99 12.2 14 1.7 2
NCM pre-hosp (n=43) 83.7 36 11.6 5 4.7 2 NCM during hosp (n=22) 81.8 18 18.2 4 - -
Non-NCM (n=50) 90.0 45 10.0 5 ~ ~
ResDiratorv MDC 88.9 32 8.3 3 2.8 1
NCM pre-hosp (n=11) 90.9 10 - - 9.1 1 NCM during hosp (n=12) 83.3 10 16.7 2 - -
Non-NCM (n=13) 92.3 12 7.7 1 "
Circulatorv MDC 84.8 67 13.9 11 1.3 1
NCM pre-hosp (n=32) 81.3 26 15.6 5 3.1 1 NCM during hosp (n=12) 80.0 8 20.0 2 - -
Non-NCM (n=37) 89.2 33 10.8 4 - -
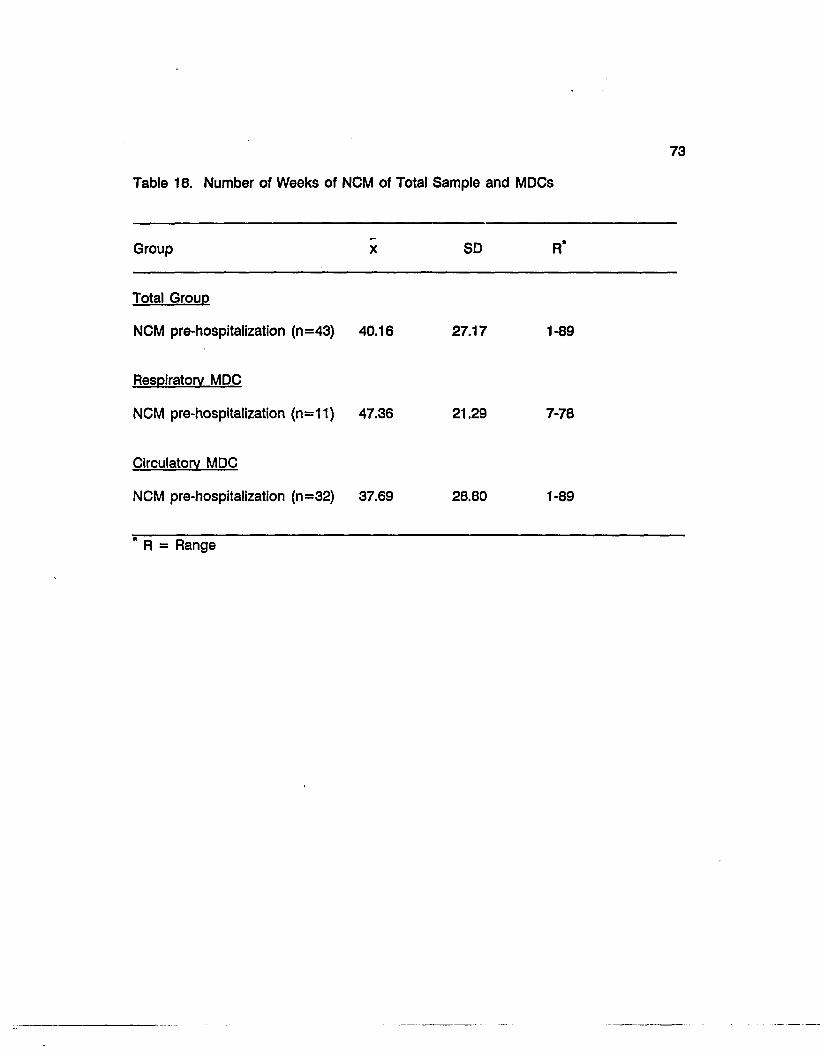
73
Table 18. Number of Weeks of NCM of Total Sample and MDCs
Group x SD R*
Total Group
NCM pre-hospitalization (n=43) 40.16 27.17 1-89
Respiratory MDC
NCM pre-hospitalization (n=11) 47.36 21.29 7-78
Circulatory MDC
NCM pre-hospitalization (n=32) 37.69 28.80 1-89
* R = Range
74
Number of NCM Contacts
The mean and standard deviation of the number of NCM contacts are displayed
in Table 19. The nurse case managed patients in the Respiratory MDC had the larger
mean of NCM contacts within six months (13.91) of the study's initiation. There was
a larger standard deviation in the Respiratory MDC which suggests that these patients
may have a larger pattern of chronicity of illness requiring additional contacts.
Length of Stay
The actual mean LOS, as measured by number of patient days, of all groups is
illustrated in Table 20. Additional data recorded is the HCFA average LOS and the
deviation of each group's actual mean LOS from the HCFA average LOS. In the total
sample, the NCM initiated during hospitalization group had the longest mean LOS
(10.32); the NCM pre-hospitalization group had 6.35 as a mean LOS; and the non-NCM
group had the shortest mean LOS (5.56). Within the Respiratory MDC, the NCM
initiated during the hospitalization subgroup also had the longest mean LOS (11.75);
the non-NCM subgroup had the next to the longest mean LOS (10.23) while the NCM
pre-hospitalization subgroup had the shortest mean LOS (6.55). Within the Circulatory
MDC, the NCM initiated during hospitalization subgroup again had the longest mean
LOS (8.60); the NCM pre-hospitalization subgroup had the second largest mean LOS
(6.28); and the non-NCM subgroup had the shortest mean LOS (3.92). The deviation
of LOS from the mean HCFA LOS is discussed in the Presentation and Discussion of
the Findings section.
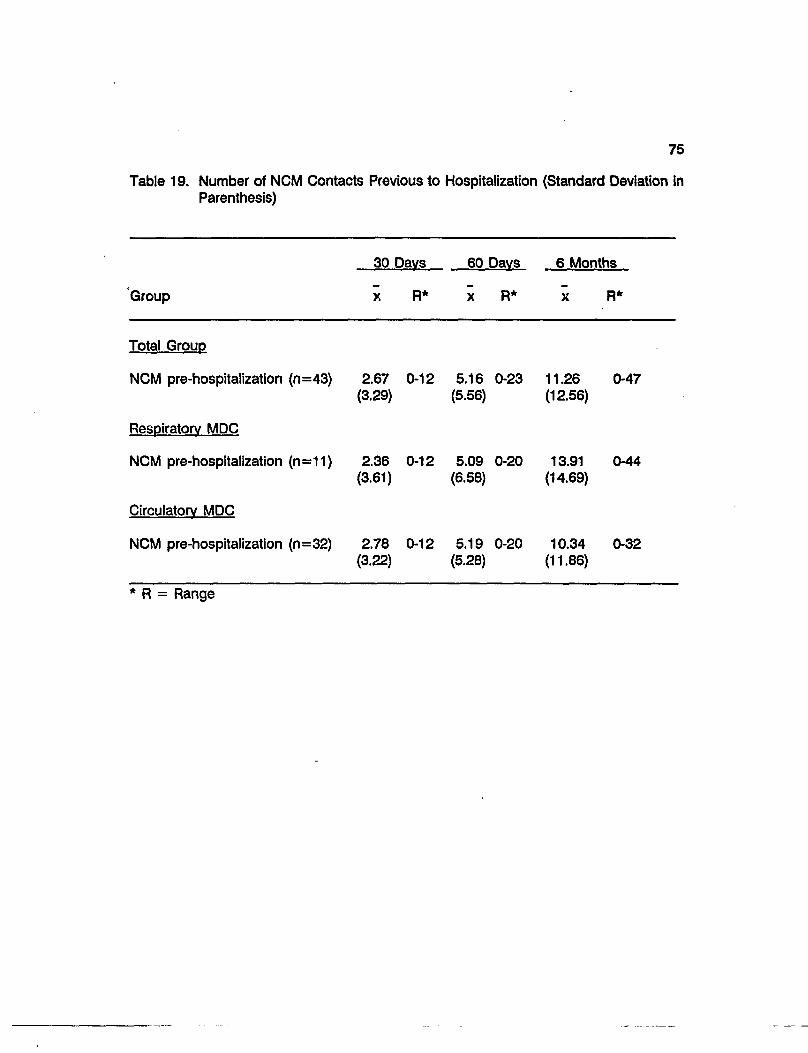
75
Table 19. Number of NCM Contacts Previous to Hospitalization (Standard Deviation in Parenthesis)
30 Days 60 Days 6 Months
Group x R* x R* x R*
Total Group
NCM pre-hospitalization (n=43) 2.67 0-12 5.16 0-23 11.26 0-47 (3.29) (5.56) (12.56)
Respiratory MDC
NCM pre-hospitalization (n=11) 2.36 0-12 5.09 0-20 13.91 0-44 (3.61) (6.58) (14.69)
Circulatory MDC
NCM pre-hospitalization (n=32) 2.78 0-12 5.19 0-20 10.34 0-32 (3.22) (5.28) (11.86)
* R = Range

Table 20. Length of Stay and Deviation from HCFA LOS of Total Sample, Groups, MDCs, and MDC Subgroups (Standard Deviation in Parenthesis)
Groups x LOS x HCLOS x DLOS
Total 6.77 5.21 1.51 (N=115) (5.26) (1.51) (4.70)
NCM pre-hosp 6.35 5.05 1.30 (n=43) (4.24) (1.25) (4.01)
NCM during hosp 10.32 5.88 4.44 (n=22) (5.02) (1.64) (4.84)
Non-NCM 5.56 5.04 0.52 (n=50) (5.56) (1.52) (4.78)
ResDiratorv MDC 9.61 6.23 3.38 (n=36) (5.93) (1.15) (5.56)
NCM pre-hosp 6.55 5.93 0.62 (n=11) (3.24) (0.68) (3.45)
NCM during hosp 11.75 6.51 5.24 (n=12) (4.54) (1.19) (4.54)
Non-NCM 10.23 6.24 3.99 (n=13) (7.83) (1.41) (7.10)
Circulatorv MDC 5.46 4.74 0.73 (n=79) (4.39) (1.42) (4.03)
NCM pre-hosp 6.28 4.74 1.54 (n=32) (4.57) (1.39) (4.20)
NCM during hosp 8.60 5.13 3.47 (n=10) (5.25) (1.85) (5.24)
Non-NCM 3.92 4.62 -0.71 (n=37) (3.31) (1.34) (2.89)
Note. LOS = length of stay HCLOS = HCFA length of stay DLOS = deviation length of stay
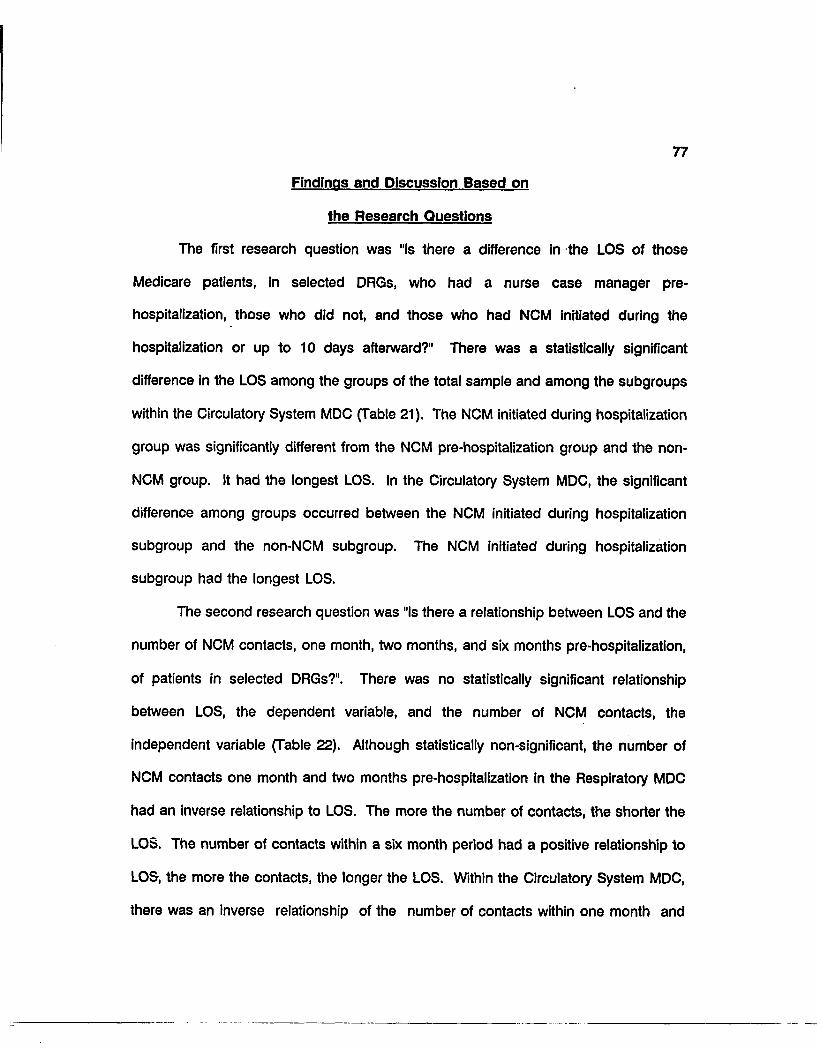
77
Findings and Discussion Based on
the Research Questions
The first research question was "Is there a difference in the LOS of those
Medicare patients, in selected DRGs, who had a nurse case manager pre-
hospitalization, those who did not, and those who had NCM initiated during the
hospitalization or up to 10 days afterward?" There was a statistically significant
difference in the LOS among the groups of the total sample and among the subgroups
within the Circulatory System MDC (Table 21). The NCM initiated during hospitalization
group was significantly different from the NCM pre-hospitalization group and the non-
NCM group. It had the longest LOS. In the Circulatory System MDC, the significant
difference among groups occurred between the NCM initiated during hospitalization
subgroup and the non-NCM subgroup. The NCM initiated during hospitalization
subgroup had the longest LOS.
The second research question was "Is there a relationship between LOS and the
number of NCM contacts, one month, two months, and six months pre-hospitalization,
of patients in selected DRGs?". There was no statistically significant relationship
between LOS, the dependent variable, and the number of NCM contacts, the
independent variable (Table 22). Although statistically non-significant, the number of
NCM contacts one month and two months pre-hospitalization in the Respiratory MDC
had an inverse relationship to LOS. The more the number of contacts, the shorter the
LOS. The number of contacts within a six month period had a positive relationship to
LOS, the more the contacts, the longer the LOS. Within the Circulatory System MDC,
there was an inverse relationship of the number of contacts within one month and

78
Table 21. Analysis of Variance of LOS and the Groups within Total Sample and the Subgroups within the MDCs.
Source of Variation Sum of Squares df
Mean Square Probability
Total (N=115)1
Between groups Within groups Total
357.80 2796.86 3154.66
2 178.90 12 24.97
114
7.16 .001
Respiratory MDC (n=36)
Between groups Within groups Total
163.27 1067.29 1230.56
2 33 35
81.64 32.34
2.52 .096
Circulatory MDC (n=79)2
Between groups Within groups Total
208.05 1291.63 1499.67
2 76 78
104.02 17.00
6.12 .003
Note. ANOVA Significant < .05
1 The NCM initiated during hospitalization group is significantly different from the NCM pre-hospitalization group and the non-NCM group in the total sample.
2 The NCM initiated during hospitalization subgroup is significantly different from the non-NCM subgroup in the Circulatory MDC.
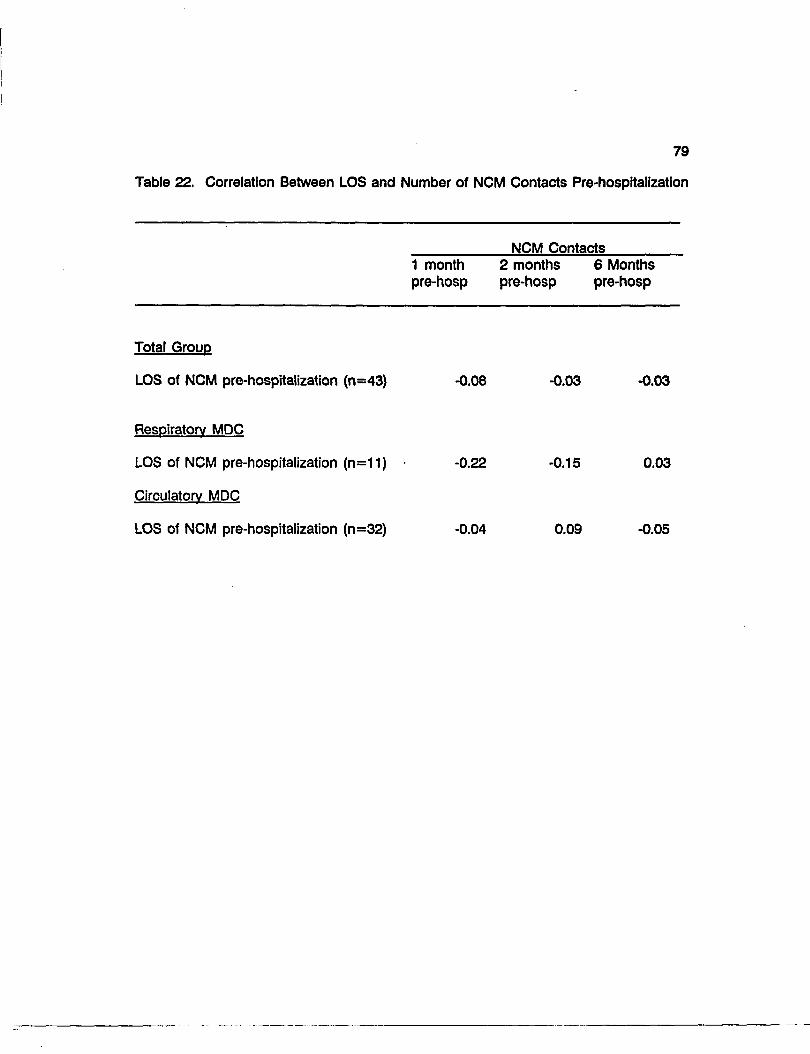
79
Table 22. Correlation Between LOS and Number of NCM Contacts Pre-hospitalization
NCM Contacts 1 month 2 months 6 Months pre-hosp pre-hosp pre-hosp
Total Group
LOS of NCM pre-hospitalization (n=43) -0.08 -0.03 -0.03
Respiratory MDC
LOS of NCM pre-hospitalization (n=11) -0.22 -0.15 0.03
Circulatory MDC
LOS of NCM pre-hospitalization (n=32) -0.04 0.09 -0.05
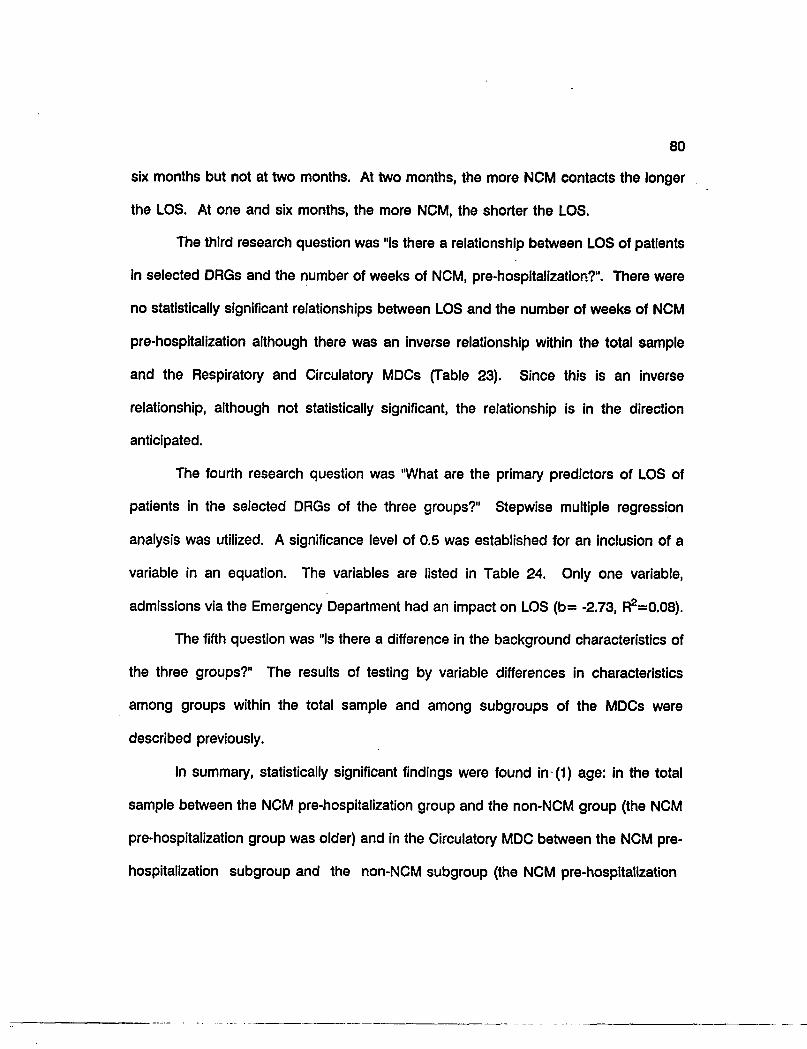
80
six months but not at two months. At two months, the more NCM contacts the longer
the LOS. At one and six months, the more NCM, the shorter the LOS.
The third research question was "Is there a relationship between LOS of patients
in selected DRGs and the number of weeks of NCM, pre-hospitalization?". There were
no statistically significant relationships between LOS and the number of weeks of NCM
pre-hospitalization although there was an inverse relationship within the total sample
and the Respiratory and Circulatory MDCs (Table 23). Since this is an inverse
relationship, although not statistically significant, the relationship is in the direction
anticipated.
The fourth research question was "What are the primary predictors of LOS of
patients in the selected DRGs of the three groups?" Stepwise multiple regression
analysis was utilized. A significance level of 0.5 was established for an inclusion of a
variable in an equation. The variables are listed in Table 24. Only one variable,
admissions via the Emergency Department had an impact on LOS (b= -2.73,1^=0.08).
The fifth question was "Is there a difference in the background characteristics of
the three groups?" The results of testing by variable differences in characteristics
among groups within the total sample and among subgroups of the MDCs were
described previously.
In summary, statistically significant findings were found in (1) age: in the total
sample between the NCM pre-hospitalization group and the non-NCM group (the NCM
pre-hospitalization group was older) and in the Circulatory MDC between the NCM pre-
hospitalization subgroup and the non-NCM subgroup (the NCM pre-hospitalization
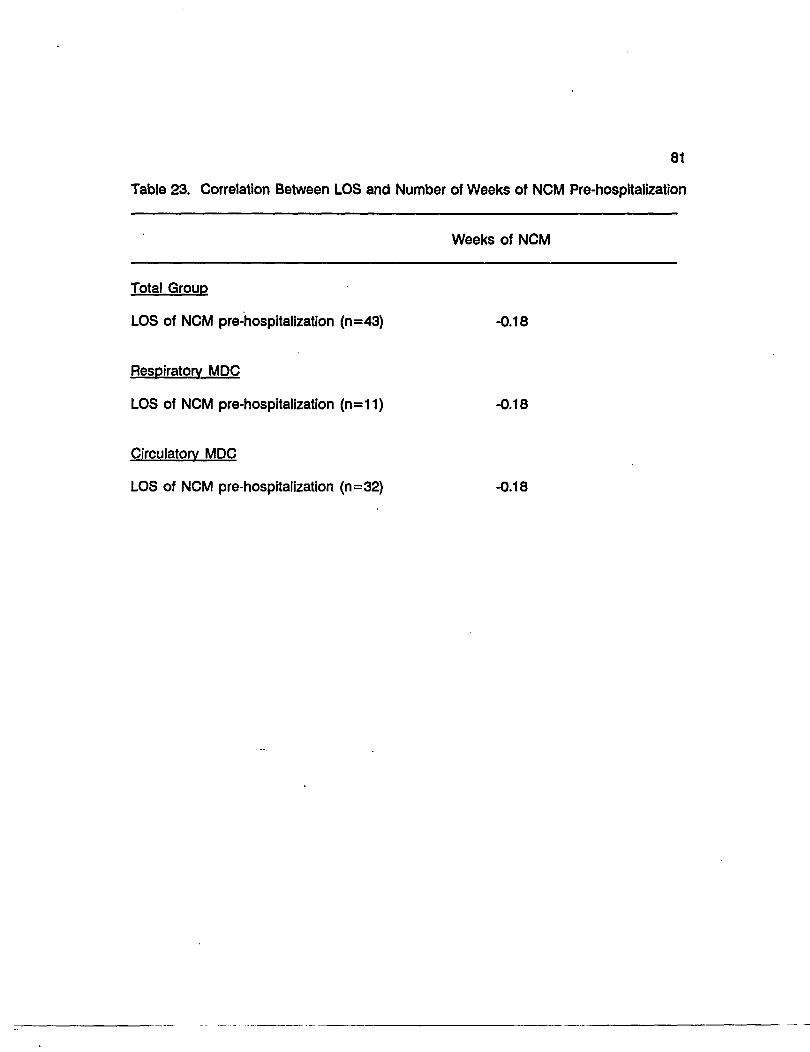
81
Table 23. Correlation Between LOS and Number of Weeks of NCM Pre-hospitalization
Weeks of NCM
Total Group
LOS of NCM pre-hospitalization (n=43) -0.18
Respiratory MDC
LOS of NCM pre-hospitalization (n=11) -0.18
Circulatory MDC
LOS of NCM pre-hospitalization (n=32) -0.18
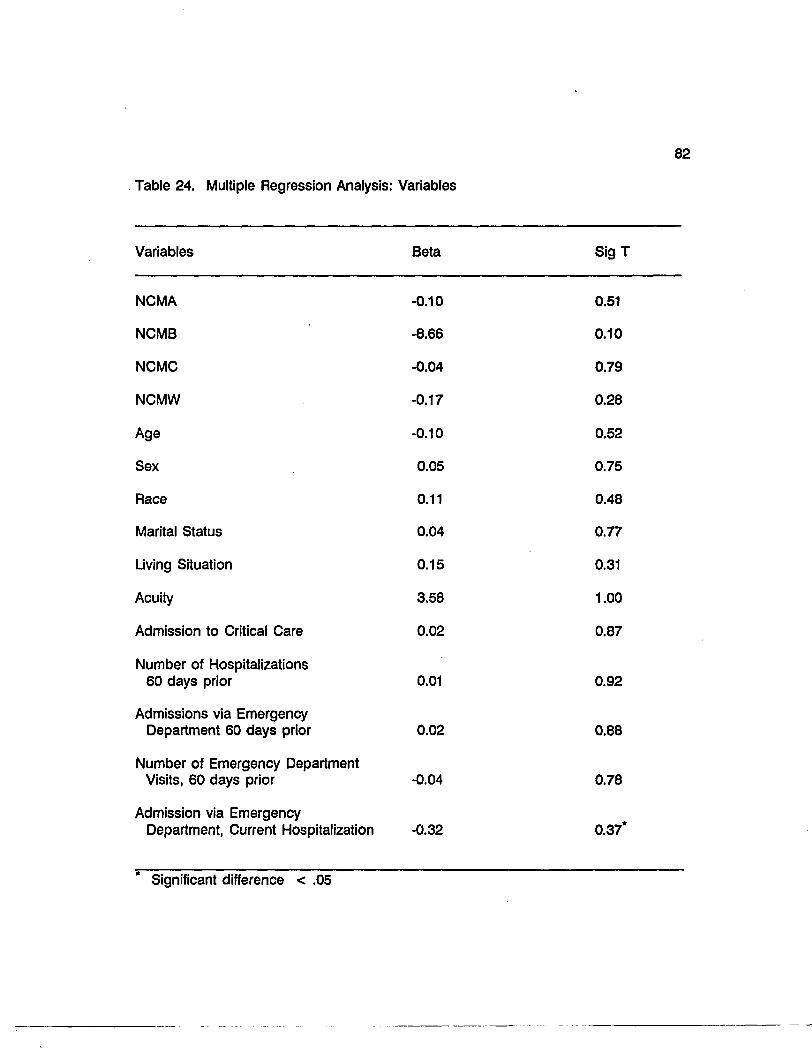
82
Table 24. Multiple Regression Analysis: Variables
Variables Beta Sig T
NCMA -0.10 0.51
NCMB -8.66 0.10
NCMC -0.04 0.79
NCMW -0.17 0.28
Age -0.10 0.52
Sex 0.05 0.75
Race 0.11 0.48
Marital Status 0.04 0.77
Living Situation 0.15 0.31
Acuity 3.58 1.00
Admission to Critical Care 0.02 0.87
Number of Hospitalizations 60 days prior 0.01 0.92
Admissions via Emergency Department 60 days prior 0.02 0.88
Number of Emergency Department Visits, 60 days prior -0.04 0.78
Admission via Emergency Department, Current Hospitalization -0.32 0.37"
Significant difference < .05
83
group was older), (2) number of subjects who were admitted via the Emergency
Department: in the Respiratory MDC between the NCM initiated during hospitalization
subgroup and the other two subgroups (the NCM initiated during hospitalization
subgroup had more admissions via the Emergency Department, and (3) admissions to
the Critical Care Units: in the total sample between the non-NCM group and the other
two groups (the non-NCM group had more admissions to critical care). Only one
background variable, admission via the Emergency Department, was significant as a
predictor of LOS.
Presentation and Discussion of Additional Findings
Correlation of LOS with Background Variables
The correlations of LOS with the background variables produced statistically
significant relationships for age, living situation, admission acuity, admission via the
Emergency Department, and number of hospitalizations admitted via the Emergency
Department 60 days previous to the study's hospitalization. For the total sample within
the non-NCM group, the older the patient was the longer the LOS. Within the total
sample and the Circulatory MDC, in the NCM initiated during hospitalization subgroup,
the younger the patient, the longer the LOS.
Living situation had a statistically significant relationship with LOS in the NCM
pre-hospitalization subgroup within the Respiratory System MDC. That is, if the patient
lived alone, the LOS was longer. Admission acuity had only one statistically significant
relationship: within the non-NCM subgroup in the Circulatory System MDC, the higher
the admission acuity, the longer the LOS.
84
Length of stay had a statistically significant relationship with admission via the
Emergency Department by the NCM pre-hospitalization group within the total sample
and the Circulatory System MDC: if admitted via the Emergency Department, there was
a shorter LOS. The non-NCM group's LOS within the total sample and the Circulatory
System MDC were longer for hospitalizations admitted via the Emergency Department
60 days previous to the study's hospitalization. Although not statistically significant, the
NCM initiated during hospitalization group of the total sample had a longer LOS, but
a shorter LOS in the Circulatory MDC if admitted via the Emergency Department. The
NCM pre-hospitalization subgroup of the Respiratory system had a longer LOS when
admitted via the Emergency Department while the non-NCM group had a shorter LOS.
Deviation of LOS from HCFA LOS
When the mean LOS for the DRGs in each group was subtracted from the mean
LOS of the same DRGs in each group as assigned by HCFA, all of the subjects' actual
mean LOSs were higher than the mean HCFA LOSs except for the mean LOS of the
non-NCM subgroup within the Circulatory MDC (Table 20). An analysis of variance
among the subgroups of the total sample and the subgroups of the MDCs was
performed (Table 25). A statistically significant difference was found for the total group
and the Circulatory System MDC. The smallest DLOS was in the Circulatory MDC by
the non-NCM subgroup. For both analyses the difference was between the NCM
initiated during hospitalization group and the non-NCM group. The non-NCM group
had a shorter mean LOS than the mean HCFA LOS as compared to the longer mean
LOS of the NCM initiated during hospitalization group. There was also a statistically

85
Table 25. Analysis of Variance: DLOS
Sum of Mean F F Source DF Squares Square Ratio Probability
Circulatory MDC (n=78)*
Between groups 2 172.18 86.09 5.98 .004 Within groups 76 1095.01 14.41 Total 78 1267.19
Total Group (n=115)*
Between groups 2 239.37 119.68 5.87 .004 Within groups 112 2282.57 20.38 Total 114 2521.94
* ANOVA significant at < .05. Significant differences between the NCM initiated during hospitalization groups and the non-NCM groups in both the total sample and the Circulatory MDC.
86
significant difference of DLOS (0.004) within the total sample. The NCM initiated during
hospitalization group had a significant difference from both of the other groups; it was
larger. The non-NCM subgroup in the Respiratory MDC had a much larger DLOS (a
difference of 2.4 days) than the NCM pre-hospitalization subgroup but a shorter DLOS
(a difference of 1.3 days) than the NCM initiated during hospitalization subgroup.
Case Mix Index of Groups within the Total Sample and the MDCs
A case mix index refers to the average weight of each DRG of each MDC which
is assigned to the DRG by HCFA. Appendices D, E, and F summarize the distribution
of DRGs and their HCFA Weights within the groups of the total sample and the
subgroups within the Respiratory and Circulatory MDCs. The final case mix index for
the total sample, the Respiratory MDC, and the Circulatory MDC was calculated by
adding the "sum of the HCFA Weights" and then dividing that total by the number of
cases. This calculation was done to identify if there were differences among the groups
because of some variance in the types of DRGs within each group. The results of this
calculation were fairly close. The case mix index of the groups within the total sample
was 0.85 for the NCM pre-hospitalization subgroup, 0.88 for the non-NCM subgroup,
with the highest being 1.03 for the NCM initiated during hospitalization subgroup.
Within the Respiratory MDC the NCM pre-hospitalization subgroup was 1.01, the non-
NCM subgroup was 1.04, and the NCM initiated during hospitalization subgroup was
highest with 1.13. The pattern continues within the Circulatory MDC with the NCM pre-
hospitalization subgroup having the lowest case mix index of 0.80, the non-NCM
subgroup having 0.82, and the NCM initiated during hospitalization subgroup having the
87
highest at 0.97. From the case mix index calculation it was identified that the NCM
initiated during hospitalization group of the total sample and the Respiratory and
Circulatory MDCs were sicker than the NCM pre-hospitalization group and the non-
NCM group. In the Circulatory and Respiratory MDCs, the non-NCM subgroup was
slightly sicker than the NCM pre-hospitalization subgroup.
Background Variables and NCM Number of Contacts
When a plot was obtained of LOS with the number of NCM contacts within six
months (NCMC), a "clumping" of 24 (58 percent) of the 43 patients was pictured (Figure
2). This "clumping" was identified to include the NCM contacts number 15 and below
and the LOS of eight and below. The similarities of background characteristics of this
NCM group were examined. The results of this analysis delineated that 87.5 percent
were 70 years of age or older, 79.2 percent were 75 years or older, and 45.8 percent
were 80 years or older. Seventy five percent were in the Circulatory System MDC, 66.7
percent were admitted to the hospital via the Emergency Department, 58.3 percent were
widowed, 58.3 percent were female, 37.5 percent lived alone, and 29.2 percent were
admitted to the Critical Care Units. It was also clarified that 79.2 percent of these
patients had NCM for 23 weeks or more, pre-hospitalization.
Summary
A description of the total sample, the three groups (NCM pre-hospitalization,
NCM initiated during or within 10 days after hospitalization, and non-NCM) within the
total sample, and the three subgroups within the two MDCs (Respiratory and Circulatory
System) were presented. The three variables, number of weeks of NCM, number of
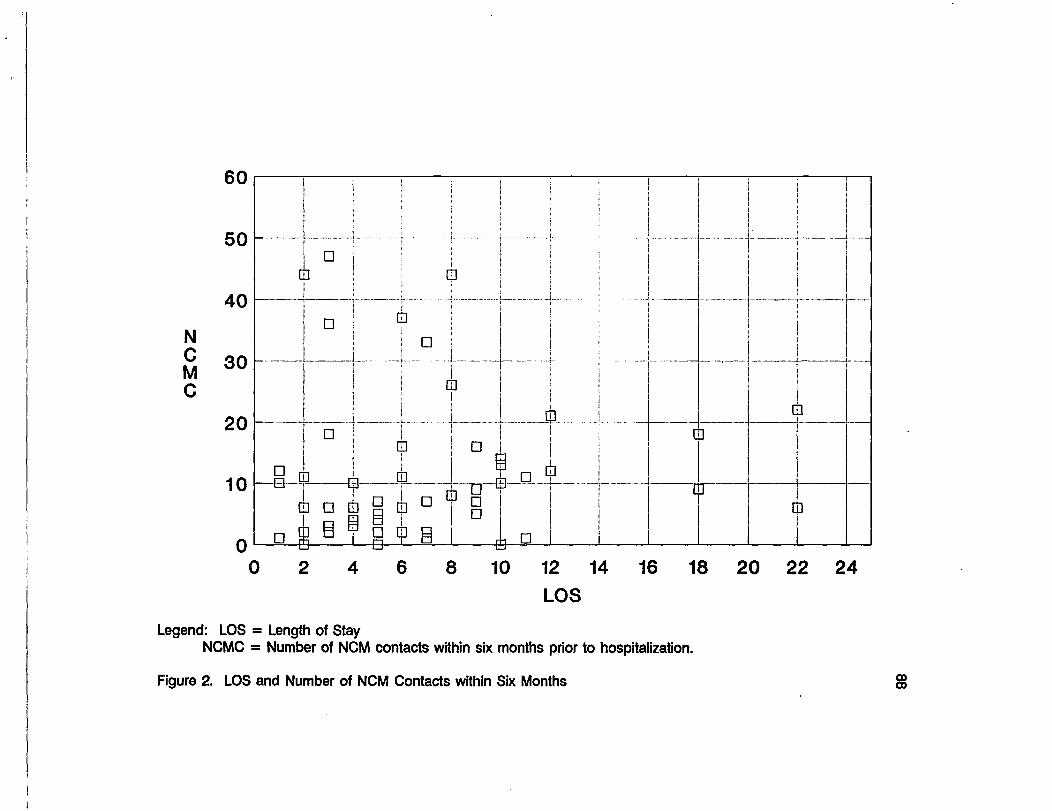
60
N C M C
50
40
30
20
10
0
• -0-
•
• m
m
•
•
•
•
-s
m I
m
• • • R m D
ra B B B
-E9- B f H CD
•
D • •
- 0 -
B-
8 10
•
•
i
•
tr
12 14
LOS
Legend: LOS = Length of Stay NCMC = Number of NCM contacts within six months prior to hospitalization.
m
16 18 20 22 24
Figure 2. LOS and Number of NCM Contacts within Six Months §
89
contacts of NCM, and LOS were also described. The findings based on the research
questions were discussed. Statistically significant differences in the LOS were found,
within the total sample and the Circulatory System MDC, between the NCM initiated
during hospitalization group and the non-NCM group. The NCM initiated during
hospitalization group had the longer LOS. There were no statistically significant
relationships found between the dependent variable, LOS, with the number of NCM
contacts pre-hospitalization or the number of weeks of NCM previous to the study's
hospitalization. The multiple regression analysis indicated that only one variable,
admission via the Emergency Department, was a predictor of LOS. Statistically
significant differences between the background variables of the subgroup of the total
sample and the MDCs were discussed.
Additional findings included statistically significant correlations between LOS and
the background variables, the mean deviations of the actual LOSs from the HCFA LOS
of the DRGs, and a presentation of the results of a comparison of the case mix indexes
of the groups within the total sample and the subgroups of the MDCs.
90
CHAPTER FIVE
INTERPRETATIONS AND IMPLICATIONS
The interpretation of the findings recorded in Chapter Four are presented in
Chapter Five. The limitations of the study are discussed. Lastly, the implications for
nursing practice and nursing research are presented.
Interpretation of the Findings
Results relating to the first research question: Is there a difference in the LOS
of those Medicare patients in selected Diagnostic Related Groups (DRGs) who had a
nurse case manager pre-hospitalization, those who did not, and those who had NCM
initiated during the hospitalization or up to 10 days afterward? are displayed in Table
21. In the total sample, the Nurse Case Management (NCM) initiated during
hospitalization group had a significantly longer LOS than both of the other two groups.
This same NCM initiated during hospitalization subgroup also had a significantly longer
LOS than the non-NCM subgroup in the Circulatory Medical Diagnostic Category (MDC).
A comparison of the mean LOS among the groups of the total sample (Table 20)
revealed that the non-NCM group had the shortest LOS and the NCM pre-hospitalization
group had a slightly longer LOS, compared to the much longer LOS of the NCM
initiated during hospitalization group. To analyze this further, a comparison of the
subgroups within the two MDCs identified that in the Respiratory System MDC, the NCM
pre-hospitalization subgroup had the shortest LOS, the NCM initiated during
hospitalization subgroup 5.21 days longer and the non-NCM subgroup 3.69 days longer
than the NCM pre-hospitalization subgroup. These results may be interpreted as: if

91
the NCM pre-hospitalization subgroup and the NCM initiated during hospitalization
subgroup are considered to be more alike (since they both were selected for NCM
because of high risk criteria) then NCM is making an impact on LOS of the high risk
groups within the Respiratory System MDC. These results could also suggest that NCM
could decrease the LOS of those patients in the non-NCM subgroup (who are not
considered high risk).
The pattern of LOS was different within the Circulatory System MDC. The non-
NCM subgroup had the shortest LOS; the NCM pre-hospitalization subgroup had 2.36
days longer LOS; and the NCM initiated during hospitalization subgroup had an average
of 4.68 days longer LOS than the non-NCM subgroup. These results suggest that
NCM may be making a difference by decreasing the LOS of those patients who have
had NCM compared to those who are picked up for NCM during the hospitalization.
In the Circulatory System MDC, the non-NCM subgroup had the highest percentage
(56.8 percent) admitted to the Critical Care Units compared to 40 percent of the NCM
initiated during hospitalization subgroup and 34.4 percent of the NCM pre-hospitalization
subgroup. Following along with this thought, the case mix index of the non-NCM
subgroup was highest within the Circulatory System MDC which may be interpreted that
this group was sicker. The non-NCM subgroup's mean LOS in the Circulatory MDC
was also the only mean LOS which was shorter than the HCFA mean LOS. This
possibly could be interpreted as being due to the nature of the disease process.
The answer to the second research question: Is there a relationship of LOS to
the number of NCM contacts, one month, two months, and six months pre-
hospitalization of patients in selected DRGs? is displayed in Table 22. There were no

92
statistically significant relationships identified. The NCM pre-hospitalization group within
the Respiratory MDC did have an inverse relationship, although not statistically
significant, between LOS and the number of contacts of NCM in one month and two
months. As the number of NCM contacts in one month and two months increased, the
LOS decreased. This supports literature that states NCM was associated with a
decrease of LOS of patients with chronic respiratory problems. But there is a positive
correlation of number of contacts of NCM in six months of patients within the
Respiratory MDC. Again, this is not a statistically significant correlation, but it suggests
that as the number of contacts increases within six months the LOS increases. This
may also suggest that as the nurse case manager, due to the increased number of
contacts with the patient, gained increased knowledge about the patient, more details
were uncovered which may have added to the complexity of care and increased LOS.
According to Verran and Reid (1987), as knowledge of the client increases, the
complexity of care increases and there are increased interventions. This increased
contact at six months may be a reflection of complexity of care. Another factor which
may have added to this increased LOS is that the patients in the NCM pre-
hospitalization subgroup were those with chronic respiratory problems; on a trajectory
of illness, the patients were sicker, as the increased number of contacts over a longer
period of time implies. Within the Circulatory MDC, there was an inverse relationship
between LOS and the number of NCM contacts in one month and six months but a
positive relationship in two months. There is clearly a difference in trends within the
Respiratory and Circulatory System MDCs which suggests the need for further
exploration.
93
The third research question: Is there a relationship of LOS, of patients in
selected DRGs, to the number of weeks of NCM, pre-hospitalization? has results
displayed in Table 23. These results were not statistically significant. There is an
inverse correlation, although statistically insignificant, between these variables. It
delineates a pattern of a shorter LOS with increased weeks of NCM. The range of
number of weeks (1-89) denotes a large variance in the duration of NCM. It is also
important to know that some (n=13) of these clients had stabilized before the study's
time period of data collection and had not had any NCM contacts during that period.
The stabilization of these clients is considered a positive trend for the value of NCM.
The fourth research question was: What are the primary predictors of LOS of
patients in the selected DRGs? A stepwise multiple regression analysis of all variables
revealed that only one variable, admission via the Emergency Department had an
impact on LOS (b= -2.73, R2=0.08). This accounted for eight percent of the variance.
This result agrees with the high percentage of patients admitted via the Emergency
Department, 63.5 percent, of the total group, 86.1 percent of the Respiratory MDC
group and 53.2 percent of the Circulatory MDC group. The NCM initiated during
hospitalization subgroup had the highest percentage admitted via the Emergency
Department in both MDCs. The NCM pre-hospitalization group subgroup had the
lowest percentage 63.6 percent in the Respiratory MDC admitted via the Emergency
Department compared to 100 percent of the NCM during hospitalization subgroup and
92.3 percent of the non-NCM subgroup. In the Circulatory MDC the NCM pre-
hospitalization subgroup was slightly lower (0.3 percent) than the NCM initiated during
hospitalization subgroup compared to the non-NCM subgroup having 14.9 percent less
94
admissions to the Emergency Department than the NCM initiated during hospitalization
subgroup This suggests again that there are differences in patterns within the two
MDCs. Nurse Case Management appears to have a relationship with decreasing
admissions via the Emergency Department of Respiratory NCM patients, but not of
Circulatory NCM patients.
Results of the fifth research question: Is there a difference in the background
characteristics of the three groups? indicate statistically significant differences in age,
admission acuity, admission via the Emergency Department, and admission to the
Critical Care Units, living alone, and in the number of hospitalizations in the 60 days
previous to the study's hospitalization among the three groups. The NCM pre-
hospitalization group was older, had more widowed persons, and had a higher
percentage of those persons who live alone. The NCM initiated during hospitalization
group within the total sample had a higher percentage of those persons who were
widowed and lived alone than the non-NCM group but were slightly younger. Specific
findings related to the background characteristics follow.
Age
The NCM pre-hospitalization group of the total sample was older than the non-
NCM group and the NCM initiated during group. Interestingly, though statistically
insignificant, the non-NCM subgroup was slightly older within the Respiratory System
MDC than the NCM pre-hospitalization subgroup and much older than the NCM initiated
during hospitalization subgroup. The NCM pre-hospitalization subgroup was
considerably older than the non-NCM subgroup in the Circulatory MDC. A large
95
difference was found within the age categories. Within the total sample 25.6 percent
of the NCM pre-hospitalization group were in the 85-95 years of age category while
there were only 10 percent of the non-NCM group and 9.1 percent of the NCM initiated
during hospitalization group who were in this age category. There was specifically a
large difference in age within the Circulatory System MDC. Twenty eight percent of the
NCM pre-hospitalization subgroup were in the 85-94 age category as were 20 percent
of the NCM initiated during hospitalization subgroup and only eight percent of the non-
NCM subgroup. There were clearly differences among the subgroups within the MDCs
relating to age with the NCM pre-hospitalization subgroup having a pattern of being the
most old, the non-NCM subgroup being youngest in the Circulatory System MDC and
the NCM during hospitalization subgroup being youngest in the Respiratory System
MDC.
Admission via the Emergency Department for Current Hospitalization
The NCM pre-hospitalization subgroup had the lowest percentage of patients in
the Respiratory System MDC admitted via the Emergency Department (Table 13). The
NCM pre-hospitalization subgroup had 63.6 percent while the NCM initiated during
hospitalization subgroup had 100 percent and the non-NCM subgroup had 92 percent.
There was no statistical significant difference of the groups within the Circulatory System
subgroups. This result emphasizes again that the groups are different within the two
MDCs.

96
Admission to Critical Care Units
There was a statistically significant difference, In whether the patient was
admitted to the Critical Care Units, among the groups within the two MOCs. Forty eight
percent of the non-NCM group were admitted to Critical Care Units, as were 25.6
percent of the NCM pre-hospitalization group, and only 22.7 percent of the NCM
initiated during hospitalization group. Within the Respiratory System MDC, 23.1 percent
of the non-NCM subgroup, 8.3 percent of the NCM initiated during hospitalization
subgroup, and none of the NCM pre-hospitalization subgroup were admitted to a
Critical Care Unit. Within the Circulatory System, 56.8 percent of the non-NCM were
admitted to the Critical Care Units compared to 40 percent of the NCM initiated during
hospitalization subgroup and only 34.4 percent of the NCM pre-hospitalization
subgroup. Based on this data, it is possible that NCM has some relationship with
decreased cost of hospitalization through fewer admissions to the Critical Care Units.
Number of Hospitalizations in the 60 Days Previous to Current Hospitalization
The NCM pre-hospitalization group within the total sample had more
hospitalizations 60 days previous to the study's hospitalization compared to the other
two groups. There was a statistically significant difference between the non-NCM group
and the NCM pre-hospitalization group. There were again differences between the
subgroups within the two MDCs with the most dramatic difference being the NCM
initiated during hospitalization subgroup having 41.7 percent (the highest) have one
hospitalization in the Respiratory MDC and 20 percent having two hospitalizations (the
highest percentage) in the Circulatory System MDC. These comparisons may support

97
the thought that the NCM pre-hospitalization subgroup is different than the non-NCM
subgroup and more like the NCM initiated during hospitalization subgroup. The NCM
pre-hospitalization group patients and the NCM initiated during hospitalization group
patients were both selected by similar high risk criteria.
Admission Acuity
Although not statistically significant the pattern of admission acuities (Table 11)
was that the non-NCM subgroup had a higher admission acuity than the other two
subgroups in the Respiratory System MDC on hospitalization. The NCM initiated during
hospitalization subgroup had a slightly lower admission acuity than the NCM pre-
hospitalization subgroup in the Respiratory MDC but was higher and closer to the
admission acuity of the non-NCM subgroup in the Circulatory System than the NCM
pre-hospitalization subgroup. The NCM pre-hospitalization subgroup had the lowest
admission acuity in this MDC. These results suggest that the NCM pre-hospitalization
subgroup and NCM during hospitalization subgroup were less sick on admission in the
Respiratory System MDC then the non-NCM subgroup, and that the NCM initiated
during hospitalization subgroup and the non-NCM subgroup were sicker on admission
in the Circulatory MDC than the NCM pre-hospitalization subgroup. It is clear that the
NCM pre-hospitalization subgroup was less sick on admission than the non-NCM
subgroup in both MDCs.
In summary, 1) the NCM pre-hospitalization subgroup of the Respiratory MDC
had a shorter mean LOS (3.69 days) than the non-NCM subgroup and a shorter mean
LOS (5.21 days) than then NCM initiated during hospitalization subgroup. Within the
98
Circulatory MDC, the NCM pre-hospitalization subgroup had a shorter mean LOS (2.32
days) than the NCM initiated during hospitalization subgroup. The non-NCM subgroup
had the shortest mean LOS in the Circulatory MDC, 4.37 days less than the NCM pre-
hospitalization subgroup. This data suggests further exploration of differences between
the two MDCs. 2) There were no statistically significant relationships between LOS and
the number of contacts of NCM. In the Respiratory MDC, there was a pattern of
decreased LOS with the NCM contacts at one and two months, but an increased LOS
with the NCM contacts at six months. The relationship of the increased LOS with the
NCM contacts at six months may reflect sicker patients and a complexity of care.
Within the Circulatory MDC, there was an inverse relationship of LOS with NCM contacts
at one and six months, but a positive relationship at two months; the LOS was longer
at two months. 3) There was no significant relationship of LOS to the number of weeks
of NCM pre-hospitalization. There was a pattern identified (although insignificant) of
shorter LOS with increased weeks of NCM. 4) The only predictor of LOS was
admission via the Emergency Department. If admitted via the Emergency Department,
the LOS was longer. 5) Statistically significant differences of the background
characteristics among the three groups identified that the NCM pre-hospitalization group
was older than the non-NCM group within the total sample and the Circulatory MDC.
The NCM pre-hospitalization group also had the highest percentage (25.6 percent) of
subjects in the 85-94 age category compared to ten percent of the non-NCM group and
9.1 percent of the NCM during hospitalization group. The NCM pre-hospitalization had
the lowest percentage (63.6 percent) of patients in the Respiratory MDC admitted via
the Emergency Department compared to 92 percent of the non-NCM subgroup and 100

99
percent of the NCM initiated during hospitalization subgroup. Forty eight percent of the
non-NCM group were admitted to Critical Care Units compared to 25.6 percent of the
NCM pre-hospitalization group and 22.7 percent of the NCM initiated during
hospitalization group. In the Respiratory MDC, none of the NCM pre-hospitalization
subgroup were admitted to Critical Care compared to 23.1 percent of the non-NCM
subgroup and 8.3 percent of the NCM initiated during hospitalization subgroup. Within
the Circulatory MDC, the NCM pre-hospitalization subgroup also had the lowest
percentage of admissions to the Critical Care Units. The NCM pre-hospitalization group
had more hospitalizations than the other two groups 60 days previous to the current
hospitalization. The admission acuity for the NCM pre-hospitalization subgroup was
lower than the non-NCM subgroup in the Respiratory and the Circulatory MDC but
was slightly higher than the NCM initiated during hospitalization subgroup in the
Respiratory MDC. There is an overall pattern within the total sample of the admission
acuity of the NCM pre-hospitalization subgroup being lower than both the non-NCM
group and the NCM initiated during hospitalization group.
Limitations of the Study
The sample size of the NCM initiated during hospitalization group was much
smaller (n=22) than the NCM pre-hospitalization group (n=43) and the non-NCM group
(n=50). The number was further reduced when examining the differences within the
subgroups of the Respiratory System MDC and the Circulatory System MDC.
Generalizability of the findings is limited by the small sample size of the NCM initiated
during hospitalization subgroup.
100
The data collection procedure for the data obtained from the patient's community
records may affect validity. The data collected included a measure of NCM contacts
which were by a telephone call or by a home visit. It is questionable whether all
telephone calls, which are sometimes brief, were documented.
Additionally, the comparison of the groups within the total sample may not reflect
a true measure of NCM's impact. The two MDCs, the Respiratory System MDC and
the Circulatory System MDC, were very different in admission acuity, LOS, and sample
size.
Implications for Nursing
Hospitals, with a high percentage of Medicare patients, have been struggling to
maintain financial viability since the introduction of Medicare's Prospective Payment
System and DRGs. Nursing directors have recognized this problem as an opportunity
to create new roles to improve the utilization of the professional nurse; they wished also
to provide a method to increase quality of care, access to care, and to decrease the
cost of health care. Nurse Case Management, was instituted at this study's site to
provide a mechanism to reduce LOS and to provide a continuum of care into the
community to maintain quality and decrease the possibility of readmission to the
hospital or to decrease the severity of illness (acuity) if readmitted. Length of stay was
identified as one factor impacting the cost of a hospitalization (Lee, 1984) and is
considered a measurement of patient outcome reflecting that cost.
This study was conducted to identify whether Medicare patients, in the medical
DRGs of the high volume MDCs, who had NCM prior to hospitalization had a shorter
101
hospital stay (LOS) than those who did not. Three groups were described and
compared: 1) the patients who had NCM previous to the hospitalization, 2) the patients
who had NCM initiated during the hospitalization or 10 days afterwards, and 3) the
patients who had no NCM at all.
This study has identified that NCM has some relationship with LOS when
comparing similar populations, ie. the NCM pre-hospitalization group and the NCM
initiated during hospitalization group. There is also a pattern of NCM making an
indirect financial impact, in the Circulatory MDC, through lowered admission acuities and
lower use of the Critical Care Units. There is some indication that there is cost savings
due to decreased LOS by NCM when comparing the NCM pre-hospitalization subgroup
and the non-NCM subgroup within the Respiratory MDC. There is also indication of
cost savings within the Respiratory MDC by the NCM pre-hospitalization subgroup not
having Critical Care admissions.
One indication from this endeavor is that professional nurses impact the
financial outcomes of the patient and the hospital. Nursing is expanding its awareness
of financial concerns related to the health care system and being innovative to address
those concerns.
Nurse case management is a strategy for professional nurses to be the
coordinators of care for high risk populations and individuals. It is also the opportunity
for professional nurses to strengthen linkages to consumers and to increase nursing's
image as essential health care professionals while making a positive impact on quality,
cost, and access to care.
102
Implications for Future Nursing Research
This model of NCM is now being replicated at various hospitals across the
United States. Since this NCM model was a new one, there had been scant literature
evaluating its impact on quality, cost, and access to care. This study was an attempt
to focus on one factor (LOS) relating to the cost of hospitalization. Multiple replications,
in different geographic locations and in institutions of various type and size, focusing
on the same medical DRGs examined in this study, are required before there can be
generalization to populations outside of the study site. The study has identified that the
two MDCs appear to be very different. The admission acuities and LOSs were very
different when the groups within the Respiratory System MDC were compared with the
same groups within the Circulatory System MDC. It suggests that perhaps it was
inappropriate to examine the two MDCs together, it is recommended that each MDC
be examined separately. It appears that NCM may be working by decreasing admission
acuities on readmission and decreasing the use of Critical Care Units. This is
suggested by the lower admission acuity of the NCM patients in the total group and
the Circulatory System MDC and by the lower percentage of admissions to the Critical
Care Units in both MDCs. In future studies, the balance between cost and quality
should be examined. Possibly NCM helps balance the ratio between cost and quality.
Additional systematic research is necessary to identify outcomes, affected by NCM, that
influence costs (including LOS), quality, and access to care.
Collaboration in research with other hospitals who have instituted this model and
other models of NCM is essential to provide a base of nursing knowledge as this role
continues within nursing practice.
103
Summary
The interpretation of findings as they relate to the conceptual framework and the
research questions of this ex post factor descriptive correlation study was presented.
Limitations of this study were discussed, and implications for nursing practice and future
nursing research were presented.

APPENDIX A
Human Subjects Approval
Human Subject Committee
13 April 1990
THE UNIVERSITY OF
ARIZONA HEALTH SCIENCES CENTER
105 1690 N. Warren (Bldg. 526B) Tucson, Arizona 85724 (602) 626-6721 or 626-7575
Evelyn Alice Chapman, BSN, M.Ed c/o Joyce Verran, R.N., Ph.D. College of Nursing Arizona Health Sciences Center
BE: A90.62NURSE CASE MANAGEMENT AND HOSPITAL IINGTH OF STAY
Dear Ms. Chapman:
We received your above referenced project. The procedures to be followed in this study pose no more than minimal risk to participating subjects. Regulations issued by the U.S. Department of Health and Human Services [45 CFR Part 46.110(b)] authorize approval of this type project through the expedited review procedures, with the condition(s) that subjects' anonymity be maintained. Although full Committee review is not required, a brief summary of the project procedures is submitted to the Committee for their endorsement and/or comment, if any, after administrative approval is granted. This project is approved for one year effective 13 April.
The Hunan Subjects Conmittee (Institutional Review Board) of the University of Arizona has a current assurance of compliance, number M-1233, which is on file with the Department of Health and Human Services and covers this activity.
Approval is granted with the understanding that no changes or additions will be made to the procedures followed without the knowledge and approval of the Human Subjects Committee and your College or Departmental Review Committee. Any research related physical or psychological harm to any subject must also be reported to each committee.
Sincerely yours,
I V<.v_ U-..v L <c Milan Novak, M.D., Ph.D. Chairman Human Subjects Committee
MN/ms
cc: Departmental/Col lege Review Conmittee

APPENDIX B
Study Agency Approval
4*- Carondelet St. Marv's
March 29, 1990
Evelyn A. Chapman, R.N. Graduate Student College of Nursing University of Arizona Tucson, Arizona
Dear Evelyn,
Your project, Nurse Case Management and Hospital Length of Stay, has been reviewed by Nursing Administration at Carondelet St. Mary's Hospital. Inasmuch as your project will require only medical record and patient account reviews, no further review will be required, and you may proceed with the knowledge that you will have our full support and cooperation.
1601 West St. Mary's
Road
P. 0. Box 5386
Tucson Arizona 85703
107
Sir
Phyllis Ethridge, MSN, R.N. Vice President, Patient Care Services
(602) 622-5833
A Community Hospital and Health Center Sponsored by the Sisters of St. Joseph of Carondelet

APPENDIX C
Data Form

DATA FORM
Med Rec #
Billina #
Aae
Sex
Race
Marital Status
Livina Situation
Admission Date
Discharcte Date
C.M. Init Date
LOS
MDC
DRG
Grout) 0.1. or 2
NCM #
Admit Acuitv
Admit via ER
Admit via C.C.
# HOSD 2 Mos Prev
# Adm ER 2 Mos Prev
# ER Visits 2 Mos Prev
# Weeks NCM Prev
# NCM Contacts 2 Mos Pre-v
# NCM Contacts 6 Mos Pre\
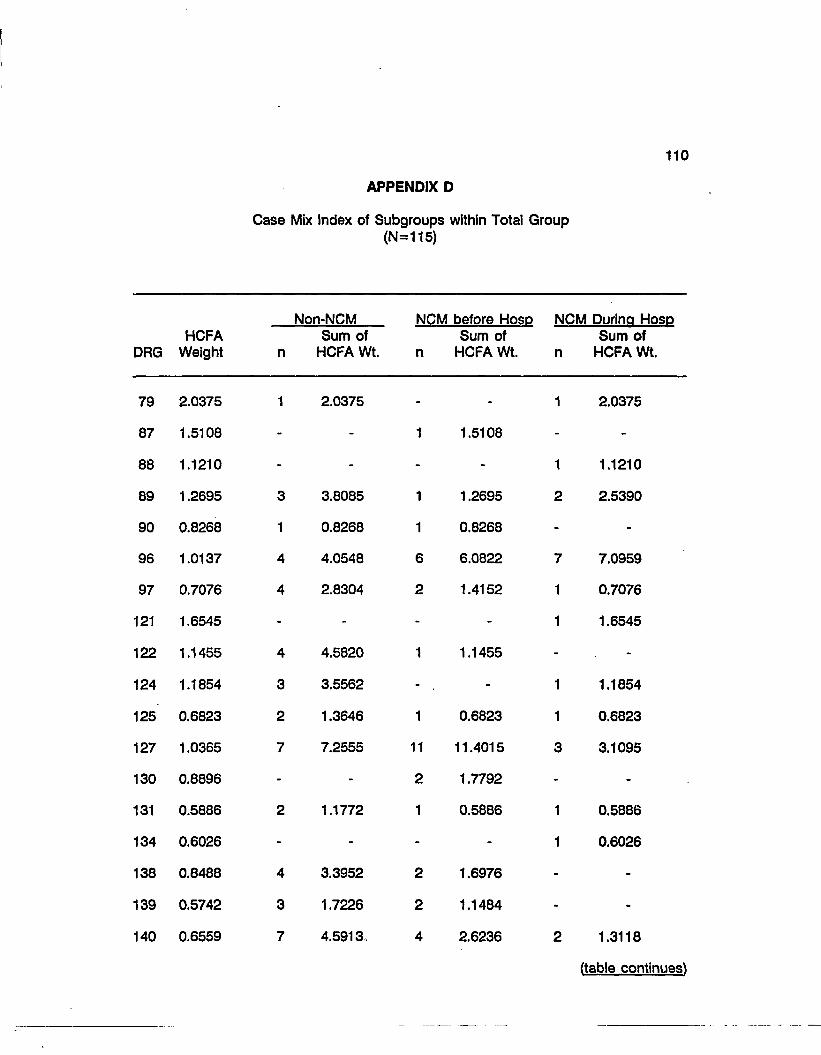
79
87
88
89
90
96
97
121
122
124
125
127
130
131
134
138
139
140
110
APPENDIX D
Case Mix Index of Subgroups within Total Group (N=115)
Non-NCM NCM before HOSP NCM During Hosp HCFA Sum of Sum of Sum of
Weight n HCFA Wt. n HCFA Wt. n HCFA Wt.
2.0375 1 2.0375 - - 1 2.0375
1.5108 - - 1 1.5108 - -
1.1210 - - - - 1 1.1210
1.2695 3 3.8085 1 1.2695 2 2.5390
0.8268 1 0.8268 1 0.8268 - -
1.0137 4 4.0548 6 6.0822 7 7.0959
0.7076 4 2.8304 2 1.4152 1 0.7076
1.6545 - - - - 1 1.6545
1.1455 4 4.5820 1 1.1455 - -
1.1854 3 3.5562 - . - 1 1.1854
0.6823 2 1.3646 1 0.6823 1 0.6823
1.0365 7 7.2555 11 11.4015 3 3.1095
0.8896 - - 2 1.7792 - -
0.5886 2 1.1772 1 0.5886 1 0.5886
0.6026 - - - - 1 0.6026
0.8488 4 3.3952 2 1.6976 - -
0.5742 3 1.7226 2 1.1484 - -
0.6559 7 4.5913. 4 2.6236 2 1.3118
(table continues^
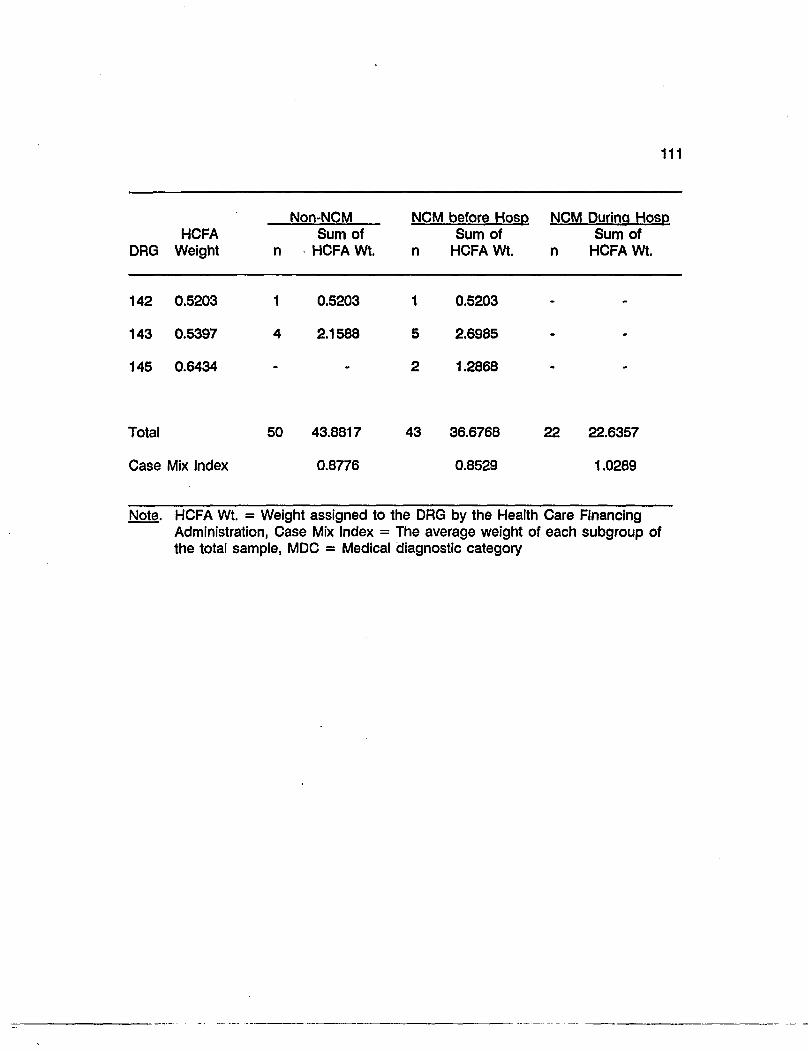
111
HCFA DRG Weight
Non-NCM NCM before HOSD NCM Durina HOSD HCFA
DRG Weight n Sum of
HCFA Wt. n Sum of
HCFA Wt. n Sum of
HCFA Wt.
142 0.5203 1 0.5203 1 0.5203 - -
143 0.5397 4 2.1588 5 2.6985 - -
145 0.6434 - - 2 1.2868 - -
Total 50 43.8817 43 36.6768 22 22.6357
Case Mix Index 0.8776 0.8529 1.0289
Note. HCFA Wt. = Weight assigned to the DRG by the Health Care Financing Administration, Case Mix Index = The average weight of each subgroup of the total sample, MDC = Medical diagnostic category

112
APPENDIX E
Case Mix Index of Subgroups within Respiratory MDC (N=36)
Non-NCM NCM before Hosp NCM During HQSP HCFA Sum of Sum of Sum of
DRG Weight n HCFA Wt. n HCFA Wt. n HCFA Wt.
79 2.0375 1 2.0375 - - 1 2.0375
87 1.5108 - - 1 1.5108 - -
88 1.1210 - - - - 1 1.1210
89 1.2695 3 3.8085 1 1.2695 2 2.5390
90 0.8268 1 0.8268 1 0.8268 - -
96 1.0137 4 4.0548 6 6.0822 7 7.0959
97 0.7076 4 2.8304 2 1.4152 1 0.7076
Total 13 13.5583 11 11.1046 12 13.5012
Case Mix Index 1.0429 1.0095 1.1251
Note. HCFA Wt. = Weight assigned to the DRG by the Health Care Financing Administration, Case Mix Index = The average weight of each subgroup of the total sample, MDC = Medical diagnostic category

113
APPENDIX F
Case Mix Index of Groups within the Circulatory MDC (N=79)
Non-NCM NCM before Hosp NCM During Hosp HCFA Sum of Sum of Sum of
DRG Weight n HCFA Wt. n HCFA Wt. n HCFA Wt.
121 1.6545
122 1.1455
124 1.1854
125 0.6823
127 1.0365
130 0.8896
131 0.5886
134 0.6026
138 0.8488
139 0.5742
140 0.6559
142 0.5203
143 0.5397
145 0.6434
Total
Case Mix Index
4 4.5820
3 3.5562
2 1.3646
7 7.2555
2 1.1772
4 3.3952
3 1.7226
7 4.5913
1 0.5203
4 2.1588
37 30.3237
0.8196
1 1.1455
1 0.6823
11 11.4015
2 1.7792
1 0.5886
2 1.6976
2 1.1484
4 2.6236
1 0.5203
5 2.6985
2 1.2868
32 25.5723
0.7991
1 1.6545
1 1.1854
1 0.6823
3 3.1095
1 0.5886
1 0.6026
2 1.3118
10 9.655
0.9655
Note. HCFA Wt. = Weight assigned to the DRG by the Health Care Financing Administration, Case Mix Index = The average weight of each subgroup of the total sample, MDC = Medical diagnostic category

UST OF REFERENCES
114
American Hospital Association (1983). Managing under medicare prospective pricing. Chicago, IL.
American Nurses' Association (1980). Nursing case management. Kansas City, MO.
American Nurses' Association (1980). Nursing a social policy statement. Kansas City, MO.
Brooton, D., Brown, L.P.,Munroe, B.H., York, R., Cohen, S.M., Roncoli, M., and Hollingsworth, A. (1988). Early discharge and specialist transitional care. Image: Journal of Nursing Scholarship. 20 (2), 64-68.
Brotman, H.B. (1982). Every health american: an analysis for the chairman of the select committee on aging. House of Representatives. (Committee publication #97-332). Washington, D.C.: U.S. Government Printing Office.
Chapman, E. (1989). Professional nurse case management and cost of care: length of stay and acuity (unpublished manuscript to meet the requirements of N624, U of A College of Nursing, Tucson, AZ.
Christy, T. (1970). Portrait of a leader: Lillian D. Wald. Nursing Outlook. 18, 44-50.
Commission on Professional and Hospital Activities (1980). International classification of diseases. 9th revision, clinical modification volumes 1-3. Ann Arbor, Ml: Edwards Brothers Inc., 744-755.
Edwards, M., Broadwater, J.R., Bell, J., Amos, F., and Balch, C. (1986). Reduced hospitalization for mastectomy patients. Annals of Surgery. 206. (3), 330-336.
Epstein, A., Stern, R., Tognetti, J., Begg, C., Hartley, R., Cumella, E., and Ayanian, J. (1988). The association of patients' socioeconomic characteristics with the length of hospital stay and hospital charges within diagnosis-related groups. The New England Journal of Medicine. 318 (24), 1579-1585.
Ethridge, P. (1985). The case for billing by patient acuity. Nursing Management. 16(8), 38-41.
Ethridge, P. (1986). Professional nurse case management reduces hospital costs. Arizona Nurse. 41. (5), 1-24.
Ethridge, P. (1987). Building successful nursing delivery systems (unpublished presentation). National Commission on Nursing Implementation Project. San Diego, CA.

115
Ethridge, P., Rusch, S., Gannon, D., and Sohl, L. (1989). The professional nurse case manger in changing organizational structures. In Johnson, M., and McCloskey, J. Series on Nursing Administration. Volume 2. 1989. University of Iowa: Addison-Wesley Annual Publication, 146-164.
Fuhs, P., and Hancock, M. (1979). The use of length of stay distributions to predict hospital discharges. Medical Care. 17 (4), 355-368.
Fuszard, B., Bowman, R., Howell, H.T., Malinowski, A., Morrison, C., and Wahlstedt, P. (1988). Nursing Case Management. Kansas City, MO.
Grace, L. (1984). Case management and the nurse. Geriatric Nursing. Nov/Dec, 373-375.
Green, G. (1984). Case management: state of the art. In Bennett, R., Frisch, S., Gurland, J., and Laird W., Coordinated Service Delivery Systems for the Elderly. New York: Haworth Press.
Hines, G.L. (1988). DRGs: nursing documentation contributes to the bottom line. In Nursing Clinics of North America. 23 (3), 579-583.
Joel, L. (1984). DRGs and rims: implications for nursing. Nursing Outlook. 32 (1), 42-48.
Lamb, G. (1988). Innovation: 1988 organizational innovational awards. The Health Care Forum. 1.
Lave, J., and Leinhart, S. (1976). The cost and length of a hospital stay. Inouirv. 13. 327-343.
Lee, A. (1984). How DRGs will affect your hospital and you. RN. 47 (5). 71-81.
Marchette, L. and Holloman, F. (1986). Length of stay: significant variables. Journal of Nursing Administration. 16 (3), 12-19.
McKenzie, C., Torkelson, N., and Holt, M. (1989). Care and cost: nursing case management improves both. Nursing Management. 20 (10), 30-34.
Morrisey, M.A., Sloan, F.A., and Valvona, J. (1988). Medicare prospective payment and post hospital transfers to subacute care. Medical Care. 26 (7), 685-694.
Munoz, E., Zahatz, J., Lamantia, J., Chaffin, D., Lacknor, R., and Wise, L. (1989). Hospital resources consumption and outcome: route of admission and age for hospitalized otolaryngology patients. Archives of Otolarvnoeal Head & Neck Surgery. , 87-91,
116
Ploman, M.P. and Shaffer, F.A. (1983). DRGs as one of nine approaches to case mix in transition. Nursing & Health Care. 4 (8), 438-443.
Posner, J. and Lin, H. (1975). Effects of age on length of hospital stay in low income populations. Medical Care. 13 (10), 855-875.
Prospective Payment Assessment Commission (1989). Medicare prospective payment and the American health care system report to the congress. Washington, D.C., June.
Robinson, G., Goldstein, M., and Levine G. (1987). Impact of nutritional status on DRG length of stay. Journal of Parenteral and enteral Nutrition. 11. (1), 49-51.
Shaffer, F. (1983). DRGs: history and overview. Nursing Health Care. 4 (7). 388-396.
Schroeder, S.A., Showstack, J.A., Roberts, H.F. (1979). Frequency and clinical descriptions of high-cost patients in acute-care hospitals. New England Journal of Medicine. 300 (12), 1306.
Selker, H., Beshansky, J.p Pauker, S., and Kasserir, J., (1989). The epidemiology of delays in a teaching hospital. Medical Care. 27 (2), 112-129.
Shukla, R., and O'Hallaron, R. (1986). AM admissions/pm discharges can reduce length of stay. Hospital & Health Services Administration. July/Aug, 74-81.
Smith, D.M., Roberts, S.D., and Gross, T.L. (1981). Health care of medical patients at an urban center. Journal of Community Health. 7, 21.
Strong, B. (1986). Nurse case management in acute care. Unpublished manuscript, Carondelet St. Mary's Hospital, Tucson, AZ.
Trofino, J. (1989). JCAHO nursing standards: nursing care hours and los per drg -part I. Nursing Management. 20 (1), 29-32.
Verran, J.A. and Reid, P.J. (1987). Replicated testing of the nursing technology model. Nursing Research. 36 (3), 190-193.
Weinberger, M., Smith, D., Katz, B., and Moore, P. (1989). The cost-effectiveness of intensive post discharge care: a randomized trial. Medical Care. 26 (11), 1092-1101.
Weingarten, M., Wainwright, S., and Sacchette, A. (1988). Trauma and aging effects on hospital costs and length of stay. Annals of Emergency Medicine. 17 (1), 33-37.

117
Wolf, G., Lesic, L., Leak, A. (1986). Primary nursing: the impact on nursing costs within DRGs, Journal of Nursing Administration. 16 (3), 9-11.
Zander, K. (1988). Nursing case management: resolving the DRG paradox. In Nursing Clinics of North America. 23 (3), 503-519.
Zander, K. (1988). Nursing case management: strategic management of cost and quality outcomes. Journal of Nursing Administration. 18 (5), 23-30.
Zander, K. (1989). Second generation critical paths. In Definition. Boston: The Center for Nurse Case Management, Inc., 1.
Zook, C., and Moore, F. (1980). High cost users of medical care. The New England Journal of Medicine. 302 (18), 996-1002.