Information Technology Agreement of WTO: Call for a Revisit
42
1 CWS/WP/200/ 9 Information Technology Agreement of WTO: Call for a Revisit By K. J. Joseph Ministry of Commerce Chair, CDS, Trivandrum
Transcript of Information Technology Agreement of WTO: Call for a Revisit

1
CWS/WP/200/ 9
Information Technology Agreement of WTO: Call for a Revisit
By
K. J. Joseph
Ministry of Commerce Chair, CDS, Trivandrum

2
The author is the Ministry of Commerce Chair, Centre for Development Studies, Trivandrum
(www.cds.edu) and Editor in Chief Innovation and Development (Routledge). He can be
contacted at [email protected]

3
Executive summary
The Information Technology Agreement of WTO has been touted as a landmark agreement ever
undertaken and a stepping stone to multilateralism through sectoral agreement route wherein developed and
developing countries could work in a mutually beneficial manner. The basic premise of the agreement is
that by liberalizing the trade in IT goods the members could harness the manifold benefits of ICT. Earlier
studies have argued that ITA has been instrumental in augmenting the trade in IT products, facilitated faster
diffusion of ICT and helped developing countries to participate in Global Production Network. Hence, a
case has been made to expand the product coverage of ITA (called ITA-II) and the negotiations are on. Yet, majority of developing countries prefer to keep away from ITA. In this context, the present study
analysed the outcomes of ITA in terms of its effect on trade in ITA goods, the country concentration therein
and the trend in unit value indices. The major point of departure of the present study is that, while the
previous studies were concerned only with the post ITA period, this study compared the performance
during the post ITA period with the pre ITA period.
It is observed that, in contrast to the earlier findings, post ITA period witnessed a sharp deceleration in the
exports and imports of ITA goods. The export growth for ITA goods was higher than merchandise exports
during the pre ITA period. But during the post ITA period the recorded growth in the export of IT goods
was lower than the merchandise leading to decline in the share of IT goods in merchandise exports. This
tends to suggest that despite ITA the impact of exogenous shocks like Asian financial crisis, dotcom crisis
and global financial crisis were more on IT goods as compared to merchandise exports in general. Hence the often made growth augmenting effect of ITA doesn’t withstand to empirical verification.
While there is evidence to the effect that the share of Asia in global trade has increased significantly after
ITA, once we keep away “the China factor”, the emerging picture is not encouraging. There is hardly any
empirical evidence of either incumbent in global production network (eg. Malaysia, Thailand, Indonesia)
improving their position or the entry of new countries from Asia into the electronics production network.
Further, the study finds an increase in the 4-country concentration ratio in the export of ITA goods by about
15 per cent during the post ITA period in contrast to a decline in their share by about 10 per cent during the
pre ITA period. Hence the present study makes the case for product level analysis to discern whether ITA
has resulted in more competitive environment.
The preliminary evidence based on unit value indices, with all its limitations, suggests that ITA has enabled
the MNCs, both from the west and the east, to behave like ‘price makers’. During the pre ITA period, out
of the seven product groups considered, rate of growth in the unit value index of only three was found
positive and significant with others recording either negligible or negative growth rates. But during the post
ITA period all the seven product groups, except one, recorded positive and statistically significant growth
in prices. Here again the study underlines the need for more detailed analysis to explore whether ITA
helped improving the affordability through price reduction or has it made the IT products dearer with its
implications on ICT diffusion in developing countries.
On the whole, ITA seems to have not delivered what was expected of it. Therefore, the reasons for the
hesitation of large number of developing countries to join it are not far to seek. To the extent that the ITA could not keep up its promises and perceived to be perilous to IT industry in countries like India, it is
imperative for India to take a stand to revisit the outcomes of ITA-I before embarking on ITA-II.
The study attributes the ‘ITA fiasco’ to its scant attention to innovation and capacity building which is
quintessential for promoting the production and use of ICT. In the context of frustration that resulted from
ITA and given India’s capabilities in ICT and commitment to developing countries, the study makes the
case for an e-South Framework Agreement based on the twin foundations of trade liberalization and
capacity building.

4
Information Technology Agreement of WTO: A Call for Revisit
K J Joseph
Ministry of Commerce Chair, CDS, Trivandrum
Introduction
Considering the key role of Information Communication Technology (ICT) as a General
Purpose Technology (GPT) in bringing about socio-economic transformation, there have
been various initiatives by the Governments - both national and sub-national- the
Multilateral Organizations and NGOs towards harnessing this technology for
development. While there is hardly any country without an explicit ICT policy –
indicative of national commitment to ICT- at the multilateral level the Information
Technology Agreement (ITA) of WTO, initiated by the private sector, aimed at
liberalizing trade in IT products as a means of promoting the use and production of IT
products. Since the demand for IT products is known to be price elastic, ITA has been
expected to enhance its access by reduced prices inter alia through getting rid of their
tariffs (also other duties and charges) and heightened competition induced by trade
liberalization. Given the link between trade and investment in assembly based industries
like IT products, it was also expected to strengthen and widen the Global Production
Network (GPN) in IT products with an increased participation by developing countries.
ITA, which came into force in 1997, required elimination of tariffs on goods coming
under its ambit in maximal four stages until 2000. However, developing countries could
opt for extending their staging until 20051. Participating countries are required to abide
by the Most Favoured Nation (MFN) principle. Hence, the benefits of zero tariffs are
1 The exact text of the ITA, including the product coverage, can be found at
http://www.wto.org/english/tratop_e/inftec_e/inftec_e.htm

5
extended to those WTO members who did not sign the ITA without having to provide
similar access to their own markets in return. Even today ITA is mainly a tariff reduction
mechanism as the review of non-tariff barriers (NTBs) has not yet come to any definite
conclusion. Moreover, while mass communication tools like radio and television could be
important in addressing the information needs of the poor, such products are not covered
by the ITA and the negotiations on expanding the product coverage have not been
concluded. Though IT hardware without software are simply light emitting devices for
unknown reasons software was not a part of the Agreement, despite software was included
in the broad language of the ITA.
Products covered under the ITA are listed in two annexes to the Declaration, commonly
referred to as attachments A and B. Attachment A is a positive list of items at the 6-digit
Harmonized Schedule (HS) level, separated into two sections (A1 and A2). Attachment B
includes product descriptions but not corresponding to HS code, whether or not they are
included in Attachment A. The descriptive approach in the Attachment B list is designed
to cover products regardless of specific HS codes and to address divergent national
positions in coverage of complex, multifunction products (Dreyer and Hindley 2008).
By now ITA has been in existence for over 15 years. The moot question is on the extent
to which the Agreement has been able to accomplish its objectives. This issue becomes
important at least for two reasons. While the original signatories in 1997 were only 29,
the total number of ITA member countries more than doubled to 74 in 2013. Yet, even
today more than half of the 159 WTO members are out of ITA. Though the ITA is open
to non-WTO members, so far hardly any of them have signed it. Hence it may not be
without valid reason that the large majority of developing countries, despite being
wedded to ICT, are not with ITA. Secondly, today there is a call for expanding the
product coverage of ITA (so called ITA II) and countries are divided on this issue.
Therefore, to understand the hesitation of countries to join ITA and reluctance of those
joined to move towards ITA II, there is an express need for a systematic analysis of the
outcomes of ITA. While the issue is of immense relevance for theory and policy, it has

6
not so far received the scholarly attention that it deserves. Nonetheless, there are a few
studies that deserve attention.
The most notable study is WTO (2012) that examined the performance of ITA during the
15 years of its existence. Against the backdrop of a detailed discussion on the wide-
ranging negotiations that culminated in ITA, and especially the role of private sector
therein, the study observed that participants in ITA have significantly liberalized the trade
by reducing both the bound and most favoured nation tariff. As a result, there has been a
three-fold increase in the export of IT products since 1997 to reach a level of $1.4 trillion
in 2010 accounting for 9.5% of global merchandise exports. Further, in 2010 ITA
participants accounted for 96% of global exports and 90% of global imports of IT
products. Along with high export growth the study also observed that developing
countries, lead by China, have consistently increased their participation in global trade in
IT goods. The share of developing countries in exports more than doubled from 31% in
1996 to 64% in 2010. When it comes to imports the corresponding increase was from
27% to 51%. Since the demand for IT products is highly responsive to changes in
income and price, the study attributed the increased diffusion and use of these products
with the growth -price effects associated with opening up trade and reducing tariff.
Moreover, it has been argued that ITA helped the expansion of GPN in IT goods with
respective increase of trade in intermediate goods and the de-location of production that
considerably increased trade flows between developed and developing countries.
Similar were the conclusions by Ezell (2012) who argued that the ITA has been one of
the most successful trade agreements ever undertaken as it played an important role in
expanding global trade in ICT products leading to innovation, enhanced productivity,
increased employment, and accelerated economic growth. Hence the study made a case
for the expansion of the product coverage under ITA as it would bring immediate and
significant benefits to both ICT producers and consumers in the developed and
developing world.

7
Anderson and Mohs (2010), on the basis of their analysis of the performance of IT trade
during 12 years after the inception of ITA, highlighted the changing composition of trade
by leading exporting and importing nations and the profiles of ITA trade by different
product segments. The study observed that ITA, primarily the domain of developed
countries at its inception, greatly helped expanding the number of developing countries
participating and in turn enhanced the trade by these countries.
Studies also noted that ITA is beset with constitutional problems like the product average
and the absence of a mechanism to rationally and constructively deal with classification
concerns. Dreyer and Hindley (2010) observed that the fundamental problem in the ITA
is its product coverage, especially the exclusion of some of the important consumer
electronic goods. In the current context of technological convergence among ICT product
this exclusion has the potential to progressively erode ITA coverage. Yet another related
problem is based on a rigid positive listing of products that created problems with
multifunctional goods. Further, NTBs in the ITA sector were not included in the ITA
negotiation but remained a central problem to trade in technology goods. Hence, the
study calls for a different approach to product coverage and incorporating provisions on
NTBs.
While the findings of these studies are highly encouraging, their empirical base and the
method of analysis certainly leave much scope for improvement. To begin, while a three
fold increase in the trade in IT goods has been associated with ITA, one needs to reckon
with the fact that association could not necessarily be construed as causation. Further, all
these studies have dealt with the period since ITA by keeping in dark the developments
prior to ITA. Hence, for an informed policy making, any analysis of performance of ITA
and it attendant changes need to be seen in comparison with the trends observed during
the pre ITA period. If a turnaround has been observed since ITA, the precise role that
ITA played therein also needs to be located.
Moreover, while most of these studies have indicated that there has been a decline in the
price of IT goods after ITA, there is hardly any empirical evidence other than anecdotal

8
illustration by taking select goods like computing equipment. WTO (2012) for example
states “import price level of June 2011 for computers, peripherals and semiconductors to
be around 65 per cent below the respective level of June 1996, while the average import
prices for all commodities were 40 per cent above the level of 1996”. Though the
reliable price data on different IT goods is difficult to obtain, the unit value index which
could be derived from the trade data and often used in the trade literature, with all its
limitations could be of some relevance to explore the issue empirically.
Hence, in what follows we shall empirically examine the following specific issues;
(i) Has there been a turnaround in trade (export and import) since ITA as
compared to the pre ITA period?
(ii) Has the global trade in ITA goods become more competitive after ITA as
compared to the pre ITA period with significant change in the role of
developed vis a vis developing countries and strengthening of global
production network by increased participation of developing countries?
(iii) Has there been a significant increase in the affordability of IT goods
resulting from a decline in price during the post-ITA period as compared
to the pre-ITA period?
The remainder of this paper is organized as follows; the second section presents an
analytical framework by critically examining the role of trade liberalization as a means of
promoting production and diffusion of IT. The third section presents a brief discussion on
the database made use of in the study. Empirical evidence on the core issues explored in
the study are presented in section four followed by the last section that summarizes the
major findings and presents a perspective for the future.
2. Trade, an engine or lubricant for growth? Towards an analytical framework
Given the generality of purpose and innovational complementarities, ICT qualifies itself
as yet another GPT2. On comparing ICT with earlier GPTs, David (1990, 1991) found
remarkable parallels in terms of their contribution towards augmenting economic growth
2For a detailed discussion on General Purpose Technology, see Bresnahan and Trajtenberg (1995) who
coined this term.

9
and human welfare. In general, it has been argued that ICTs are key inputs for
competitiveness, economic growth and development. It offers opportunity for global
integration, increasing economic and social well being of the poor and enhances the
effectiveness, efficiency and transparency of the public sector, including the delivery of
public services (World Bank, 2002). Thus viewed, there is hardly any field of human
activity wherein ICT could not have its profound influence inter alia by revolutionizing
the process of information exchange and thereby reducing the transaction cost (Joseph
2007). Hence to appreciate the economic rationale for ITA there is the need for a precise
understanding of the contribution of ICT towards development and welfare and the role
of trade liberalization as manifested in ITA in accomplishing this.
The contribution of a general purpose technology like ICT, could be understood in terms
of its use and production. While the former refers to ICT diffusion induced development
through enhanced productivity, competitiveness, growth and human welfare the latter is
on account of its contribution in output, employment, export earnings from the
production of ICT related goods and services (Kraemer and Dedrick 2001).
Returns to Production of ICT Goods and services
Ezel (2012) has shown that ICT industry accounted for six per cent of global GDP in
2010 and the global value-added by ICT industries more than doubled from $1.2 trillion
in 1995 to $2.8 trillion in 2010. ICT industries also account for a notable share in
employment. For example, in 2010, ICT industries employed 5.8 per cent of workers in
OECD economies, a 13 per cent increase since 1995.
Studies have also shown that in the US, wherein the macroeconomic benefits of ICT
revolution are apparent, ICT industries accounted for about 8.3 per cent of the GDP and
nearly a third of GDP growth between 1995 and 1999 (US Department of Commerce
2000). ICT production also contributed to lower inflation since a growing proportion of
economic output has been in sectors marked by rapidly falling prices (US Department of

10
Commerce 2000)3. Recent evidence suggests that ICT was responsible for 75 per cent of
US productivity growth from 1995 to 2002, and 44 per cent from 2000 to 2006
(Brynjolfsson and Adam Saunders 2010). According to Japan’s Ministry of Internal
Affairs and Communications, Japan’s ICT industry contributed 34 per cent of the
country’s economic growth from 2005 to 2010 (quoted in Ezel 2012).
Developed countries are not the only beneficiaries from the production of IT goods.
Production of IT goods has been a major source of economic output, exports and job
creation even in developing countries like South Korea, Singapore, Thailand, Malaysia
and others. This has been facilitated by their participation in global production network of
IT goods which has a longer history than ITA.
However, it has been argued that production of IT goods need not necessarily be an easy
proposition for the developing countries because industrial structure of IT goods is highly
concentrated with high entry barriers. Industry segments like microprocessors are almost
closed because standards are set by the leading US based IT players like Intel. Most of
the segments of IT industry are highly capital intensive and scale intensive and require
specialized skills that only a few countries can hope to achieve (Kraemer and Dedrick
2001). Moreover, early entrants such as Singapore, Hong Kong, South Korea, Taiwan,
Ireland and Israel have preempted many of these opportunities to a great extent.
While there is some merit in the above argument, a closer look at the characteristics of IT
industry would reveal that the doors are not that firmly closed for the new comers. IT
industry is a multi-product industry and the products may be broadly divided into two
categories; IT goods and IT services4. In each of these broad categories there are a large
number of products that vary in terms of technological intensity, dynamism, investment
and skill requirements (Joseph 1997). This has made possible the segmentation of the
3The report argues that actual inflation fell by 0.5 per cent points a year from 1994 to 1998 due the effect of
declining prices of IT goods. Also IT industry, including telecommunications, employed 7.4 million
workers in 1998 and this accounted for 6.1 per cent of the total employment with an annual wage rate more
than 1.5 times that for all private employees. 4 See Joseph (1997) for a detailed analysis of the product structure of electronics industry and the
implication of product structure for the growth performance.

11
industry into separate, yet closely interacting horizontal layers with greater opportunities
for outsourcing and thus transforming a vertically integrated industry into horizontally
disintegrated but closely interacting market segments. Moreover, as argued by Ernst
(2002) under global production network that characterize IT goods production toady,
geographical dispersion becomes more concentrated in case of high precision design
intensive goods where as in case of lower end products there is high regional dispersion.
Therefore, it is possible that the new comers in developing world could enter profitably
into some of these product lines depending on their technological capability, human
capital availability and the ability to mobilize capital. What is more, in the near future,
the demand for ICT goods and services is likely to increase as the rate of ICT diffusion
increases both in the developing and developed countries.
When it comes to IT services, economists have long since noted that the services in
general are cheaper in developing countries as compared to the developed countries5.
Yet, these countries have been unable to take benefit of this advantage mainly because
the export of most of the services called for the cross border movement of labour. But
the movement of labour, unlike capital, was subjected to series of restrictions. Though the
process of globalization, which inter alia implied the free movement of products and
factors, achieved momentum during the last two decades, there have been hardly any
relaxations in the restrictions on labour mobility. However, the advances in ICT has made
possible, to a great extent, the “splintering off” of many of the services from its providers
which in turn led to what is often called global division of labour and the outsourcing of
services.
No wonder, as noted by a number studies India, with its large pool of skilled manpower
along with supporting policy environment and proactive private sector, has emerged as a
preferred location in the international division of labor in knowledge intensive industries
as well as in Business Process Outsourcing (BPO) and a leading player in the export of
5This has been attributed mainly to the fact that labour is the major input in the production of services and
the abundant supply of labour in less developed countries translate into low wages. Since the technology of
producing services does not differ significantly across counties, lower wages results in low cost of
production of services in less developed countries (Bhagwati 1984).

12
software services (Heeks 1996, Joseph 2002, Kumar and Joseph 2005, Joseph 2012
among others). India is not the only country being benefited from opportunities offered
by BPOs. Countries like China, Philippines and others are also emerging as providers of
BPO services to the developed countries.
Returns to ICT Use
While there were apprehensions about the return to productivity enhancement on account
of ICT use, the evidence from the recent cross-country studies shows that the returns to
investments in ICT in terms of productivity and growth are substantial6. Pohjola (2001)
found the output elasticity of ICT capital as high as 0.31 for the full sample of 39
countries and 0.23 in the OECD sub sample. Another cross-country study by IMF (2001)
also has similar conclusions to offer. Country specific studies like the one for Singapore
(Wong 2001) finds that the net return to ICT capital (37.9 per cent) is about two and a
half times higher than that for non-ICT capital (14.6 per cent). These studies also show
that ICT induced productivity and growth still remains a phenomenon of developed
OECD countries and that the developing countries are yet to catch up.
However, there are also numerous cases to show that developing countries could benefit
from increased access to IT as much as their counterparts in the developed world to
address various development issues like empowering people, improving social service
provision and poverty alleviation.
In the literature on IT and development, the focus of attention has been essentially on IT
use and only limited attempts have been made towards integrating the policy towards
electronics production and diffusion of IT. As argued by Mytelka and Ohiorhenuan
(2000) the often suggested strategies place the developing countries in a situation of
perpetual attente – waiting for the transfers of technology from the North and focusing
their attention on the need to attract transnational corporations to their shore. The studies
on technology diffusion, however, have shown that along with demand side factors,
supply side factors are also important determinants of diffusion. Hence, greater domestic
6 For a review of studies the readers are referred to Indjikian and Siegel (2005)

13
availability of electronics goods acts as a catalyst in the process of diffusion. To the
extent that the present levels of income are important determinants of IT use, there is no
reason why the developing countries should forgo the income earning opportunities
offered by the production of IT goods which could also be instrumental in their industrial
transformation. If the available empirical evidence on technological capability in the
developing world is any indication, the lopsided approach in terms of promoting IT use
while neglecting IT production capabilities, has the potential danger of perpetuating
technological dependence on the one hand and foregoing opportunities for income and
employment generation on the other (UNCTAD 2012; Joseph and Parayil 2008).
Promoting production and use of IT: Role of trade and investment
The key issue of relevance here pertains to the factors that help developing countries to
leapfrog in the field of information technology by promoting its production and use and
the bearing of trade and investment therein.
The virtues of trade liberalization, the underlying economic rationale for the ITA,
resulting from the removal of tariff and non-tariff barriers have been well articulated in
the literature (Dornbusch 1992, Kruger 1997, Srinivasan and Bhagwati 1999). With the
removal of tariff barriers, there will be a corresponding reduction in the price of imported
goods. The removal of non-tariff barriers could also lead to enhanced supply and
increased access to imported goods and services. The implications of the reduction in
price and increased access may vary from country to country and also between sectors
within an economy. Yet, in the case of a developing country the following
generalizations may be in order. The decline in domestic prices is likely to make the
goods and services more affordable and therefore could act as a catalyst in the process of
diffusion/use of IT into other sectors of the economy. If the available empirical evidence
is any indication, the increased use/diffusion of IT could help in increasing the efficiency,
productivity and competitiveness of the IT using sectors. The resultant higher output
growth could lead to higher income and employment generation in the domestic economy
as a whole. This impact is likely to be strong in the case of less developed countries

14
wherein the affordability, on account of low per capita income and higher price, is a
major constraint in promoting IT use.
Second effect refers to the impact on domestic IT producing sector on account of
increased competition and greater access to needed inputs for production that in turn
underscore the link between trade and investment. Increased competition, apart from
inducing firms to cut cost of production, leads to the exit of inefficient firms and the
absorption of their market share by more efficient ones leading to economies of scale and
industry level efficiency.
The link between trade and investment, however, is conditioned by the product
characteristics and organization of production. This link is likely to be stronger in
assembly-oriented industries as compared to process industries. In an assembly-oriented
industry like IT goods, production essentially involves assembling a number of
components and sub assemblies based on a design. The production of needed components
and subassemblies may be highly skill, capital and/or scale intensive that no country
could afford to have the capacity to produce all the needed components and other
accessories. Hence there is the need for rationalizing their production across different
locations. This is what led to the global production networks (Ernst and Kim 2002) and
the international division of labour in IT production. Thus in the global production
network, production of each of the component or sub assembly is made across different
countries according to their comparative advantage such that the overall cost of
production is minimized. This essentially means that the production in any country will
call for significant imports and bulk of the output will have to be exported to other
countries rather than sold in the domestic market. Hence if the production, and therefore
investment, in IT is to take place in any country the trade regime needs to be the one
wherein the free flow of inputs into and outputs out of the economy is ensured. Thus
viewed, there is an inexorable link between trade and investment, which is apparently
much stronger in IT goods as compared to most other industries.

15
Limits to Trade liberalization
While the theoretical case for trade and investment liberalization is elegant, when it
comes to the experience of developing countries that resorted to trade liberalization as a
short cut to prosperity we have a mixed picture. Here it may be apt to quote Stiglitz
“Globalization itself is neither good nor bad. It has the power to do enormous
good, and for the countries of East Asia who have embraced globalization under
their own terms, at their own pace, it has been an enormous benefit…..But in
much of the world it has not brought comparable benefits. For many it seems
closer to an unmitigated disaster” (Stiglitz 2002 p.20).
After analyzing the trade reform policies in developing countries Rodrik (1992)
convincingly concludes that
“trade policy plays a rather asymmetric role in development: an abysmal trade
regime can perhaps drive a country into economic ruin; but good trade policy
alone cannot make a poor country rich” (p 103).
Trade policy, at best, provides an enabling environment for development. Perhaps most
emphatic was Arthur Lewis who stated as early as in 1978. To quote
“the engine of growth should be technological change with international trade serving as lubricating oil and not as fuel”. He continued “….international trade cannot substitute for technological change, so those who depend on it as their major hope are doomed to frustration” (Lewis 1978; p 74).
In case of IT production, the link between trade and investment notwithstanding, it has
been shown that local capabilities are critical for attracting investment and promoting
production and trade. In a context wherein low labour cost is taken for granted by the
MNCs, the ability of the developing countries to participate in global production network
is governed by their ability to provide certain specialized capabilities that the MNCs need
in order to complement their own core competence (Lall 2001, Ernst and Lundvall 2000).
Countries that cannot provide such capabilities are kept out of the circuit of international
production network despite their liberal trade regime. Also as argued by Cantwell (1995),
Dunning (1996), Makino et al (2002) and Pearce (1999) the MNCs have been following
the knowledge-based asset-seeking strategies along with natural resource-seeking,
market-seeking and efficiency-seeking strategies to reinforce their competitive strengths.
16
More importantly to get rid of the risk of getting locked up at the low end of the value
chain and to facilitate movement along the continuum of Original Equipment
Manufacturer (OEM) to Original Brand Manufacturer (OBM) and finally to Original
Design Manufacturer (ODM) (Hobday 1994) there is the need for building up an
innovation system while resorting to a liberal trade and investment regime. In a similar
vein, along with numerous studies, a survey by Saggi (2002) concludes that the
absorptive capacity of the host country is crucial for obtaining significant benefits from
FDI. Without adequate human capital or investment in R&D, spillovers from FDI are
infeasible.
When it comes to IT use, lower prices resulting from trade liberalization need not
necessarily promote IT demand and its diffusion unless the developing countries have the
capability to use it. Hence trade liberalization has to be accompanied by capacity
building such that needed local content is developed and capabilities are created to
facilitate its effective use. This calls for complementing the liberalized trade and FDI
policies with appropriate policy measures and institutional interventions with respect to
education, R&D and human capital such that learning capabilities are enhanced in all
parts of the economy – the central concern of studies on innovation system.
In the similar vein, The World Bank (2000) underlined the role of following factors; an
educated and skilled population that can create and use knowledge, a dynamic national
Information Infrastructure (NII) that consists of telecommunication networks, strategic
information systems and the policy and legal frameworks affecting their deployment, an
interlinked system of research centers, universities, firms and other organizations that can
tap into the growing stock of global knowledge, assimilate and adapt it to local needs and
create new knowledge. All these can be grouped into what is now referred to in the
literature as an innovation system.
Drawing from the above discussion it may be inferred the liberalized trade could at best be
construed as a necessary condition for promoting IT production and use and the necessary
condition being a vibrant innovation system at the national, regional and the sectoral level.

17
3. On the data base
As acknowledged by the earlier studies, since ITA covers a large number products there
are serious issues with the definition of IT goods as well as their classification into
different subgroups. For example, on account of technological changes, the distinction
between the traditionally considered categories like electronic consumer goods and the
electronic capital goods like computers and communication equipment is increasingly
getting blurred. To complicate the issue further, COMTRADE, the only data base at the
country level trade in IT goods, has undergone nomenclature revisions in 2002 and more
significantly in 2007, complicating the construction of a consistent times series for ITA
product trade. Quantifying trade in Attachment B products is additionally challenging
because most countries provided their own list of tariff codes, usually at the national line
level (i.e. the 8- or 10-digit level), where these products may be classified, and some
countries have not provided a list. Here it needs to be noted that most of the previous
studies have made use of HS 1996 as they dealt only with the post ITA period. While HS
1992 provides data from 1988 to 2011 data from HS 1996 refers to 1997-2011 only.
Thus for the period since 1997 we have two series of data one by HS 1992 and the other
by HS 1996. To make our analysis comparable to that of previous studies, we make use
of HS 1996 and HS 1992 for the post ITA period while the analysis of pre ITA period is
based on HS 1992. However, it needs to be noted that on account of the differences in
HS definition of IT goods, trade data with HS 1996 is not strictly comparable to HS 1992.
As is evident from table 1, total exports and imports are lower as per HS1992 when
compared to HS 1996.
To illustrate, as per HS 1992, the total export of ITA products by the member countries in
1988 amounted to $ 35.6 billion and by 1996 it recorded more than eight fold increase to
reach $ 277.5 billion and further increased to $ 930.8 billion (over three fold increase) by
2011. This turns out to be an under estimate when compared to HS 1996. According to
HS 1996 total exports in 1997 was as high as $456.5 billion which increased to $ 1540.5
billion in 2011 (around threefold increase same as that we have seen with respect to HS
1992). Thus, HS 1992 and HS 1996 vary in terms of level the growth rate observed

18
appears to be comparable regardless of HS 1992 or HS 1996. Here it is important to note
that the data that we have recorded using HS 1996 are in tune with the data compiled by
and made use of in WTO (2012). In the analysis that follows we shall make use of both
of these datasets to present a comparative picture between the pre and post ITA periods.
To the extent that ITA member countries accounts for more than 95% of global trade in
IT goods, in our analysis we focus only on the ITA member countries.
Table 1: Trend in global trade in ITA goods as per HS 1992 and HS 1996 – All
countries (in US $ in Billion)
Year HS 1992 HS 1996
Export Import Export Import
1988 35.59 22.97
1989 52.34 45.68
1990 61.44 57.22
1991 97.71 88.86
1992 121.97 114.40
1993 153.12 147.64
1994 204.41 204.65
1995 265.74 269.49
1996 277.48 287.55 456.48 482.26
1997 308.43 320.92 594.53 606.96
1998 320.20 336.38 602.49 631.51
1999 362.73 382.35 693.86 727.76
2000 466.42 484.57 886.59 923.7
2001 413.21 436.90 769.92 813.32
2002 429.56 453.07 775.82 810.53
2003 485.47 515.13 881.51 929.14
2004 599.85 637.79 1075.69 1147.35
2005 695.00 721.44 1204.68 1290.18
2006 812.90 827.85 1380.31 1463.27
2007 816.83 891.74 1340.23 1463.79
2008 849.93 937.12 1374.33 1510.06
2009 714.33 796.60 1178.52 1295.7
2010 882.01 1014.19 1450.65 1645.82
2011 930.82 1062.53 1540.49 1750.26
Source: compiled from Comtrade

19
4. Empirical results
Tariff reduction, exports and imports
As already noted, ITA quintessentially is a tariff cutting mechanism and the estimates
showed that simple average tariffs over all ITA products before the Agreement was 3.6
per cent for ITA members, compared to 11.2 per cent for non-members. According to the
WTO, average bound tariff rates for ITA products for developed countries were reduced
from 4.9 per cent to zero per cent (WTO 2008). Their initial rates ranged from one per
cent to 12.1 per cent, as compared to 1.2 per cent to 66.4 per cent for developing
countries. Since the developing countries had considerably higher bound rates before the
Agreement, several developing countries implemented significant tariff liberalization to
achieve duty free trade under the ITA. The largest concessions based on pre-ITA bound
rates, had to be made by India (66.4 per cent) followed by Thailand (30.9 per cent) and
Turkey (24.9 per cent). Similarly, for applied tariff rates, developing countries’ pre-ITA
tariffs were generally higher than the average 2.7 per cent for developed countries.
Notable average applied-tariff reductions for developing countries included those of India
(from 36.3 per cent) China (from 12.7 per cent) and Egypt (from 12.1 per cent) (Mann
and Liu 2007).
While analyzing the trend in export and imports during the post ITA period in
comparison with the pre ITA period an issue of concern might be the low base during the
pre ITA period. With a view to address this issue we have estimated the trend (log)
growth rates along with the annual growth rates. Table 2 presents the annual growth rates
as well as the trend (log) growth rates in the exports for the two sub periods - pre ITA
(1988-1996) and post ITA (1997-2011). Let us begin by analyzing the trend growth in
total exports. As per HS 1992 the recorded trend growth rate in total export of IT goods
during the pre-ITA period was 30 per cent. When it comes to post ITA period, the
recorded growth rate in total exports using HS 1992 declined to 8.4 per cent which is
found comparable to the recorded trend growth rates (7%) using HS 1996. Thus it is
evident that post ITA period was marked by a deceleration in exports. The observed
deceleration in exports since 1997 despite ITA also needs to be seen in the context of

20
Asian financial crisis of late 1990s, dotcom crisis of early 1990s and the global financial
crisis since 2007.
It is interesting to note that during pre ITA period exports of all the product groups were
growing in a balanced manner without much variation across different product groups in
terms of the recorded trend growth rates. With plausible exception of ITA 6 (data storage
media and software) with 20 per cent growth rate, all the other products have recorded
trend growth rates above 25 per cent during the pre ITA period. When it comes to post-
ITA period, we get a different picture regardless of the data (HS 1992 or HS1996) set that
we use. Let us
Table 2: Trend growth rates and annual growth rates in the export of different IT goods
Year/Period
Annual average growth rates
ITA1 ITA2 ITA3 ITA4 ITA5 ITA6 ITA7 Total
HS
19
92
1989 43.56 71.24 75.22 114.47 36.44 12.46 66.88 61.35
1990 -9.31 11.56 14.55 71.48 7.73 15.53 18.37 16.16
1991 111.30 79.45 60.26 50.34 170.18 88.10 106.96 96.26
1992 23.25 30.47 10.53 10.20 13.58 19.94 26.52 22.33
1993 38.00 42.85 31.15 8.07 17.03 11.94 25.79 26.28
1994 10.56 51.63 38.90 33.96 27.77 10.71 32.93 33.47
1995 -0.18 37.97 42.55 62.62 19.57 11.63 25.80 28.67
1996 62.29 6.62 -3.25 9.56 6.21 8.83 5.99 4.58
Trend GR
Pre ITA
26.1 (10.99)*
34.4 (21.41)*
27.4 (16.04)*
31.0 (9.57)*
28.8 (9.08)*
20.3 (8.97)*
31.3 (12.81)*
29.9 (13.99)*
HS
1996
1998 -0.88 18.17 -3.40 -9.52 -0.70 -0.70 2.23 0.91
1999 7.47 23.21 20.08 31.01 5.93 5.32 18.93 16.13
2000 10.56 34.04 39.64 79.13 9.11 -7.87 29.81 27.48
2001 -6.88 -6.46 -22.30 -32.96 7.59 -11.41 -12.49 -13.59
2002 -0.86 5.11 6.91 -6.41 -1.73 -4.12 -2.94 1.15
2003 18.09 6.86 16.17 8.95 14.78 14.08 12.28 14.02
2004 21.39 31.10 18.80 78.44 16.57 14.02 21.78 22.28
2005 11.90 27.12 6.22 -3.05 10.38 17.44 12.47 12.20
2006 10.48 23.26 14.13 26.75 13.42 5.03 13.92 14.55
2007 1.85 -4.08 8.92 -56.00 11.96 1.61 -13.88 -2.67
2008 1.23 6.53 -2.28 -16.38 10.35 -2.35 5.27 2.11
2009 -15.06 -12.21 -10.21 -46.55 -12.94 -14.11 -19.04 -14.42
2010 20.90 14.66 32.41 96.62 16.02 0.04 20.74 23.08
2011 6.83 18.54 2.35 15.10 17.58 4.15 2.41 6.29

21
Trend GR
Post ITA
6.2 (10.07)*
11.3 (13.19)*
7.8 (11.92)*
0.4 (0.13)ns
8.3 (18.65)*
2.1 (2.86)**
5.4 (6.37)*
7.0 (10.52)*
Trend GR HS92
Post ITA
-18.0 (-6.56)*
10.6 (6.60)*
11.3 (15.35)*
10.0 (6.92)*
8.2 (17.65)*
7.8 (6.30)*
6.8 (10.69)*
8.4 (12.22)*
Note: ITA -1: Computers and calculating machines; ITA-2: Telecommunication equipment; ITA-3:
Semiconductors; ITA-4: Semiconductor manufacturing equipment; ITA-5: Instrument and apparatus
ITA-6: data storage media and software; ITA-7: Parts and accessories
*, ** - Growth rates are statistically significant at 1 per cent and 5 per cent levels respectively
ns: statistically not significant Figures in parenthesis indicate corresponding t-values
Pre-ITA period: 1988 – 1996; Post-ITA period: 1997-2011
begin with HS 1996 database. As per this data during post 1997, along with a lower
growth rate in total exports (7.0%) there has been wide variation in the recorded growth
rate across different product groups that ranged from 0.4 per cent in the case of ITA 4
semiconductor manufacturing equipment (ITA4) to as high as 11.3 per cent in the case of
Telecommunication equipment (ITA2). When it comes to growth rates in different
product categories based on HS 1992 the observed growth rates ranged from -18 per cent
in case of Computers and calculating machines (ITA1) to 11.3 per cent in case of
semiconductors (ITA3) product group.
Further interesting observations could be made from the annual growth rates presented in
the table. During the pre ITA period there was hardly any year in which recorded growth
rate in total export was negative indicating a more stable growth pattern. The stability in
growth was confined not only with respect to total exports but also in different product
categories. During the pre ITA period, out of the seven product groups, negative growth
rate was observed only in the case of ITA-1 (Computers and calculating machines) and
that too was confined to only two years (1990 and 1995)
The picture changes in its entirety as we move to the post ITA period as the recorded
growth of total exports was negative in three years with the negative growth rates in 2001
and 2009 being as high as -13.6 and -14.4 respectively. Further, it is also evident that
there has been only six years during the post ITA period wherein no product groups
recorded negative growth rate. It appears that while pre ITA period was characterized by

22
more stable export performance, it became more volatile during the post ITA period
which could be attributed to different external shocks as indicated above. A definite
conclusion is not warranted without more systematic analysis.
From the above discussion it could be inferred that regardless of the HS classification
used, there has not been any marked increase in growth of ITA goods exports during the
post ITA period as compared to the pre ITA period. Instead, there has been drastic
decline in export growth during the post-ITA period. This has not attracted the attention
of previous studies because of their exclusive concern with the post ITA period. This in
turn has led these studies to infer that ITA has been associated with high export
performance. Our analysis of growth during the post ITA period in comparison with the
pre ITA period tend to suggest that there is hardly any empirical evidence for the growth
augmenting effect of ITA highlighted by the earlier studies.
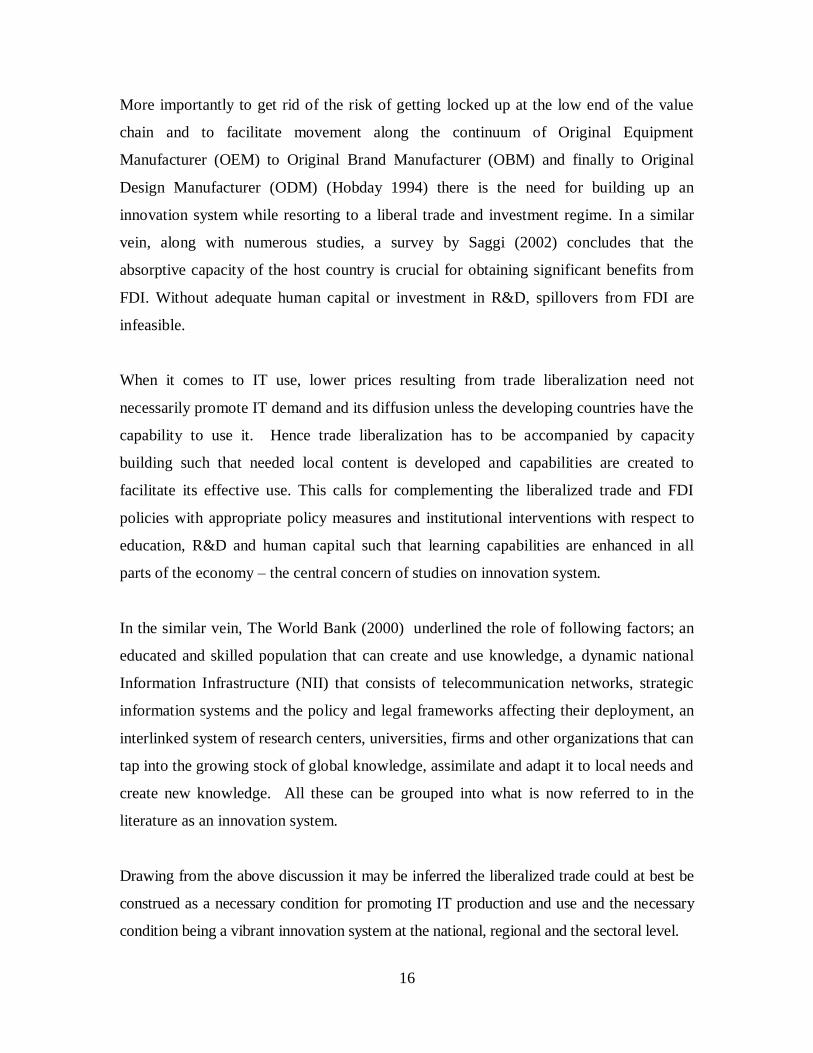
Trend in imports
In analyzing the growth in imports we have followed the same method as in case of
exports. The results of the estimated trend (log) growth rates for the two sub-periods as
well as the annual growth rates are reported in table 3.
The broad pattern that emerges from the table is in tune with what we have observed in
case of exports. As per the trend growth rates in total imports based on HS1992, we find
a drastic decline in growth rates from over 35 per cent during to pre ITA period to 8.8 per
cent during the post ITA period. The extent of decline in growth rates higher as per HS
1996 as the estimated growth rate is only 7.4 per cent. Thus the deceleration in growth
stands regardless of the database used.
As in case of exports, the estimated annual growth rates in different product groups tends
to suggest that the variability in growth across different product groups increased during
the post ITA period as compared to the pre ITA period. To be more specific during the
pre ITA period, while total exports recorded a growth rate of 35 per cent per annum, the
highest growth was in case of communication equipment (47.6) and the lowest being

23
25.6% in case of computers. When it comes to the post ITA period, the growth rtaes in
imports declined to 7.4 percent (as per HS 1996) with highest growth in case of
semiconductors (9.7) and the lowest was in case of semiconductor manufacturing
equipment (1.1%). in per cent. The variability in the imports growth across different
product groups increases if we look at the growth rates based on HS 1992. The table also
suggests that growth pattern became more unstable during the post ITA period as
compared to the pre ITA period. Yet the import behavior in general has been more stable
as compared to exports. We have seen that during the post ITA period exports recorded
negative growth rates in three years where as in imports only two years recorded negative
growth rates.
Table 3: Trend growth rates and annual growth rates in the import of different IT goods
HS classification Year ITA -1 ITA -2 ITA -3 ITA -4 ITA -5 ITA -6 ITA -7 All products
HS
19
92
1989 40.89 211.72 122.21 89.69 96.60 184.82 162.38 145.24
1990 -3.82 34.05 27.35 35.21 12.33 16.50 21.31 22.14
1991 115.88 159.75 58.45 145.49 95.07 143.00 107.87 97.84
1992 19.27 31.91 21.33 19.16 18.73 24.60 29.02 26.48
1993 18.04 61.67 31.49 1.72 15.77 25.12 27.51 29.09
1994 19.23 46.47 41.85 56.72 36.72 17.00 38.77 38.53
1995 14.62 37.56 42.49 49.33 18.98 12.00 29.26 31.16
1996 41.08 1.53 2.32 21.45 4.89 6.82 6.67 5.40
Trend GR 25.6 (12.18)*
47.6 (10.57)*
32.3 (13.56)*
37.3 (12.28)*
28.2 (10.29)*
33.6 (6.85)*
36.3 (10.24)*
35.1 (10.10)*
HS
1996
1998 4.56 14.13 -3.59 -7.47 -2.06 0.89 7.63 3.55
1999 11.46 30.22 21.24 32.98 8.00 5.27 16.93 17.24
2000 10.47 39.32 42.88 66.50 13.98 -10.17 25.29 26.62
2001 -8.96 -4.63 -20.18 -23.63 5.68 -9.70 -11.54 -12.62
2002 0.27 -0.97 7.83 -20.11 -0.75 -2.66 -4.31 0.51
2003 13.02 12.32 18.14 15.39 11.57 15.39 13.64 14.68
2004 17.22 32.31 25.03 60.61 17.59 19.08 21.57 22.99
2005 8.92 22.90 9.78 3.33 8.55 21.60 12.52 12.07
2006 6.48 14.20 15.41 29.50 12.82 11.17 13.99 12.87
2007 -5.20 10.27 10.98 -49.28 8.35 0.24 -9.34 0.58
2008 2.02 6.81 -0.95 -13.55 9.67 -3.06 1.17 1.44
2009 -15.27 -9.63 -11.42 -50.72 -14.11 -8.37 -18.18 -13.89
2010 24.08 20.01 35.30 101.12 18.23 5.28 22.22 26.56
2011 10.74 19.26 2.09 19.94 16.05 8.39 -0.65 6.20
Trend GR Post ITA
4.6 (8.56)*
12.5 (16.63)*
9.7 (13.76)*
1.1 (0.47)ns
7.8 (19.20)*
4.3 (5.16)*
5.5 (6.68)*
7.4 (11.59)*
24
Post ITA HS1992
-15.9 (-6.486)*
13.3 (10.295)*
11.2 (18.458)*
9.7 (7.056)*
7.6 (17.879)
9.5 (9.396)*
6.9 (11.092)*
8.8 (14.872)*
Note: ITA -1: Computers and calculating machines; ITA-2: Telecommunication equipment; ITA-3:
Semiconductors; ITA-4: Semiconductor manufacturing equipment; ITA-5: Instrument and apparatus
ITA-6: data storage media and software; ITA-7: Parts and accessories
The first period (pre – ITA) data is based on UN-Comtrade classification (H0) HS1992, and the second period (post ITA) data is based on classification HS1996 (H1).
*, ** - Growth rates are statistically significant at 1 per cent and 5 per cent levels respectively
ns: statistically not significant
Figures in parenthesis indicate corresponding t-values
Pre-ITA period: 1988 – 1996; Post-ITA period: 1997-2011
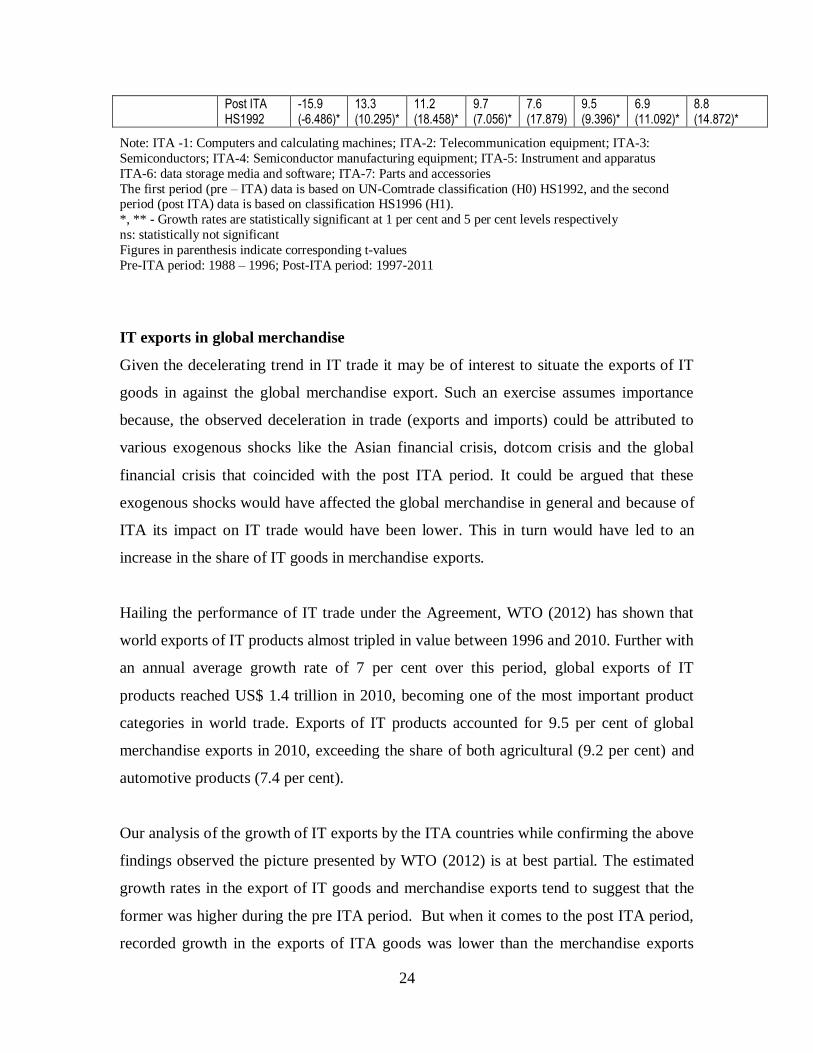
IT exports in global merchandise
Given the decelerating trend in IT trade it may be of interest to situate the exports of IT
goods in against the global merchandise export. Such an exercise assumes importance
because, the observed deceleration in trade (exports and imports) could be attributed to
various exogenous shocks like the Asian financial crisis, dotcom crisis and the global
financial crisis that coincided with the post ITA period. It could be argued that these
exogenous shocks would have affected the global merchandise in general and because of
ITA its impact on IT trade would have been lower. This in turn would have led to an
increase in the share of IT goods in merchandise exports.
Hailing the performance of IT trade under the Agreement, WTO (2012) has shown that
world exports of IT products almost tripled in value between 1996 and 2010. Further with
an annual average growth rate of 7 per cent over this period, global exports of IT
products reached US$ 1.4 trillion in 2010, becoming one of the most important product
categories in world trade. Exports of IT products accounted for 9.5 per cent of global
merchandise exports in 2010, exceeding the share of both agricultural (9.2 per cent) and
automotive products (7.4 per cent).
Our analysis of the growth of IT exports by the ITA countries while confirming the above
findings observed the picture presented by WTO (2012) is at best partial. The estimated
growth rates in the export of IT goods and merchandise exports tend to suggest that the
former was higher during the pre ITA period. But when it comes to the post ITA period,
recorded growth in the exports of ITA goods was lower than the merchandise exports

25
(see table 4). As a result, as per HS1992 the share if IT products in merchandise exports
showed a steadily increasing trend up to 2000 and declined thereafter. The declining
trend after 2000 is confirmed by the data based on HS 1996 as well. To be more specific
the share of IT products in global merchandise increased from 10 per cent on 1996 to
over 14 per cent in 2000 and thereafter declined to 8.8 per cent in 2011 which is lower
than the 1996 level (10.1%). In general, despite ITA, export performance of IT goods
could not keep pace with global merchandise trade.
Table 4: Share of ITA exports by ITA countries in global merchandise exports
Year Global Merchandise Export (Billion US$) IT exports (Billion US$) Share of IT (%)
HS1992 HS1996 HS1992 HS1996 HS1992 HS1996
1988 785.24
26.35
3.36
1989 1200.87
42.51
3.54
1990 1378.18
49.38
3.58
1991 1917.71
96.91
5.05
1992 2457.66
118.56
4.82
1993 2832.13
149.72
5.29
1994 3758.70
199.83
5.32
1995 4683.01
257.12
5.49
1996 4997.00 4353.28 268.88 441.16 5.38 10.13
1997 5180.40 4921.23 297.76 574.83 5.75 11.68
1998 5156.75 4969.24 308.21 580.05 5.98 11.67
1999 5347.40 5261.46 352.06 673.59 6.58 12.80
2000 6113.09 6044.79 450.43 858.66 7.37 14.20
2001 5912.29 5867.94 398.61 742.00 6.74 12.64
2002 6217.16 6191.21 417.17 750.57 6.71 12.12
2003 7267.52 7239.33 472.57 855.81 6.50 11.82
2004 8818.74 8780.21 584.70 1046.45 6.63 11.92
2005 9951.21 9939.45 676.85 1174.16 6.80 11.81
2006 11621.74 11606.82 789.90 1345.05 6.80 11.59
2007 13261.27 13243.35 796.21 1309.14 6.00 9.89
2008 15341.98 15340.23 822.67 1336.74 5.36 8.71
2009 11943.43 11943.43 690.57 1143.98 5.78 9.58
2010 14495.03 14495.03 855.77 1408.04 5.90 9.71
2011 16963.48 16963.48 906.77 1496.65 5.35 8.82
Source: Estimated based on Comtrade data

26
Developing Asian countries and global production network
It has been argued that the liberalized trade regime under ITA has been instrumental in
widening the scope of global production network that characterized electronics
production which in turn has been beneficial to the developing countries in general and
Asian countries in particular.
GPN is not a new phenomenon and many scholars have already studied the participation
of South East Asian countries in electronics GPN which has a longer history. Based on a
detailed analysis of the electronics industries in South East Asia, Ernst (2001) argued that
export-oriented production can no longer guarantee sustained growth and welfare
improvement on account of sticky specialization of exportable `commodities’. Moreover,
a narrow domestic knowledge base has been leading to limited industrial upgrading and
limited backward and forward linkages. Evidence also suggests that IT induced
prosperity in general and electronics production in particular has been confined to few
locations leading to an enclave type development and contributing towards widening
regional and personal inequalities (Joseph 2006).
It has also been argued that most of these countries have specialized in the mass
production of a few products mainly for the export market. This has led to a kind of
sticky specialization with limited backward and forward linkages especially for materials
and production equipment that gave rise to very high level of import dependence and
limited value addition. In the case of Thailand, Mephokee (2003) noted that Thai IT firms
play a small subcontracting role by supplying minor components for foreign firms in the
IT industry. There are four main reasons for the firms to import these components from
foreign suppliers: First, the production technology belongs to foreign parent companies.
Secondly, there are no domestic components because the production technology is not
available in Thailand. Thirdly, the quality of domestic components cannot meet the
foreign company’s requirements. Finally, it is easier to deal with foreign suppliers with
whom long-term relationship has already been established. Thus the study concludes that
Thai firms have small room to play in the Thai IT industry.

27
A striking feature, which could partly be attributed to the strategy being adopted, is the
mismatch between local production and consumption both at the component and
equipment level. To illustrate, in the case of telecommunication equipment, Thailand
exports almost 70 per cent of its production and at the same time imports more than 70
per cent of its domestic demand (Joseph 2006). The case with semiconductor devices
also appears not different. The narrow production base with export orientation also has
the effect of making the industry highly susceptible to international market fluctuations.
In such a context the need for upgrading of East Asia’s electronic industry has been
underlined. While the issue of industrial upgrading is most pertinent in case for some
countries that remain at the low end of global production network, for a large number of
countries, for whom development of an electronics production base and IT based
development still remain a distant dream, the key is how to make an entry into the global
production network. The moot question in the context of present study is to explore the
extent to which ITA has been enabling new countries to participate in the production
network and upgrading the position of those already been into the network.
With a view to explore this issue we have analysed the share of Asian countries in the
global export and import of IT goods (see table 5). The table confirms the remarkable
increase in the share of China in the global export of IT goods noted by the earlier
studies. It is also evident that, as per HS 1996, the share of ITA members from Asia also
increased from 41 per cent in 1997 to 67 per cent 2011. This increase, as evident from the
table, is mostly on account of the more than 10 fold increase in China’s share from 2.5
per cent in 1997 to over 28 per cent in 2011. To the extent that China has done
exceedingly well in the merchandise export in general, its performance in IT goods
cannot be attributed entirely to ITA alone.
As already noted the issue of importance is the influence of ITA on countries like
Thailand, Malaysia, Indonesia and Philippines that entered the Global electronics
production network even before ITA. The table tends to suggest that the share of these
countries in the global export of IT goods while increased during the pre ITA period

28
recorded a decline after ITA. This especially holds in case of Malaysia, Indonesia and
Philippines regardless of HS 1992 or HS1996. Moreover, with plausible exception of
Vietnam, there has been hardly any new country that managed to increase their share in
Global trade in 2011 as compared to 1997. Hence the argument that ITA has been
instrumental in strengthening global production network does not have the required
empirical basis.
Table 5: Share of Asian countries [in the world exports of ITA goods]
Country HS1992 HS1996
1991 1997 2001 2007 2011 1997 2001 2007 2011
Bahrain
0.00 0.00 0.00
0 0.01
China
2.57 5.75 18.41 25.55 2.53 5.3 21.67 28.13
China, Hong Kong SAR
6.39 6.99 10.67 14.00 4.73 5.55 9.1 12.02
China, Macao SAR 0.04 0.01 0.00 0.01
0 0 0.01
India 0.11 0.07 0.12 0.12 0.61 0.06 0.08 0.11 0.42
Indonesia 0.06 0.36 0.45 0.22 0.27 0.27 0.42 0.26 0.22
Japan 26.03 14.26 10.93 8.24 6.21 14.2 10.18 6.85 5.21
Kuwait
0.00 0.01
0.01
Malaysia 4.48 4.62 5.30 3.87 3.39 4.9 5.1 4.93 3.93
Oman 0.00 0.00 0.01 0.01 0.01
0 0 0
Philippines
1.32 1.43 0.75 0.66
2.74 2.19 0.84
Rep. of Korea 6.95 2.27 4.57 6.52 5.95 4.81 4.94 6.79 6.39
Saudi Arabia 0.01
0.01 0.01 0.03
0 0.01 0.02
Singapore 7.34 8.77 7.46 11.34 8.12 10.11 8.16 7.82 7.86
Thailand 2.78 2.76 2.41 1.34 1.48
1.9 2.17 1.96
United Arab Emirates
0.38
0.27
Viet Nam
0.13 0.10
0.07 0.14
Total 47.81 43.41 45.56 62.01 66.27 41.61 44.46 62.34 67.02
Source: Estimates based on Comtrade data.
Trend in country concentration in exports
As noted by ITC (1999) Transnational Corporations (TNCs) hold a large share of the
markets, production and investment in this knowledge-intensive sector. On the eve of

29
ITA (1997), out of the leading 100 TNCs, 22 were in the electronics sector7. Among
these, eight originated in the United States and EU respectively, and six in Japan.
Companies based in the United States dominated the sectors for high-end computers,
semiconductors, telecommunications, computer software, and semiconductor
manufacturing equipment. As is evident from WTO (2012), the initiative for ITA was
taken by these leading multinational companies and it is of interest to examine, to what
extent ITA has been able to bring about a more competitive environment with a more
globally distributed production of ITA goods.
To analyse the extent of competition ideally we need to examine the share of leading
firms in the export of IT goods. Since such data is hard to obtain for the large number of
products that we examine, as a next best alternative we have analyzed the share of
leading countries in ITA goods exports. As in the previous section, analysis of the pre-
ITA period is based on HS 1992 and that of post-ITA is based on HS 1996 of
COMTRADE.
Table 6: Trend in the share top 4 countries in the export of IT goods (%)
Period ITA -1 ITA-2 ITA-3 ITA-4 ITA-5 ITA-6 ITA-7 Total
1989 75.29 75.11 82.65 97.10 87.39 95.20 82.61 83.47
1990 70.71 72.28 81.90 98.48 85.80 93.04 80.03 81.38
1991 76.60 78.10 75.73 97.94 86.08 91.59 78.74 79.55
1992 70.60 70.88 69.93 94.14 75.84 72.98 64.56 67.22
1993 69.01 63.37 62.12 95.77 67.53 63.51 57.47 59.78
1994 69.92 55.84 57.90 89.39 55.68 58.65 53.72 55.16
1995 65.37 53.90 59.68 87.42 53.46 56.60 50.81 53.38
1996 63.42 56.65 63.28 84.95 53.77 60.80 48.72 53.08
1997 67.80 56.81 61.48 84.90 55.36 59.92 48.52 52.71
1998 63.33 53.21 60.85 83.08 55.47 60.33 45.79 50.55
1999 61.47 47.43 64.76 81.33 57.39 57.39 43.16 48.85
2000 58.19 40.14 64.78 81.73 58.06 56.78 42.80 47.63
2001 59.72 44.78 62.80 81.81 56.53 53.36 41.21 46.56
2002 61.57 48.92 62.08 78.24 53.88 52.77 43.25 48.71
2003 61.99 46.36 60.90 77.97 53.04 50.98 47.07 50.24
7 In 2011, only 7 of the top 100 TNCs were in the electronics sector. Of these, 3 were US, 3 European and 1
Japanese. Among the top 100 TNCs among developing and transition economies, 12 were in this sector --
all from East Asia. I am Thankful to Torbjorn Frederickson for this information.

30
2004 62.01 50.23 62.17 77.47 54.27 53.43 48.01 51.76
2005 63.35 52.57 58.98 76.57 54.09 53.64 49.71 52.49
2006 72.46 59.79 59.05 77.90 53.79 55.00 50.44 54.60
2007 89.20 56.16 67.38 76.01 55.57 57.66 53.74 57.88
2008 69.31 63.15 61.75 75.64 54.27 59.07 52.86 56.84
2009 75.36 66.75 60.63 66.86 55.16 54.01 55.77 58.63
2010 76.95 65.43 61.46 68.78 55.18 54.82 58.18 59.93
2011 75.61 66.28 60.30 71.53 54.13 55.09 60.39 60.93
Note: Note: ITA -1: Computers and calculating machines; ITA-2: Telecommunication equipment; ITA-3:
Semiconductors; ITA-4: Semiconductor manufacturing equipment; ITA-5: Instrument and apparatus
ITA-6: data storage media and software; ITA-7: Parts and accessories
It is evident from Table 6 that in 1989 top four ITA member countries accounted for over
83 per cent of global trade in IT goods. The table further reveals that their share has been
declining steadily since 1989. The trend seems to have reversed after ITA and upward
trend in the share of four countries became more pronounced since 2001. To be more
precise, the share of top 4 countries declined from 83 per cent in 1989 to 46 per cent in
2001. From 2001 there has been an upward trend to reach 61 per cent 2011 – an increase
of 15 per cent! The trend in concentration that comes out at different product group level
is also in tune with that of the total exports. Out of the seven four product groups, four of
them (ITA 1, ITA2, ITA6 and ITA 7) showed a downward trend in the share of top four
exporting countries up to around 2000 and showed an increase since then in their share
by about 15 per cent. The increase in the share to top four countries is further evident
from fig 1.
Fig 1: Trend in the global share of top 4 IT exporting countries

31
Note: ITA -1: Computers and calculating machines; ITA-2: Telecommunication equipment; ITA-3:
Semiconductors; ITA-4: Semiconductor manufacturing equipment; ITA-5: Instrument and apparatus
ITA-6: data storage media and software; ITA-7: Parts and accessories
While our analysis, based on country level concentration ratios, is only indicative, there is
enough evidence to suggest that the market power of MNCs has been increasing over
time. Let us take the case of personal computers. According Gartner, five large MNCs
(Compaq 13.1%, IBM 8.6%, Dell 5.5% HP 5.3% and NEC 5.1%) together accounted for
only 37.5 per cent of the global market in 1997. By 2012 the share of five top
multinationals increased to 58.8% (HP 16% Lenovo 14.8%, Dell 10.7% Acer 10.4% and
Asus 6.9%)8.
If we take the case of semiconductors the situation is not different. Based on KPMG
report top five MNCs accounted for 35 per cent of the global market in 2010. Further
during 2009-10 Intel improved its revenue by 24%, Samsung by 60%, Texas instruments
by 34%. What is more, among the top 10 MNCs, five of them recorded more than 30 per
cent increase in their revenue9. In case of mobile phones, share of top five firms
(Samsung 22.7%, Nokia 18%, Apple 9.2% ZTE 3.4% and LG 3.2%) accounted for 56.5
% of the global market in 2011(Gartner). As is evident from table 7 one of the MNCs
holds leading position in seven products with more than 18% market share in each of
8 See for details http://en.wikipedia.org/wiki/Market_share_of_personal_computer_vendors
9 See for more details http://en.wikipedia.org/wiki/Semiconductor_sales_leaders_by_year
0.00
20.00
40.00
60.00
80.00
100.00
120.00
ITA -1
ITA-2
ITA-3
ITA-4
ITA-5
ITA-6
ITA-7

32
them. The table further indicates that out of the 11 products considered the top two firms
accounts more than 30 per cent of the global share and in the remaining products the
share is over 29 per cent. Such examples could be multiplied.
Table 7: Global market share of Samsung and its nearest competitor in select products
Product Samsung world
market share (%)
Leading competitor Market
share (%)
Year
DRAM 40.4 SK Hynix 19.8 Q3 2010
NAND flash 40.4 Toshiba 33.1 Q3 2010
Large-size LCD panels
(revenue)
26.0 LG Display 25.9 Q3 2010
Active-Matrix OLEDs 97.0 LG Display 1.3 2010
Lithium-ion batteries 18.7 Sanyo 19.4 Q1010
LCD monitors 18.0 Dell 12.8 2009
Hard-disk drives 9.0 Western Digital 31.3 Q12010
Televisions (LCD, PDP, CRT, LED)
17.2 LG Electronics 14.8 Q32009
Mobile Phones 25.0 Nokia 23.0 Q12012
Digital cameras 11.8 Sony 17.4 2010
Application processors 12.0 Texas Instruments 17.0 Q3, 4
2011
Source: downloaded from http://en.wikipedia.org/wiki/Samsung_Electronics
The observed trend tends to suggest that being an Agreement initiated at the instance of
leading MNCs, their ultimate objective would have been to arrest the decline in their
market power to retain their profitability. Moreover, in contrast to the often made claim
that ITA has been instrumental in spreading IT production across developing countries,
especially Asia has hardly any empirical base. To the extent that our analysis has been
preliminary, instead of drawing definite conclusions we underline the need for more
systematic analysis to explore whether ITA has been helpful in fostering a more
competitive trading environment.
Trend in prices
Market power is bound to have its influence on price. Trends in the price of electronics
products, especially semiconductors and computing equipment are known to be governed
by the famous Moore’s law - an observation that the number of components in integrated
circuits had doubled every year from the invention of the integrated circuit in 1958 until

33
1965 and predicted that the trend would continue. With geometric progression in the
power of computing equipment their prices have been moving in the opposite direction.
Such trends have been attributed mainly to the technological dynamism resulting from
the high technological opportunity resulting from the scientific base of this industry along
with significant R&D investments by the large MNCs engaged in the sector. However,
along with higher technological base of IT products, increased competition resulting from
ITA is expected to have further accelerated the downward trend in prices on account of
heightened competition resulting from trade liberalisation.
Earlier studies (WTO 2012, for example) have argued that such a trend has indeed been
in operation since ITA. To quote from WTO (2012) “import price level of June 2011 for
computers, peripherals and semiconductors to be around 65 per cent below the respective
level of June 1996, while the average import prices for all commodities were 40 per cent
above the level of 1996”. The study further argued that “as a result of significant price
reductions and increased performance, consumers have benefited from an unprecedented
reduction in the price paid for computational power. The cost of a gigaFLOPS a unit of
computational power, fell to $ 1.80 in March 2011 from $ 30,000 in 1997 – 0.006 per
cent of the initial cost”.
In case of IT industry with numerous products having varying characteristics, such
anecdotal evidence could conceal more than what is revealed. Hence, for informed policy
making there is hardly any option other than to analyze the issue at hand empirically at as
disaggregated a level as possible. However, such an analysis is made difficult because of
the non availability of credible product wise data on prices.
Perhaps, the only option left with is to make use of the unit value derived from trade data,
keeping indeed in mind all its limitations. Strictly speaking unit value indices are not
price indices since their changes may be due to changes in price, composition of
commodities and quality of the product. However, to the extent that the compositional
change and change product characteristics were prevalent even before the introduction of
ITA, an examination of the trend in estimated indices could provide some broad

34
indications regarding the change in their prices. In what follows we shall try to analyse
this issue by using the unit value indices, of all the seven ITA products derived from the
trade data obtained from COMTRADE. Here again, our analysis shall compare the
trends observed in the post-ITA period with that of the pre-ITA period.
We have estimated the trend growth rate in the unit value index of all the ITA products
for the two time periods and tested the statistical significance of the observed growth rate
in two time periods (table 8). In general, as per HS 1992, the growth in the price of IT
goods has been at a very low level both during the pre and post ITA period. However, it
is evident from table 8 that during the pre ITA period growth in price, in accordance with
the Moore’s law, was negative for two products (ITA1 and ITA6) groups and negligible
in case of others with highest growth rate being in ITA 4 (6.9%). But when it comes to
the second period, the while negative growth rate continued in ITA1 (as observed by
WTO 2012) all the other product groups, except ITA3 and ITA4, recorded an increase in
the growth rate in prices. The emerging picture with respect to growth in price during
post ITA period as per HS 1996 is broadly in tune with HS 1992 except for the fact that
ITA3 recorded a negative growth rate.
Table 8: Estimated trend growth rates in the export price of ITA goods
HS Period ITA-1 ITA-2 ITA-3 ITA-4 ITA-5 ITA-6 ITA-7
HS1992 Pre-ITA -0.80 (-0.525)
0.80 (0.521)
3.5 (2.441)**
6.90 (2.640)**
2.40 (2.993)**
-0.40 (-0.476)
0.10 (0.102)
Post ITA -2.80 (-1.546)
6.20 (11.210)*
2.40 (6.581)*
4.50 (2.727)**
5.50 (9.268)*
2.36 (4.399)*
1.70 (5.180)*
HS1996 Post ITA 1.70 (2.579)** 4.10 (1.851)
-3.0 (-5.265)*
3.70 (5.707)*
5.40 (9.122)*
8.40 (3.024)**
1.0 (3.113)*
Note: ITA -1: Computers and calculating machines; ITA-2: Telecommunication equipment; ITA-3:
Semiconductors; ITA-4: Semiconductor manufacturing equipment; ITA-5: Instrument and apparatus
ITA-6: data storage media and software; ITA-7: Parts and accessories
*, ** - Growth rates are statistically significant at 1 percent and 5 percent levels respectively
Figures in parenthesis indicate corresponding t-values
Pre-ITA period: 1988 – 1996; Post-ITA period: 1997-2011
If we piece together the findings on price trend with market concentration, the following
hypothesis could be advanced. As the ITA enabled the leading producers to consolidate

35
and significantly increase their market power they could behave like “price makers”
instead of being “price takers”. The power to set the price backed by market power and
control over core technologies and the power to set the global standards during the post
ITA period to enhance profitability seems to have contributed towards an upward trend in
prices in place of the downward or constant trend observed during the pre ITA period.
This, needless to say, would have adversely affected the access to IT goods and the
diffusion of ICT in developing countries. Based on the literature on pricing behavior with
market power, one could also expect ‘Pricing to Market behavior” wherein price for
developing countries being significantly higher than in the developed market. This is an
issue that needs further exploration and reserved for future work.
5. Concluding observations
Information Technology Agreement of WTO, touted as one of the most successful trade
agreements ever undertaken and a stepping stone to multilateralism through sectoral
agree agreement route, aimed at enabling its member countries to harness the manifold
benefits of ICT through liberalizing the trade in IT products. Ironically, while countries
world over toady are wedded to ICT, majority of developing countries prefer to keep
away from ITA. Hence, WTO has been enticing countries to ITA, inter alia by
highlighting its varied benefits and a case has also been made to expand the coverage of
products under the Agreement. In this context, the present study analysed the outcomes
of ITA in terms of its declared objectives.
The points of departure of the present study from the previous ones are the following.
While the previous studies were concerned only with the post ITA period, keeping us in
dark with respect to the pre ITA period, this study compared the performance during the
post ITA period with the pre ITA period. Secondly while the previous studies made tall
claims about the positive outcomes of ITA without sufficient empirical base, the present
study attempted to explore the issues of concern with much needed empirical evidence.
The study has interesting preliminary empirical results which call for more detailed
enquiries so as to contribute to informed policy making.

36
To begin with, it is found that in contrast to the observation made by WTO (2012) and
other studies, post ITA period was marked by a sharp deceleration in the growth of trade
(both exports and imports) in IT products. The deceleration was confined not only to
total export and imports of IT products but also to almost all the seven product groups
therein. As a result, the share of IT products in global merchandise exports did not record
an increase after ITA. Instead, there has been a marked decline. This tend to suggest that
despite significant liberalization in the trade in ITA goods, trade in IT goods could not
withstand various exogenous shocks like the Asian financial crisis, dotcom crisis and the
global financial crisis that coincided with the post ITA period. Therefore the growth
augmenting effect of ITA as highlighted by WTO (2012) doesn’t withstand to empirical
verification.
While the present study confirms the finding that the share of Asia in global trade has
increased significantly after ITA, once we keep away “the China effect”, the emerging
picture is rather dismal. There is hardly any empirical evidence of either incumbent in
global production network (eg. Malaysia, Thailand, Indonesia) improving their position
or the entry of new countries from Asia into the electronics production network. Here the
only exception is Vietnam.
More importantly the study finds that the 4-country concentration ratio in the export of IT
goods, while declined (about 10%) during the pre ITA period, post ITA period was
marked by a significant increase in their share (about 15%). There is also evidence to
indicate increased market power of MNCs in important IT products like personal
computers, semiconductor devices and mobile phones that account for bulk of IT trade.
The preliminary results underline the need for more detailed and systematic analysis to
discern whether ITA has been helpful in fostering a more competitive trading
environment.
The preliminary evidence also suggests that the increased market power appears to have
enabled the MNCs to behave like price makers. During the pre ITA period, rate of
growth in the price of IT goods was either negligible or negative indicative of the

37
operation of the Moore’s law. Surprisingly, when it comes to the post ITA period, almost
all the product groups recorded positive and statistically significant growth in prices as
compared to the pre ITA period. Here again the study underscores the need for further
enquiries to explore whether ITA helped improving the affordability or it made the IT
products more costly with its obvious implications on ICT diffusion in the developing
countries. Only further studies will tell us whether the digital world of today would have
been more equitable had there been no ITA!
On the whole, ITA turns out to have not lived up to the expectations. Therefore, the
reasons for the hesitation of large number of developing countries to join it are not far to
seek. To the extent that the ITA could not keep up its promises, there is the need for
revisiting ITA before considering the issue of expanding its product coverage.
Theoretically, the ITA fiasco has to be seen against its abiding faith in the virtues of trade
liberalization and scant attention to innovation and capacity building. In a sense what we
have observed is what Arthur Lewis predicted in 1978. To repeat
“the engine of growth should be technological change with international trade serving as lubricating oil and not as fuel”. He continued “….international trade cannot substitute for technological change, so those who depend on it as their major hope are doomed to frustration” (Lewis 1978 p. 74).
In the context of frustration that resulted from ITA and given India’s capabilities in the
field of ICT and its commitment for the developing countries, it is an appropriate time to
work towards an e-South Framework Agreement10
. The scope for such an agreement is
too obvious because of IT capabilities in some of the Southern countries to address the
southern problems and the marked divergence in the IT interests of developing and
developed countries. The proposed e-South Framework Agreement shall aim at bridging
the digital divide through an integrated development of ICT sector within in the
framework of south-south cooperation. Towards achieving this objective, the Agreement,
in tune with the Information Technology Agreement of WTO should focus on liberalizing
the trade in ICT goods and services. At the same time, drawing from the e-ASEAN
10 For a detailed discussion on the context and rationale for e-South Framework Agreement see Joseph
(1996) Chapter 7.

38
Framework Agreement the e-South Framework Agreement should be instrumental in
capacity building inter alia by harnessing the innovation capabilities in the South. Given
the paramount importance of human capital in developing ICT production and promoting
ICT use, special focus may be given to developing IT manpower base wherein there is
the need for relaxing the restrictions on the mobility of skilled manpower across the
developing world. In general, the Agreement should facilitate an integrated development
of the ICT sector by promoting both production and use instead of the ongoing lop-sided
approach wherein developing countries are often considered as passive adopters of
technology. We may conclude by reiterating that South-south cooperation should not be
cconstrued as a substitute for the ongoing initiatives at promoting North-South
cooperation.
Acknowledgement
This study has been undertaken with the support of WTO Center at IIFT for the
Department of Electronics, Government of India. I have benefitted immensely from
discussion with Prof Abhijit Das, Dr Nagesh Kumar and Dr Ajaya Kumar. My colleagues
at CDS, Dr U S Mishra and Vinod Kumar patiently listened to my ideas and provided
helpful comments on an earlier draft. Mr Rajesh Many provided excellent research
assistance for analyzing the data. While I am thankful to all of them, the usual
disclaimers follow.
References
Anderson, Michael and Jacob, Mohs (2010), The Information Technology Agreement:
An Assessment of World Trade in Information Technology Products, Journal of
International Commerce and Economics, Web version January 2010, available at
http://www.usitc.gov/publications/332/journals/info_tech_agreement.pdf
Bhagwati, J. N. (1984) Why are Services Cheaper in Poor Countries? Economic Journal,
94: 279-285.
Bresnahan, T. and M. Trajtenberg (1995) General Purpose Technologies: Engines of
Growth, Journal of Econometrics, 65 (1): 83-108.
Cantwell, J. A. (1995) The Globalization of Technology: What Remains of the Product
Cycle Model? Cambridge Journal of Economics, 19(1): 155-174.

39
Carlos, A., P. Braga, J.A. Dally and B. Sareen (2003) The future of Information and
Communication Technology for Development, paper presented in the ICT Development
Forum, Petersberg, Germany.
David, P.A. (1990) The Dynamo and the Computer: An Historical Perspective on the
Modern Productivity Paradox, AEA Papers and Proceedings, 1990; 355-361
David, P. A. (1991) Computer and Dynamo: the Modern Productivity Paradox in a Not-
Too-Distant Mirror. In OECD, Technology and Productivity: The Challenge for
Economic Policy (Paris: OECD): 315-348.
Dreyer Iana and Brian Hindley (2008), Trade in Information Technology goods:
Adapting the ITA to 21st century technological change, ECIPE working paper No 6/2008,
Brussels.
Dunning, J. H. (1996) The Geographic sources of the competitiveness of firms: some
results of a new survey, Transnational Corporations, 5: 1-29.
Erik, Brynjolfsson and Adam Saunders (2010), Wired for Innovation: How Information
Technology is Reshaping the Economy, Cambridge, MA: MIT Press.
Ernst, D. (2002) Global Production Networks and the Changing Geography of Innovation
Systems: Implications for Developing Countries, Economics of Innovation and New
Technology, 11 (6): 497-523.
Ernst, D. and B. A. Lundvall (2000) Information Technology in the Learning Economy:
Challenges for Developing Countries, East-West Centre working paper No. 8, (Honolulu:
East-West center).
Ernst, D. and L. Kim (2002) Global Production Networks, Knowledge Diffusion and
Local Capability Formation, Research Policy, 31 (8-9): 1417-1429.
Ezell, Stephen J., (2012) Boosting Exports, Jobs, and Economic Growth by Expanding
the ITA, The Information Technology & Innovation Foundation, Washington DC
available at http://www.itif.org/events/boosting-exports-jobs-and-economic-growth-
expanding-information-technology-agreement
Heeks R., (1996) India’s software industry, state policy, liberalization and industrial
development. New Delhi: Sage Publications.
Hobday, M. (1994) Export-led Technology Development in the Four Dragons: The Case
of Electronics, Development and Change, 25 (2): 333–361.
Hobday, M. (1995) East Asian Latecomer Firms: Learning the Technology of
Electronics, World Development 23 (7): 1171–1193.

40
Indjikian, R. and D. S. Siegel (2005) Impact of Investment in IT on Economic
Performance: Implications for Developing Countries, World Development, 33 (5): 681-
700.
IMF (2001) World Economic Outlook: The Information Technology Revolution,
Washington DC, October.
Joseph, K. J. (1997) Industry under Economic Liberalization: The Case of Indian
Electronics Sage Publications, New Delhi, Thousand Oaks, London.
Joseph, K. J. (2002) Growth of ICT and ICT for Development: Realities of the Myths of
Indian Experience, Discussion paper No. 2002/78, Helsinki: UNU/ WIDER.
Joseph, K.J. (2004) Development of Enabling Policies for Trade and Investment in the IT
Sector of the Greater Mekong Sub Region, UNESCAP, Bangkok, at
http://www.unescap.org/tid/projects/gms.asp
Joseph, K. J., (2006) Information Technology, Innovation System and Trade Regime in
Developing Countries: India and the ASEAN, Palgrave Macmillan, New York.
Joseph K J (2007) Electronics Industry, in Kumar N. and K J Joseph (eds) International
Competitiveness & Knowledge-based industries, Oxford University Press New Delhi
Joseph K J (2012) India’s Software Industry in Transition: Lessons for other developing
countries and implications for South-South Cooperation, background paper for the
Information Economy Report 2012, UNCTAD, Geneva.
Joseph K. J. and P. Intarakumnerd, P. (2004) GPTs and Innovation Systems in
Developing Countries: A Comparative Analysis of ICT Experiences in India and
Thailand, Paper Presented at the Second GLOBELICS Conference, Beijing, October.
Joseph K J and G Parayil (2008) Can Trade Liberalization Bridge Digital Divide:
Assessing the Information Technology Agreement, Economic and Political Weekly, Vol.
XLIII No.1, January 5 p 46-53.
Kraemer, K. L. and J. Dedrick (2001) Information Technology and Economic
Development: Results and Policy Implications of Cross-Country Studies, in M. Pohjola
(ed.), Information Technology, Productivity and Economic Growth (Oxford University
Press).
Krueger, Ann O (1997) Trade and Economic Development: How we Learn’? American
Economic Review, 87 (1): 1-22
Kumar N. (2001) Indian software industry development: International and national
Perspective, Economic and Political Weekly, 36 (45): 4278-4290.

41
Kumar, N. and K. J. Joseph (2005) Export of Software and Business Process Outsourcing
from Developing Countries: Lessons from India, Asia Pacific Trade and Investment
Review 1(1): 91-108.
Lall, S. (2001) Competitiveness, Technology and Skills (Cheltenham: Edward Elgar).
Lewis, Arthur (1978) The Evolution of the International Economic Order, Princeton:
Princeton University Press.
Makino, S., C. M. Lau and R. S. Yeh (2002) Asset exploitation versus asset seeking:
implications for location choice of foreign direct investment from Newly Industrialized
Economies, Journal of International Business Studies, 33: 403-421.
Mann Catherine L and Xuepeng Liu (2007) The Information Technology Agreement: Sui
Generis or Model Stepping Stone? Paper prepared for the Prepared for WTO-HEI
Conference 10-12 September, Geneva. Available at
http://www.wto.org/english/tratop_e/region_e/con_sep07_e/mann_liu_e.pdf
Mephokee, C. (2003) Thai Labour Market in Transition Toward a Knowledge-Based
Economy, in M. Makishima and Suksiriserkul, Somchai, (ed.), 2003, Human Resource
Development Toward a Knowledge-Based Economy: The Case of Thailand, Institute of
developing economies (Chiba: Japan: Japan External Trade Organization).
Mytelka, L. K. and John F.E. Ohiorhenuan, (2000) Knowledge-based Industrial
Development and South-South Cooperation, Cooperation South, No.1 2000, pp 74-82.
Pearce, R. D. (1999) The Evolution of Technology in Multinational Enterprises: The
Role of Creative Subsidiaries, International Business Review, 8: 125-148.
Pohjola, M. (2001) Information Technology and Economic Growth: A Cross country
Analysis in M. Pohjola (ed.) Information Technology, Productivity and Economic
Growth, Oxford University Press, New York.
Rodrik, D. (1992) The Limits of Trade Policy Reform in Developing Countries, Journal
of Economic Perspectives, 6 (1) 87-105.
Rodrik, D. (2004) Rethinking Growth Policies in the Developing World, Lucad’ Agliano
Lecture in Development Economics, delivered on October 8, 2004, in Torino, Italy,
available at http://courses.umass.edu/econ804/rodrik2.pdf
Saggi, K. (2002) Trade Foreign Direct Investment and International Technology
Transfer: A Survey, The World Bank Research Observer, 17 (2):191-235.
Srinivasan, T. N. and J. N. Bhagwati (1999) Outward Orientation and Development: Are
Revisionists Right? Discussion Paper No. 806, Economic Growth Center, Yale
University, New Haven.

42
Stiglitz, J. E. (2002) Globalization and its Discontents (New York: Allen Lane).
UNCTAD (2012) Information Technology Report 2012: The Software Industry and
Developing Countries, United Nations, New York and Geneva.
Wong, P. K. (2001) The Contribution of Information Technology to the Rapid Economic
Growth of Singapore in M. Pohjola (ed.), Information Technology, Productivity and
Economic Growth (New York: Oxford University Press).
World Bank (2000) Korea and the Knowledge based Economy: Making a Transition
(World Bank: OECD).
World Bank (2002) Information Communication Technology: A World Bank Group
Strategy (Washington DC: The World Bank).
WTO (2012) 15 years of the Information Technology Agreement: Trade, Innovation and
Global Production Networks, available at
http://www.wto.org/english/res_e/publications_e/ita15years_2012_e.htm