Thursday, August 5, 2021 Volume 21, Issue 7 Students gift ...

Information Systems
Education Journal
Volume 19, No. 4
August 2021 ISSN: 1545-679X
In this issue: 4. The Impact of Industrial Placement on BIS Graduate Employment and
Further Educational Advancement
Pak-Lok Poon, Central Queensland University
Man Fai Lau, Swinburne University of Technology
Sau-Fun Tang, The Royal Victorian Eye and Ear Hospital
13. Promoting Positive Student Outcomes: The Use of Reflection and Planning
Activities with a Growth-Mindset Focus and SMART Goals
Laura F. Poe, Longwood University
Nita G. Brooks, Middle Tennessee State University
Melinda Korzaan, Middle Tennessee State University
Andrea R. Hulshult, Miami University Regionals
David M. Woods, Miami University Regionals
23. Effects of emergency online learning during COVID-19 pandemic on student
performance and connectedness
Kristi L. Boardman, Siena College
Stephanie A. Vargas, Siena College
Jami L. Cotler, Siena College
Dmitry Burshteyn, Siena College
37. Python Programming in an IS Curriculum: Perceived Relevance and
Outcomes
Jennifer Xu, Bentley University
Mark Frydenberg, Bentley University
55. Curriculum? Shmurriculum! The Relationship Between Major Curriculum
Characteristics and First-Year Earnings for Information Systems Graduates
Guido Lang, Quinnipiac University
Jason H. Sharp, Tarleton State University
61. Towards Improving Student Expectations in Introductory Programming
Course with Incrementally Scaffolded Approach
Deepak Dawar, Miami University
77. Class Participation and Student Performance: A Follow-up Study
Ernst Bekkering, Northeastern State University
Ted Ward, Northeastern State University

Information Systems Education Journal (ISEDJ) 19 (4) ISSN: 1545-679X August 2021
©2021 ISCAP (Information Systems and Computing Academic Professionals) Page 2
https://isedj.org/; https://iscap.info
The Information Systems Education Journal (ISEDJ) is a double-blind peer-reviewed
academic journal published by ISCAP (Information Systems and Computing Academic
Professionals). Publishing frequency is six times per year. The first year of publication was
2003.
ISEDJ is published online (https://isedj.org). Our sister publication, the Proceedings of
EDSIGCON (https://proc.iscap.info) features all papers, panels, workshops, and presentations
from the conference.
The journal acceptance review process involves a minimum of three double-blind peer
reviews, where both the reviewer is not aware of the identities of the authors and the authors
are not aware of the identities of the reviewers. The initial reviews happen before the
EDSIGCON conference. At that point papers are divided into award papers (top 15%), other
journal papers (top 25%), unsettled papers, and non-journal papers. The unsettled papers
are subjected to a second round of blind peer review to establish whether they will be accepted
to the journal or not. Those papers that are deemed of sufficient quality are accepted for
publication in the ISEDJ journal. Currently the target acceptance rate for the journal is under
40%.
Information Systems Education Journal is pleased to be listed in the Cabell's Directory of
Publishing Opportunities in Educational Technology and Library Science, in both the electronic
and printed editions. Questions should be addressed to the editor at [email protected] or the
publisher at [email protected]. Special thanks to members of ISCAP/EDSIG who perform
the editorial and review processes for ISEDJ.
2021 ISCAP Board of Directors
Eric Breimer Siena College
President
James Pomykalski
Susquehanna University Vice President
Jeffry Babb West Texas A&M Past President/
Curriculum Chair
Jeffrey Cummings Univ of NC Wilmington
Director
Melinda Korzaan Middle Tennessee State Univ
Director
Niki Kunene Eastern CT St Univ Director/Treasurer
Michelle Louch
Carlow University Director
Michael Smith
Georgia Institute of Technology Director/Secretary
Lee Freeman
Univ. of Michigan - Dearborn Director/JISE Editor
Tom Janicki
Univ of NC Wilmington Director/Meeting Facilitator
Anthony Serapiglia
St. Vincent College Director/2021 Conf Chair
Copyright © 2021 by Information Systems and Computing Academic Professionals (ISCAP). Permission to make digital or hard copies of all or part of this journal for personal or classroom use is granted without fee provided that the copies are not made or distributed for profit or commercial use. All copies must bear this notice and full citation. Permission from the Editor is required to post to servers, redistribute to lists, or utilize in a for-profit or commercial use. Permission requests should be sent to Paul Witman, Editor, [email protected].

Information Systems Education Journal (ISEDJ) 19 (4) ISSN: 1545-679X August 2021
©2021 ISCAP (Information Systems and Computing Academic Professionals) Page 3
https://isedj.org/; https://iscap.info
Information Systems
Education Journal
Editors
Jeffry Babb
Co-Editor West Texas A&M
University
Paul Witman Co-Editor
California Lutheran University
Thomas Janicki Publisher
U of North Carolina Wilmington
Ira Goldman
Teaching Cases Co-Editor
Siena College
Paul Witman Teaching Cases
Co-Editor California Lutheran University
Donald Colton Emeritus Editor Brigham
Young University Hawaii
Anthony Serapiglia Associate Editor
St. Vincent’s College
Jason H. Sharp Associate Editor Tarleton State
University
2021 ISEDJ Editorial Board
Wendy Ceccucci Quinnipiac University
Ulku Clark U of North Carolina Wilmington
Amy Connolly James Madison University
Jeffrey Cummings U of North Carolina Wilmington
Christopher Davis U of South Florida St Petersburg
Mark Frydenberg Bentley University
Nathan Garrett Woodbury University
Biswadip Ghosh Metropolitan St U of Denver
Ranida Harris Indiana University Southeast
Scott Hunsinger Appalachian State University
Melinda Korzaan Middle Tennessee St Univ
James Lawler Pace University
Li-Jen Lester Sam Houston State University
Michelle Louch Carlow College
Jim Marquardson Northern Michigan Univ
Mary McCarthy Central CT State Univ
Richard McCarthy Quinnipiac University
Muhammed Miah Tennessee State Univ
RJ Podeschi Millikin University
James Pomykalski Susquehanna University
Renee Pratt Univ of North Georgia
Dana Schwieger Southeast Missouri St Univ
Cindi Smatt Univ of North Georgia
Karthikeyan Umapathy University of North Florida
Thomas Wedel California St Univ Northridge
Peter Y. Wu Robert Morris University Jason Xiong Appalachian St University

Information Systems Education Journal (ISEDJ) 19 (4) ISSN: 1545-679X August 2021
©2021 ISCAP (Information Systems and Computing Academic Professionals) Page 4
https://isedj.org/; https://iscap.info
The Impact of Industrial Placement on
BIS Graduate Employment and Further Educational Advancement
Pak-Lok Poon [email protected]
School of Engineering and Technology Central Queensland University
Melbourne 3000, Australia
Man Fai Lau
[email protected] Department of Computer Science and Software Engineering
Swinburne University of Technology Hawthorn 3122, Australia
Sau-Fun Tang
[email protected] The Royal Victorian Eye and Ear Hospital
East Melbourne 3002, Australia
Abstract
This study followed two cohorts of BIS (business information systems) graduates (one group had undertaken an industrial placement and the other group had not) and explored the impact of such placement on graduate employment and further educational advancement. 18 BIS graduates with industrial placement and 36 BIS graduates without such placement were involved in the study. Both cohorts graduated near the end of 2017 from the same university in Australia. This study focused on two research questions: (a) What are the likelihood that BIS graduates with and without internship experience secure an IT job? (b) Does internship experience influence BIS graduates’ future educational
advancement along the IT career paths? On one hand, hypothesis testing found a positive association between BIS internship experience and the success of securing current/first IT-related jobs. On the other hand, no association was found between BIS internship experience and the time spent to find the first IT-related jobs (immediately or some time) after graduation, and between having BIS internship
experience and pursuing further studies. The results of this study have contributed to the existing body of mixture evidence on the potential benefits of industrial placement. Due to the quantitative nature of this study, the qualitative aspects (e.g., the quality and fit of internship experience with respect to the
type of jobs seek) of internships were not covered. Keywords: work-integrated learning, internship, industrial placement, graduate employment.
1. INTRODUCTION
A primary mission of universities is to create “values” for students, the industry, and the
society, by equipping students with practical knowledge and hands-on experience. This value
creation not only enhances the employability of the graduates, but also provides the industry with

Information Systems Education Journal (ISEDJ) 19 (4) ISSN: 1545-679X August 2021
©2021 ISCAP (Information Systems and Computing Academic Professionals) Page 5
https://isedj.org/; https://iscap.info
“work-ready” graduates to propel the society
forward. Universities attempt to achieve this mission via a range of approaches. One of these approaches is off-campus internship (also known
as industrial placement or industry-based learning), which offers students an opportunity to apply their learning into practice in a partner organization and at the same time to earn academic credit towards their degrees (Linn, 2015; Ram, 2008; Scott, Ray, & Warberg, 1990).
Various studies (Brooks & Youngson, 2016; Gamble, Patrick, & Peach, 2010; Jackson, 2015; Tran, 2016) showed that internship experience consistently contributes to higher employment rates among university graduates. Some
employers even consider that relevant work
experience is more important than the degree classification and institution attended (Bennett, Eagle, Mousley, & Ali-Chodhury, 2008). Despite many studies reporting a positive contribution of internship experience to graduate employment, the opinion does not completely
lean to one side. For example, Price and Grant-Smith (2016) cited a Canadian study reporting that graduates in arts, humanities, and social science who participated in an internship program in fact experienced less chance to secure a relevant full-time job. Price and Grant-Smith (2016) further argue that, although most
research studies generally support the assertion
that internship experience improves graduate employment, these studies are based on surveys of student’s or employer’s perception (or both) instead of more objective employment statistics.
Adding to the above controversial views about the contribution of internships to graduate employment (Problem 1), we observed that there is relatively little research to investigate the impact of internship experience on the future development of graduates via further educational studies (Problem 2). Our study addresses these
two problems.
2. STUDY OBJECTIVES AND RESEARCH QUESTIONS
The first objective of this study is to explore the impact of internship experience on BIS (business
information systems) graduate employment. In our study, we were only interested in those cases where graduates found jobs that were “relevant” to their study disciplines (i.e., IT-related). When determining whether a job is IT-related, we focus on the job position rather than the company type.
For example, a position of IT technical support
officer or systems/business analyst in a retail
company is considered “relevant”. On the other hand, a position such as marketing representative or accountant in an IT company is considered
“irrelevant”. To avoid verbosity, for the rest of this paper, “BIS graduates” are simply referred to as “graduates”. Also, the term “IT-related jobs” (or simply “IT jobs”) also covers jobs in information systems.
Research Question 1 (RQ1): What are the likelihood that graduates with and without internship experience secure an IT job?
To answer RQ1, the following five sub-questions have been formulated:
• RQ1.1: What are the current employment
status of graduates with and without internship experience?
• RQ1.2: What are the percentages of
graduates with and without internship experience who are employed in non-IT
areas? • RQ1.3: What are the percentages of
graduates with and without internship experience whose first jobs were IT-related?
• RQ1.4: How long have graduates with and
without internship experience spent to find
their first IT jobs after graduation?
Research Question 2 (RQ2): Does internship experience influence graduates’ future educational advancement along the IT career paths?
RQ1 and RQ2 address problems 1 and 2 mentioned above, respectively.
3. DATA COLLECTION AND RESEARCH
SAMPLE The study involved two cohorts of graduates completing a bachelor’s degree in BIS from an
Australian university (anonymously referred to as
“UNIV”), with all of them graduated in 2017. There were 29 graduates with internship experience and 64 graduates without internship experience. The 64 graduates without internship experience completed a three-year full-time (or its part-time equivalent) course in BIS. This
cohort of graduates is collectively referred to as the Group-NI. On the other hand, the 29 graduates with internship experience (in the year 2016) completed a four-year full-time (or its part-

Information Systems Education Journal (ISEDJ) 19 (4) ISSN: 1545-679X August 2021
©2021 ISCAP (Information Systems and Computing Academic Professionals) Page 6
https://isedj.org/; https://iscap.info
time equivalent) course in BIS. This cohort of
graduates is called the Group-IN. Both degrees have the same curriculum, except that the 4-year degree has a full-time industrial placement
(which lasts for about 10−12 months) in the third year of the curriculum. Table 1 compares the
curricula of these two degrees.
Year of 3-year BIS
degree
Equivalent year of 4-year BIS
degree
1st (on-campus study) 1st (on-campus study)
2nd (on-campus study) 2nd (on-campus study)
N/A 3rd (industrial placement)
3th (on-campus study) 4th (on-campus study)
Table 1: Comparison of Curriculum Between
3-year BIS and 4-year BIS degrees
We collected graduates’ data from their LinkedIn profiles. We also sent messages to these graduates to: (a) ask for their consents, and (b) confirm with them if there are any updates to their LinkedIn profile data. After excluding those
who were unwilling to participate, 18 graduates in Group-IN and 36 graduates in Group-NI participated in our study. Data collection was performed in May and June 2019.
4. DESCRIPTIVE STATISTICS Observations 1 and 2 are related to the current jobs (as of 30 June 2019) of the graduates.
Observation 1 (RQ1.1 − Current Status): We first investigated the numbers and percentages of graduates who are currently working. For Group-
IN, all the 18 graduates (100%) are currently working with the following breakdown: 17 (94.4%) of them are working in IT areas, and the remaining one (5.6%) is working in a non-IT area. On the other hand, among the 36 graduates in Group-NI: 22 (61.1%) are engaging in IT work;
8 (22.2%) are engaging in non-IT work; 5 (13.9%) are not working and are pursuing a full-time IT-related master’s degree (e.g., information systems, information technologies, and cyber security); and the remaining one (2.8%) are currently unemployed. Thus, in terms
of their employment in IT, the percentage was
much larger in Group-IN than in Group-NI ⎯ a
difference of 33.3% (= 94.4% − 61.1%).
Observation 2 (RQ1.2 − Current Non-IT Employment): Observation 1 states that one
graduate (5.6%) in Group-IN and 8 graduates (22.2%) in Group-NI are currently employed in non-IT areas (a difference of 16.6%). For these graduates, an investigation was performed to find out at what time (or how soon after graduation)
these graduates moved out of IT. The finding is
shown in Table 2. In this table, if, for example, graduates graduated in December 2017 and started their non-IT jobs in January 2018, they
are considered to commence the jobs “immediately” after graduation. As another example, if graduates graduated in December 2017 and started their non-IT jobs in February 2018, they are considered to commence their jobs “one month” after graduation. This calculation scheme was used in all the relevant
analyses in the study.
Group
Number (%) of graduates
A B C D
Group-
IN
1
(100.0%) − − −
Group-
NI
3
(37.5%)
3
(37.5%)
1
(12.5%)
1
(12.5%)
Column A: Graduates who have been working in non-IT
areas during study & have continued these jobs after
graduation
Column B: Graduates who started their non-IT jobs
immediately after graduation
Column C: Graduates who started their non-IT jobs 1
month after graduation
Column D: Graduates who started their non-IT jobs 9
months after graduation
TABLE 2: Graduates Currently Working in
Non-IT Areas
Refer to the graduate in Group-IN and the 8
graduates in Group-NI in Table 2. Although we are not certain about the reasons why they do not work in IT, it is speculated that they had intentionally opted to work in non-IT areas rather than being unable to find IT jobs. The speculation
is made because: (a) the percentages of graduates who had successfully entered the IT workforce were fairly high (94.4% for Group-IN and 61.1% for Group-NI), indicating that graduates (with and without internship experience) should not have great difficulty in
securing IT jobs; and (b) it has been about 1.5 years after graduation, so this period should be long enough for these graduates to find IT jobs if they prefer to. Reason (b) is supported by our Observation 4 (to be discussed later) that it took
only about 0.82 months and 1.92 months for graduates in Group IN and those in Group NI,
respectively, to find their first IT jobs after graduation. Observation 3 below focuses on the first jobs (excluding the internship jobs) of the graduates during or after their studies.

Information Systems Education Journal (ISEDJ) 19 (4) ISSN: 1545-679X August 2021
©2021 ISCAP (Information Systems and Computing Academic Professionals) Page 7
https://isedj.org/; https://iscap.info
Observation 3 (RQ1.3 − First Job): An
examination was conducted to analyze the percentages of graduates in both groups whose first jobs (excluding the internship jobs) during or after their studies were related to IT. In Group-IN, among the 18 graduates, 17 (94.4%) of them
had their first jobs related to IT. For the remaining graduate (5.6%), he had been first working in catering services (non-IT-related) during study and has continued this job after graduation. In Group-NI, 31 graduates are currently working or had ever worked before (but are currently
unemployed). Among these 31 graduates without internship experience: • 21 (67.7%) had their first jobs in IT areas
with the following breakdown: during study
= 8 (25.8%); after graduation = 13 (41.9%); and
• 10 (32.3%) had their first jobs in non-IT
areas with the following breakdown: during study = 4 (12.9%); after graduation = 6 (19.4%).
The above statistics show that almost all
graduates (94.4%) in Group-IN whose first jobs were IT-related. In Group-NI, the percentages (both during and after study) of graduates whose first jobs were IT-related (67.7%) were much larger than those whose first jobs were non-IT-related (32.3%).
Observation 4 (RQ1.4 − Duration of Job Hunting): An analysis was conducted to compare the duration of job hunting between graduates with internship experience (Group-IN) and those without (Group-NI). This analysis focused only on those graduates who found their first IT jobs after graduation. In Group-IN, there were 11 such graduates. On average, they spent 0.82 months
(range = 0−5 months) to start their first IT jobs after graduation. In Group-NI, there were 13 such
graduates. On average, they spent 1.92 months
(range = 0−8 months) to start their first IT jobs after graduation. Thus, on average, graduates in Group-NI spent more than double the time in finding their first IT jobs after graduation than
those in Group-IN (although the absolute
difference was not large ⎯ only 1.10 (= 1.92 − 0.82) months). Note that the duration of job hunting depends on many factors such as the economic situation of a society. Studying the
impacts of various factors on the duration of job hunting is obviously outside the scope of this paper.
Observation 5 (RQ2 − Post-Internship): For the 18 graduates in Group-IN, 6 (33.3%) of them
have continued their IT work at the placement
companies after their internships had been completed. Their placement companies offered these graduates full-time employment contracts
immediately after their internships. As such, these graduates had to finish their final year (i.e., Year 4) of study in part-time mode (e.g., by attending evening lectures after work). It was also noted that these graduates had managed to finish their final year of study in one year and, hence, were able to graduate in 2017 (together
with other students in the same cohort in Group-IN). This observation clearly shows a great merit of internship opportunities and explains one possible way on how internship contributes to higher graduate employment rates.
5. HYPOTHESIS ANALYSIS Hypothesis Development In all the following hypotheses, the subscripts “0” and “1” indicate a null hypothesis and its corresponding alternative hypothesis, respectively.
Observation 1 states that the percentage of current IT employment of Group-IN was 33.3% larger than that of Group-NI. Several studies (Brooks & Youngson, 2016; Gamble, Patrick, & Peach, 2010; Jackson, 2015; Tran, 2016) also argued that internship experience contributes to
higher graduate employment rates. Accordingly,
the following null and alternative hypotheses were formulated:
Null Hypothesis 1 (H10 − Current IT Employment): The chance of BIS graduates with internship experience who are currently working in IT areas is the same as those without
internship experience.
Alternative Hypothesis 1 (H11 − Current IT Employment): The chance of BIS graduates with internship experience who are currently working in IT areas is higher than those without internship experience.
Observation 2 states that 5.6% of graduates in Group-IN and 22.2% of graduates in Group-NI are currently employed in non-IT areas (a difference of 16.6%). This observation led to the following hypotheses:
Null Hypothesis 2 (H20 − Current Non-BIS Employment): The chance of BIS graduates without internship experience who are currently
working in non-IT areas is the same as those with internship experience.

Information Systems Education Journal (ISEDJ) 19 (4) ISSN: 1545-679X August 2021
©2021 ISCAP (Information Systems and Computing Academic Professionals) Page 8
https://isedj.org/; https://iscap.info
Alternative Hypothesis 2 (H21 − Current Non-BIS Employment): The chance of BIS graduates without internship experience who are currently working in non-IT areas is higher than those with internship experience.
Observation 3 found that 94.4% of BIS graduates with internship experience had their first jobs related to IT, whereas such percentage dropped to 67.7% for their counterparts without internship experience. This led to the following hypotheses:
Null Hypothesis 3 (H30 − First IT Job): The chance of BIS graduates with internship experience whose first jobs (excluding the internship jobs) are IT-related is the same as
those without internship experience.
Alternative Hypothesis 3 (H31 − First BIS Job): The chance of BIS graduates with internship experience whose first jobs (excluding the internship jobs) are IT-related is
higher than those without internship experience.
Observation 4 shows that BIS graduates without internship experience spent more than double the time in finding their first IT jobs after graduation
(mean = 1.92 months) than those with internship experience (mean = 0.82 months). The following two alternative hypotheses (H41 and H51) and their corresponding null hypotheses were
formulated in accordance with this observation:
Null Hypothesis 4 (H40 − Duration of IT-Related Job Hunting): The time spent by BIS graduates without internship experience to find
their first IT jobs (after graduation) is the same as those with internship experience.
Alternative Hypothesis 4 (H41 − Duration of IT-Related Job Hunting): The time spent by BIS graduates without internship experience to find their first IT jobs (after graduation) is longer than those with internship experience.
Null Hypothesis 5 (H50 − IT-Related Job
Immediately after Graduation): The chance of BIS graduates with internship experience successfully secured an IT job immediately after graduation is the same as those without internship experience.
Alternative Hypothesis 5 (H51 − IT-Related Job Immediately after Graduation): The
chance of BIS graduates with internship experience successfully secured an IT job
immediately after graduation is higher than
those without internship experience.
Observation 1 found that none from Group-IN has
pursued full-time further studies. On the other hand, 5 out of the 36 (13.9%) BIS graduates in Group-NI are currently studying for a full-time master’s degree in an IT-related field. One of the authors of this paper had previously taught at UNIV and had supervised all the graduates in Group-IN. When supervising these interns, some
of them expressed that they would not advance to further studies (at least in the next few years after graduation) because they already spent one extra year in industrial placement when compared with their counterparts studying for a three-year BIS bachelor’s degree. This feedback
from interns has resulted in the following hypotheses:
Null Hypothesis 6 (H60 − Further Full-Time Study): The chance of BIS graduates without internship experience to pursue further full-time study within 1.5 years after graduation is the same as those with internship experience.
Alternative Hypothesis 6 (H61 − Further Full-Time Study): The chance of BIS graduates without internship experience to pursue further full-time study within 1.5 years after graduation is higher than those with internship experience.
When defining the above hypotheses, directional
hypotheses were used, because we aimed at predicting the “nature” of the effect of the independent variable (e.g., internship) on the dependent variable (e.g., graduate employment). Hypothesis Testing and Results Considering the types of independent and
dependent variables: (a) the nonparametric Chi-Square test seemed to be applicable for testing the null hypotheses H10, H20, H30, H50, and H60, and (b) the nonparametric Mann-Whitney U test was apparently applicable for testing the null hypothesis H40. In the SPSS statistical package,
both the Chi-Square test and the “original” Mann-
Whitney U test adopt the asymptotic method for generating p-values. The asymptotic method generates p-values based on the assumption that the sample is large and conforms to a particular distribution (e.g., normally distributed), which is not the case for this study.
To mitigate this problem: (a) Fisher’s Exact test was used instead of the Chi-Square test for testing H10, H20, H30, H50, and H60, and (b) the

Information Systems Education Journal (ISEDJ) 19 (4) ISSN: 1545-679X August 2021
©2021 ISCAP (Information Systems and Computing Academic Professionals) Page 9
https://isedj.org/; https://iscap.info
“original” Mann-Whitney U test with the
asymptotic method was replaced by the Mann-Whitney U test with the exact method for testing H40. Note that, when comparing with the
asymptotic method, Fisher’s Exact test and the exact method adopted by the Mann-Whitney U test always produces a reliable result, regardless of the size, distribution, sparseness, or balance of the data (Mehta & Patel, 2011). The applicability of the Mann-Whitney U test for
testing H40 was further analyzed. An assumption of applying this statistical test is that the distribution of scores (time spent for finding the first IT job) for both groups of the independent variable (Group-IN and Group-NI) have similar shapes. A histogram for the distribution of time
spent for each group was generated; both histograms showed similar distribution patterns. This finding thus confirmed the applicability of the Mann-Whitney U test to H40.
Null hypothesis
Statistical test & method used
One-
tailed p-value
Reject the null
hypothesis in
favor of its
alternative hypothesis?
Contribution of internships to employment (related to Problem 1
and RQ1 (and its research sub-questions))
H10 Fisher’s Exact test 0.009 Yes
H20 Fisher’s Exact test 0.120 No
H30 Fisher’s Exact test 0.030 Yes
H40
Mann-Whitney U
test with the exact
method
0.145 No
H50 Fisher’s Exact test 0.329 No
Impact of internship experience on further educational
advancement (related to Problem 2 and RQ2)
H60 Fisher’s Exact test 0.119 No
TABLE 3: Hypothesis Testing Results
This study adopted a significance level of 0.05. Table 3 summarizes the statistical testing results of the null hypotheses. Overall, statistical evidence showed that, when compared with BIS
graduates without internship experience, the current (H11) and first jobs (H31) of BIS graduates with internship experience were more likely to be IT-related. Evidence also showed that there was no significant difference between the BIS graduates with and without internship
experience in terms of: (a) currently working in
non-IT areas (H20), (b) time spent to find the first IT jobs after graduation (H30), (c) securing an IT job immediately after graduation (H40), and (d) pursing further full-time study shortly after graduation (H50).
6. DISCUSSION
Contribution of Internships to Employment Hypothesis testing for H10 and H30 showed a
positive association between BIS internship experience and the likeliness of securing current/first IT jobs (see Table 3). The education blog of the Good Universities Guide (2019) gives a plausible reason for this positive association. Internships offer an effective way for students to branch out from their courses into the relevant
industry and expand their lists of contacts, from university academics to partitioners who are currently working in the industry. It has been said that “it’s not about what you know; it’s about who you know” (Good Universities Guide, 2019). After students have finished their internships, they
often have a higher chance to obtain great references from their main industry mentors and a range of potential referees, thereby improving their chances of securing jobs related to their study disciplines after graduation. Furthermore, some “lucky” interns with excellent performance within their work placements may even be asked
by their employers to stay on in a more permanent role before or after graduation. Indeed, in this study, among the 18 BIS graduates in Group-IN: (a) Immediately after completing their industrial
placements (at the end of Year 3), 6
(33.3%) were offered permanent employment contracts. Accordingly, these 6
graduates switched their final-year study to the part-time mode.
(b) Either immediately after or some time after
graduation, 3 (16.7%) re-joined the companies where they completed their internships.
Note that, for the 6 and 3 graduates in (a) and (b), respectively, their permanent jobs (after industrial placement or graduation) at the
companies where they completed their internships are also IT-related. One may argue that the association between BIS
internship experience and the likeliness of securing current/first IT jobs may be influenced by the graduates’ GPAs. We have further
investigated this issue. When collecting data from graduates, some of them hesitated to disclose their GPAs. As a result, there were only 5 graduates in Group-IN and 9 in Group-NI disclosed their GPAs. Table 4 shows the GPAs of these graduates and their responses related to
hypotheses H10 and H30 (each row of Table 4 corresponds to one such graduate).

Information Systems Education Journal (ISEDJ) 19 (4) ISSN: 1545-679X August 2021
©2021 ISCAP (Information Systems and Computing Academic Professionals) Page 10
https://isedj.org/; https://iscap.info
Group Currently working in an IT area? (H10)†
First job is IT-
related? (H30)
Group-IN
3.8 Y Y
3.6 Y Y
3.5 Y Y
3.3 Y Y
2.6 Y Y
Group-NI
3.9 Y Y
3.7 Y Y
3.6 N N
3.5 Currently studying for an IT Masters’ degree
3.4 Y N
3.3 Y Y
3.3 N N
3.3 Currently studying for an IT Masters’ degree
3.0 Y Y
(†) As of 30 June 2019
TABLE 4: Impact of Graduates’ GPAs on
Hypotheses H10 and H30
Among the 5 graduates in Group-IN who have
disclosed their GPAs, all of them are currently working in IT areas and their first jobs are/were IT-related. Among the 9 graduates in Group-NI who have disclosed their GPAs, 2 graduates are studying for IT Masters’ degrees. For the remaining 7 graduates in Group-NI, two of them
are currently working in non-IT areas and three of them whose first jobs are/were non-IT related.
The pattern as shown in Table 4 indicates that GPAs do not have an obvious influence on the test results for H10 and H30. We speculate that GPAs may have an influence on the reputation of
companies where the graduates secured their jobs. However, this investigation is beyond the scope of our current study. This study adds to the controversial debate on the impact of internship experience on graduate employment. Hypothesis testing of H40 and H50
have not revealed a positive association between internship experience and the time spent to find the first IT jobs (immediately or some time) after graduation. Similar to H10 and H30, we have also
considered the potential impact of graduates’ GPAs on the hypothesis testing results of H20,
H40, H50, and H60. We found no obvious impact of GPAs on these four hypotheses. For example, Table 5 shows how long graduates in Group-IN have spent to secure their first IT jobs. The table indicates that graduates’ GPAs did not have an obvious impact on the duration of IT-related job hunting.
Group-IN†
Number of months to secure
the first IT jobs
3.8 0
3.5 5
3.3 2
2.6 0
(†) Excluding the graduate who continued to work
in her placement company immediately after the
internship period
TABLE 5: Impact of Graduates’ GPAs on
Hypothesis H40 (Group-IN)
Observation 4 found that, on average, BIS graduates with and without internship experience spent 0.82 months and 1.92 months,
respectively, to start their first IT jobs after graduation. The difference in time spent between
the two cohorts was very small ⎯ only 1.1 (=
1.92 − 0.82) months. Therefore, if only considering the short-term employment aspect (and ignoring other aspects such as the quality of the job position secured and future career advancement), it may not be worthwhile to spend
about an extra year on industrial placement to achieve only a very marginal reduction in the time spent on finding an IT job. Furthermore, one can argue that, instead of spending four years to obtain a bachelor’s degree (with internship), students can pursue a three-year bachelor’s
degree (without internship) and a one-year postgraduate diploma using the same amount of
time. The issue here is, in job hunting, whether having a postgraduate diploma (plus a three-year bachelor’s degree) but without industrial placement is more competitive than having a bachelor’s degree with internship experience.
Certainly, this issue is subject to debate and is potentially a research area that warrants further investigation.
Implication: To obtain the benefits of internships but without requiring students to spend too much time on gaining internship experience, higher education administrators may consider offering
shorter-term internships (e.g., 3−6 months) to students. It is argued that shorter-term internships will likely be more focused and
intense, thereby reducing boredom due to too much free time (Yoon, 2019). Impact of Internship Experience on Further Educational Advancement
Testing H60 revealed that there was no positive association between having internship experience and pursuing further studies. Observation 4, together with the testing results for hypotheses H40 and H50, may provide an explanation. As

Information Systems Education Journal (ISEDJ) 19 (4) ISSN: 1545-679X August 2021
©2021 ISCAP (Information Systems and Computing Academic Professionals) Page 11
https://isedj.org/; https://iscap.info
discussed in the preceding paragraph, on
average, BIS graduates with and without internship experience only spent 0.82 months and 1.92 months, respectively, to secure their
first IT jobs after graduation (Observation 4). Thus, these graduates might not have a strong need for pursuing further studies (e.g., a postgraduate diploma or a master’s degree) with a view to finding an IT job, if they did not emphasize much on the quality of that job and future career advancement at the time of
graduation. This study was based in Australia. Knott (2015) reported that the number of university graduates with large debts in Australia has been growing but fewer graduates have earned enough to pay back
their loans. In addition, the Australian Government has implemented policy change to force university graduates to pay their study loans sooner (Karp, 2017; Workman, 2017). Worse still, postgraduate studies in Australia have been increasingly expensive over the years. All these factors will diminish the desire of those
students with a bachelor’s degree to pursue further studies. Implication: Higher education administrators may consider incorporating a credit-bearing, shorter-term internship component in their postgraduate study programs. This will make postgraduate
studies more appealing to those graduates who are considering advancing their academic
qualifications.
7. LIMITATIONS OF STUDY
Small Sample of Graduates This study only involved 18 (in Group-IN) and 36 (in Group-NI) BIS graduates. It would be desirable if more graduates were involved in the study. To alleviate this problem, the study used Fisher’s Exact test and the Mann-Whitney U test with the exact method for statistical analysis.
These selected tests and methods always produce a reliable result even when the sample size is small, and they can be applied to any distribution, sparseness, and balance of the data (Mehta &
Patel, 2011). Period of Data Collection
Ideally, all the data should be collected within a very short period for the purpose of comparison and analysis. However, due to the tediousness of collecting graduates’ data and their consents, data collection spanned about a month (between
May−June 2019) to complete. In principle, though not really very likely so, some changes could have
occurred in the graduates’ employment and
educational status during data collection. Quantitative Nature of Study This study was primarily quantitative, therefore it
did not cover the qualitative aspect of BIS internship experience. One can argue that some graduates are inclined to choose jobs that fit their internship experiences. Investigating this issue, however, is beyond the scope of this study. Nevertheless, it would be worthwhile to investigate: (a) the quality and fit of BIS
internship experience, and (b) how these two aspects affect the BIS graduates’ job choices or decision to pursue graduate study directly after graduation.
8. SUMMARY AND CONCLUSION
This study investigated the impact of industrial placement on two aspects, namely, BIS graduate employment and further educational advancement. For the graduate employment aspect, the results of this study have contributed to the existing body of mixed evidence on this
aspect. On one hand, the study found a positive association between BIS internship experience and the likeliness of securing current/first IT jobs. On the other hand, the study found no association between BIS internship experience and the time spent to find the first IT jobs (immediately or some time) after graduation, thereby adding to
the controversial debate on the impact of
internship experience on graduate employability. For the further educational advancement aspect, the study found no association between having internship experience and pursuing further studies. This study did not explore the impact of
BIS industrial placement on the quality of the IT jobs secured and future promotion prospect. Therefore, it would be worthwhile for future studies to explore these areas of research.
9. REFERENCES
Bennett, R., Eagle, L., Mousley, W., & Ali-Chodhury, R. (2008). Reassessing the value of work-experience placements in the context of
widening participation in higher education. Journal of Vocational Education and Training, 60(2), 105–122.
Brooks, R., & Youngson, P.L. (2016). Undergraduate work placements: An analysis of the effects on career progression. Studies in
Higher Education, 41(9), 1563−1578. Gamble, N., Patrick, C., & Peach, D. (2010).
Internationalising work-integrated learning:

Information Systems Education Journal (ISEDJ) 19 (4) ISSN: 1545-679X August 2021
©2021 ISCAP (Information Systems and Computing Academic Professionals) Page 12
https://isedj.org/; https://iscap.info
Creating global citizens to meet the economic
crisis and the skills shortage. Higher Education
Research and Development, 29(5), 535−546. Good Universities Guide (2019). Five Benefits of
Completing an Internship. Retrieved
November 19, 2020 from https://www.good universitiesguide.com.au/education-blogs/ after-graduation/five-benefits-of-completing-an-internship
Jackson, D. (2015). Employability skill
development in work-integrated learning: Barriers and best practice. Studies in Higher
Education, 40(2), 350−367. Karp, P. (2017, Dec 18). Universities Australia
Attacks Coalition’s $2.2bn Funding Cut Revealed in Myefo. Retrieved November 19, 2020 from https://www.theguardian.com/ australia-news/2017/dec/18/coalitions-22bn-
cut-from-universities Knott, M. (2015, May 1). ATO Statistics Show
Number of University Graduates with Large HEC Debts Growing. Retrieved November 19, 2020 from https://www.smh.com.au/politics/
federal/ato-statistics-show-number-of-university-graduates-with-large-hec-debts-growing-20150501-1mxsrb.html
Linn, P. (2015). A lifespan perspective on
cooperative education learning: A grounded
theory. Asia-Pacific Journal of Cooperative
Education, 16(4), 301−326.
Mehta, C.R., & Patel, N.R. (2011). IBM SPSS Exact Tests. Retrieved November 19, 2020
from https://www.csun.edu/sites/default/files
/exact-tests19.pdf Price, R., & Grant-Smith, D. (2016, Jun 17). What
Evidence is There That Internships Secure Employment? Retrieved November 19, 2020 from http://theconversation.com/what-evidence-is-there-that-internships-secure-employment-60716
Ram, S. (2008). Industry-based learning and
variable standards in workplace assessments. Asia-Pacific Journal of Cooperative Education,
9(2), 129−139. Scott, S.V., Ray, N.M., & Warberg, W. (1990).
The design and evaluation of off-campus
internship and cooperative education programs, Journal of Marketing for Higher
Education, 3(1), 121−140.
Tran, T.T. (2016). Enhancing graduate employability and the need for university-enterprise collaboration. Journal of Teaching and Learning for Graduate Employability, 7(1),
58−71. Workman, A. (2017, May 1). Current and New
Students Will be Hit by the Increase to Fees at
Australian Universities. Retrieved November 19, 2020 from https://www. buzzfeed.com/aliceworkman/its-official-university-fees-are-going-up
Yoon, R. (2019). Short and Long-Term
Internships: The Advantages. Retrieved
November 19, 2020 from https://immerqi. com/blog/short-and-long-term-internships-advantages/

Information Systems Education Journal (ISEDJ) 19 (4) ISSN: 1545-679X August 2021
©2021 ISCAP (Information Systems and Computing Academic Professionals) Page 13
https://isedj.org/; https://iscap.info
Promoting Positive Student Outcomes: The Use of
Reflection and Planning Activities with a Growth-Mindset Focus and SMART Goals
Laura F. Poe [email protected]
InfoSystems & Cyber Security Longwood University
Farmville, VA 23909, USA
Nita G. Brooks
Melinda Korzaan [email protected]
Information Systems and Analytics
Middle Tennessee State University Murfreesboro, TN 37132, USA
Andrea R. Hulshult
David M. Woods [email protected]
Computer & Information Technology Miami University Regionals
Hamilton, OH 45011, USA
Abstract
The growth-mindset was examined to determine student perception of success by incorporating goal-setting activities into the course curriculum. Faculty at three universities conducted a mixed methods study to examine the extent to which reflection and planning activities designed to engage a growth-mindset focus through setting SMART (Specific, Measurable, Achievable, Relevant, and Timebound) goals resulted in perceived positive outcomes for students. Students engaged in these activities throughout the semester completed a voluntary survey at the end of each course. The survey focused
on students’ perceptions regarding the activities relative to their overall course progress. Students’ favorable results revealed that students favorably perceived that the growth mindset planning and

Information Systems Education Journal (ISEDJ) 19 (4) ISSN: 1545-679X August 2021
©2021 ISCAP (Information Systems and Computing Academic Professionals) Page 14
https://isedj.org/; https://iscap.info
reflection assignments increased their learning. Details of the study along with conclusions and
directions for future research are provided. Keywords: reflection, planning, student learning, growth mindset, SMART goals, Agile
1. INTRODUCTION
A primary goal at the heart of educational efforts is to prepare students for ongoing success in life. In addition to developing subject matter knowledge, research has shown that developing
lifelong learning habits are equally important. One example of this is Dweck’s (2016) work on growth and fixed mindsets. This study assesses the addition of class activities designed to promote and support a growth mindset. These activities require students to use reflection and
planning techniques to promote success in the learning environment. Success, if achieved, is purported to be related to the existence of a growth vs. fixed mindset. Specifically, this research aims to answer the question - do reflection and planning activities, designed to engage a growth-mindset focus through setting
SMART (Specific, Measurable, Achievable, Relevant, and Timebound) goals, result in perceived positive outcomes for students? The initial focus of these efforts was to develop and implement the activities and determine if students and instructors saw value in the effort
spent on the activities. Reflection and planning activities were implemented in select
undergraduate and graduate-level courses at three universities. Voluntary end-of-semester surveys were used to measure student perceptions of the activities. Effectiveness of the
reflection and planning activities was evaluated through student survey responses indicating their perceived value, effort, and enjoyment of completing these activities along with their perceptions of the efficacy of setting goals and making specific plans to accomplish their goals. Instructor perceptions on the value of the
activities and the effort required to implement the activities were evaluated through self-reflection and peer discussions.
2. LITERATURE REVIEW A growth-mindset represents a focus on
associating performance with effort and process rather than through judgments on ability in a classroom setting (Woods, 2019; Dweck, 2016). Research has shown that educating students about mindset and providing growth-mindset motivated feedback has a positive impact on both
student mindset and performance (Cutts et al., 2010). In this study, the reflection and planning
activities used were designed to support a growth mindset by asking students to reflect on their performance and then set specific SMART goals toward which to work for the purpose of improving performance in areas where they would like to make improvements (Woods, 2019).
The growth mindset shows an adaptability based upon continuous improvement when individuals focus on a predetermined set of goals. According to Moser (2011), individuals with a growth-mindset dedicate more resources to make
corrective adjustments based upon feedback and show keen mindfulness to errors. Additional studies provide evidence of increased performance when economic or achievement-based incentives are provided. The competitive drive to excel, referred to as the achievement motivation, requires individuals to have a belief
that their abilities can be changed or improved based upon their efforts (Manchi, 2017). The focus on mistakes is replaced by a desire to master a subject, demonstrating an outlook of confidence and optimism for success. Additionally, in language learners, motivation
plays a significant role in success and achievement. Researchers viewed the mastery of
second language learning as a continuous process that demands students play an active role in learning (Crooks & Schmidt, 1991). Critical to success in language learning, an individual's self-
definition has an impact on their motivational power and views of themselves in the future (Vijeh, 2014). The self-definition discussed by Vijeh (2014) is comparable to the drive to excel discussed by Manchi (2017) and can be applied to any subject matter of study. Likewise, in the business industry, the Agile project management
methodology includes a focus on failing safe and continuous learning in an effort to change the mindset of workers and reward small successes and innovation (Beck, 2001).
Agile has existed in the software space since 2001, but it continues to emerge into additional
industry sectors such as finance, professional services, education, healthcare, energy, telecommunications, government, and retail (VersionOne, 2019). Agile is emerging as the new leading organization model (Ahgina, De Smet, Lackey, Lurie, & Muraka, 2018). Organizations
are shifting to an Agile philosophy as a response to the rapid changes in "competition, demand,
Information Systems Education Journal (ISEDJ) 19 (4) ISSN: 1545-679X August 2021
©2021 ISCAP (Information Systems and Computing Academic Professionals) Page 15
https://isedj.org/; https://iscap.info
technology, and regulations" (McKinsey, 2017, p.1). For the purpose of this study, the researchers follow the ICAgile definition of Agile. According to ICAgile, "agile is not a process,
methodology, or framework; it is a mindset that welcomes uncertainty, embraces challenges, empowers individuals, and views failure as a learning opportunity. Adopting an agile mindset unleashes the brilliance of people and teams, which enables rapid discovery and faster innovation" (ICAgile, Mission, n.d.).
The Agile mindset allows teams to implement a set of practices that helps them to prioritize work, plan and execute the work in small increments, and organize as a self-managed team. This
approach helps teams to complete the most
important work first so that progress can be seen sooner rather than later. The Agile way of working encourages teams to work in iterative work cycles that have a steady cadence of feedback and reflection practices. Retrospectives are one reflective practice where teams discuss what is going well, what is not going well, and what needs
to be changed. Agile retrospectives could be perceived as continuous improvement, which is reflective of a growth mindset. Agile teams continuously reflect on their work, adapt, and make improvements. This tool allows for teams to adapt to better meet project outcomes or customer expectations. Agile teams have higher
quality outcomes and better meet their customers' needs compared to traditional project management models (Krehbiel et al., 2017). The same success of industry Agile teams has also been reported in postsecondary education group work (Woods & Hulshult, 2018; Hulshult &
Krehbiel, 2019).
3. PROCESS For this research project, class assignments designed to promote a growth mindset were added to courses at a regional campus of a large
public university in the Midwest, a large public university in the southeastern US, and a private university in the mid-Atlantic region. The impact
of these assignments was evaluated using an end-of-semester survey. Table 1 contains details of the courses and the number of students involved.
School 1 is a regional campus of a large public university in the Midwest, school 2 is a large public university in the southeastern US, and school 3 is a private university in the mid-Atlantic region.
School Course Semester Enrollment
1 Intro. To IT Fall 2019 15
1 Java Prog. Fall 2019 18
1 Intro. To IT Spring 2020
18
1 Java Prog. Spring 2020
15
1 Agile: Business Value Analysis
Spring 2020
14
1 Capstone – Design
Spring 2020
9
2 C# Prog. Spring 2020
19
2 Security Analytics (graduate)
Spring 2020
28
3 IT Security Spring
2020
9
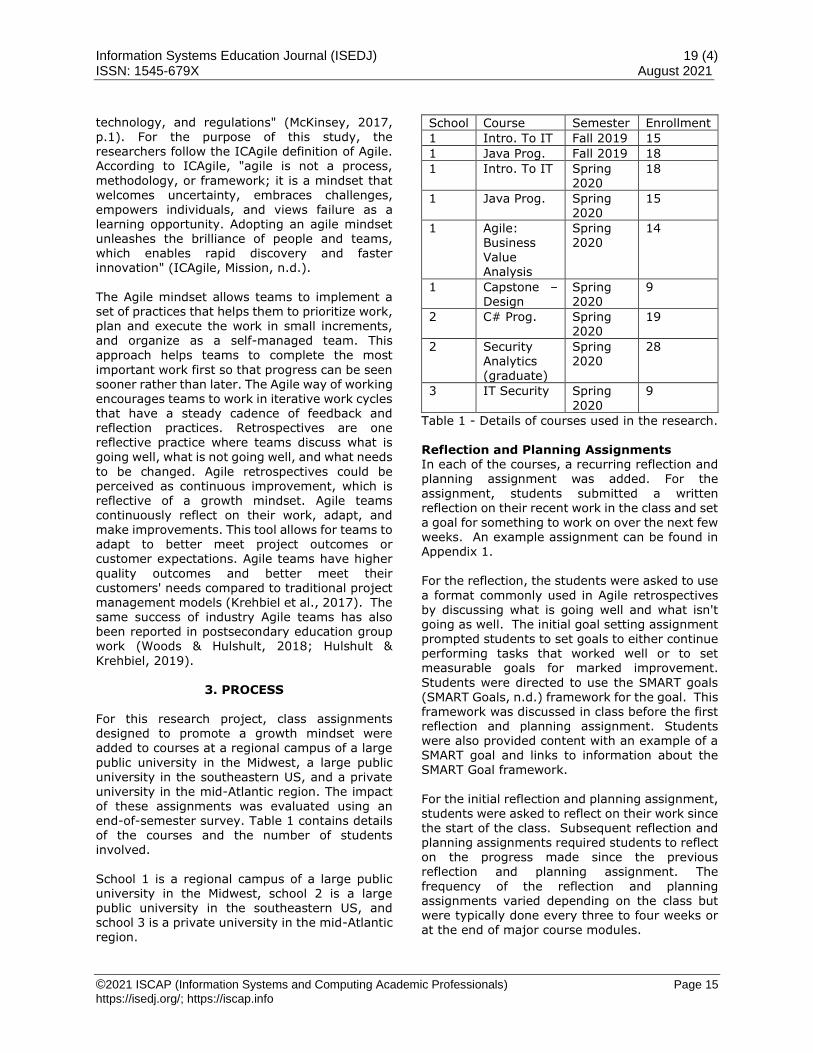
Table 1 - Details of courses used in the research. Reflection and Planning Assignments In each of the courses, a recurring reflection and planning assignment was added. For the
assignment, students submitted a written reflection on their recent work in the class and set a goal for something to work on over the next few weeks. An example assignment can be found in Appendix 1.
For the reflection, the students were asked to use
a format commonly used in Agile retrospectives by discussing what is going well and what isn't going as well. The initial goal setting assignment prompted students to set goals to either continue performing tasks that worked well or to set measurable goals for marked improvement.
Students were directed to use the SMART goals (SMART Goals, n.d.) framework for the goal. This framework was discussed in class before the first reflection and planning assignment. Students were also provided content with an example of a SMART goal and links to information about the SMART Goal framework.
For the initial reflection and planning assignment,
students were asked to reflect on their work since the start of the class. Subsequent reflection and planning assignments required students to reflect on the progress made since the previous reflection and planning assignment. The
frequency of the reflection and planning assignments varied depending on the class but were typically done every three to four weeks or at the end of major course modules.

Information Systems Education Journal (ISEDJ) 19 (4) ISSN: 1545-679X August 2021
©2021 ISCAP (Information Systems and Computing Academic Professionals) Page 16
https://isedj.org/; https://iscap.info
Courses The reflection and planning assignments were used in a variety of IS/IT courses at the three participating universities. At the regional campus
of a large public university in the Midwest, the assignments were used by two different professors in the Computer and Information Technology department. In the fall of 2019, the assignments were used in an Introduction to IT course that all new IT majors are required to take and in a Fundamentals of Programming and
Problem Solving course that taught Java programming. The programming course is taken by some IT majors and by students majoring in Computer Science. In the spring 2020 semester that experienced a shift to remote learning due to
the COVID-19 pandemic, the reflection and
planning assignments were again used in the Introduction to IT and Fundamentals of Programming courses. The assignments were also used in an upper level Agile: Business Value Analysis course and a senior level course where IT students work on the requirements and design phase of their capstone projects.
Two faculty members participating in this study are based at a large public university in the southeastern United States. Each faculty member included the reflection and planning activities in their classrooms. One course was an undergraduate 2000-level introductory C#
programming class. The second course was a graduate-level security analytics course. The undergraduate course had an enrollment of 19 students, and all students completed the activities. The graduate course had an enrollment of 28 students; 26 students completed the
assigned activities. The undergraduate course was offered in a 14-week semester; the graduate course was offered in a hybrid format in a 7-week term. For the undergraduate students, over the duration of the semester, there were a total of three planning
and reflection activities each assigned at three-week intervals. The first activity was due during the fourth week of the course. The graduate
course, due to its reduced time frame, included two reflection and planning activities offered in week three and week six.
In Spring 2020, the reflection and planning assignments were also used at a private university in the mid-Atlantic region in an IT Security course. This technical course focuses on the study of information security threats, prevention and response, and prepares students
for the CompTIA Security+ certification. Students created initial SMART goals as part of an initial growth mindset activity during the first two weeks of the course. They then completed the
reflection and planning assignments every four weeks, for a total of three iterations. The following research questions were raised:
1. Did students indicate that reflection and planning activities increased their ability to succeed in the course?
2. Did the reflection and planning activities add significant effort to the required coursework?
Research Methods
For quantitative analysis, a survey was performed
for all students to collect student feedback on the reflection and planning assignments, the goals, and their perception of success aligned to the assignments. The survey was divided into two categories to measure the student perception of progress using the goals and the level of effort required to create goals and assess progress
through the reflection and planning activities. The goal of the survey was to gather information about whether students saw the value of the assignments and how the assignments affected students' performance in the class. Additional survey questions also asked about the effort needed to complete the assignments, whether
students enjoyed the assignments, and whether they would like to do similar assignments in future courses. The complete list of questions with the Likert scale can be found in Appendix 2. The first category measuring student perception
of progress included the following survey questions:
● I saw the value of the reflection activities to develop ideas for how to improve my work in the course.
● I saw the value of the planning activities to improve my future work in the course.
● I feel that completing the reflection and planning activities improved my performance in the class.
The second category measuring the level of effort included the following survey questions:
● How effortful was it for you to complete
the reflection assignments? ● How effortful was it for you to complete
the planning assignments? ● How much did you enjoy the reflection
activities?

Information Systems Education Journal (ISEDJ) 19 (4) ISSN: 1545-679X August 2021
©2021 ISCAP (Information Systems and Computing Academic Professionals) Page 17
https://isedj.org/; https://iscap.info
● How much did you enjoy the planning activities?
● How much did you learn about setting good goals for yourself?
● How much did these activities help you learn about a structured process for improving your work in a class or similar long term activity?
● How much would you like to do similar reflection and planning activities in future courses?
The survey used for the class at the private university in the mid-Atlantic region had an additional question that was added in response to the COVID-19 pandemic. The question used a 5-
point Likert scale and stated:
● The reflection and planning activities
helped me in my ability to succeed as the course moved to a distance learning format in the middle of the term.
The weekly reflection and planning assignments
provided qualitative feedback on student progress. Instructors gained valuable input on the level of student dedication to goal setting, following their weekly goals, and personal issues that impacted their success, such as the change in course delivery format from traditional, in-person courses to virtual, online delivery.
4. RESULTS
Response averages to survey questions (Appendix 3) were evaluated for the sample of students who completed the survey at each
participating university. Perceived Value Questions related to the perceived value of the reflection and planning activities include: (Q1) I saw the value of the reflection activities to develop ideas for how to improve my work in the
course, (Q2) I saw the value of the planning activities to improve my future work in the course, and (Q3) I feel that completing the
reflection and planning activities improved my performance in the class. On a 5.0 scale, the averages for the first two questions (Q1 and Q2), except for one class, were all above 4.0. The
averages for Q3 were all above 4.0 except for two classes. Ranges over all three questions were from 3.4 to 4.5. Overall, the data suggests students do see value in completing the reflection and planning activities, and they, at least to some
degree, feel that the activities improve their performance. Perceived Effort
Questions related to perceived effort include: (Q4) How effortful was it for you to complete the reflection assignments? and (Q5) How effortful was it for you to complete the planning assignments? Responses to these questions had a wider range of results compared to the first three questions, with averages from 3.4 to 5.9 on
a 7.0 scale. For both Q4 and Q5, half of the classes averaged 4.0 or above. One possible explanation for the variability is that students may not have read the scale closely; both questions related to effort were anchored by
1=Not Very Much and 7=Very Much. Students
may not have caught the wording of the anchors and inadvertently responded in reverse of their intentions. However, it is also possible that students did not feel like the activities required much effort. The participating classes in this study were
technical in nature, and when students responded to the survey questions, their frame of reference was relative to the activities required for the courses and, therefore, less effortful in comparison. The sample from the participating university in the southeastern United States consisted of both undergraduate and graduate
students. Lower averages on the effort required for the reflection and planning assignments were indicated by non-traditional students versus traditional undergraduate students. Non-traditional students include students who were holding down full-time jobs and taking classes
simultaneously. Students balancing the challenges of full-time employment may not perceive reflection and goal planning as challenging of a task when compared to the traditional students. Graduate students, also, typically enter the program with work experience and goal setting from either work or
undergraduate coursework. Therefore, they may not feel the effort is as great as perceived by the undergraduate students. In general, the
variability brings up additional questions related to why responses varied more for these survey items and calls for more investigation in future studies.
Enjoyment Questions related to the perceived enjoyment of completing the reflection and planning activities include: (Q6) How much did you enjoy the reflection activities? and (Q7) How much did you
Information Systems Education Journal (ISEDJ) 19 (4) ISSN: 1545-679X August 2021
©2021 ISCAP (Information Systems and Computing Academic Professionals) Page 18
https://isedj.org/; https://iscap.info
enjoy the planning activities? Except for one class, the averages for questions Q6 and Q7 were 4.0 or above, indicating that for the most part, students enjoyed participating in the reflection
and planning activities. Perceived Learning about Setting Goals and a Structured Process for Improvement Questions related to perceived learning about setting goals and a structured process for improvement include: (Q8) How much did you
learn about setting good goals for yourself? (Q9) How much did these activities help you learn about a structured process for improving your work in a class or similar long term activity? and (Q10) How much would you like to do similar
reflection and planning activities in future
courses? For question Q8 the averages for all classes were 4.5 or above, indicating that students felt that through completing these activities they did learn about setting good goals for themselves. Except for one class, the averages for questions Q9 and Q10 were 4.0 or above, leading to a general observation that
students also perceived they learned about a structured process for improvement and would want to do similar reflection and planning activities in future courses. Reflection Papers Participating classes (except for two classes from
Fall 2019) were impacted by the COVID-19 pandemic. Many students included in their reflection and planning papers aspects about COVID-19 that were affecting their lives, which ranged from adjusting to children and other family members being at home to job insecurities
to, in some cases, increased demands on their jobs. Many students shared stresses and anxieties related to the pandemic in their papers. It is acknowledged that the pandemic may have also influenced responses on the survey. From the instructors’ perspective, the reflection
and planning assignments offered information about circumstances affecting individual student performance in the class. Therefore, instructors
were able to offer tailored feedback to support and encourage students. In addition to mentioning concerns related to the pandemic, students also included more general issues in
their papers including time management, aspirations to understand specific complex course material, stress management in general, plans to take better care of themselves, and balancing job and/or family demands while keeping up with school. Overall, this gave instructors an
opportunity to build a broader connection with students, one that was not solely focused on the course content.
5. FUTURE RESEARCH Future research in growth-mindset theory, as it relates to reflection and planning activities, warrants continued investigation and holds the potential of providing students with a valuable tool for setting and working towards SMART goals
to improve their experience and performance in classes. Demographic questions could be added to the survey to determine if there is a significant difference between undergraduate and graduate students, as well as between traditional and non-
traditional students. Other demographic
questions may include major, class standing (Freshman, Sophomore, Junior, Senior), gender, and work experience. Continuing data collection in future semesters will not only benefit from including demographic information, but it will also be important to help determine if the data collected during Spring 2020 was significantly
influenced by the COVID-19 pandemic. Additionally, future research should examine the measures used in this study for an enhanced understanding of how they may operate independently as constructs representing concepts such as perceived value, effort, and
enjoyment. It would be beneficial to test for relationships in the data such as evaluating if student perceptions of value, enjoyment, and effort in the reflection and planning activities predict how much students would like to do similar reflection and planning activities in the
future (Q10). More data would need to be collected to perform structural equation modeling analysis to investigate these possibilities further. Therefore, collecting additional data to increase the sample size is also a focus for future research. Another opportunity is to do a content analysis on
the student submissions to identify the main topic areas mentioned by students, such as time management, stress management, work-life
balance – and look for ways to provide resources that can help students with these topics.
6. CONCLUSIONS
Student responses indicated that reflection and planning activities did increase their ability to succeed in the course. Survey results demonstrated favorable student perceptions regarding the reflection and planning activities.

Information Systems Education Journal (ISEDJ) 19 (4) ISSN: 1545-679X August 2021
©2021 ISCAP (Information Systems and Computing Academic Professionals) Page 19
https://isedj.org/; https://iscap.info
The positive impact of goal setting was evident based on the students’ perceptions of success. The favorable student responses toward the reflection and planning activities provide the
platform for future research to further investigate the role of such activities in growth-mindset theory. For educators, the reflection and planning activities are simple assignments that can be readily incorporated into a variety of IT-related classes and that are in general viewed by students to be enjoyable and beneficial.
7. REFERENCES
Ahgina, W., De Smet, A., Lackey, G., Lurie, M., &
Muraka, M. (2018). The Five Trademarks of
Agile Organizations. Retrieved on May 9,
2019, from https://www.mckinsey.com/business-functions/organization/our-insights/the-five-trademarks-of-agile-organizations/
Beck, K., et. al. (2001). Agile Manifesto. Retrieved June 29, 2020, from https://agilemanifesto.org
Crookes, G., & Schmidt, R. W. (1991). Motivation: Reopening the Research Agenda. Language Learning, 41(4), 469-512.
Cutts, Q., Cutts, E. Draper, S., O'Donnell, P., & Saffrey, P. (2010). Manipulating Mindset to Positively Influence Introductory
Programming Performances. In SIGCSE10:
Proceedings of the 41st ACM Technical Symposium on Computer Science Education, Milwaukee (WI), USA, 10-13.03.2010. Association for Computing Machinery, New York.
Dweck, C. (2016). Mindset: The New Psychology
of Success, Updated Edition. Ballantine Books, New York.
Hulshult, A. R., & Krehbiel, T. C. (2019). Using Eight Agile Practices in an Online Course to Improve Student Learning and Team Project Quality. Journal of Higher Education Theory and Practice, forthcoming.
ICAgile (n.d.). ICAgile Learning Roadmap Overview. Retrieved on May 9, 2019, from https://icagile.com/Learning-Roadmap/Roadmap-Overview
Krehbiel, T. C., Salzarulo, P. A., Cosmah, M. L., Forren, J., Gannod, G., Havelka, D., Hulshult, A. R., & Merhout, J. (2017). Agile Manifesto
for Teaching and Learning. The Journal of Effective Teaching, 17(2), 90-111.
Manchi, C., Visaria, S., & Mukhopadhyay, A. (2017). Do Rewards Reinforce the Growth
Mindset?: Joint Effects of the Growth Mindset and Incentive Schemes in a Field Intervention. American Psychological Association, 146(10), 1402-1419.
McKinsey & Company (2017). How to Create An Agile Organization. Retrieved on May 9, 2019, from
https://www.mckinsey.com/~/media/McKinsey/Business%20Functions/Organization/Our%20Insights/How%20to%20create%20an%
20agile%20organization/How-to-create-an-agile-organization.ashx
Moser, J., Schroder, H., Heeter, C., Moran, T., &
Lee, Y. (2011). Mind Your Errors: Evidence for a Neural Mechanism Linking Growth Mindset to Adaptive Posterror Adjustments. Association for Psychological Science, 22(12), 1484-1489.
Pueschel, A., & Tucker, M. L. (2018). Achieving Grit Through the Growth Mindset. Journal of
Instructional Pedagogies, 20, 1-10
SMART Goals: How to Make Your Goals Achievable. (n.d.). Retrieved from https://www.mindtools.com/pages/article/smart-goals.htm
Smith, G., & Sidky, A. (2009). Becoming Agile in an Imperfect World. Manning Publications
Co.: Greenwich, CT
Tang, X., Wang, M., Guo, J., & Salmela-Aro, K. (2019). Building Grit: The Longitudinal Pathways Between Mindset, Commitment, Grit and Academic Outcomes. Journal of Youth and Adolescence, 48, 850-863.
Vijeh, Z. M. (2014). Divergent Consequences of Success and Failure on Language Learners' Self-improvement Motivation. Procedia - Social and Behavioral Sciences, 98, 1179-1185.
Woods, D. (2020). Using Goal Setting Assignments to Promote a Growth Mindset in
IT Students. Information Systems Education Journal, 18(4), 4-11.
Woods, D. & Hulshult, A. (2018). Using Agile Practices to Scaffold Team Projects in an IT Ethics Course. Journal of Computing Sciences in Colleges, 34(1), 17-23.

Information Systems Education Journal (ISEDJ) 19 (4) ISSN: 1545-679X August 2021
©2021 ISCAP (Information Systems and Computing Academic Professionals) Page 20
https://isedj.org/; https://iscap.info
Appendix 1
Example of a reflection and planning assignment including assessment rubric.

Information Systems Education Journal (ISEDJ) 19 (4) ISSN: 1545-679X August 2021
©2021 ISCAP (Information Systems and Computing Academic Professionals) Page 21
https://isedj.org/; https://iscap.info
Appendix 2
Course Activities Survey - Overall Results
Please answer the following questions about the recurring activities where you reflected on your work during the previous weeks of the course and set goals to plan your future work in the course. Scale (Q1-Q3): 1 (Strongly Disagree) - 5 (Strongly Agree) Scale (Q4-Q10): 1 (Not Very Much) - 7 (Very Much)
Q# Question Text Average
1 I saw the value of the reflection activities to develop ideas for how to improve my work in the course.
4.3
2 I saw the value of the planning activities to improve my future work in the course.
4.4
3 I feel that completing the reflection and planning activities improved my performance in the class.
4.1
4 How effortful was it for you to complete the reflection assignments? 4.2
5 How effortful was it for you to complete the planning assignments? 4.3
6 How much did you enjoy the reflection activities? 4.7
7 How much did you enjoy the planning activities? 4.8
8 How much did you learn about setting good goals for yourself? 5.5
9 How much did these activities help you learn about a structured process for improving your work in a class or similar long term activity?
5.6
10 How much would you like to do similar reflection and planning activities in future courses?
5.0

Information Systems Education Journal (ISEDJ) 19 (4) ISSN: 1545-679X August 2021
©2021 ISCAP (Information Systems and Computing Academic Professionals) Page 22
https://isedj.org/; https://iscap.info
Appendix 3
Response Averages to Survey Questions by Institution and/or Course
5 Point Likert Scale
7 Point Likert Scale
School Course Description
Semester
Q1 Q2 Q3 Q4 Q5 Q6 Q7 Q8 Q9 Q10
1 Introduction to IT
FA 2019
4.3 4.4 4.4 4.5 4.6 5.0 5.0 5.8 6.5 5.8
Java Programming
FA 2019
3.4 4.0 4.0 3.8 4.0 4.2 3.9 4.5 4.9 4.3
Introduction
to IT
SP
2020 4.2 4.4 3.2 3.4 3.6 3.0 3.2 5.0 4.8 3.2
Java Programming
SP 2020
4.3 4.2 4.2 4.2 3.7 4.5 4.7 5.5 5.3 5.3
Agile: Business Value Analysis
SP 2020
4.6 4.7 4.4 4.7 4.8 5.9 6.3 6.6 6.1 6.3
Capstone - Design
SP 2020
4.4 4.6 4.4 5.4 5.9 5.9 5.9 6.2 6.2 5.7
2 C# Programming
Security Analytics
SP
2020 4.1 4.2 3.6 3.6 3.8 4.7 5.0 4.7 4.7 4.4
3 IT Security SP 2020
4.7 4.7 4.5 3.6 3.6 4.7 4.0 5.3 6.1 4.6
High 3.4 4.0 3.2 3.4 3.6 3.0 3.2 4.5 4.7 3.2
Low 4.7 4.7 4.5 5.4 5.9 5.9 6.2 6.6 6.5 6.2

Information Systems Education Journal (ISEDJ) 19 (4) ISSN: 1545-679X August 2021
©2021 ISCAP (Information Systems and Computing Academic Professionals) Page 23
https://isedj.org/; https://iscap.info
Effects of emergency online learning
during COVID-19 pandemic on student performance and connectedness
Kristi L. Boardman [email protected]
Stephanie A. Vargas
Jami L. Cotler
Dmitry Burshteyn [email protected]
Siena College
Loudonville, New York, 12211
Abstract
This study took place at an undergraduate liberal arts college that switched to emergency online learning
during the Spring 2020 semester due to the COVID-19 pandemic. All students were forced to leave campus and attend classes remotely. The participants were 109 undergraduate students ranging from 18 to 22 years of age. An online survey was conducted to better understand the effects of the sudden switch to emergency online learning on the students. Overall, participants felt less connected to their peers, but felt more connected to their professors when compared to pre-pandemic learning. Participants also felt less motivated to work and procrastinated noticeably more after the switch to emergency online
learning. However, participants that felt connected to others reported the importance of using Zoom video conferencing and face-to-face interaction. Many participants reported the importance of having normal conversations with their professors instead of focusing on classes to feel more connected to the community. The COVID-19 pandemic greatly affected this college and its students during the Spring 2020 semester. Keywords: COVID-19, Emergency Online Learning, Connectedness, Performance, Motivation,
Engagement
1. INTRODUCTION The pandemic virus known as COVID-19, the Human Coronavirus, was first introduced to the
World Health Organization (WHO) as a type of pneumonia of unknown cause in Wuhan, China in December of 2019. On January 23, 2020 the WHO
Director General, Dr. Tedros Adhanom Ghebreyesus, convened the Emergency Committee to consider the novel coronavirus outbreak. The outbreak spread throughout the
globe and by March of 2020, WHO had declared that the COVID-19 outbreak characterized as a pandemic. Soon after this declaration, the

Information Systems Education Journal (ISEDJ) 19 (4) ISSN: 1545-679X August 2021
©2021 ISCAP (Information Systems and Computing Academic Professionals) Page 24
https://isedj.org/; https://iscap.info
hashtag #TogetherAtHome started to become
popular as more organizations started to establish procedures for employees to work from home to promote social distancing. Many different
businesses and schools suspended any activities that required people to be in close quarters with each other. Many of these organizations opted to switch to remote activities. Colleges and Universities, especially, decided to finish the Spring 2020 semester remotely with online classes.
The undergraduate liberal arts college where this study took place was one of the colleges that switched to emergency remote learning to ensure the continued health of the students, professors, and staff. The transition was not an easy one, but
went as smoothly as possible due to the institutional community working together. The college decided to prolong the spring break vacation for an extra week to allow professors to create lesson plans for emergency online learning. Spring Break vacation became a blessing in disguise since most of the students
were home when it became obvious that all courses would be switched to an online format so that students could remain home and continue learning remotely. This ensured that all students could remain safe and healthy during such an unprecedented and challenging time, whilst simultaneously giving the students stability
during the COVID-19 pandemic panic. This sense of stability was important in giving the students a
purpose and a distraction during their quarantine (Benson, 2020). In person classes create an atmosphere of
connectedness among students and professors. Connection is “feeling that you belong to a group and generally feel close to other people” (Social Connection Definition: What Is Social Connection, 2020). Feeling connected to other people is an exceedingly important part of learning and being social in an academic setting. Feeling connected
to other students and to one's professors will affect student performance and motivation in and out of class (Diep et al., 2019). It is important that this feeling of connectedness still exists when
classes cannot be held face-to-face. This undergraduate liberal arts college prides
itself on creating a tight knit community where students feel connected to each other and their professors. So, we ask, is it possible to maintain this feeling of connectedness through online learning? And does this feeling of connectedness influence a student’s engagement, performance,
and motivation in class?
2. LITERATURE REVIEW
During the Spring 2020 semester, many institutions chose to switch to an online learning
environment. There are three types of online classes that can be offered to ensure that students receive the education they were promised. The three types of online courses are hybrid courses, asynchronous online courses, and synchronous online courses. Since hybrid courses require students to attend some classes in-person
and on campus, they were not offered during the latter half of the Spring 2020 semester when the COVID-19 pandemic forced the campus to close for the second half of the semester. Both asynchronous and synchronous online courses were offered during the COVID-19 pandemic.
Online classes There has been much conversation about whether or not online classes are effective for students. Online classes can cause a feeling of disconnect between students and their peers, as well as between students and their professors (Otter et
al., 2013). This feeling of disconnect can often cause problems with motivation and engagement in class. Otter et al. (2013) found that students in online-classes felt more disconnected from their peers and lecturers, were more autonomous in their studies, and were helped less by their professor than their professor believed them to
be. Some students may feel that their professors do not care about them or how well they do in
their classes when they are unable to meet with them face-to-face or when it takes a long time for the student to get a response from the professor. “Most students feel that face-to-face contact is
essential for building a sense of community” (Conole et al., 2008). This sense of community could be what causes some students to prosper in their courses. Some students may be unable to focus on their work or may feel that a course is less important than others because they do not feel like they are a part of a community that is
meant to be learning together. Online courses rely heavily on student self-motivation. When students are unsupervised,
they must still be able to complete their assignments promptly. Students need to motivate themselves to complete activities
online. Some students might find it hard to motivate themselves or may even procrastinate more often. While in face-to-face classes, the role of the motivator is taken on by the professor (Upton, 2006). A lack of motivation on the part of the students may ensure that they do not learn
the material, thoroughly or at all. It is especially true that student learning may be affected

Information Systems Education Journal (ISEDJ) 19 (4) ISSN: 1545-679X August 2021
©2021 ISCAP (Information Systems and Computing Academic Professionals) Page 25
https://isedj.org/; https://iscap.info
negatively by motivation for courses that are not
typically stimulating or are basic courses that will not be built upon in the future. Motivation, however, is not the only possible disadvantage.
Students can also feel daunted by the technological expectations of taking an online course, especially if they don’t have previous knowledge or experience using online tools (Holley and Oliver, 2010). It is important that professors ensure that their students know how to use the technology necessary for their courses
at the beginning of their course. For instance, Evans et al. (2004) showed that students performed better when their online course material was accessible via interactive, navigable format than via a series of scrollable web-pages. This may also help to foster a sense of community
or camaraderie with a professor. Research suggests that participation in learning technology can itself increase engagement and learning (Chen et al., 2010). Neither online courses nor face-to-face courses are guaranteed to be beneficial to or hinder the
learning of all students, however. In General, student engagement in traditional classes is positively associated with student engagement and academic performance, although the magnitude of those effects might be small (Carini et al., 2006). There is no guarantee that students will perform better in a face-to-face class or in an
online course (Magalhães et al., 2020). Davies and Graff (2005) found that students who
interacted and participated more in online discussion did not show significantly better academic performance than students who were less involved in that discussion. Phillips (2015)
found that most students liked online learning, but felt that it would work better as supplementary learning instead of full-time classes. Similarly, Nenagh and Rachel (2014) found that students had a strong preference for discussion face to face because they felt more engaged and liked the immediate feedback.
However, these same students preferred online assignments, especially written assignments, to be available online which allowed them to complete their assignments on their own time
(Nenagh & Rachel, 2014). Students have benefitted from taking online
courses though. Professors often post all work and assignments, along with their syllabus at the beginning of the year. This gives students ample time to complete assignments when they have the time to dedicate to them. The extra time available for online activities might allow students
to think about course material more critically and reflectively, leading to a deeper understanding of
the course content (Ramsden, 1992; Robinson
and Hullinger, 2008). Students will benefit from an online class with a format that allows them to take their time to explore the material and make
connections of their own. Face-to-face classes often require students to take notes while the professor is teaching, so asking questions could be impossible for those students that need to ruminate before asking questions or need more time to understand the material.
Feelings of Connection One benefit of participating in online courses is that there is no peer pressure. The less confrontational or personal nature of e-learning might encourage shyer students to engage more, or to feel less pressure in comparison to face-to-
face interactions (Warschauer, 1997; Hobbs, 2002). According to Anna Yi Ni (2013), participation in an online class is less intimidating so the quality and number of interactions may be increased in an online classroom. This means that students may find themselves more open to asking questions and interacting with their
professors and with other students, resulting in an increase in connectedness in the classroom. Humans seek out connections with one another every day of their lives. Humans want to have a feeling of connectedness with each other. Connectedness is the desire to interact with
others in a meaningful way and to create safe and satisfying relationships with others (Adams et al.,
2017). This feeling of connectedness can affect a students’ motivation and, in turn, their performance in their academics. The feeling of connectedness is one aspect that is necessary for
a person to experience self-determination. Self-determination is an important thing for everyone to experience because it promotes optimal health and is essential for social development and wellbeing (Siti et al., 2020). “Self-determination also has an impact on motivation—people feel more motivated to take actions when they feel
that what they do will have an effect on the outcome” (Siti et al., 2020, p. 3). In order for students to intrinsically feel motivated in their classes, it is important that they feel self-
determination. This would be impossible, unless they felt connected to their peers and their teachers.
Previous research has indicated that students prefer to receive more personalized feedback from their professors when attending online courses. These students reported that they were more satisfied with the class and their own work,
but did not report that they felt more connected

Information Systems Education Journal (ISEDJ) 19 (4) ISSN: 1545-679X August 2021
©2021 ISCAP (Information Systems and Computing Academic Professionals) Page 26
https://isedj.org/; https://iscap.info
to their professors because of the personalized
feedback (Gallien & Oomen-Early, 2008).
3. PARTICIPANTS
Students were recruited to participate in this study through social media platforms and the undergraduate college’s digital newsletter/digest. All social media postings were done via Facebook groups that were dedicated to each of the classes that attended the college during the Spring 2020
semester. The social media postings remained in the Facebook groups for seven days before being removed. The same message was posted in the newsletter/digest for four days before being discontinued to ensure that more students would be able to view the survey. All students that chose
to participate did so without incentive or reward. All information was kept confidential and no personal identifiers were collected at any point during the project. Participant Demographics The participants of this study included 109
undergraduate students and 1 graduate student that attended the liberal arts college during the Spring 2020 semester. 45% of the participants identified as female, 17% identified as male, 1% identified as gender variant or nonconforming and 37% preferred not to disclose their gender. 15% of participants were freshman students, 9% were
sophomore students, 29% were junior students, 9% were senior students, 1% were graduate
students, and 37% of participants preferred not to share their class year. Participants ranged from 18 to 22 years old.
4. METHODS All data for this research was collected through a voluntary, anonymous survey. This survey was created using Qualtrics. The survey contained one qualifier type question to ensure that only students of this college who attended the Spring
2020 semester for the switch to emergency online learning took the survey. The survey included 24 multiple choice questions, 7 short responses, and an open text box so participants could share
information about their experience during the COVID-19 pandemic with the authors of this paper.
The survey questions can be viewed in their entirety in appendix A.
5. RESULTS
The analysis of the survey responses began by comparing the answers in the report given by
Qualtrics. Out of the 173 responses we received,
we had to eliminate 64 surveys because they were incomplete. From the 109 responses, 72.06% of participants said that they had not
taken an asynchronous class and the other 27.94% had taken an asynchronous class previous to the Spring 2020 semester. The maximum number of asynchronous classes taken by a participant before the Spring 2020 semester was 4. 85.07% of participants had not taken a synchronous online class prior to the switch to
emergency online learning in the Spring 2020 semester while only 14.93% of participants had taken a synchronous class. The maximum number of synchronous classes taken by a participant before the Spring 2020 semester was 7. The students were also asked if they had taken
a hybrid online class, 82.35% of participants answered no while 17.65% said yes. The maximum number of hybrid classes taken by a single participant before the Spring 2020 semester was 6. To better understand how the switch affected
participants' perceptions of their connection to classmates and professors, the participants were asked about how connected they felt to each other and to their professors before and after the switch to online learning. A paired-samples t-test was conducted to compare how connected students felt to each other before and after the
switch to online learning. There was a significant difference in the scores for the pre-switch
(M=3.78, SD=0.96) and post-switch (M=1.94, SD=0.90) conditions; t(80)=12.56, p<0.01. Students felt significantly less connected to each other after the switch to online learning. When
asked how connected they felt to other students before switching to online learning the majority of students, 67.65%, felt either very or extremely connected to their fellow students. However, after the switch to online learning only 5.88% of students felt very connected and 0% of students felt extremely connected to others. There was a
dramatic increase in students that felt not at all or only somewhat connected to other students, a jump from 11.76% to 72.06% of students. The participants’ feelings of connectedness to other
students decreased heavily after having to switch to online learning.

Information Systems Education Journal (ISEDJ) 19 (4) ISSN: 1545-679X August 2021
©2021 ISCAP (Information Systems and Computing Academic Professionals) Page 27
https://isedj.org/; https://iscap.info
Figure 1: A comparison of the levels of connection between students before and after the switch to online learning.
When participants were asked how connected they felt to professors before switching, 25.00% felt extremely connected, 55.88% felt very connected, 10.29% were neutral on the topic, 7.35% felt somewhat connected, and 1.47% felt not at all connected. A paired-samples t-test was conducted to compare how connected students
felt to their professors before and after the switch to online learning. There was a significant difference in scores between pre-switch (M=2.23, SD=0.95) and post-switch (M=3.96, SD=0.87) conditions; t(80)=-11.84, p<0.01. Students, overall, felt more connected to professors after
the switch to online learning. When participants were asked what tools helped them to feel more connected to their peers and their professors, the
most helpful tool reported was Zoom. The participants were also asked about the availability of their professors after switching to
online learning. The results showed 10.61% much more available, 18.18 somewhat more available, 36.36% available the same amount as before the switch, 28.79% somewhat less available and 6.06% much less available. The tools that reportedly helped participants to
feel connected with their professors were Zoom and email. The participants were asked if there was anytime they felt particularly connected to classmates or professors. While most said no, a handful said Zoom calls helped them feel
connected. Participants were also asked how
often they used their webcam during class. The responses showed 9.09% never used their webcam, 24.24% sometimes did, 24.24% used it about half of the time and 18.18% always used their webcam. They were also asked about the use of microphone; 3.08% never used a microphone, 43.08% sometimes did, 26.15%
used it about half the time, 15.38% did most of the time and 12.31% always used their
microphone. The participants were asked how
often they had access to tools they needed for their online class. All participants were able to access tools they needed, but how often varied.
10.61% of participants had access sometimes, 13.64% had access about half of the time, 40.91% did most of the time, and 34.85% always had access to the necessary materials. The participants were asked about how often they spent time with their classmates on class related
activities and non-class related activities after the switch to online learning. For class related activities, 19.40% spent no time with classmates, 28.36% did one to two times during the six weeks, 23.88% did three to four times during the six weeks, 17.91% spent time with classmates
one to two times per week and 10.45% spent time with classmates more than two times per week. For non-class related activities, 41.79% never spent time with other students, 34.33% did once or twice during the six weeks, 8.96% did three to four times during the six weeks, 8.96% did one or two times every week and 5.97% did
more than two times per week. Students did not interact very often outside of class. Students seem to have sought classmates out for homework, group projects and other in class related activities. Participants were also asked how many college events they attended online. 50.00% of participants attended 0, 39.71%
participants attended 1-2 events, 4.41% participants attended 3-4, and 5.88% attended 5
or more events. As shown in Figure 2, participants met very few times after the switch to online learning and mostly interacted with each other for class related activities.
Figure 2: Participants spent very little time connecting with other students after the switch to online learning.
A paired-samples t-test was conducted to compare the levels of motivation felt by participants to complete their assignments before and after the switch to online learning. There was a significant difference in the scores for pre-
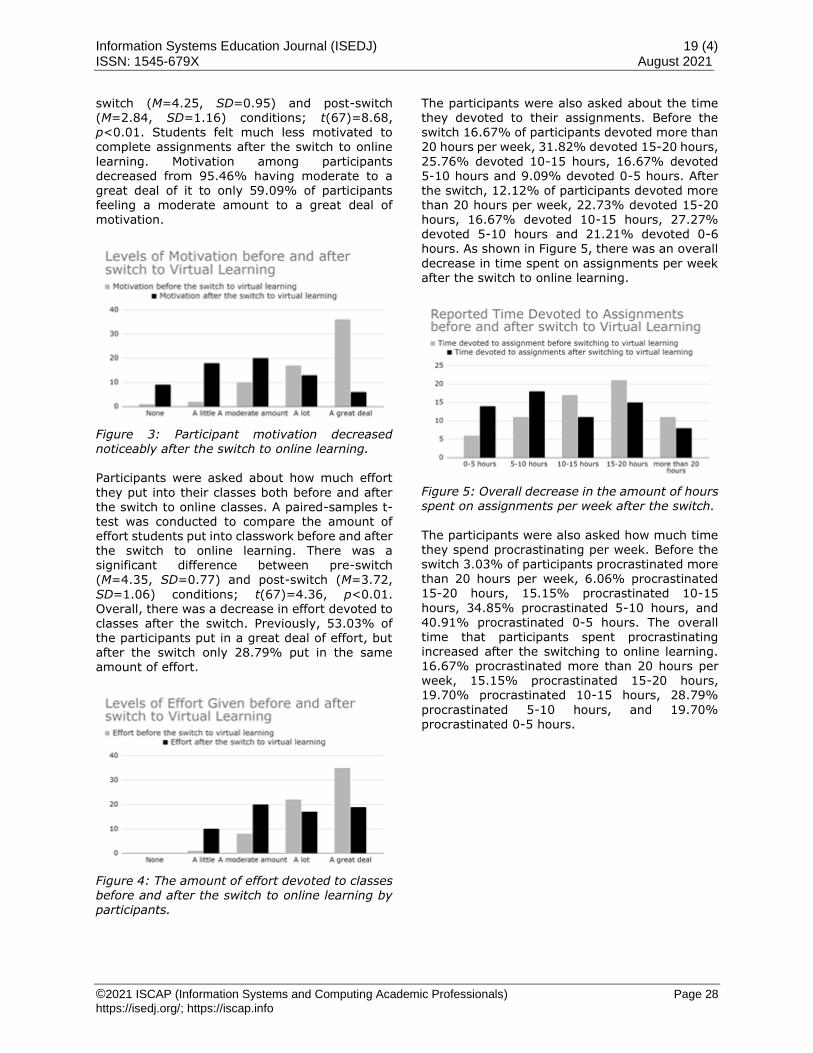
Information Systems Education Journal (ISEDJ) 19 (4) ISSN: 1545-679X August 2021
©2021 ISCAP (Information Systems and Computing Academic Professionals) Page 28
https://isedj.org/; https://iscap.info
switch (M=4.25, SD=0.95) and post-switch
(M=2.84, SD=1.16) conditions; t(67)=8.68, p<0.01. Students felt much less motivated to complete assignments after the switch to online
learning. Motivation among participants decreased from 95.46% having moderate to a great deal of it to only 59.09% of participants feeling a moderate amount to a great deal of motivation.
Figure 3: Participant motivation decreased noticeably after the switch to online learning. Participants were asked about how much effort
they put into their classes both before and after the switch to online classes. A paired-samples t-test was conducted to compare the amount of effort students put into classwork before and after the switch to online learning. There was a significant difference between pre-switch
(M=4.35, SD=0.77) and post-switch (M=3.72,
SD=1.06) conditions; t(67)=4.36, p<0.01. Overall, there was a decrease in effort devoted to classes after the switch. Previously, 53.03% of the participants put in a great deal of effort, but after the switch only 28.79% put in the same amount of effort.
Figure 4: The amount of effort devoted to classes before and after the switch to online learning by participants.
The participants were also asked about the time
they devoted to their assignments. Before the switch 16.67% of participants devoted more than 20 hours per week, 31.82% devoted 15-20 hours,
25.76% devoted 10-15 hours, 16.67% devoted 5-10 hours and 9.09% devoted 0-5 hours. After the switch, 12.12% of participants devoted more than 20 hours per week, 22.73% devoted 15-20 hours, 16.67% devoted 10-15 hours, 27.27% devoted 5-10 hours and 21.21% devoted 0-6 hours. As shown in Figure 5, there was an overall
decrease in time spent on assignments per week after the switch to online learning.
Figure 5: Overall decrease in the amount of hours spent on assignments per week after the switch.
The participants were also asked how much time they spend procrastinating per week. Before the switch 3.03% of participants procrastinated more
than 20 hours per week, 6.06% procrastinated 15-20 hours, 15.15% procrastinated 10-15
hours, 34.85% procrastinated 5-10 hours, and 40.91% procrastinated 0-5 hours. The overall time that participants spent procrastinating increased after the switching to online learning. 16.67% procrastinated more than 20 hours per week, 15.15% procrastinated 15-20 hours, 19.70% procrastinated 10-15 hours, 28.79%
procrastinated 5-10 hours, and 19.70% procrastinated 0-5 hours.
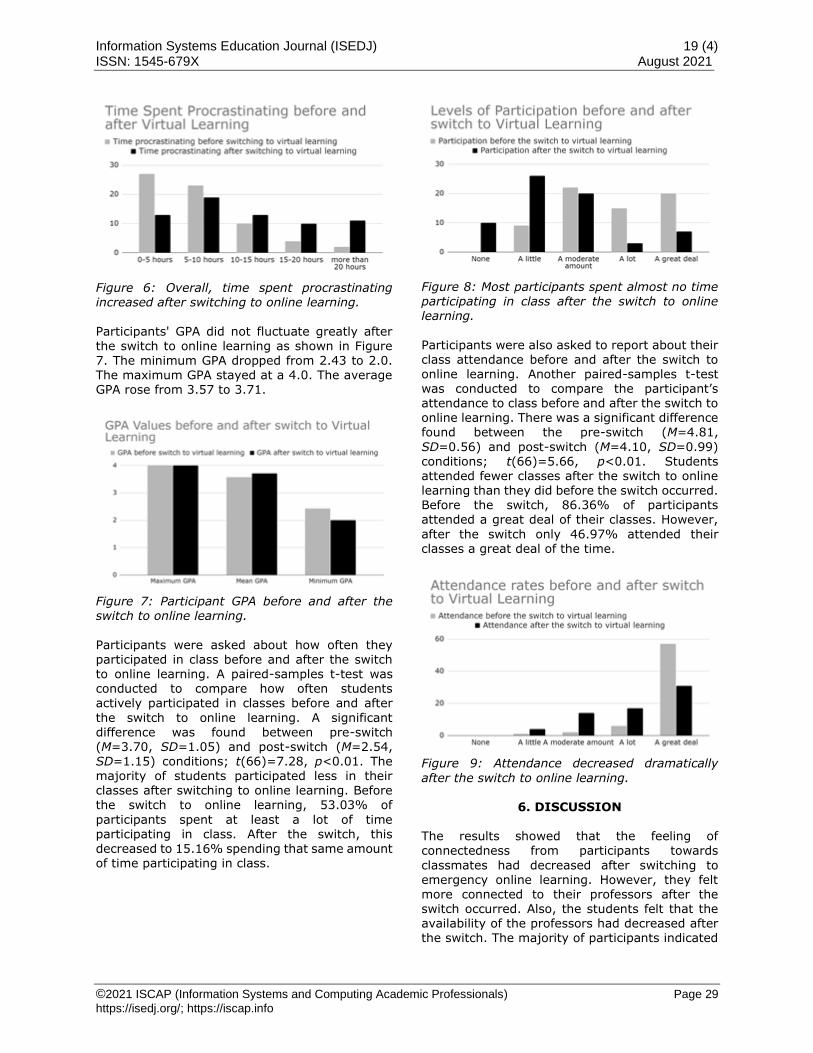
Information Systems Education Journal (ISEDJ) 19 (4) ISSN: 1545-679X August 2021
©2021 ISCAP (Information Systems and Computing Academic Professionals) Page 29
https://isedj.org/; https://iscap.info
Figure 6: Overall, time spent procrastinating increased after switching to online learning.
Participants' GPA did not fluctuate greatly after
the switch to online learning as shown in Figure 7. The minimum GPA dropped from 2.43 to 2.0. The maximum GPA stayed at a 4.0. The average GPA rose from 3.57 to 3.71.
Figure 7: Participant GPA before and after the switch to online learning.
Participants were asked about how often they participated in class before and after the switch to online learning. A paired-samples t-test was conducted to compare how often students actively participated in classes before and after
the switch to online learning. A significant difference was found between pre-switch (M=3.70, SD=1.05) and post-switch (M=2.54, SD=1.15) conditions; t(66)=7.28, p<0.01. The majority of students participated less in their classes after switching to online learning. Before
the switch to online learning, 53.03% of
participants spent at least a lot of time participating in class. After the switch, this decreased to 15.16% spending that same amount of time participating in class.
Figure 8: Most participants spent almost no time participating in class after the switch to online learning.
Participants were also asked to report about their class attendance before and after the switch to online learning. Another paired-samples t-test was conducted to compare the participant’s attendance to class before and after the switch to online learning. There was a significant difference found between the pre-switch (M=4.81,
SD=0.56) and post-switch (M=4.10, SD=0.99) conditions; t(66)=5.66, p<0.01. Students attended fewer classes after the switch to online learning than they did before the switch occurred. Before the switch, 86.36% of participants attended a great deal of their classes. However,
after the switch only 46.97% attended their classes a great deal of the time.
Figure 9: Attendance decreased dramatically
after the switch to online learning.
6. DISCUSSION
The results showed that the feeling of connectedness from participants towards
classmates had decreased after switching to emergency online learning. However, they felt more connected to their professors after the switch occurred. Also, the students felt that the availability of the professors had decreased after the switch. The majority of participants indicated

Information Systems Education Journal (ISEDJ) 19 (4) ISSN: 1545-679X August 2021
©2021 ISCAP (Information Systems and Computing Academic Professionals) Page 30
https://isedj.org/; https://iscap.info
that they connected with other students, at most,
four times in a six-week period for their classes. Outside of classes, they connected with students at most twice during a six-week period. One
factor for the decrease in connection between classmates is the low interaction rate between students both for class related and non-class related activities. The authors believe that the decrease in connectedness is the lack of face-to-face interaction. Creating a presence whether online or in person is important. This might
explain why the tool that made the students feel the most connected was Zoom, which allowed face-to-face interactions on the computer. The authors suggest that an increase of using the webcam and mic could foster more of a sense of connection. The participants also felt
disconnected from the college community possibly due to the lack of involvement in the college's online events. The amount of effort the participants reported to complete their course work decreased after the switch to emergency online learning. The
students' motivation to complete the course work also decreased after the switch. Their attendance to and participation in class also decreased. This demonstrates that overall, engagement in classes decreased. The time that the students devoted to assignments decreased while the amount of procrastination increased. The overall GPA
maximum stayed the same throughout the Spring 2020 semester. The average GPA minimum, 2.43,
was higher than the average minimum during the Spring 2020 semester, which was 2.00. The overall GPA mean was lower than the spring 2020 semester mean (Figure 7).
When asked to recount a time when participants felt particularly connected to other students or their professors, the majority of students responded that Zoom calls and discussion boards helped them stay connected to classmates and professors. Some professors reached out to the
students to find out how they were doing. Some of the participants mentioned that participating in Bingo online and other campus activities made them feel more connected to others. The online
learning tools that the students enjoyed the most were Zoom, email, quizlet and canvas.
The participants were to report what they found to be the most motivating, to which some reported feeling motivation when the online learning environment simulated the classroom experience by being able to see and hear their classmates and professor. Furthermore, when the
professor was motivated and put in effort this in turn motivated students. Another way
participants felt motivated was when they had
opportunities to work on group projects and had discussions with their classmates. It was also mentioned that a motivating situation was when
the assignment was graded thoroughly, not only checked for completion. Another motivating situation was when the professors allowed the students the freedom to do their work at their own pace, while also giving them feedback and support. Similarly to when the pandemic was not an issue, students expressed that a motivating
force was earning desired grades and achieving a high GPA. Commuters reported that not having to commute gave them extra time to complete their work.
7. CONCLUSIONS
Previous literature supports the importance of connection between students to promote personal motivation and academic success. This undergraduate liberal arts college also supports a close knit, connected community. The COVID-19 pandemic halted connection between students
and professors physically on campus, but students were still able to connect to each other with just a little more effort than they may be used to. In a socially distanced community, using technology such as Zoom calls and emails to stay connected to others is vitally important. Those participants that did not stay connected with their
peers or with their professors, felt their lack of connection over the Spring 2020 semester
through lowered motivation and possibly with lowered academic success. Overall, students had trouble staying connected and motivated after the emergency switch to online learning.
In the future, utilizing webcam and microphone technology may help students to feel more connected to their peers and their professors. Participants reported feeling more connected to their peers when these technologies were utilized. Students may also feel more connected to their
professors when they reach out to talk to them outside of class. Limiting interactions to only lesson plans may make students feel disconnected and unimportant to their professors.
This disconnect may be one of the reasons for lowered motivation and communication in students. More genuine interactions may
persuade students to be more present in classes and give them the confidence to participate more openly. Future research may include recording a more detailed report of the best and the worst
interactions that occurred during the switch to online learning during an emergency. Overall,
Information Systems Education Journal (ISEDJ) 19 (4) ISSN: 1545-679X August 2021
©2021 ISCAP (Information Systems and Computing Academic Professionals) Page 31
https://isedj.org/; https://iscap.info
participants reported feeling higher levels of
connectedness when face-to-face interactions occurred, even if they only happen through webcams and Zoom meetings. Extended office
hours utilizing this technology may allow students to seek out connections with professors. These connections may allow students to ask questions privately so they can better understand their classes and succeed academically, even online. Key learnings and recommendations based on
this research: ● Have opportunities for students to work
together in discussion and group projects.
● Create a presence for your students by using tools such as Zoom that allow for
an increased use of video and audio exchange.
● Create opportunities for casual discussions between students, simulating conversations they would normally have at the beginning and end of an in-person class.
● Reach out individually to students to check in.
● Extend office hours utilizing web-based technology such as Zoom to allow students to seek out connections with professors and ask questions privately.
However, there were three main limitations to this study that are discussed below.
Limited Time Timing was a major factor for this project. The COVID-19 pandemic occurred during the last half
of the Spring 2020 academic semester. The best results for this survey would have occurred if students had been able to take the survey directly after the Spring 2020 semester had completed. However, this survey was administered to the student population in the middle of July 2020. The survey was administered approximately two
months after the completion of the spring semester. This time lapse could have resulted in a change in perception of peer connectedness and personal engagement in the students’ studies.
Survey Population The population for this survey was limited to the
students that attended the undergraduate liberal arts college during the Spring 2020 semester. A limited population ensures that all data collected is non generalizable. This data may be useful for creating future studies, but the authors suggest taking caution when using these results to
influence decisions made about online learning at other institutions.
Remote Correspondence
Since this study occurred during the COVID-19 pandemic, all interactions between authors and participants were handled remotely. All
recruitment procedures took place through an online newsletter and social media postings. The interactions between authors took place through emails and video chats. It was difficult to find times when all authors were available for meetings or to work together.
8. ACKNOWLEDGEMENTS
Research was funded by the Center for Undergraduate Research and Creative Activities (CURCA) at Siena College.
9. REFERENCES
Adams, N., Little, T. D., & Ryan, R. M. (2017). Self-Determination Theory. Development of Self-Determination Through the Life-Course, 47-54.
Anna Ya Ni. (2013). Comparing the Effectiveness
of Classroom and Online Learning: Teaching Research Methods. Journal of Public Affairs Education, 19(2), 199.
Benson, J. (2020, April 3). Online training program helps Bloomington martial arts academy connect with students during coronavirus pandemic. Pantagraph, The
(Bloomington, IL).
Carini, R. M., Kuh, G. D., and Klein, S. P. (2006). Student engagement and student learning: testing the linkages. Research in Higher Education Journal 47, 1–29. doi: 10.1007/s11162-005-8150-9
Chen, P., Lambert, A., & Guidry, K. (2009, November 22). Engaging online learners: The impact of Web-based learning technology on college student engagement. Retrieved July 27, 2020, from https://www.sciencedirect.com/science/article/pii/S0360131509003285.
Conole, G., Laat, M., Dillon, T., & Darby, J. (2007,
November 05). 'Disruptive technologies', 'pedagogical innovation': What's new? Findings from an in-depth study of students' use and perception of technology. Retrieved July 28, 2020, from https://www.sciencedirect.com/science/arti
cle/pii/S036013150700111X?casa_token=1Ebb8mOwaNsAAAAA%3ACv2M6NlIMZ63nRogFG5QGbmy7Xj91easTU6t5iN1RCPKkdbDU2q9vwuQKmVzqL-Q09nhjni0QA.

Information Systems Education Journal (ISEDJ) 19 (4) ISSN: 1545-679X August 2021
©2021 ISCAP (Information Systems and Computing Academic Professionals) Page 32
https://isedj.org/; https://iscap.info
Davies, J., and Graff, M. (2005). Performance in
e-learning: online participation and student grades. British Journal of Educational Technology 36, 657–663. doi:
10.1111/j.1467-8535.2005.00542.x
Diep, A. N., Zhu, C., Cocquyt, C., De Greef, M., & Vanwing, T. (2019). Adult Learners’ Social Connectedness and Online Participation: The Importance of Online Interaction Quality. Studies in Continuing Education, 41(3), 326–346.
Evans, C., Gibbons, N. J., Shah, K., and Griffin, D. K. (2004). Virtual learning in the biological sciences: pitfalls of simply “putting notes on the web.” Computers & Education, 43(1-2), 49–61. doi:
10.1016/j.compedu.2003.12.004
Gallien, T., & Oomen-Early, J. (2008). Personalized Versus Collective Instructor Feedback in the Online Course room: Does Type of Feedback Affect Student Satisfaction, Academic Performance and Perceived Connectedness With the Instructor?. International Journal on E-
Learning, 7(3), 463-476.
Hobbs, D. (2002). Constructivist approach to web course design: a review of the literature. International Journal on E-Learning, 1(2), 60–65. Available online at: http://www.editlib.org/p/10821
Holley, D., and Oliver, M. (2010). Student
engagement and blended learning: portraits of risk. Computers & Education, 54(3), 693–700.
Magalhães, P., Ferreira, D., Cunha, J., & Rosário, P. (2020). Online vs traditional homework: A systematic review on the benefits to
students’ performance. Computers & Education, 152.
Nenagh eKemp, & Rachel eGrieve. (2014). Face-to-face or Face-to-screen? Undergraduates’
opinions and test performance in classroom
versus online learning. Frontiers in Psychology, 5.
Otter, R. R., Seipel, S., Graeff, T., Alexander, B.,
Boraiko, C., Gray, J., Sadler, K., et al. (2013). Comparing student and faculty perceptions of online and traditional courses. Internet High. Educ. 19, 27–35.
Phillips, J. A. (2015). Replacing traditional live lectures with online learning modules: Effects on learning and student perceptions.
Currents in Pharmacy Teaching and Learning, 7(6), 738–744.
Ramsden, P. (1992). Learning to Teach in Higher Education. London: Routledge.
Robinson, C. C., and Hullinger, H. (2008). New benchmarks in higher education: Student
engagement in online learning. Journal of Education for Business, 84(2), 101–109. doi: 10.3200/JOEB.84.2.101-109
Social Connection Definition: What Is Social Connection. (2020). Retrieved July 25, 2020, from https://greatergood.berkeley.edu/topic/soci
al_connection/definition.
Siti Nur, D. M., Husnin, H., & Tuan Mastura, T. S. (2020). Teaching presence in online gamified education for sustainability learning. Sustainability, 12(9), 3801.
doi:http://dx.doi.org.ezproxy.siena.edu:2048/10.3390/su12093801
Upton, D. (2006). Online learning in speech and language therapy: student performance and attitudes. Education for Health, 19(1), 22–31. doi: 10.1080/13576280500534735
Warschauer, M. (1997). Computer-mediated collaborative learning: theory and practice.
The Modern Language Journal, 81(4), 470–481. doi: 10.2307/328890

Information Systems Education Journal (ISEDJ) 19 (4) ISSN: 1545-679X August 2021
©2021 ISCAP (Information Systems and Computing Academic Professionals) Page 33
https://isedj.org/; https://iscap.info
Appendices and Annexures Appendix A: Survey (Abbreviated Version)
Connection and Engagement after switching to virtual learning
We’re inviting you to take a completely voluntary survey for research. There are no negative consequences if you don’t want to take it. If you start the survey, you can always change your mind and stop at any time. This survey is completely anonymous, no personal information will be recorded. The information collected from this survey may be important to help your professors create a better
class structure in the Fall 2020 semester. This survey should take 5-10 minutes to complete. Thank you very much!
Were you a student of (the undergraduate, liberal arts college) during the Spring 2020 semester? (Yes
or No)
Skip To: End of Survey If Were you a student of Siena College during the Spring 2020 semester? = No
Please select your major at the end of the Spring 2020 semester (hold CTRL while clicking to select more than one option) (DROP DOWN MENU OF ALL MAJORS OFFERED)
Display This Question:
If Please select your major at the end of the Spring 2020 semester (hold CTRL while clicking to sele... = Other
Please type in your major
Please select your minor at the end of Spring 2020 semester (select all that apply).
(DROP DOWN MENU OF ALL MINORS OFFERED)
Display This Question:
If Please select your minor at the end of Spring 2020 semester (select all that apply). = Other
Please type in your minor
To which gender identity do you most identify? (Female, Male, Transgender Female, Transgender Male, Gender Variant/Non-Conforming, Not listed, Prefer Not to Answer)
Display This Question:
If To which gender identity do you most identify? = Not listed (type response in next question)
To which gender identity do you most identify?
What was your class year during Spring 2020? (Freshman, Sophomore, Junior, Senior, Graduate Program)
What was your age at the end of the Spring 2020 semester? (please input in decimal numeric form)
An asynchronous online class consists of a students that meet at the same place (i.e. Canvas) at different times.
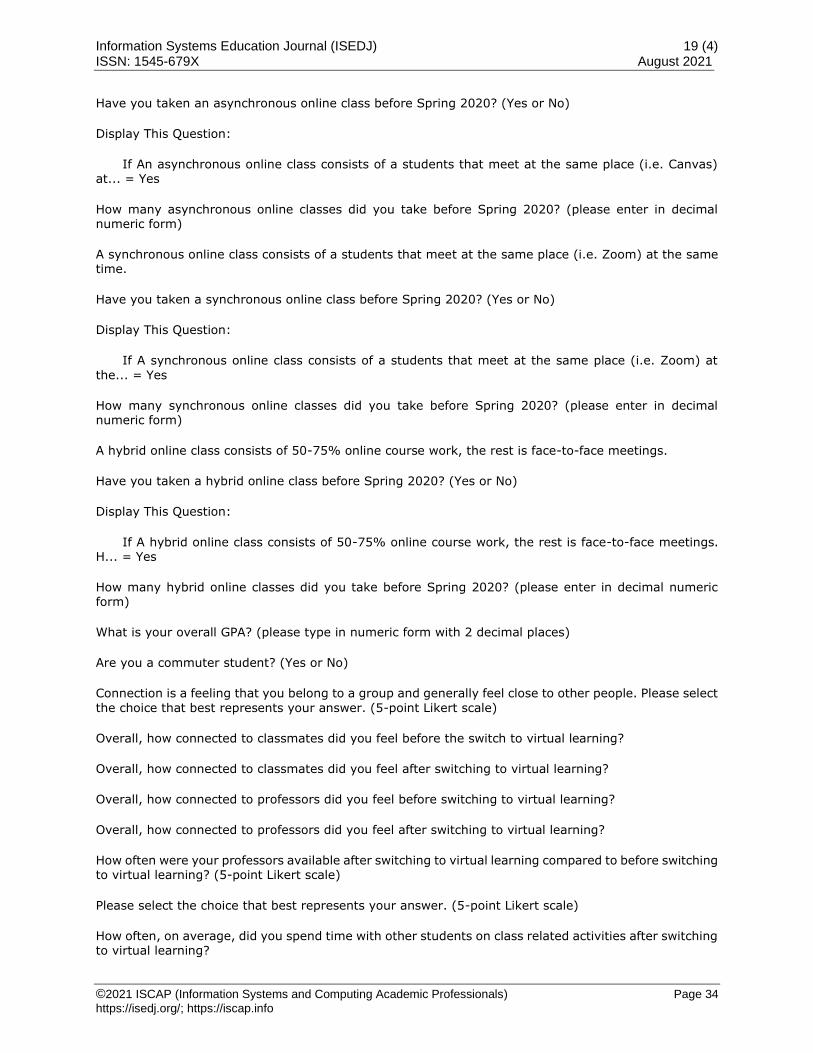
Information Systems Education Journal (ISEDJ) 19 (4) ISSN: 1545-679X August 2021
©2021 ISCAP (Information Systems and Computing Academic Professionals) Page 34
https://isedj.org/; https://iscap.info
Have you taken an asynchronous online class before Spring 2020? (Yes or No)
Display This Question:
If An asynchronous online class consists of a students that meet at the same place (i.e. Canvas) at... = Yes
How many asynchronous online classes did you take before Spring 2020? (please enter in decimal numeric form)
A synchronous online class consists of a students that meet at the same place (i.e. Zoom) at the same time.
Have you taken a synchronous online class before Spring 2020? (Yes or No)
Display This Question:
If A synchronous online class consists of a students that meet at the same place (i.e. Zoom) at
the... = Yes
How many synchronous online classes did you take before Spring 2020? (please enter in decimal numeric form)
A hybrid online class consists of 50-75% online course work, the rest is face-to-face meetings.
Have you taken a hybrid online class before Spring 2020? (Yes or No)
Display This Question:
If A hybrid online class consists of 50-75% online course work, the rest is face-to-face meetings. H... = Yes
How many hybrid online classes did you take before Spring 2020? (please enter in decimal numeric form)
What is your overall GPA? (please type in numeric form with 2 decimal places)
Are you a commuter student? (Yes or No)
Connection is a feeling that you belong to a group and generally feel close to other people. Please select
the choice that best represents your answer. (5-point Likert scale)
Overall, how connected to classmates did you feel before the switch to virtual learning?
Overall, how connected to classmates did you feel after switching to virtual learning?
Overall, how connected to professors did you feel before switching to virtual learning?
Overall, how connected to professors did you feel after switching to virtual learning?
How often were your professors available after switching to virtual learning compared to before switching to virtual learning? (5-point Likert scale)
Please select the choice that best represents your answer. (5-point Likert scale)
How often, on average, did you spend time with other students on class related activities after switching to virtual learning?

Information Systems Education Journal (ISEDJ) 19 (4) ISSN: 1545-679X August 2021
©2021 ISCAP (Information Systems and Computing Academic Professionals) Page 35
https://isedj.org/; https://iscap.info
How often, on average, did you spend time with other students on non-class related activities after
switching to virtual learning?
How many Siena events (i.e. club meetings, SEB events, Siena Fest, etc.) did you participate in after the switch to virtual learning? (0, 1-2, 3-4, 5+)
Were there any tools or activities that helped you feel connected to your classmates after the switch to virtual learning?
Please explain. (Short answer)
Were there any tools or activities that helped you feel connected with your Professors?
Please explain. (Short answer)
Was there any time that you felt particularly connected to other students or your professors?
If so, please describe the experience. (Short answer)
How often did you use your webcam during class time after the switch to virtual learning? (always, most of the time, about half the time, sometimes, never)
How often did you use your microphone during class time after the switch to virtual learning? (always, most of the time, about half the time, sometimes, never)
How often did you have access to tools you needed for your online classes after the switch to virtual learning? (always, most of the time, about half the time, sometimes, never)
What was your GPA for the Spring 2020 semester?
Please select the choice that best represents your answer. (5-point Likert scale)
How much effort did you put into taking classes before the switch to virtual learning?
How much effort did you put into taking classes after switching to virtual learning?
How much motivation did you feel to attempt and complete course work before the switch to virtual learning?
How much motivation did you feel to attempt and complete course work after switching to virtual
learning?
Please select the choice that best represents your answer. (5-point Likert scale)
How much did you participate in class during class time before the switch to virtual learning?
How much did you participate in class during class time after the switch to virtual learning?
How many of your classes did you attend before the switch to virtual learning?
How many of your classes did you attend after the switch to virtual learning?
Please select the choice that best represents your answer. (5-point Likert scale)
How much time did you devote to your assignments per week before switching to virtual learning?

Information Systems Education Journal (ISEDJ) 19 (4) ISSN: 1545-679X August 2021
©2021 ISCAP (Information Systems and Computing Academic Professionals) Page 36
https://isedj.org/; https://iscap.info
How much time did you devote to your assignments per week after switching to virtual learning?
How much time did you spend procrastinating per week before switching to virtual learning?
How much time did you spend procrastinating after per week switching to virtual learning?
Which online learning tools did you enjoy using the most after switching to virtual learning?
Please explain. (Short answer)
Did you notice any differences between your online and classroom learning experience? (Yes or No)
Display This Question:
If Did you notice any differences between your online and classroom learning experience? = Yes
Please explain the differences that you noticed. (Short answer)
Were there times when you felt motivated to do your best work? (Yes or No)
Display This Question:
If Were there times when you felt motivated to do your best work? = Yes
Please describe the situation and what you found most motivating. (Short answer)
If there is anything else you would like to add about your experience after the switch to virtual learning, please select yes. (Yes or No)
Display This Question:
If there is anything else you would like to add about your experience after the switch to virtual... =
Yes
Please tell us about your experience. (Short answer)

Information Systems Education Journal (ISEDJ) 19 (4) ISSN: 1545-679X August 2021
©2021 ISCAP (Information Systems and Computing Academic Professionals) Page 37
https://isedj.org/; https://iscap.info
Python Programming in an
IS Curriculum: Perceived Relevance and Outcomes
Jennifer Xu
Mark Frydenberg
Computer Information Systems Department
Bentley University
Waltham, MA 02452
Abstract Recent years have witnessed a growing demand for business analytics-oriented curricula. This paper presents the implementation of an introductory Python course at a business university and the attempt to elevate the course’s relevance by introducing data analytics topics. The results from a survey of 64
undergraduate students of the course are analyzed to understand their perceived relevance of having Python programming skills upon entering the workplace, and how course design and other student characteristics influenced the perceptions of their learning and performance. Results demonstrate that
business students are highly motivated to take Python programming courses to better position themselves for future career opportunities in the growing field of data analytics. We also found that students with no prior programming experience performed better than students who had some prior programming experience, suggesting that Python is an appropriate choice for a first programming
language in the Information Systems (IS) curriculum. The paper concludes with recommendations for offering an analytics-focused first programming course to bring added relevance to IS students learning programming skills. Keywords: Python programming, business analytics, IS curriculum, relevance of IS
1. INTRODUCTION
Information Systems (IS) programs have continually incorporated contemporary concepts and technologies to prepare students for the
complex business and technology environment
(Bell, Mills, & Fadel, 2013; Topi, Valacich, Wright, Kaiser, Numamaker Jr. & Sipior, 2010). The advent of the big data era in recent years has spawned an increasing demand for business analytics skills and talents. To remain relevant and successful in this fast-growing market, many IS programs have adjusted their curricula to
include more business analytics focused courses (Clayton & Clopton, 2019; Hilgers, Stanley, Elrod, & Flachsbart, 2015; Holoman, 2018; Sidorova,
2013; Wymbs, 2016). A common trend has been the shift from Java programming courses to Python programming courses. Because of its simplicity, flexibility, and availability of many libraries for data analysis, Python has become a
widely used language for business analytics,
marketing analytics, finance analytics, and many other application domains requiring data analytics. Python is ranked the world’s most popular coding language by IEEE (Cass, 2018) and was named the “Language of the Year” of 2018 by the Application Development Trends Magazine (Ramel, 2019).

Information Systems Education Journal (ISEDJ) 19 (4) ISSN: 1545-679X August 2021
©2021 ISCAP (Information Systems and Computing Academic Professionals) Page 38
https://isedj.org/; https://iscap.info
Although Python's popularity has been well
known, it remains unclear how IS and business students perceive the importance of Python programming skills to their future careers and
what factors influence their learning outcomes in Python courses. This paper is motivated by the IS discipline’s dedication to maintaining relevance (Agarwal & Lucas, 2005; Baskerville & Myers, 2002; Benbasat & Zmud, 2003; Robey, 1996) and, more specifically, by the surging demand for including Python programming into the curricula
of business schools or IS programs specializing in business analytics. We intend to address two research questions:
• RQ1: How do IS and business students perceive the relevance of Python programming to their
future career?
• RQ2: What factors impact the students’ perceptions of learning outcomes and their actual performance?
To address these research questions, we conducted a survey study and collected responses from 64 undergraduate students who took an introductory Python programming course at a
business school of a northeastern U.S. university. We expect that students’ positive perceptions of the relevance and learning outcomes may encourage enrollment in programming and other IS courses and help promote IS programs.
2. LITERATURE REVIEW
Business Analytics in IS Curriculum To maintain relevance to the ever changing, increasingly complex technological and business environment, the Association for Information Systems (AIS) has developed a series of model curricula for graduate and undergraduate IS
programs (Gorgone, Davis, Valacich, Topi, Feinstein & Longenecker Jr., 2002; Topi, Helfert, Ramesh & Wigand, 2011; Topi et al., 2010). However, because of various constraints, adhering to a standard model curriculum (Bell et al., 2013) is often difficult for all IS programs, and a more specialized curriculum may help IS
programs seize market opportunities, maintain relevance, and address various challenges such as declining enrollment (Sidorova, 2013). The emergence of data science and data analytics has brought about increased interest in introducing coding to non-computer science
majors (Holoman, 2018; Silveyra, 2019; Wilder & Ozgur, 2015). Many IS programs have already implemented business analytics-oriented
curricula in order to keep IS education relevant in
a data-centric business environment. Among the business analytics skills recommended by prior studies (Gupta, Goul, & Dinter 2015; Hilgers et
al., 2015; Wymbs, 2016), programming has repeatedly been identified as an essential skill. Although application development was removed from the core of IS 2010 model curriculum (Topi et al., 2010), over 80 percent of the IS programs surveyed still kept programming courses in their curriculum core (Bell et al., 2013). This reflects
the belief of many IS educators that programming remains an important topic and that, although software development may no longer be a typical career choice for IS graduates, programming is a very useful skill for future business professionals.
Learning and Teaching Programming Our RQ2 concerns learning outcomes. A large body of research that investigates the psychological and cognitive processes of learning to program and their impacts on learning outcomes (e.g., teaching effectiveness and individual performance) can be found in the
literature of computer science (CS) education. The main finding in the literature is that learning outcomes can be affected by various factors including learners’ cognitive development levels, learning styles, motivations, background, prior experience, and learning context and environment (Lau & Yuen, 2009; Robins,
Rountree & Rountree, 2003; Shaw, 2012; Tie & Umar, 2010; White & Sivitanides, 2002). Roughly
speaking, these factors can be grouped into three categories: individual characteristics, language characteristics, and context characteristics.
Individual Characteristics
Prior research has long studied the impact of individual characteristics on the outcomes of learning to program. One of the important characteristics is an individual’s cognitive development level (Mayer, Dyck & Vilberg 1989). The cognitive development theory (Piaget, 1972) identifies three age-related development levels:
pre-operational (2 – 7 years), concrete (7 – 12 years), and operational (12 years and above). The operational level requires abilities to abstract,
form hypothesis, and solve complex problems (Biehler & Snowman, 1986). White and Sivitanides (2002) posited that an individual’s cognitive development level predicts her
programming performance and that different languages require different cognitive levels. For example, scripting and markup languages (e.g., HTML) require lower levels than object-oriented languages (e.g., Java and C++). Studies have found that an individual’s learning style can also
affect her performance in learning to program

Information Systems Education Journal (ISEDJ) 19 (4) ISSN: 1545-679X August 2021
©2021 ISCAP (Information Systems and Computing Academic Professionals) Page 39
https://isedj.org/; https://iscap.info
(Lau & Yuen, 2009; Shaw, 2012; Tie & Umar,
2010). Perkins, Hancock, Hobbs, Martin & Simmons (1989) identified two types of learners, stoppers and movers, differentiated by their
attitudes and behaviors when encountering a problem or a lack of direction to proceed. Stoppers often have a negative emotional reaction to errors and problems and cease to try; while movers continue to try, search, experiment, and revise. Research has also investigated the impacts of many other individual characteristics.
For example, individuals with strong motivations often commit themselves to performing well and to acquiring the skill (Pendergast, 2006). Additionally, several studies have focused on the gender effect because of the dominance of male programmers in the information technology
sector (Lau & Yuen, 2009; Underwood, G., McCaffrey, M., & Underwood 1990; Yau & Cheng, 2012) and reported mixed findings.
Although CS education research has accumulated a significant body of knowledge about learning and teaching programming, only a limited number of studies in the IS literature
(Pendergast, 2006; Roussev, 2003; Urbaczewski & Wheeler, 2001; Zhang, Zhang, Stafford, & Zhang, 2013). can be found to focus on teaching business students how to program. Business students are different from CS students in many aspects (e.g., motivations, background, and perceptions of relevance). For this research
question (RQ2), we propose our first hypothesis
as
H1: A student’s individual characteristics have a significant impact on the student’s perceived learning outcomes and actual performance.
The literature has also shown that prior
programming experience affects students' perceived learning and outcomes. (Bergin & Reilly, 2005; Bowman, Jarratt, Culver, and Segre, 2019). Students' perception of understanding a topic has the strongest correlation with their programming performance, and their own experience is related to how well they understood
the concepts and their level of confidence their
own work. Given this research, we propose our second hypothesis as
H2: A student’s prior experience of programming has a significant impact on the student’s perceived learning outcomes and actual performance.
Language Characteristics
In the history of programming languages, several types with different language characteristics have emerged, ranging from procedural (e.g., COBOL
and C), OO (object-oriented, e.g., Java and C++), scripting (e.g., JavaScript), to visual (e.g., Visual Basic). Since the 1990s, Java has been a dominant language for teaching introductory programming (Shein, 2015). As a scripting language, Python is advantageous for its simplicity in syntax and flexibility in data
structures, and has become more popular in recent years in introductory programming courses (Shein, 2015). Based on these findings, we posit in this research that
H3: A student’s perceptions of the language
characteristics of Python have a significant impact
on the student’s perceived learning outcomes and actual performance.
Context Characteristics Learning context is a multi-faceted construct and may vary in terms of type (e.g., orienting context, instructional context, and transfer context) and level (learner, immediate environment, and
organizational) (Tessmer & Richey, 1997). An individual’s perception of the learning context may have a profound impact on his/her learning experience (Ramsden, 2005). The course design (e.g., lectures and topics) and study process can affect students’ understanding of the concepts
and performance in a Java programming course
(Govender, 2009). Similarly, different teaching approaches (lecture + exercise vs. lecture-only) have been found to result in different student performance in an introductory C programming course in an IS program (Zhang et al., 2013). The literature has also reported the impacts of other
contextual factors. This research focuses on the impact of course design in terms of topics and homework assignments. We hypothesize that
H4: A student’s perception of the course design has a significant impact on the student’s perceived learning outcomes and actual performance.
3. COURSE DESIGN The introductory Python programming course is an elective for undergraduate CIS (Computer Information Systems) majors and minors at a northeastern U.S. business university. Undergraduate CIS majors are required to take a
semester course in Java programming (Java I) and can choose to take an advanced Java programming course (Java II) as an elective.

Information Systems Education Journal (ISEDJ) 19 (4) ISSN: 1545-679X August 2021
©2021 ISCAP (Information Systems and Computing Academic Professionals) Page 40
https://isedj.org/; https://iscap.info
Undergraduate CIS minors take a course in HTML
and JavaScript, and may take Python to further their study of programming. This Python course has no prerequisites other than an introductory IT
course required of all first-year students, and recently has become a prerequisite for the Introduction to Data Science course offered through the Mathematics department.
This course met for two 80-minute sessions each week in a 14-week semester. Each class session included instructor-led lectures or
demonstrations, and often short, in-class exercises that reinforced the topics presented. One instructor taught two sections; the other taught one section. All sections used the same syllabus and shared common assignments and
exams.
The evaluation of student performance consisted of seven programming assignments (40% of the grade), lab participation (5%), midterm exam (25%), and final exam (30%). Table 1 in Appendix 2 presents the topics covered and the seven homework assignments. Table 2 in Appendix 2 shows the grade distribution across
three sections of the course. The average grade was 2.7/4.0.
This course presents basic programming concepts and techniques using Python 3, including loops and selection statements; data structures (e.g.,
lists and dictionaries); classes, and objects. Instructors omitted advanced topics such as
higher order functions (e.g., map, reduce, filter, lambda), and other topics frequently taught in Java programming courses (e.g., graphics and user interface design), teaching instead, basic capabilities of several popular Python libraries for data analysis: NumPy, Matplotlib, and Pandas.
Including data analytics topics in an introductory Python programming course is a relatively new phenomenon, as evidenced by the lack of introductory textbooks from major publishers containing this content. Table 3 in Appendix 2 lists popular introductory Python textbooks from major publishers. These texts have a computer
science focus and include advanced programming topics such as recursion, inheritance and polymorphism. Case studies or coding examples on graphical user interfaces, graphics processing, operating systems, or client server programming are less relevant to information systems students learning Python because of their interest in data
science or data analytics. On the other hand, reference textbooks teaching data science topics generally assume prior programming experience.
In addition to a standard Python textbook, we
used online documentation for reference when teaching data analytics topics, and had students interact with examples and materials in the same
way that professional developers might use these resources. This approach ensures the analytics examples use current versions of those modules and minimizes the burden on instructors to create a plethora of new materials. A homework assignment had students use functions from the three analytics libraries to perform simple text
analysis of a sample of tweets.
4. RESEARCH METHODS Survey Methodology To answer our research questions, we used the
survey methodology to collect data from the three
sections of this course. A pre-course survey was administered in the first week of the semester and a post-course survey in the last week before the final exam. The pre-course questionnaire consists of questions about the student demographics, background, prior programming experience, and motivations to take the course.
The post-course survey includes questions about students’ attitudes and opinions about the course design (topics and homework assignments), their learning styles, and perceived outcomes of this course.
Assignments and exams were standardized
across all instructors and sections. The 70
students who enrolled in the three sections were invited to take the pre- and post-course surveys. Both surveys were administered online where students’ emails were captured by the survey website (Qualtrics) through individualized invitation links sent to students’ email accounts.
However, students were assured that their responses would not be accessed before their grades were posted to remove the social desirability bias (Campbell & Standley, 1963).
Among these students, 36 out of 70 (51.4%) are male and 34 (48.5%) are female. The mean age is 20.8 years. The majority of the students are
seniors (n = 39, 55.7%) or juniors (n = 26,
37.1%) and only 6 (8.6%) students are sophomores and one student is a freshman. The large number of seniors is attributed to seniors having priority to register for the class first. Students majored in different business disciplines including CIS (n = 27, 38.6%), Finance (n = 15,
21.4%), Actuarial Science (n = 9, 12.9%), and other business majors such as Accounting, Marketing, Management, etc. (n = 17, 24.3%). Two students had not declared their majors by

Information Systems Education Journal (ISEDJ) 19 (4) ISSN: 1545-679X August 2021
©2021 ISCAP (Information Systems and Computing Academic Professionals) Page 41
https://isedj.org/; https://iscap.info
the time of the pre-course survey. Fifty-six
students (80%) indicated that they had prior experience of at least one programming language, including Scratch, VB, JavaScript, Java,
C++, or C#. The numbers of students who had taken Java I and Java II are 37 (52.9%) and 11 (15.7%), respectively. In addition, 28 students (40%) had taken a web development course using HTML and JavaScript.
Six of the returned responses were incomplete with missing answers to some important
questions and therefore removed from the study. The resulting sample consisted of 64 valid responses.
Variables and Measures
Independent variables used in this study are grouped into three categories: individual
characteristics, language characteristics, and course design (context) characteristics. Tables 1 and 2 in Appendix 1 list the variables and corresponding items in the pre- and post- survey questionnaires.
Individual characteristic variables include gender, year, number of motivations (#motivs), number
of prior programming languages (#prior_langs), and three dummy variables representing whether a student had taken Java I (Java_1), Java II (Java_2), and the Web Development (HTML) courses, respectively. As students grow and
become more mature over their four years of college, we use a student’s age and year (i.e.,
freshman, sophomore, junior, and senior) to approximately represent his/her cognitive development level. The number of motivations is captured by a pre-course survey item asking students their motivation to take the course with four non-exclusive options: “to increase my
career opportunities”, “I’m interested in the topic”, “I will use Python in my own business in the future,” and other (specify). The pre-course survey also asks students to check any programming languages they had learned previously (e.g., Scratch, VB, JavaScript, Java, etc.).
To assess individual learning style, a survey item asks students, when encountering a problem or an error, how frequently (sum to 100%) they would (a) ask the instructor for help, (b) visit the CIS learning center, (c) ask other classmates, (d) solve by themselves, or (e) search online. The total from (a)-(c) is calculated as an indicator
(style_stopper) for the extent to which a student is a “stopper” (Perkins et al., 1989).
The language characteristic group includes two
variables measured by two 5-point Likert scale questions in the post-course survey: perceived difficulty of Python syntax (syntax) and the
perceived difficulty of programming logic (logic).
The independent variables in the context group regarding the course design are perceived usefulness of the topics (topics_useful), perceived relevance of the topics (topics_relevant), perceived helpfulness of the homework assignments (hw_helpful), and
perceived difficulty of homework (hw_difficult). The averages of the scores for the topics and homework assignments by each student are used for the values of these variables.
The control variables include age, section, major, perceived overall difficulty of the course
(course_difficult), and student self-reported average number of hours spent on this course in each week (hours_spent). Also used as a control variable, Python_relevant, is a student’s perceptions of the overall relevance of Python measured by a group of six 5-point Likert scale questions (ranging from strongly disagree to
strongly agree) in the post-course survey. The average of the six scores by each student is used for the value of this variable.
The two dependent variables are a student’s perceived outcomes (outcomes) and the actual
performance (grade). The perceived outcomes are captured in the post-course survey using a set
of four 5-point Likert scale questions and measured using the average of the four scores (see Appendix). The student grade is a value between 0 and 100.
The post-semester survey also included open-ended questions on the delivery of this course and
suggestions for future semesters.
4. ANALYSIS AND RESULTS
Perceived Relevance To address the first research question (RQ1) about the perceived relevance of the Python
programming course, we performed descriptive analysis of the responses from the surveys. The
post-survey items regarding the overall relevance (Python_relevant) and the relevance of specific topics (topics_relevant) were used to assess students’ perceptions (see Table 4 in Appendix 2). The scores range from 1 (strongly disagree) to 5 (strongly agree). The first data column in Table 4 presents the means (and standard deviations) of
these variables for all students.

Information Systems Education Journal (ISEDJ) 19 (4) ISSN: 1545-679X August 2021
©2021 ISCAP (Information Systems and Computing Academic Professionals) Page 42
https://isedj.org/; https://iscap.info
Figure 1(a) in Appendix 3 displays the average
perceived overall relevance of Python programming skills broken down to six aspects; and Figure 1(b) shows the average perceived
relevance of the individual topics. This suggests that business students generally agree that Python programming skills are very relevant to their future career and valued by employers. Students also tended to believe that programming concepts (e.g., data types and control structures) are very important.
We further investigated the difference in perceptions of relevance among different majors (CIS, Finance, Actuarial Science, and other business majors). The second through the last data columns in Appendix 2, Table 4 reports the
means (and standard deviations) of different
majors in terms of their perceptions of overall relevance and topic relevance. This suggests IS majors are most likely to appreciate Python programming skills as relevant to their future careers, followed by Finance and other business majors. Similarly, IS majors valued the topics most, followed by the Actuarial Science, Finance,
and other business majors. As many as 80% of the students selected “to increase my career opportunities”, as their motivation for taking the course, while 42.9% selected “I’m interested in the topic”, 38.6% checked “I will use Python in my own business in
the future,” and 10% listed other motivations
such as “My internship requires me to learn programming” (see Appendix 3, Figure 2). These responses show strong motivations among business majors to take Python programming courses to enhance their career prospects.
Factors Affecting Learning Outcomes and Performance Students’ perceptions of learning outcomes are largely positive, with mean scores ranging between 4 (agree) to 5 (strongly agree). Appendix 3, Figure 3 displays students’ self-
assessment about how much they had learned and how they would benefit from this course.
To investigate the impact of various factors on perceived learning outcomes and student’s actual performance (RQ2), we performed linear regression analysis and tested the hypotheses.
The independent variables include eight variables for individual characteristics, two for language characteristics, four for course design, and six control variables. Table 5 in Appendix 2 reports the standardized coefficients and R2s from the linear regression analyses using grade and
perceived outcomes as the dependent variables.
After controlling for effects of age, section, major,
time spent, and perceptions of overall difficulty and relevance, three out of the eight individual characteristics have significant impact on the
actual performance of students: gender, number of motivations, and learning styles. Specifically, female students performed significantly better than male students, contradicting to gender stereotypes. However, the number of motivations was negatively associated with grade. This could be because that this variable measured only the
number of motivations rather than the strength of the motivations. Unsurprisingly, learning styles mattered and stoppers who ceased to try and tackle problems by themselves tended to perform worse than the movers. The cognitive development level (approximated by year)
showed no impact on student performance. We note that none of the individual characteristics affected the perceived learning outcomes of the students. As a result, H1 is partially supported.
Students’ prior programming language experience has no impact on the actual performance and the perceived outcomes.
Specifically, the number of prior languages (#prior_langs) and the experience of OO programming (Java_1 and Java_2) did not seem to help students achieve higher grade in Python programming. This confirms findings from other prior studies on the poor transferability of OO knowledge to other languages (Robins et al.,
2003; Urbaczewski & Wheeler, 2001). In
addition, students did not benefit significantly from their prior experience of web development using HTML. Therefore, H2 is not supported.
For language characteristics, the harder a student perceived Python’s programming logic, the worse
the student performed in the course and more negative the student perceived the learning outcomes. However, the perception of the Python syntax had no impact on the two dependent variables. Consequently, H3 is partially supported.
Regarding course design, students’ perceptions of
the usefulness and relevance of topics had no
impact on their grades but were positively associated with their perceptions of the learning outcomes. That is, if students perceived the topics covered to be useful and relevant, they tended to believe that they had learned new knowledge and skills. The perceived difficulty
level of homework assignments was negatively associated with grade, but not associated with perceived learning outcomes significantly. Naturally, students who struggled on homework

Information Systems Education Journal (ISEDJ) 19 (4) ISSN: 1545-679X August 2021
©2021 ISCAP (Information Systems and Computing Academic Professionals) Page 43
https://isedj.org/; https://iscap.info
assignments had difficulty achieving success in
this programming course. To summarize, H4 is partially supported.
A rather surprising observation is that students
majoring in CIS tended to perform worse than students with other majors. One possible reason could be that 55% of the CIS students were in their senior year and were busy with internship jobs and had focused less on course work. We speculate that CIS students who had taken Java courses thought they could rely on their previous
programming knowledge to help get them through, and so they spent less time on it. For some of these students, the course may have been more difficult than they anticipated.
Another significant control variable is the time spent in each week. Although students who spent
a lot of time on the course materials and homework assignments might not have been able to achieve better grades, they tended to perceive the learning outcomes more positively.
Students’ Feedback on Data Analytics Analysis of students’ responses to the open-ended questions in the post-semester survey
shows that business students especially liked the topics on data analytics. Of the 58 students responding to the question - "which topics do you wish had additional coverage in the course?" - 30 mentioned data analytics. This student's remarks
were representative:
"The most applicable topic in the course was data
analytics. The insurance industry is very data driven, so having knowledge of Pandas will help to easily analyze data."
Many students wished the course spent more time on data analytics as expressed in this response:
"Midway through the course I looked up how to apply analytics to Python and saw the Pandas module. If we went more in depth with Pandas, I think knowing that could help me more in my job as an investment analytics associate at a media
agency."
6. DISCUSSION
Our research seeks to investigate how IS and business students perceive the relevance of an introductory programming course in Python, a widely used programming language for data analytics, and how their perceived learning outcomes and actual performance are affected by
various individual, contextual, and language
factors. Results show that business students generally perceive Python programming skills to be rather relevant. However, different majors
have varying perceptions on the relevance of specific topics. Various factors impact learning outcomes and performance.
Impact of Individual Characteristics Business students are especially career-focused. Many recognized the importance of developing coding skills and having exposure to data
analytics to increase their future employment opportunities. The demand for Python in the IS curriculum will continue to increase as programs of study expand in data analytics and related fields: fin-tech (finance/technology), auditing
analytics, business intelligence, and machine
learning. In our institution, the enrollment has increased by a factor of six since the course was first offered in 2017. The widespread use of Python as both an application development and data analytics language combined with its easy-to-learn reputation imply that students who have Python skills will continue to be in demand in the
workplace. We have found that the gender effect exists in the Python programming course. Although some studies have reported mixed results regarding performance difference between male and female students (Lau & Yuen, 2009; Underwood, et al.,
1990; Yau & Cheng, 2012), in this study, female
students performed significantly better than male students, contradicting to gender stereotypes. In fact, at least three female students who completed this course have been employed as student tutors in the university’s IS Learning
Center, where they serve as role models to assist current students and encourage future students to take the course. Our analysis also demonstrates the impact of learning style (stoppers vs. movers) on performance, but provides no support for the common belief that prior programming experience helps improve
performance. Neither prior experience of an OO language (Java) nor a scripting language (HTML) contributes to a high grade. Follow-up interviews
with some students showed that because they knew a prior programming language such as Java, they assumed it would be easier to learn a second programming language. Yet students with
little or no experience learning programming for the first time worked very hard and outperformed many of them.
This implies that Python is a good candidate to serve as an introductory programming language, requiring no prior coding experience. An

Information Systems Education Journal (ISEDJ) 19 (4) ISSN: 1545-679X August 2021
©2021 ISCAP (Information Systems and Computing Academic Professionals) Page 44
https://isedj.org/; https://iscap.info
expanding IS curriculum would benefit from
offering Python as one of several alternatives for a first programming language. Furthermore, this course may stimulate interest in IS courses and
help increase enrollment. In our study, two students who had not declared their majors at the beginning of the semester explicitly indicated in their post-semester survey that they would choose CIS as their majors; and 24 out of 37 non-CIS majors indicated that they would choose to take more CIS courses in the future.
Impact of Language Characteristics Although Python’s syntax is comparatively simple and easy to learn, some students may still find the programming logic challenging. Understanding programming logic requires the
learner to form a mental model of the working
mechanisms of computers and programming languages (Mayer et al., 1989). Therefore, we suggest that, although a Python programming course may not need any pre-requisite, instructors may consider spending some time introducing basic concepts about computers and computing (e.g., memory locations, variable
registry, and run-time machines) and general problem-solving strategies (e.g., divide and conquer, top-down and bottom-up approaches). Students who can identify patterns in data, break complex problems into discrete simpler tasks, and think critically, logically and linearly will better understand programming logic and be able
to diagnose errors.
Impact of Course Design We found that students’ perceptions of the usefulness and relevance of topics are predictors of their perceptions of the learning outcomes, while the perceived difficulty of homework
assignments is associated with their actual performance. Typical programming assignments (e.g., board games) that often are used in CS programming courses may not necessarily be perceived as relevant and useful by business majors. The Battleship assignment (#6) in our course, for example, was rated the least relevant
(average = 1.62/5) among the seven assignments. Hence, we suggest that instructors
consider using more business-oriented problems such as order processing and customer review analysis when designing programming assignments for business majors.
7. CONCLUDING REMARKS
This study has some limitations. First, the sample is relatively small with only 64 students. Although it is sufficient to conduct statistical tests, a large-
scale sample may be more representative of
opinions and perceptions of IS and business students. Second, findings are based on the analysis of the delivery of the Python course in a
single semester in one undergraduate IS program. Whether the findings can be generalized to other IS programs, which seek to incorporate Python programming courses in their curricula remains unknown.
Teaching Python to IS students necessitates a business focus on the course topics,
demonstrations, and homework assignments. Students with prior programming experience may have some advantage over those new to coding, when learning the syntax for sequence, selection, and repetition coding elements in Python.
Intermediate topics such as lists, dictionaries and
objects proved to be the most difficult topics to learn conceptually. Moreover, although data analytics topics are not included in most introductory Python textbooks, results show that including them added relevance and appeal to a varied business student population enrolled in the course.
Students were keenly aware of the applications of Python to data analytics and preferred data-related examples throughout the course. We now propose, and the course has evolved to teaching introductory programming concepts using a business perspective, introducing Pandas and
other analytics modules earlier as soon as
students have the skills to interact with these tools. This enables instructors to create new assignments that integrate programming concepts (loops, decisions, data structures, files) with analytics elements (charts, statistics functions, structured data) to create simple
business applications. Examples include computing currency conversion, calculating loan payments, graphing stock prices, analyzing Twitter data, and creating a store-finder by filtering a large data set to find local stores and plot them on a map.
The continued success of the introductory Python
course may generate interest in offering a second
Python course, which covers more advanced topics necessary for data analytics, including web scraping, creating dashboards, and using additional libraries for machine learning and data mining.
REFERENCES Agarwal, R., & Lucas, H. C. (2005). The
information systems identity crisis: Focusing

Information Systems Education Journal (ISEDJ) 19 (4) ISSN: 1545-679X August 2021
©2021 ISCAP (Information Systems and Computing Academic Professionals) Page 45
https://isedj.org/; https://iscap.info
on high-visibility and high impact research.
MIS Quarterly, 29(3), 381-398.
Alshare, K. A., & Lane, P. L. (2011). Predicting student-perceived learning outcomesand
satisfaction in ERP courses: An empirical investigation. Communications of the Association for Information Systems, 28, 571-584.
Baskerville, R. L., & Myers, M. D. (2002). Information systems as a reference discipline. MIS Quarterly, 26(1), 1-14.
Bell, C. C., Mills, R. J., & Fadel, K. J. (2013). An analysis of undergraduate information systems curricula: Adoption of the IS 2010
curriculum guidelines. Communications of the Association for Information Systems, 32(2), 73-94.
Benbasat, I., & Zmud, R. W. (2003). The identity crisis within the IS discipline: Defining and communicating the discipline's core properties. MIS Quarterly, 27(2), 183-194.
Bergin, S., & Reilly, R. (2005). Programming: factors that influence success. In Proceedings of the 36th SIGCSE technical
symposium on Computer science education (pp. 411-415).
Biehler, R. F., & Snowman, J. (1986). Psychology Applied to Teaching. Boston, MA: Houghton Miffin Company.
Bowman, N. A., Jarratt, L., Culver, K. C., & Segre, A. M. (2019). How Prior Programming
Experience Affects Students' Pair Programming Experiences and Outcomes. In Proceedings of the 2019 ACM Conference on Innovation and Technology in Computer Science Education (pp. 170-175).
Campbell, D. T., & Standley, J. C. (1963).
Experimental and Quasi-Experimental Designs for Research. Boston, MA: Houghton Mifflin Company.
Cass, S. (2018). The 2018 top programming languages. IEEE Spectrum. Retrieved July 1, 2020 from https://spectrum.ieee.org/at-work/innovation/the-2018-top-
programming-languages.
Clayton, P. R., & Clopton, J. (2019). Business curriculum redesign: Integrating data
analytics. Journal of Education for Business,
94, 57-63.
Detienne, F. (1990). Expert programming knowledge: A schema based approach. In J.
M. Hoc, T. R. G. Green, R. Samurcay & D. J. Gillmore (Eds.), Psychology of Programming, (pp. 205-222). London: Academic Press.
Gorgone, J. T., Davis, G. B., Valacich, J. S., Topi, H., Feinstein, D. L., & Longenecker Jr., H. E. (2002). IS 2002 model curriculum and
guidelines for undergraduate degree programs in information systems. The DATA BASE for Advances in Information Systems, 34(1), 1-53.
Govender, I. (2009). The learning context: Influence on learning to program.
Computers & Education, 53(4), 1218-1230.
Gupta, B., Goul, M., & Dinter, B. (2015). Business intelligence and big data in higher education: Status of a multi-year model curriculum development effort for business school undergraduates, MS graduates, and MBAs. Communications of the Association for
Information Systems, 36, 449-476.
Hilgers, M. G., Stanley, S. M., Elrod, C. C., & Flachsbart, B. B. (2015). Big data and
business analytics in a blended computing-business department. Issues in Information Systems, 16(1), 200-209.
Holoman, J. (2018). Teaching Statistical
Computing with Python in a Second Semester Undergraduate Business Statistics Course. Business Education Innovation Journal, 10, 104-110.
Horschig, S., Mattis, T., & Hirschfeld, R. (2018). Do Java Programmers Write Better Python?
Studying Off-language Code Quality on GitHub, In Conference Companion of the 2nd International Conference on Art, Science, and Engineering of Programming
(Programming'18 Companion) (pp. 126-134). New York, NY: Association for Computing Machinery.
Kolb, D. A. (1976). The Learning Style Inventory: Technical Manual. Boston, MA: McBer & Co.
Lau, W. W. F., & Yuen, A. H. K. (2009). Exploring the effects of gender and learning styles on computer programming performance:
Information Systems Education Journal (ISEDJ) 19 (4) ISSN: 1545-679X August 2021
©2021 ISCAP (Information Systems and Computing Academic Professionals) Page 46
https://isedj.org/; https://iscap.info
implications for programming pedagogy.
British Journal of Educational Technology, 40(4), 696-712.
Lau, W. W. F., & Yuen, A. H. K. (2011). Modelling
programming performance: Beyond the influence of learner characteristics. Computers & Education, 57(1), 1202-1213.
Malik, S. I., & Coldwell-Neilson, J. (2017). Impact of a new teaching and learning approach in an introductory programming course. Journal of Educational Computing Research,
55(6), 789-819.
Mayer, R. E., Dyck, J. L., & Vilberg, W. (1989). Learning to program and learning to think:
What's the connection? In E. Soloway & J. C. Spohrer (Eds.), Studying the Novice Programmer (pp. 113-124). Hillsdale, NJ:
Lawrence Erlbaum.
Offenholley, K. (2012). Gaming Your Mathematics Course: The Theory and Practice of Games for Learning. Journal of Humanistic Mathematics, 2(2), 79–92.
Pendergast, M. O. (2006). Teaching introductory programming to IS students: Java problems
and pitfalls. Journal of Information Technology Education: Research, 5(1), 491-515.
Perkins, D. N., Hancock, C., Hobbs, R., Martin, F., & Simmons, R. (1989). Conditions of learning in novice programmers. In E. Soloway & J. C. Spohrer (Eds.), Studying the
Novice Programmer (pp. 213-229). Norwood, NJ: Ablex.
Piaget, J. (1972). Intellectual evolution from adolescence to adult. Human Development, 15, 1-12.
Ramel, D. (2019). Popularity index: Python is
2018 'Language of the Year'. Retrieved July 1, 2020 from https://adtmag.com/articles/2019/01/08/ti
obe-jan-2019.aspx.
Ramsden, P. (2005). The context of learning in academic departments. In F. Marton, D. Hounsell & N. Entwistle (Eds.), The
Experience of Learning: Implications for teaching and studying in higher education (pp. 198-216). Edinburgh: University of Edinburgh.
Robey, D. (1996). Research Commentary:
Diversity in information systems research: Threat, promise, and responsiblity. Information Systems Research, 7(4), 400-
408.
Robins, A., Rountree, J., & Rountree, N. (2003). Learning and teaching programming: A review and discussion. Computer Science Education, 13(2), 137-172.
Rohmeyer, R., Espejo, P. S., Sun, L., & Frederick, C. (2017). A human factors perspective on
learning programming languages using a second language acquisition approach. Paper presented at the 2017 ASEE Zone II Conference, San Juan, Puerto Rico, March 2-
5, 2017.
Romero, P., Lutz, R., Cox, R., & du Boulay, B.
(2002). Co-ordination of multiple external representations during Java program debugging. Paper presented at the IEEE 2002 Symposia on Human Centric Computing Languages and Environments, Arlington, VA, September 3-6, 2002.
Roussev, B. (2003). Teaching introduction to
programming as part of the IS component of the business curriculum. Journal of Information Technology Education: Research, 2, 349-356.
Saltz, J., Armour, F., & Sharda, R. (2018). Data science roles and the types of data science programs. Communications of the
Association for Information Systems, 43, 615-624.
Shaw, R.-S. (2012). A study of the relationships among learning styles, participation types, and performance in programming language learning supported by online forums.
Computers & Education, 58(1), 111-120.
Shein, E. (2015). Python for beginners. Communications of the ACM, 58(3), 19-21.
Sidorova, A. (2013). Business analysis as an opportunity for IS programs in business schools. Communications of the Association for Information Systems, 33, 521-540.
Silveyra, J. (2019). Introducing Students to Computer Science and Programming Using Data Analytics. The Journal of Computing Sciences in Colleges, 34, 107-118.

Information Systems Education Journal (ISEDJ) 19 (4) ISSN: 1545-679X August 2021
©2021 ISCAP (Information Systems and Computing Academic Professionals) Page 47
https://isedj.org/; https://iscap.info
Tessmer, M., & Richey, R. C. (1997). The role of
context in learning and instructional design. Educational Technology Research and Development, 45(2), 85-115.
Tie, H. H., & Umar, I. N. (2010). The impact of learning styles and instructional methods on students' recall and retention in programming education. Paper presented at the the 18th International Conference on Computers in Education, Putrajaya, Malaysia.
Topi, H., Helfert, M., Ramesh, V., & Wigand, R. T. (2011). Future of Master's level education in information systems. Communications of the Association for Information Systems, 28,
437-449.
Topi, H., Valacich, J. S., Wright, R. T., Kaiser, K.,
Numamaker Jr., J. F., Sipior, J. C., et al. (2010). IS 2010: Curriculum guidelines for undergraduate degree programs in information systems. Communications of the Association for Information Systems, 26, 359-428.
Underwood, G., McCaffrey, M., & Underwood, J.
(1990). Gender differences in a cooperative computer‐based language task. Educational
Research, 32(1), 44-49.
Urbaczewski, A., & Wheeler, B. C. (2001). Do sequence and concurrency matter? An investigation of order and timing effects on student learning of programming languages.
Communications of the Association for Information Systems, 5, Article 2.
US News & World Report. (2018). Best Undergraduate Business Management Information Systems Programs. Retrieved
July 4, 2018 from
https://www.usnews.com/best-colleges/rankings/business-management-information-systems.
White, G. L., & Sivitanides, M. P. (2002). A theory of the relationship between cognitive requirements of computer programming languages and programmers' cognitive characteristics. Journal of Information Systems Education, 13(1), 59-66.
Wiedenbeck, S., Ramalingam, V., Sarasamma,
S., & Corritore, C. L. (1999). A comparison of the comprehension of object-oriented and procedural programs by novice programmers. Interacting with Computers,
11, 255-282.
Wilder, C. R., & Ozgur, C. O. (2015). Business
Analytics Curriculum for Undergraduate Majors. INFORMS Transactions on Education, 15, 180-187.
Wymbs, C. (2016). Managing the Innovation Process: Infusing Data Analytics into the Undergraduate Business Curriculum (Lessons Learned and Next Steps). Journal
of Information Systems Education, 27(1), 61-74.
Yau, H. K., & Cheng, A. L. F. (2012). Gender
difference of confidence in using technology for learning. Journal of Technology Studies, 38(2), 74-79.
Zhang, X., Zhang, C., Stafford, T. F., & Zhang, P.
(2013). Teaching introductory programming to IS students: The impact of teaching approaches on learning performance. Journal of Information Systems Education, 24(2), 147-155
.
Editor’s Note:
This paper was selected for inclusion in the journal as an EDSIGCON 2020 Meritorious Paper. The acceptance rate is typically 15% for this category of paper based on blind reviews from six or more peers including three or more former best papers authors who did not submit a paper in 2020.

Information Systems Education Journal (ISEDJ) 19 (4) ISSN: 1545-679X August 2021
©2021 ISCAP (Information Systems and Computing Academic Professionals) Page 48
https://isedj.org/; https://iscap.info
Appendix 1. Survey Items
Variables Items
age What is your age?
gender What is your gender?
o Male o Female
year What is your current year?
o Freshman o Sophomore o Junior o Senior
#motivs
What motivated you to take this course? I want to increase my career opportunities;
I will use Python in my future business or partnership; I am just interested in the topic; Other, please specify______________
#prior_langs
Have you used any of the following language before?
Scratch VB JavaScript
Java C++ C#
Java_1 Have you taken any of the following courses?
Java_2 Java I Java II Web
Development HTML
Table 1. Variables and items in the pre-course survey.
Variables Items
syntax How do you rate the difficulty level of Python syntax?
5-point Likert scale ranging from very difficult to very easy
logic How do you rate the difficulty level of Python programming logic?
5-point Likert scale ranging from very difficult to very easy
topics_useful
How do you rate the usefulness of these topics?
- variables and data types - loops and selections - strings and text files - lists and dictionaries - functions - classes and objects - data analytics
5-point Likert scale ranging from useless to very helpful for each topic
topics_relevant
How do you rate the relevance of these topics to your future work?
- variables and data types - loops and selections - strings and text files - lists and dictionaries - functions - classes and objects - data analytics
5-point Likert scale ranging from irrelevant to very relevant for each topic
hw_helpful
How do you rate the helpfulness of the homework assignments for you to learn programming?
- HW1: About You - HW2: Restaurant - HW3: Buzz Game - HW4: User Account Management - HW5: Donor Information Processing - HW6: Battleship Game - HW7: Twitter Analyzer
5-point Likert scale ranging from not helpful to very helpful for each assignment
hw_difficult
How to you rate the difficulty level of the homework assignments?
- HW1: About You - HW2: Restaurant - HW3: Buzz Game - HW4: User Account Management - HW5: Donor Information Processing - HW6: Battleship Game - HW7: Twitter Analyzer
5-point Likert scale ranging from very difficult to very easy for each assignment
Python_relevant To which extent do you agree with the following statements?

Information Systems Education Journal (ISEDJ) 19 (4) ISSN: 1545-679X August 2021
©2021 ISCAP (Information Systems and Computing Academic Professionals) Page 49
https://isedj.org/; https://iscap.info
- Python is used often in industry - Employers value Python skills - Knowing Python will help me get a job - It is important for
managers/consultants to be able to know programming
- Having programming skills shows my commitment to an IT career
- Even if I don’t write code in my feature job, it is still important to know how
5-point Likert scale ranging from strongly disagree to strongly agree for each statement
outcomes
After taking this course, I feel that
- I have learned useful knowledge about programming
- I have gained important programming experience
- Compared to other students in my major I have become more competitive in the job market
- My programming skills enable me to tackle more challenging real-world problems
5-point Likert scale ranging from strongly disagree to strongly agree for each statement
course_difficult Overall, how will you rate the difficulty level of this course?
5-point Likert scale ranging from very difficult to very easy
style_stopper
When you were stuck on homework, how often do you (sum to 100%)
- Ask the teacher for help ____% - Visit the IS learning center ____%
- Ask my classmates ____% - Figure out on my own ____%
- Search online resources ____%
hours_spent
On average, how many hours did you spend outside of class working on assignments, readings, or projects for this course?
o 0-4 hours o 4-8 hours o 8-12 hours o 12-16
hours o More than 16 hours
Table 2. Variables and items in the post-course survey.

Information Systems Education Journal (ISEDJ) 19 (4) ISSN: 1545-679X August 2021
©2021 ISCAP (Information Systems and Computing Academic Professionals) Page 50
https://isedj.org/; https://iscap.info
Appendix 2. Tables
# Topics Homework Assignments Competencies Demonstrated
1
Display
information using print()
About You: print information about you Input and print functions
2 Expressions and Data Types
Restaurant: calculate totals of food orders based on unit price and quantity purchased
Built in functions, formatting
3 Control Structures (loops and
selections)
Buzz Game: test for numbers containing or divisible by 7 (Offenholley, 2012)
For Loops, While Loops, If/Else, and If/Elif/Else statements, writing functions that return values
4 Strings and Text
Files
User Account Management: store
usernames, passwords, and allow
users to add/edit/delete account information
Read and write text files, CSV
files, use CSV reader and
DictReader
5 Data Structures (List and Dictionary)
Donor Information Processing: maintain list of donors and donation
amounts; determine most generous donors, and total donations
Read CSV files into a dictionary, list and dictionary methods
6 Classes and Objects
Battleship Game: create different classes (Grid, Ship, Game); enable communication and collaboration between objects
Create original classes and objects, constructors and methods
7 Introduction to
Data Analytics
Tweet Analyzer: download and analyze a sample of tweets to determine most popular hashtags; create charts showing frequencies of hashtags and mentions
Test File Processing, Charts with Numpy and Matplotlib, filtering and sorting Pandas DataFrames, pie, bar, and other charts, with Pandas
Table 1. Topics and homework assignments.
Numeric Grade
Letter Grade
Instructor 1, Section 1
Instructor 1, Section 2
Instructor 2, Section 1
4.0 A 2 4 2
3.7 A- 5 3 3
3.3 B+ 1 4 3
3.0 B 1 2 2
2.7 B- 5 3 3
2.3 C+ 3 3 1
2.0 C 2 4 4
1.7 C- 1 0 1
1.3 D+ 1 1 0
1.0 D 0 1 1
0.7 D- 0 0 1
F F 2 0 1
Table 2. Grade distribution frequency across three sections offered.

Information Systems Education Journal (ISEDJ) 19 (4) ISSN: 1545-679X August 2021
©2021 ISCAP (Information Systems and Computing Academic Professionals) Page 51
https://isedj.org/; https://iscap.info
Introductory Python Textbooks Considered.
• Downey, Allen. Think Python: How to Think like a Computer Scientist. O'Reilly Press, 2016. • Lambert, Kenneth. Fundamentals of Python: First Programs 2nd Edition. Cengage, 2019. • Liaing, Y. Daniel. Introduction to Programming Using Python. Pearson, 2013.
• Punch, William & Enbody, Richard. The Practice of Computing Using Python. Pearson. 2017. • Zelle, John. Python Programming: An Introduction to Computer Science. Franklin, Beedle.
2017
Topic Downey Lambert Liaing Punch Zelle
Computing Overview 1 1 1 0 1
Basic I/O and simple programs
2 2 1 1 2
Numeric Data Types 2 2 2 3
Graphics, Image Processing 7 4
Strings 8 4 3,8 4 5
Lists, Tuples, Dictionaries 10,11,12 5 10,11,14 7,9 5,11
Files and Exceptions 14 4 13 6, 14 5
Functions 3,6 6 6 5,8 6
If Statements and Booleans 5 3 4 2 7
Loops and Booleans 7 3 5 2 8
Program Development 4,9,20 7 10 9
Classes and Objects 15,16,17,18 9 12 11, 12, 13 10, 12
Algorithms 20 11 3 13
Recursion 5 15 15 13
Advanced Topics 19 16
Windows-Based GUI 8 9
Networking /Client Server 10
Data Analytics Modules NONE NONE NONE NONE NONE
Table 3. Python Textbooks and Contents. Numbers are corresponding chapter/modules covering each
topic.
All Majors
Individual Majors
CIS Finance Actuarial Science
Other Business Majors
Overall relevance (Python_relevant)
3.49 (1.21)
3.73 (1.50) 3.59 (0.82)* 3.11 (0.61) ** 3.21 (1.10) **
Topic relevance (topics_relevant)
3.97 (0.82)
4.21 (0.87) 3.82 (0.95)* 3.89 (0.78) ** 3.66 (0.64) **
** p < 0.01; *** p < 0.001
Table 4. Students’ perceptions of the relevance of Python programming course.

Information Systems Education Journal (ISEDJ) 19 (4) ISSN: 1545-679X August 2021
©2021 ISCAP (Information Systems and Computing Academic Professionals) Page 52
https://isedj.org/; https://iscap.info
Grade Perceived Outcomes
Individual
year -0.255 0.039
gender (female) 0.405** 0.199
#motivs -0.281** -0.015
#prio_langs 0.165 0.166
Java_1 -0.034 0.058
Java_2 -0.138 0.115
HTML -0.009 -0.247
style_stopper -0.342* 0.049
Language syntax -0.146 0.059
logic -0.231* -0.239*
Course Design
topics_useful -0.056 0.325**
topics_relevant 0.215 0.309**
hw_helpful 0.048 0.173
hw_difficult -0.32* -0.035
Control
age 0.114 -0.089
section 0.054 -0.171
Major (IS) -0.356** -0.041
hours_spent 0.01 0.432**
overall_difficult -0.077 -0.191
overall_ relevance
-0.031 0.068
R2 0.67 0.64
**p < 0.01, *p < 0.05
Table 5. Summary of regression analysis results.
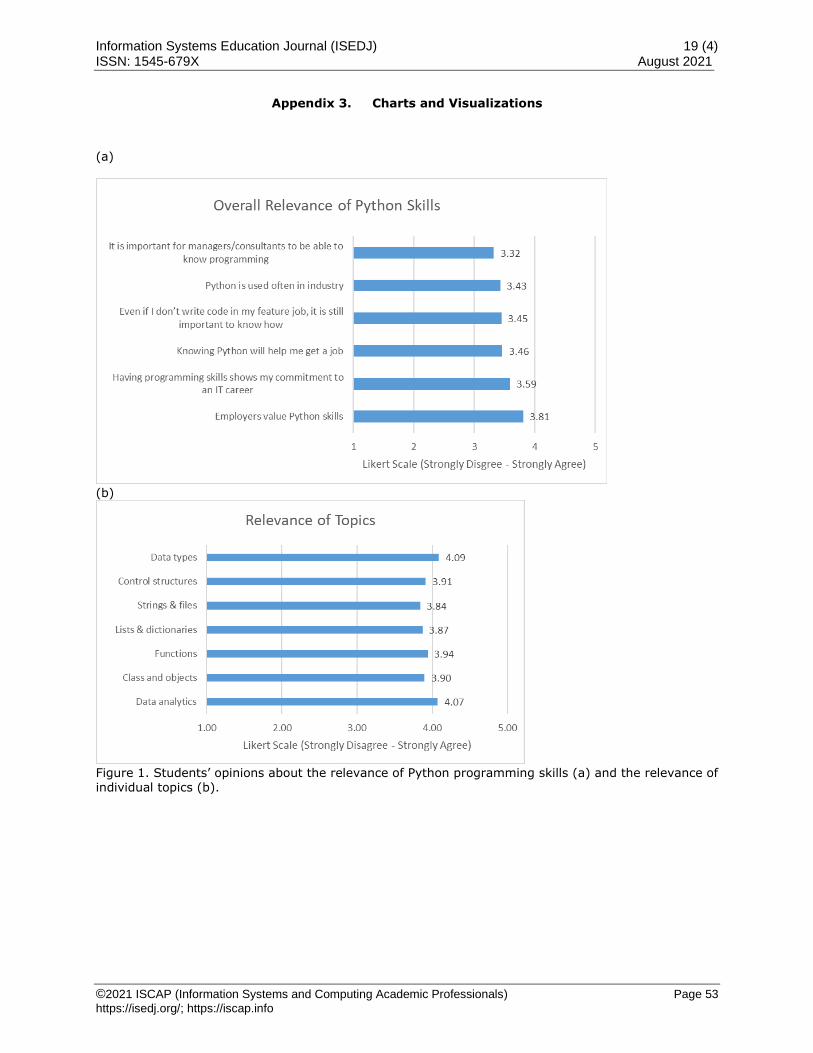
Information Systems Education Journal (ISEDJ) 19 (4) ISSN: 1545-679X August 2021
©2021 ISCAP (Information Systems and Computing Academic Professionals) Page 53
https://isedj.org/; https://iscap.info
Appendix 3. Charts and Visualizations
(a)
(b)
Figure 1. Students’ opinions about the relevance of Python programming skills (a) and the relevance of individual topics (b).
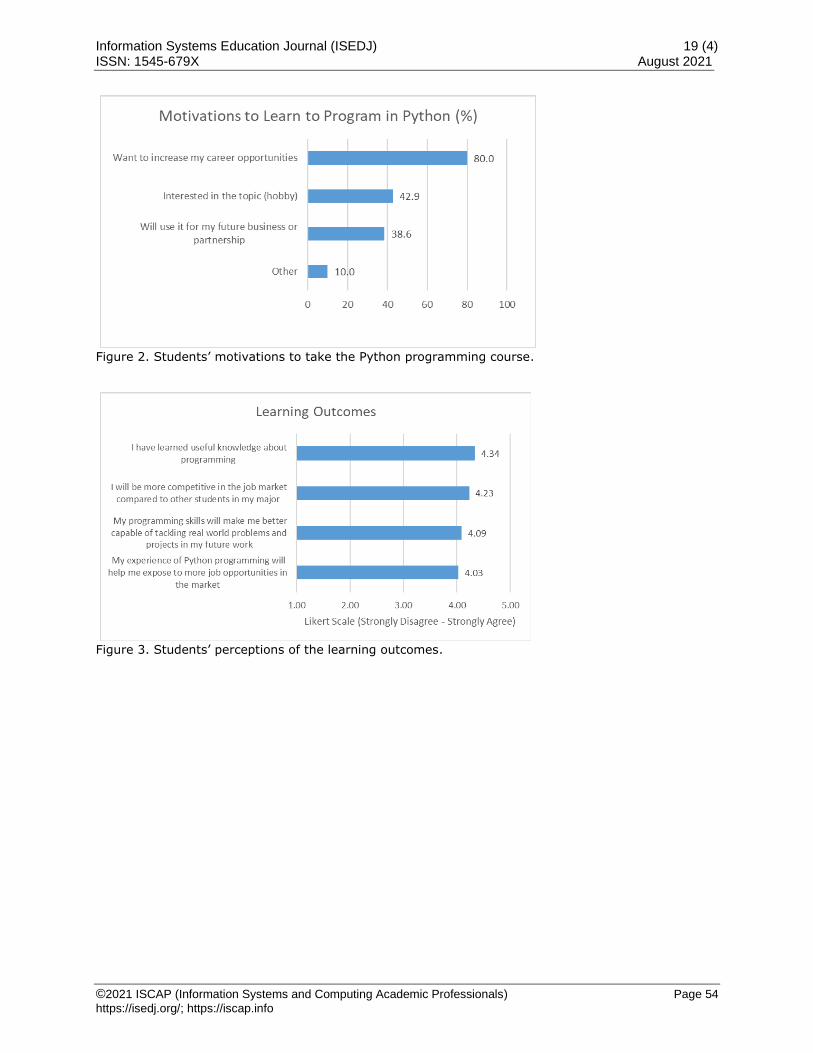
Information Systems Education Journal (ISEDJ) 19 (4) ISSN: 1545-679X August 2021
©2021 ISCAP (Information Systems and Computing Academic Professionals) Page 54
https://isedj.org/; https://iscap.info
Figure 2. Students’ motivations to take the Python programming course.
Figure 3. Students’ perceptions of the learning outcomes.

Information Systems Education Journal (ISEDJ) 19 (4) ISSN: 1545-679X August 2021
©2021 ISCAP (Information Systems and Computing Academic Professionals) Page 55
https://isedj.org/; https://iscap.info
Curriculum? Shmurriculum! The Relationship
Between Major Curriculum Characteristics and First-Year Earnings for
Information Systems Graduates
Guido Lang
[email protected] Computer Information Systems
Quinnipiac University Hamden, CT 06518, USA
Jason H. Sharp
[email protected] Marketing and Computer Information Systems
Tarleton State University Stephenville, TX 76402, USA
Abstract
This paper provides the results of an empirical investigation comparing first-year earnings of Information Systems (IS) graduates to other business majors and examining the extent to which characteristics of the major curriculum affect first-year earnings of IS graduates. The analysis combined first-year
earnings data for almost 7,000 IS graduates across 128 universities obtained from the U.S. Department of Education with major curriculum characteristics obtained from the universities' websites. Results show that IS graduates have the highest first-year earnings among business majors. Interestingly, neither the total number of IS major credits, the total number of IS core and elective credits, nor the number of subject-level IS core credits affect first-year earnings of IS graduates after accounting for state median income and university ranking. Thus, the IS major curriculum at a university does not seem to
affect first-year earnings at all. Based on the findings of this study, applicants wishing to maximize their first-year earnings should choose IS as their major and study at a university with a high ranking located in a state with a high median income. Keywords: First-year earnings, information systems, curriculum characteristics
1. INTRODUCTION With rising college tuition and fees, increasing student-debt, decreasing state funding, and growing sentiment among legislators and the general public about the worth of a four-year college education (EDUCATIONDIVE, 2019;
Dann, 2017; Task Force on Apprenticeship Expansion, 2018), first-year earnings among Information Systems (IS) graduates becomes an
important topic for IS educators to carefully consider. Given the goal of the Promoting Real Opportunity, Success, and Prosperity through Education Reform (PROSPER) Act (2017), which is “to support students in completing an affordable postsecondary education that will prepare them to enter the workforce with the
skills they need for lifelong success” (H.R. 4508, 2017, p. 1) along with the push toward Science, Technology, Engineering, and Mathematics

Information Systems Education Journal (ISEDJ) 19 (4) ISSN: 1545-679X August 2021
©2021 ISCAP (Information Systems and Computing Academic Professionals) Page 56
https://isedj.org/; https://iscap.info
(STEM) fields (U.S. Department of Education,
STEM, n. d.) an applied discipline such as IS is in a prime position to provide students the necessary skills and financial means for achieving
lifelong success. As such, the purpose of this paper is four-fold. First, it compares the first-year earnings of IS graduates to other business majors. Second, it examines whether total number of major credits affect first-year earnings of IS graduates. Third, it analyzes the impact of total number of core and elective credits on first-
year earnings of IS graduates. Finally, it investigates how the number of subject-level core credits affects first-year earnings of IS graduates. By answering these questions, the authors hope to provide IS educators, administrators, and potential students with insights into the impact of
major curriculum characteristics on first-year earnings for IS graduates.
2. BACKGROUND While a considerable amount of research exists examining the knowledge and skills needed for
entry-level IS graduates (e.g., Aasheim, Shropshire, Li, & Kadlec, 2012; Capel 2001-2002; Fang, Lee, & Koh, 2005; Gallagher et al., 2010; Lang, 2018; Lee, 2005; Lee & Han, 2008) and the types of jobs available to IS graduates (Peslak et al., 2018; Reich, 1996; Robin & Roggio, 2012), there is a paucity of empirical research on the
relationship between major curriculum characteristics and first-year earnings for IS
graduates. One such study suggests that internship experience, GPA, job market, and size of employer are significant determinants of first-year earnings for IS graduates (Sandvig, Tyran,
& Ross, 2005). More recently, the Association for Information Systems (AIS) in partnership with Temple University released the 2019 Information Systems (IS) Job Index. The 2019 IS Job Index indicates that “salaries for IS graduates are significantly higher than typical business majors for both Bachelor’s and most Master’s degrees”
(p. 3) and that “overall, IS salaries are outpacing business school salaries but growing slowly in contrast to the high demand and placement” (p. 3). According to the 2019 IS Job Index, the
average first year-earnings for graduates with a Bachelor’s degree in IS was $65,314, while first-year earnings for graduates with a Master’s
degree in IS was $84,113. Table 1 and Table 2 provide average first-year earnings for graduates with a Bachelor's and a Master's degree in IS since 2013, respectively (note that the IS Job Index is published every other year).
Year First-year earnings
2013 $57,212
2015 $57,817
2017 $62,820
2019 $65,314
Table 1. Average first-year earnings for graduates with a Bachelor's degree in IS (AIS,
2019)
Year First-year earnings
2013 $65,394
2015 $67,632
2017 $72,517
2019 $84,113
Table 2. Average first-year earnings for graduates with a Master's Degree in IS (AIS,
2019)
Tables 3 and Table 4 provide a comparison of average first-year earnings by major for Bachelor’s and Master’s degrees, respectively. Note that IS outpaces other business majors for both Bachelor’s and Masters’ degrees.
Major (Bachelor) First-year earnings
Information Systems $65,314
Accounting $51,783
Finance $55,138
Marketing $45,539
Table 3. Average first-year earnings by undergraduate major (AIS, 2019)
Major (Master) First-year earnings
Information Systems $84,113
Accounting $54,307
Finance $64,481
Marketing $56,921
Table 4. Average first-year earnings by graduate major (AIS, 2019)
The National Association of Colleges and Employers (NACE) supports the findings reported in the 2019 IS Job Index, stating, IS majors “are projected to have the highest starting salary
among Class of 2020 business graduates earning bachelor’s degrees” (NACE, 2020, ¶1). Based upon the Winter 2020 Salary Survey, NACE
projects the average first-year earnings for IS graduates to be $63,445. NACE also reports that IS is in the top 5 most in-demand business majors for Bachelor degrees and in the top 10 most in-
demand business majors for Master degrees. While the 2019 IS Job Index and the NACE Winter 2020 Salary Survey provide useful information for average first-year earnings for IS graduates compared to other business majors in terms of
average first-year earnings, these sources do not

Information Systems Education Journal (ISEDJ) 19 (4) ISSN: 1545-679X August 2021
©2021 ISCAP (Information Systems and Computing Academic Professionals) Page 57
https://isedj.org/; https://iscap.info
provide empirical information about the extent to
which characteristics of the major curriculum impact first-year earnings for IS graduates. Thus, the goal of this paper is to broaden the discussion
of how first-year earnings of IS graduates compare to other business majors, while addressing the effect that total number of major credits, total number of core and elective credits, and number of subject-level core credits have on first-year earnings of IS graduates. Thus, this paper addresses the following research
questions: RQ1: How do first-year earnings of IS graduates compare to other business majors? RQ2: How does the total number of major credits affect first-year earnings of IS graduates?
RQ3: How does the total number of core and elective credits affect first-year earnings of IS graduates? RQ4: How does the number of subject-level core credits (database management, programming,
systems analysis and design, etc.) affect first-year earnings of IS graduates?
3. METHODOLOGY To conduct this study, we obtained first-year earnings for almost 7,000 IS graduates across
128 universities from the U.S. Department of Education (n. d.). We then obtained the number
of major credits, number of core and elective credits, as well as the number of subject-level core credits from the respective university websites. In order to control for potential income
differences caused by the region in which a university is located, we obtained state median incomes from the U.S. Department of Commerce (n. d.). Similarly, in order to control for potential income differences caused by the reputation of the university, we obtained university rankings from the U.S. News & World Report (n. d.). We
then combined U.S. News & World Report national and regional university rankings into one global ranking by adding the regional rankings to the lowest possible national ranking (i.e. 381). As a
result, a university with a regional rank of e.g. 38 would end up with a global rank of 381+38=419. Likewise, we assigned regional unranked
universities the lowest possible global ranking (i.e. 552), based on the sum of the lowest national ranking (i.e. 381) and the lowest regional ranking (i.e. 171). Using data from the U.S. Department of Education, we calculated summary statistics of first-year earnings by major (RQ1).
Combining all data sources, we conducted multiple regression analyses to predict first-year
earnings from the number of IS major credits
(RQ2), number of IS core and elective credits (RQ3), and the number of subject-level IS core credits (RQ4) while controlling for state median
income and university ranking.
4. RESULTS For RQ1, results indicate that IS graduates have the highest first-year earnings among business majors ($52,163.28), followed by finance
($48,185.67), and accounting ($44,879.02), graduates. This ranking is in line with both the 2019 IS Job Index and the NACE Winter 2020 Survey. See Table 5 in Appendix A for details about additional business majors, total students and total universities. See Table 6 in Appendix A
for additional descriptive statistics of variables used in the regression analyses. In regard to RQ2, after accounting for state median income and university ranking, the total number of IS major credits does not affect first-year earnings. See Table 7.
Predictor β
State median income 0.427***
University ranking -0.338***
Total IS major credits -0.105
Note: Dependent variable was first-year earnings, N = 128, R2 = 0.383, *** p < .001
Table 7. Results of regression analysis for total
IS major credits For RQ3, after accounting for state median income and university ranking, the total number of IS core and elective credits does not affect
first-year earnings. See Table 8.
Predictor β
State median income 0.438***
University ranking -0.349***
Total IS core credits -0.049
Total IS elective credits -0.116
Note: Dependent variable was first-year earnings, N = 128, R2 = 0.387, *** p < .001
Table 8. Results of regression analysis for total IS core and elective credits
Finally, with regard to RQ4, after accounting for state median income and university ranking, the number of subject-level IS core credits does not affect first-year earnings. See Table 9 in Appendix A.

Information Systems Education Journal (ISEDJ) 19 (4) ISSN: 1545-679X August 2021
©2021 ISCAP (Information Systems and Computing Academic Professionals) Page 58
https://isedj.org/; https://iscap.info
5. DISCUSSION AND CONCLUSION
As noted in the introduction of this paper, there are multiple reasons why an empirically-driven
study of first-year earnings of IS graduates is a timely and relevant topic for IS educators. This study revealed that IS graduates have the highest first-year earnings of all business majors, making IS a financially attractive major for business students – especially in light of increasing student debt. This finding also has a bearing on such
state-wide initiatives as Texas’ 60x30 which has as one of its goals that by 2030, “undergraduate student loan debt will not exceed 60 percent of first-year wages for graduates of Texas public institutions” (60x30TX, n.d.).
Although it is helpful to know where IS graduates rank in comparison to other business majors, and the results are encouraging, it is also important to have some understanding of the impact of characteristics of the major curriculum have on first-year earnings of IS graduates. While other studies have indicated that internship experience,
GPA, job market, and size of employer are significant determinants of starting salary for IS graduates (Sandvig, Tyran, & Ross, 2005), this study revealed that first-year earnings of IS graduates are not affected by the total number of IS major credits, the total number of IS core and elective credits, nor the number of subject-level
IS core credits. Thus, the IS major curriculum at a university does not seem to be a relevant for
first-year earnings. These findings leave open the possibility for future research to examine other potential factors
affecting first-year earnings of IS graduates beyond state median income, university ranking, and major curriculum characteristics. Moreover, since the present study examined only a snapshot in time, future research may wish to analyze the variation in first-year earnings of IS graduates over time, possibly accounting for changes in the
IS curriculum. Lastly, first-year earnings, while certainly important, are only one aspect of financial success. Future studies may wish to analyze earnings of IS graduates five or ten years
after graduation. The conclusion that can be surmised from this
study is that, taken together, the findings suggest that applicants wishing to maximize their first-year earnings should study IS at a university with a high ranking located in a state with a high median income. It should be said, however, that although not every IS graduate may find
themselves in this scenario, according to the 2019 IS Job Index, the 2020 NACE Winter Salary
Survey, and the results of this study, overall, IS
graduates are in better shape than other business majors in regard to average first-year earnings and of possessing the financial resources
necessary to obtain lifelong success.
6. REFERENCES 60x30TX. (n. d.). 4. Student Debt – By 2030,
undergraduate student loan debt will not exceed 60 percent of first-year wages for
graduates of Texas public institutions. Obtained from http://www.60x30tx.com/
Aasheim, C., Shropshire, J., Li, L., & Kadlec, C.
(2012). Knowledge and Skill Requirements for Entry-Level IT Workers: A Longitudinal
Study. Journal of Information Systems Education, 23(2), 193-204.
Association for Information Systems. Information
Systems (AIS) Information Systems Job Index. (2019). Obtained from https://isjobindex.com/
Cappel, J. (2001-2002, Winter). Entry-level IS
Job Skills: A Survey of Employers. Journal of Computer Information Systems, 42(2), 76-82.
Dann, C. (2017). Americans Split on Whether 4-
Year College Degree is Worth the Cost. Obtained from
https://www.nbcnews.com/politics/first-read/americans-split-whether-4-year-college-degree-worth-cost-n799336
EDUCATIONDIVE. (2019). 3 Reasons Why a 4-Year Degree Isn’t Worth It. Obtained from https://www.educationdive.com/spons/3-reasons-why-a-4-year-degree-isnt-always-worth-it/547347/
Fang, X., Lee, S., & Koh, S. (2005, Fall).
Transition of Knowledge/Skills Requirement for Entry-Level IS Professionals: An Exploratory Study Based on Recruiters' Perception, Journal of Computer Information
Systems, 46(1), 58-70. Gallagher, K. P., Kaiser, K. M., Simon, J. C.,
Beath, C. M., & Goles, T. (2010). The Requisite Variety of Skills for IT Professionals. Communications of the ACM, 53(6), 144-148.
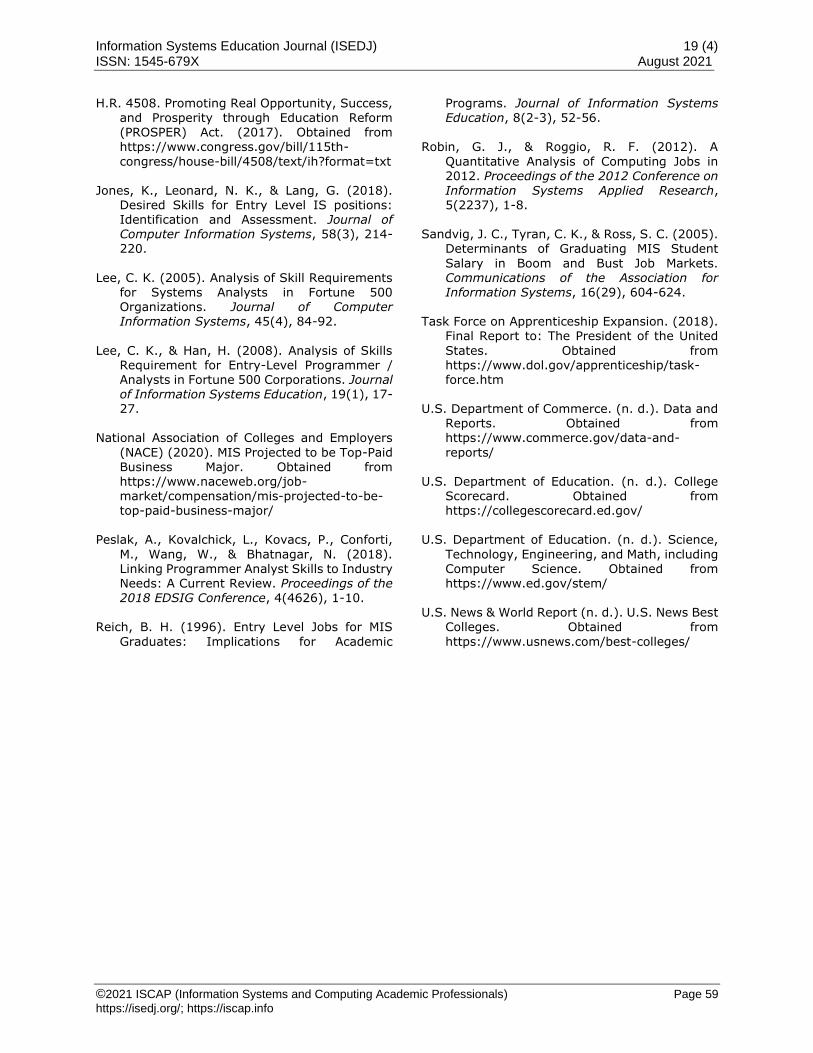
Information Systems Education Journal (ISEDJ) 19 (4) ISSN: 1545-679X August 2021
©2021 ISCAP (Information Systems and Computing Academic Professionals) Page 59
https://isedj.org/; https://iscap.info
H.R. 4508. Promoting Real Opportunity, Success,
and Prosperity through Education Reform (PROSPER) Act. (2017). Obtained from https://www.congress.gov/bill/115th-
congress/house-bill/4508/text/ih?format=txt Jones, K., Leonard, N. K., & Lang, G. (2018).
Desired Skills for Entry Level IS positions: Identification and Assessment. Journal of Computer Information Systems, 58(3), 214-220.
Lee, C. K. (2005). Analysis of Skill Requirements
for Systems Analysts in Fortune 500 Organizations. Journal of Computer Information Systems, 45(4), 84-92.
Lee, C. K., & Han, H. (2008). Analysis of Skills Requirement for Entry-Level Programmer / Analysts in Fortune 500 Corporations. Journal of Information Systems Education, 19(1), 17-27.
National Association of Colleges and Employers
(NACE) (2020). MIS Projected to be Top-Paid Business Major. Obtained from https://www.naceweb.org/job-market/compensation/mis-projected-to-be-top-paid-business-major/
Peslak, A., Kovalchick, L., Kovacs, P., Conforti,
M., Wang, W., & Bhatnagar, N. (2018). Linking Programmer Analyst Skills to Industry
Needs: A Current Review. Proceedings of the 2018 EDSIG Conference, 4(4626), 1-10.
Reich, B. H. (1996). Entry Level Jobs for MIS
Graduates: Implications for Academic
Programs. Journal of Information Systems
Education, 8(2-3), 52-56. Robin, G. J., & Roggio, R. F. (2012). A
Quantitative Analysis of Computing Jobs in 2012. Proceedings of the 2012 Conference on Information Systems Applied Research, 5(2237), 1-8.
Sandvig, J. C., Tyran, C. K., & Ross, S. C. (2005).
Determinants of Graduating MIS Student
Salary in Boom and Bust Job Markets. Communications of the Association for Information Systems, 16(29), 604-624.
Task Force on Apprenticeship Expansion. (2018).
Final Report to: The President of the United
States. Obtained from https://www.dol.gov/apprenticeship/task-force.htm
U.S. Department of Commerce. (n. d.). Data and
Reports. Obtained from https://www.commerce.gov/data-and-
reports/ U.S. Department of Education. (n. d.). College
Scorecard. Obtained from https://collegescorecard.ed.gov/
U.S. Department of Education. (n. d.). Science,
Technology, Engineering, and Math, including Computer Science. Obtained from
https://www.ed.gov/stem/ U.S. News & World Report (n. d.). U.S. News Best
Colleges. Obtained from
https://www.usnews.com/best-colleges/

Information Systems Education Journal (ISEDJ) 19 (4) ISSN: 1545-679X August 2021
©2021 ISCAP (Information Systems and Computing Academic Professionals) Page 60
https://isedj.org/; https://iscap.info
Appendix A
Major First-year earnings (SD) Total students Total universities
Accounting 44,879.02 (8,997.16) 122,386 715
Entrepreneurship 37,907.32 (8,253.04) 1,448 41
Finance 48,185.67 (8,969.79) 45,171 363
Information Systems 52,163.28 (11,079.81) 6,997 128
International Business 43,013.89 (8,382.62) 2,712 72
Management 40,104.64 (8,268.97) 606,254 1,250
Table 5. First-year earnings of selected business majors
Variable Mean (SD) Min Max
First-year earnings 52,163.28 (11,079.81) 17,400 81,600
State median income 60,177.09 (11,243.28) 20,296 85,203
University ranking 294.63 (163.297) 15 552
Total IS major credits 26.477 (8.046) 9 57
Total IS core credits 18.508 (6.777) 0 36
Total IS elective credits 7.969 (5.343) 0 27
IS core credits: Database management 2.828 (1.261) 0 6
IS core credits: Programming 3.336 (2.504) 0 18
IS core credits: Systems analysis and design 2.492 (1.298) 0 6
IS core credits: Networking 1.828 (1.544) 0 6
IS core credits: Project management 1.262 (1.507) 0 4
IS core credits: Security 0.570 (1.170) 0 4
IS core credits: Enterprise architecture 0.434 (1.051) 0 3
IS core credits: Web development 0.492 (1.292) 0 6
IS core credits: Analytics 0.313 (1.078) 0 6
IS core credits: Internship 0.164 (0.685) 0 3
IS core credits: Other 4.789 (3.984) 0 18
Table 6. Descriptive statistics of variables used in regression analyses (N = 128)
Predictor β
State median income 0.387***
University ranking -0.342***
IS core credits: Database management -0.080
IS core credits: Programming 0.051
IS core credits: Systems analysis and design 0.007
IS core credits: Networking -0.118
IS core credits: Project management 0.015
IS core credits: Security 0.097
IS core credits: Enterprise architecture 0.004
IS core credits: Web development -0.148
IS core credits: Analytics 0.070
IS core credits: Internship 0.037
IS core credits: Other 0.017
Note: Dependent variable was first-year earnings, N = 128, R2 = 0.435, *** p < .001
Table 9: Results of regression analysis for subject-level IS core credits

Information Systems Education Journal (ISEDJ) 19 (4) ISSN: 1545-679X August 2021
©2021 ISCAP (Information Systems and Computing Academic Professionals) Page 61
https://isedj.org/; https://iscap.info
Towards Improving Student Expectations in
Introductory Programming Course with Incrementally Scaffolded Approach
Deepak Dawar [email protected]
Miami University Hamilton, Ohio
Abstract Keeping students motivated during an introductory computer programming can be a challenging task. Looking at its varied complexities, many students who are introduced to computer programming for the
first time can easily become demotivated. This work looks at the value-expectancy motivational model of student learning and presents our experiences with a novel instructional delivery interventional technique, introduced and tested over a period of three semesters. Our research question was simple: “Can we affect student motivation, and learning outcomes by using an approach that makes targeted continuous engagement with course material mandatory?” The technique/process was conceived keeping in mind our previous work on similar lines; our in-class teaching experiences; motivational theory; and recent developments in cognitive load theory. The students, instead of writing an
assignment and a lab for each module/chapter, were asked to complete one assignment a day, not exceeding four assignments a week. The assignments were incrementally difficult and had to be done almost every day. Students found the approach effective, in spite of having to spend considerable
amount of time on assignments. Average final exam scores showed a healthy improvement after the use of this technique. Owing to a small student sample size, it would be premature to draw conclusions about the efficacy of the technique, but the initial results show promise of further investigation.
Keywords: Student motivation, introductory programming, pedagogy, value-expectation, student procrastination, learned helplessness.
1. INTRODUCTION
The landscape of the potential problems faced by novice programmers is vast and is quite formidable. Teachers with substantial experience in teaching programming, including ourselves, would potentially agree with the above
statement. In introductory programming courses, failure rates are high (Allan & Kolesar, 1997;
Bennedsen & Caspersen, 2007; Beaubouef & Mason, 2005; Howles, 2009; Kinnunen & Malmi 2006; Mendes et al., 2012; Newman, Gatward, & Poppleton, 1970; Sheard & Hagan, 1998; Watson & Li, 2014), and students can easily become demotivated. One important reason for this
demotivation is found in the complex nature of computer programming. The novice programmer has to grapple with multiple domains of learning
as suggested in the literature (Davies, 1993; Kim & Lerch, 1997; Rogalski & Samurçay, 1990;
Robins, Rountree & Rountree, 2003;). Hence, keeping students motivated is an important part of teaching introductory programming. Instead of dealing with the multi-faceted
motivational aspects of programming directly, we looked at how a student values learning; and
what are his/her expectations from that learning. This is derived from the value-expectation theory of motivational design of instruction (Keller, 1983). This theory connects value, expectation, and subsequent motivations as:
𝑚𝑜𝑡𝑖𝑣𝑎𝑡𝑖𝑜𝑛 = 𝑒𝑥𝑝𝑒𝑐𝑡𝑎𝑛𝑐𝑦 × 𝑣𝑎𝑙𝑢𝑒 (1)

Information Systems Education Journal (ISEDJ) 19 (4) ISSN: 1545-679X August 2021
©2021 ISCAP (Information Systems and Computing Academic Professionals) Page 62
https://isedj.org/; https://iscap.info
It follows that if a student feels that the task is
worth doing, but finds it impossible to finish, motivation levels are bound to dip (Crego et. al, 2016). Similarly, if a student sees no value in
learning if he/she will not be motivated. A teacher or the environment may have a limited effect on some factors and may have a high impact on others. For instance, it may be quite difficult for the teacher to influence the value variable in the equation; i.e., a teacher might have a limited impact on how a student values learning.
To design an effective instructional delivery mechanism, we must shed light on what teaching means to the instructor, and what learning means to a student. A student’s level of engagement will depend on their view of activity, and motivation
levels. Biggs (1999) provides a general framework regarding conceptions of learning and teaching as a function of three levels. These levels are:
Level 1: Learning as a function of what student is
Level 2: Learning as a function of what teaching is Level 3: Learning as a function of what activities the student engages in, as a result of the teaching environment
Biggs presents these levels in order of increased complexity with Level 3 being most conducive to
learning. It is imperative to briefly discuss what constitutes a productive teaching climate. McGregor (1960)
proposes two competing ideas that can be applied to a workplace and calls them Theory X and Theory Y. Biggs takes these concepts and applies them to academic environment. Theory X assumes that students are unmotivated, and are unwilling to learn. So they must be forced to work hard. Clearly, teacher controls the whole
environment, and there is a distrust between the teacher and the student. At the opposite end, Theory Y assumes that students are well motivated, and therefore, must be trusted to
work and learn. Assessments should be few, and deadlines must be not enforced strictly. The control somewhat is with the students, and they
will respond to this by working voluntarily. In our experience, none of these theories work very well in a classroom. The answer may lie somewhere in the middle. Given these theories and challenges, we had to
decide which part (expectancy or value) of the motivation model should we try to affect (if there
is such a possibility), to improve overall
motivation of students, and hence learning outcomes. The value variable in the motivation model is very subjective. There can be myriad
reasons why a student may or may not value learning. Fallows & Ahmet (1999), list a set of points regarding value students attach to learning, prominent of which are: 1) philosophical attitude towards learning 2) career aspirations 3) degree of interest in the course etc. A student might find value, and hence may be motivated by
multiple factors listed above. We opine that these are very personal beliefs, and it may not be easy to manipulate them in a limited setting of classroom. Therefore, we turn to the expectancy variable in the equation.
Students must believe that they can succeed in the course if they are to be motivated. What are the major causes of student demotivation? There can be many, but the one suspect that we can categorically point towards in our classrooms is high cognitive load. Cognitive load theory (Paas, Renkl, & Brünken, 2010; Sweller, 1988, 1994)
deals with the aspects of load placed on working memory while a task is being executed. Computer programming requires balancing numerous interactive tasks. For example, writing a computer program involves juggling numerous details like problem domain, current state of program, language syntax, strategies etc.
(Winslow, 1996). Hence, high cognitive loads can diminish expectations of a novice programmer
leading to a dip in overall motivation, and the value-expectancy model tells us that students must believe that succeed in doing the current assignment, and overall final assessment.
Keeping all these factors and the expectancy model in mind, we designed an intervention that made continuous targeted interaction between the material and students – somewhat mandatory. This approach was designed to influence the expectancy factor in the equation,
as this variable seems to be more sensitive to teacher’s or the environment’s influence. Students were given a programming assignment a day, and no more than four assignments a
week. Every assignment built on the previous assignment(s), and the final assignment was to be a mini-project testing students on all the
concepts learned so far in previous assignments. This, we opined, would: • establish a study pattern for students • improve student’s expectation since the
assignments would carry germane cognitive loads
• make them practice programming every almost every day. This was done keeping in

Information Systems Education Journal (ISEDJ) 19 (4) ISSN: 1545-679X August 2021
©2021 ISCAP (Information Systems and Computing Academic Professionals) Page 63
https://isedj.org/; https://iscap.info
mind the generally accepted notion that
constant practice improves the learning outcomes, and as evidenced by psychological studies (Brown & Bennett, 2002; Glover,
Ronning & Bruning, 1990; Moors & De Houwer, 2006) done on variable student populations. Constant practice can also make students want to learn more (Kalchman, Moss & Case, 2001) thereby potentially improving the motivation as a whole.
In a series of studies conducted by Rist (1986, 1989, 1995, 2004), and reviewed by Sorva (2012) confirm that one of the main differentiators of students into novice and expert programmers is their constant engagement and experience with learned schemata.
2. METHODOLOGY
This paper builds on the previous work published by Dawar (2020). In that work, students were strictly asked to turn in an assignment a day, and deadlines were more strict. They called it AAAD or ‘An Assignment A Day Scaffolded Approach`.
This paper builds on that work in the following terms.
1. It refines the AAAD approach by dynamically adjusting deadlines while still mandating most assignments to be submitted within a day.
2. Looks into the relationship of altered
cognitive load and student expectations.
3. Provides additional data to support the conclusions drawn in the previous work.
4. Provides a framework for future work in this direction.
Our method rests on three pillars as shown below in Fig 1.
Figure 1: Teaching Intervention
It can effectively be summarized as - make the
students practice constantly and assert just enough load on them in terms of deadlines and materials, so as to avoid possible student disenchantment and frustration with the course, while simultaneously improving learning gains.
Having administered this approach for only a
couple of times, and due to small sample size, as of now, we are not in a position to define as to what constitutes an optimal load. Hence, we
designed the task load with some assumptions based on our classroom experiences. While constructing this mechanism, we faced a couple of dilemmas. First, constant testing may lead to high student anxiety (Kaplan et. al, 2005), and at first glance, it looks like this is exactly what we are doing by asking students to write an
assignment a day. An easy way to make students dislike programming, is to put them under unnecessary stress (Goold & Rimmer, 2000). Many of our students are non-traditional and work full time jobs. Second, a strict enforcement of everyday deadlines may easily overwhelm
these students. Our only chance of overcoming these hurdles were - providing germane load assignments following up with regular feedback. Absent any of these two factors, and we knew we would lose the students. We tried to keep the approach as straightforward
as possible with a few exceptions in between. We also learned from our previous work on a similar technique, and incorporated a few changes based on the student feedback. Hence, the current approach is similar to our previous approach, and can be summarized as:
1. Students will ideally do one assignment
per day. 2. Opening assignments of the chapter will
test students on very basic skills like writing a method stub. Subsequent assignments will gradually increase in complexity keeping in mind the cognitive
load asserted by the assignment. This is in part based on the study conducted by Alexandron et al. (2014).
3. There will not be more than four assignments per week. Deadlines will be relaxed on case-to-case basis. Previous technique had comparatively strict
deadlines. 4. As an exception, and depending upon the
cognitive load, an assignment may be completed in two or more days rather
than a single day.
The study was conducted over three semesters.
The control group (C1) data was collected in the first semester (Fall 2018). This group worked with the orthodox approach followed at our institution for introductory programming classes i.e., on an average, one assignment and one lab work per week, with
quizzes at the end of the module/chapter.
Teaching Intervention
Continuous Practice
Congnitive Load Increments
Continuous Feedback and
Resolution

Information Systems Education Journal (ISEDJ) 19 (4) ISSN: 1545-679X August 2021
©2021 ISCAP (Information Systems and Computing Academic Professionals) Page 64
https://isedj.org/; https://iscap.info
In the next semester (Spring 2019), the
experimental group (E1) was administered the interventional approach, and pertinent data collected at the end of semester. A total of 37
assignments were given to the experimental group over a course of 13 weeks of which 1 week was spring break. Rest of the 12 weeks meant 84 days of which weekends accounted for 24 days. 10 days were meant for quizzes and exams. Hence, the students had to complete 37 assignments in about 50 days; i.e., about 0.75
assignments a day. An additional end of course survey (see Appendix C) was conducted with this experimental group to measure how well this approach was received by the students. The experiment was again repeated in the third semester (Fall 2019) with another experimental
group E2. We followed the exact same procedures for E2 that were followed for E1 with slight deadline modifications especially for full time working students. All other factors like quizzes, projects etc. remain the same for control and experimental groups.
The number of students in C1, E1, and E2 were 20, 22, and 21, respectively. One student from C1 and three students from E2 declined to have their data included in the study. The course is mandatory for Computer Science (CSE) students but can be used as an elective for Information Technology (IT) majors. The control group C1 had
12 IT/CSE majors and 8 non-IT/CSE students. The experimental group E1 had 13 IT/CSE, and 9
non-IT/CSE majors. E2 had 12 IT/CSE, and 8 non-IT/CSE majors, respectively. So, the class composition of all groups compared was fairly similar with C1, E1, and E2 having about 40%,
41%, and 40% non-IT/CSE majors, respectively. This relatively similar class composition gives us some level of confidence about the experimental set up. Administering the right cognitive load is crucial to success of this intervention. As can be inferred
from Table 1 (see Appendix A), even a slight modification of problem statement can quickly increase the number of concepts that the student has to deal with, thereby increasing the cognitive
load. The task load belongs to the chapter that concerns itself with “method writing” in JAVA. This was to be delivered as an approximately
eight-day module with classroom practice labs (non-graded), five assignments, and a quiz at the end. Detailed descriptions of these assignments are included in Appendix B. Comparison
Since the experimental groups (E1 and E2) had to do many more assignments (at least 4 more
assignments per module), an equitable
comparison between the control and experimental groups was a challenge.
We decided that the comparison of the last summative assignment given to the experimental group(s) with the usual single assignment per module given to the control group would make a fair comparison. Both these assignments were similar in terms of concepts they tested but there were also some differences. For example, they
differed in cognitive load and total points in many cases. The experimental group students would have had more exposure to the concepts since they would have submitted a series of assignments before attempting the final assignment.
We assessed the following metrics for both groups, and for each assignment compared.
• assignments submitted late • assignments not submitted
To measure the impact of our technique on
overall grades, if any, we administered the exact same module quizzes, and final exam to both groups, and compared the following data points:
• module wise quiz scores • final exam scores
3. RESULTS
We divided our analyses into two parts - inter and intra group. Inter group analyses compared the control (C1) with experimental groups (E1, E2), and intra group compared/analyzed the results of the experimental groups (E1, E2) only.
Module C1 (20) E1 (22) E2 (20)
1 1 0 0
2 0 0 0
3 0 0 0
4 2 0 0
5 2 1 0
6 5 3 3
7 4 3 6
Total 14 7 9 Table 2: Assignments not submitted per
module
Inter Group Analyses The control group did only one assignment per
week whereas the experimental groups did several leading up to the last assignment of the module. We compared the statistics of the last

Information Systems Education Journal (ISEDJ) 19 (4) ISSN: 1545-679X August 2021
©2021 ISCAP (Information Systems and Computing Academic Professionals) Page 65
https://isedj.org/; https://iscap.info
module assignment of the experimental group
with the usual weekly assignment of the control group.
Module C1 (20) E1 (22) E2 (20)
1 0 1 2
2 1 2 1
3 1 3 0
4 1 2 7
5 1 5 5
6 4 5 4
7 2 4 7
Total 10 22 26
Table 3: Late assignments submitted per
module
Module C1 (20) E1 (22) E2 (20)
1 71% (3.72) 75% (2.05) 75% (2.22)
2 79% (2.08) 71% (2.33) 78% (3.32)
3 73% (3.19) 73% (2.55) 73% (3.68)
4 62% (3.72) 66% (2.49) 71% (3.01)
5 74% (4.26) 75% (2.44) 75% (3.10)
6 67% (3.41) 67% (1.78) 76% (1.95)
7 56% (3.48) 65% (2.50) 61% (3.30)
Average 68% (3.40) 70% (2.30) 73% (2.94) Table 4: Mean grade points (with standard deviations) scored on the quiz by all groups
As an example, for assignments listed in Table 1, in the control group, an assignment similar to 5 was given to the students. In the experimental groups, however, the same assignment 5 was given as the last assignment, after students have had some exposure to the relevant concepts in
the previous assignments vis-à-vis assignments 1, 2, 3, and 4. Tables 2, 3 and 4 summarize the data points collected for comparison. The number of possible submissions per module in the control and experimental groups were 20, 22, and 20
respectively which is equivalent to the number of students in those sections.
The data collected lays out some interesting points. The experimental groups, at an anecdotal level, showed a greater inclination to submit the
final assignment as compared to the control group. Bear in mind that the experimental group students - by the time they submit the final assignment - have already submitted multiple assignments on module topics leading up to the last assignments. The non-submission rate, that
is almost half of the control group, may hint at
the student’s proclivity and willingness at submitting the final assignment.
We believe that a better non-submission rate for the experimental group, even after doing multiple rounds of assignments is a healthy indicator of voluntary student engagement with the course. Even though the non-submission rate is lower in the experimental groups, the late submission rate is higher. Late submissions in both control and
experimental groups were allowed to see that if given the time, would students be motivated enough to work on the assignments? We found that students were more willing to work on the assignments in the experimental groups
even if that meant submitting it late. This is evident from the fact that there are more late submissions in experimental groups than no submissions. The trend is reverse in the control group. This is to reiterate that the data presented here for experimental groups is for the last cumulative assignment. By this time, for the
same module, students would have submitted many incrementally difficult assignments, and a general student fatigue is expected which may speak for the higher number of late submissions. Table 4 presents the end of module quiz grades for both groups. The groups were administered
the exact same quizzes. There seems to be no significant difference in the quiz performance for
the groups, though the standard deviation in the experimental groups seems to be on the lower side than that of the control group. Does that mean that constant practice, even though unable
to improve overall group performance on quizzes, can help stem high variability of individual performance in the group? Could it be because weak students were able to improve their performance gradually? We cannot say anything for sure given such small sample size, but the data does provide directions for
potential explorations.
Group Average Final
Quiz
Score
Average JAVA
Program
Score
Cumulative Average
C1 66% 51% 56%
E1 74% 71% 72%
E2 78% 74% 75%
Table 5: Final exam score for all groups The groups were administered the exact same final exam. The two part exam consisted of writing a JAVA program and a multiple choice quiz
that covered all seven modules.

Information Systems Education Journal (ISEDJ) 19 (4) ISSN: 1545-679X August 2021
©2021 ISCAP (Information Systems and Computing Academic Professionals) Page 66
https://isedj.org/; https://iscap.info
The JAVA program was worth two-third of the
total points, and the quiz, one-third. Table 5 presents the data.
It is quite interesting to note that while there was no significant difference between module quiz scores, the experimental groups performed much better in the final exam. Even though the gains in the final quiz are marginal, the experimental groups outperformed the control group by 20 percentage points or more in JAVA program
writing. The overall cumulative improvement in final exam mean score was 16%, and 19% for E1 and E2 respectively. These numbers may insinuate that – for the experimental groups – the increased practice led to an improvement in final exam score, though it is too early to say anything
with high degree of confidence due to such a small sample size. Nevertheless, the final exam numbers are encouraging. Intra Group Analyses Tables 6 and 7 present detailed non- submission data for E1 and E2 respectively. The first column
represents the module/chapter that was covered, and the numbered columns represent the assignment number in that particular module. Some modules had four, some five, and some had seven assignments. The instances of no submissions are relatively very low as compared to late submissions. Similar trend was missing in
the control group.
Tables 8 and 9 represent the late submission data for E1 and E2, respectively. Tables 10 and 11 present a cumulative summary of the assignments for E1 and E2, respectively.
Cumulatively, for both experimental groups, only about 2% of the total assignments were not submitted. This could mean many things; one of the possible explanations might be that given the right conditions, the students were willing to engage more.
Module 1 2 3 4 5 6 7 Total
1 0 0 0 0 - - - 0
2 0 0 0 0 0 0 - 0
3 0 0 0 0 - - - 0
4 0 1 0 1 0 0 - 2
5 0 0 0 0 1 - - 1
6 0 0 1 0 1 1 3 6
7 0 2 1 1 3 - - 7
Table 6: Assignments not submitted for group E1
Module 1 2 3 4 5 6 7 Total
1 0 0 1 0 - - - 1
2 0 0 0 1 1 0 - 2
3 0 0 0 0 - - - 0
4 2 2 0 2 1 0 - 7
5 0 1 0 0 0 - - 1
6 0 0 0 0 1 0 3 4
7 0 2 3 1 6 - - 12 Table 7: Assignments not submitted for
group E2
Module 1 2 3 4 5 6 7 Total
1 0 1 2 1 - - - 4
2 2 1 2 2 0 2 - 9
3 0 0 1 3 - - - 4
4 2 1 3 2 1 2 - 11
5 2 2 3 4 5 - - 16
6 2 1 4 4 2 1 5 19
7 2 5 6 5 4 - - 22
Table 8: Assignments submitted late for group E1
Module 1 2 3 4 5 6 7 Total
1 3 4 3 2 - - - 12
2 1 1 1 2 0 1 - 6
3 2 1 1 0 - - - 4
4 1 2 1 3 1 8 - 16
5 1 1 4 7 6 - - 19
6 2 2 3 1 0 4 3 15
7 3 5 2 1 8 - - 19 Table 9: Assignments submitted late for group
E2
Module
No Maximum Possible
Sub-missions
Not Sub-mitted
Late Sub-missions
1 88 0 4
2 132 0 9
3 88 0 4
4 132 2 11
5 110 1 16
6 154 6 19
7 110 7 22
Total 814 16(1.9%) 85(10.5%)
Table 10: Assignment Summary for E1

Information Systems Education Journal (ISEDJ) 19 (4) ISSN: 1545-679X August 2021
©2021 ISCAP (Information Systems and Computing Academic Professionals) Page 67
https://isedj.org/; https://iscap.info
Module
No
Maximum
Possible Sub-
missions
Not Sub-
mitted
Late Sub-
missions
1 88 1 12
2 132 2 6
3 88 0 4
4 132 7 16
5 110 1 19
6 154 4 15
7 110 1 19
Total 814 15(1.8%) 91(11.1%)
Table 11: Assignment Summary for E2
Late submissions were allowed with reduced credit, and cumulative late submission rate stands at about 10.5%, and 11%. The instances of both late and no submissions
increase as the course progresses, even though the rate of increase of no submissions is low as compared to late submissions. This may be explained by the fact that the concepts to be learned become complex as the course progresses, and some students might have given
up on some of the later stage assignments.
4. COURSE SURVEY AND DISCUSSION
An end of course survey was conducted for both
E1 and E2. Number of participants were 22, and 13 respectively, i.e., 35 students in total. The questions were primarily centered around the
potential impact of high number of assignments on their motivation, stress levels, and their choice between the instructional intervention and the orthodox method of single assignment per module used at our department. The full survey is listed in Appendix C.
One of the questions asked the students about how they felt about the utility and effectiveness of this intervention in completing the course satisfactorily. A surprising 90% of the students in E1 and 84% in E2 answered that they felt positive/better about using this technique while
10% in E1, and 9% in E2 reported that they felt slightly worse while working with this technique. Another question asked the students about the utility of doing a daily assignment in learning computer programming. A whopping 100% of the students in both E1 and E2 felt that it is useful. This gives us some confidence to assert that given
the right cognitive load and environment, students do see potential value in constant practice for learning programming.
Another important question asked the students
about their choice between the novel instructional technique and the normal course delivery mechanism of doing one assignment per week.
96% in E1, and 76% of students in E2 preferred the novel technique. On an aggregate level, 88% of the students said that they would prefer working every day, 6% preferred orthodox course delivery, and 6% showed no preference. Hence, the students overwhelmingly choose working everyday as a mode of course delivery over our
normal delivery method. This, we believe, is a very important piece of feedback for us. Students were also asked about their stress levels regarding doing so many assignments. A cumulative 45% of the students answered that working every day on assignments made it easy
for them to manage stress. Students remarked that the process made it easy to manage overall stress as the assignments were gradually increasing in difficulty. 39% said it increased their stress levels as they had to do many more assignments, and 15% choose that it
made no difference. The efficacy of this intervention cannot be generalized with such a small sample space, but the initial results do reveal some interesting insights. Many students seem to find working on incrementally difficult assignments beneficial,
even if it means working more time than usual. According to the assignment data collected and
student responses on the survey, most students show an inclination towards practicing more, as long as the cognitive load is manageable. This is evident from the minimal no-submission and late-
submission instances during module 1 to 5 that cover basic JAVA concepts. Module 6 and 7 cover complex concepts such as 2D arrays and file operations. Confirming our expectations, the instances of no-submission and late-submission rise during these modules. Overall, this technique, appears to
successfully increase student engagement with the course. It is no doubt that the workload of this technique
may be perceived as higher when compared to orthodox course delivery. The pressure of completing an assignment every day can still lead
to student demotivation, and may even exacerbate the de-motivational factor this technique was designed to mitigate. Results and responses, however, show that the technique successfully navigated these roadblocks.
A significant potential limitation of this technique is its resource intensiveness. Since students have

Information Systems Education Journal (ISEDJ) 19 (4) ISSN: 1545-679X August 2021
©2021 ISCAP (Information Systems and Computing Academic Professionals) Page 68
https://isedj.org/; https://iscap.info
do so many assignments, they tend to ask many
more questions about the concepts, as well as clarifications on assignments. Providing timely feedback is challenging even when the instructor
has a course grader. Grading so many assignments, in our experience, was one of the major concerns, as this may inadvertently lead to grading fatigue. Another important aspect was the continual and immediate presence of instructor and tutor
support. Without this perennial support, this technique may be rendered ineffective very quickly. Our experience in a more traditional approach is that about 50%-60% of the students asked questions on the day the assignments were due. Since students have a due date almost every
day of the week, it requires continuous tutor support due to sheer volume of the queries. If these questions remain unaddressed at the outset, it may cause learning gaps for the students. Since the subsequent assignments build on previous assignments, it may have a snowball effect, which is highly undesirable. The
daily deadlines were especially difficult for the full time working students. For them, as evidenced by comments in the survey, it was difficult to schedule time every day to finish the assignments.
5. CONCLUSION AND FUTURE WORK
Students in both experimental sections of our
introductory programming course agreed that working on incrementally difficult assignments everyday added value to their process of learning computer programming. It helped them practice consistently, thereby improving their enthusiasm
about the course and programming. Though there were no significant differences in the individual chapter quiz scores between the control and experimental groups, the experimental groups performed much better in the final exam. At an anecdotal level, it seems that it may be possible to affect the motivation levels of students using
this intervention. The end of course survey responses indicate that though the technique was very well received.
It would be too premature to consider the intervention as a success given the significant challenges this technique entails. Firstly, grading
a large number of assignments, and providing high volume of feedback is resource intensive. Hence, an automatic grader may be required to speed things up. Continuous tutor support is also required to help stem student frustration, and to give them the feeling that help is always
available.
Figure 2: Incrementally Scaffolded System:
An Abstraction
To mitigate the load on the instructor, tutor/grader and students while maintaining the integrity of the technique, we envisage coupling an automatic grading system with an artificial tutor bot, capable of answering basic questions about the course, assignments, and simple
concepts of programming. An abstract schemata of this system is shown in Figure 2. We are encouraged by the initial results of this study, and the promise of future research.
6. REFERENCES
Alexandron, G., Armoni, M., Gordon, M. & Harel, D. (2014). Scenario–based programming: Reducing the cognitive load, fostering
abstract thinking. In Companion Proceedings of the 36th International Conference on Software Engineering pp. 311–320.
Allan, V. H. & Kolesar, M. V. (1997). Teaching
computer science: a problem solving approach that works. ACM SIGCUE Outlook, 25(1–2), 2–10.
Biggs, J (1999). Teaching for Quality Learning at University. Society for Research Into Higher Education.
Beaubouef, T. B. & J. Mason (2005). Why the High Attrition Rate for Computer Science Students: Some Thoughts and Observations. Inroads – The SIGCSE Bulletin, 37(2), 103–106.
Bennedsen, J. & Caspersen, M. E. (2007). Failure rates in introductory programming. ACM SIGCSE Bulletin, 39(2), 32–36.
Brown, S. W., & Bennett, E. D. (2002). The role of practice and automaticity in temporal and nontemporal dual-task performance. Psychological Research, 66, 80–89.
Crego, Antonio, Carrillo-Diaz, María, Armfield, Jason M. & Romero, Martín (2016). Stress

Information Systems Education Journal (ISEDJ) 19 (4) ISSN: 1545-679X August 2021
©2021 ISCAP (Information Systems and Computing Academic Professionals) Page 69
https://isedj.org/; https://iscap.info
and Academic Performance in Dental
Students: The Role of Coping Strategies and Examination-Related Self-Efficacy Journal of Dental Education February 2016, 80 (2) 165-
172.
Dawar, D. (2020). An Assignment a Day Scaffolded Learning Approach for Teaching Introductory Computer Programming. Information Systems Education Journal 18(4) pp. 59-73.
Fallows, S., & Ahmet, K. (1999). Inspiring
Students: Case Studies in Motivating the Learner. Kogan Page Publishers.
Glover, J.A., Ronning, R.R. and Bruning, R.H.: 1990, Cognitive Psychology for Teachers,
Macmillan, New York.
Goold, A., and Rimmer, R. (2000). Factors
affecting performance in first-year computing. SIGCSE Bulletin 32, 39–43.
Howles, T. (2009). A study of attrition and the use of student learning communities in the computer science introductory programming sequence. Computer Science Education, 19(1), 1–13.
Kalchman, M., Moss, J., & Case, R. (2001). Psychological models for the development of mathematical understanding: Rational numbers and functions. In S. M. Carver & D. Klahr (Eds.), Cognition and instruction:
Twenty-five years of progress (pp. 1-38). Mahwah, NJ, US: Lawrence Erlbaum
Associates Publishers.
Kaplan, D. S., Liu, R. X., & Kaplan, H. B (2005). School related stress in early adolescence and academic performance three years later: The conditional influence of self-expectations. Social Psychology of Education, 8, 3-17.
Keller, J. M. (1983). Motivational design of instruction. In Instructional-Design Theories and Models: An Overview of their Current Status, C. M. Reigeluth, Ed. Lawrence Erlbaum Associates, pp. 383–434.
Kim, J. & Lerch, F. J. (1997). Why is programming (sometimes) so difficult? Programming as
scientific discovery in multiple problem spaces. Information Systems Research 8(1) 25–50.
Kinnunen, P. & Malmi, L. (2006). Why students drop out CS1 course?. In Proceedings of the Second International Workshop on Computing Education Research (pp. 97–108).
New York, NY: ACM.
McGregor, D. (1960). The Human Side of
Enterprise. McGraw Hill.
Mendes, A. J., Paquete, L., Cardoso, A. & Gomes, A. (2012). Increasing student commitment in
introductory programming learning. In Frontiers in Education Conference (FIE) (pp. 1–6). New York, NY: IEEE.
Moors, A., & Houwer, J. D. (2006). Automaticity: A Theoretical and Conceptual Analysis. Psychol Bull, 132(2), 297-326.
Newman, R., Gatward, R. & Poppleton, M. (1970).
Paradigms for teaching computer programming in higher education. WIT Transactions on Information and Communication Technologies, 7, 299–305.
Paas, F., Renkl, A., & Sweller, J. (2010). Cognitive Load Theory and Instructional Design: Recent
Developments. Educational Psychologist, 38 (1), 1-4.
Rist, R. S. (1986). Plans in Programming: Definition, Demonstration, and Development. In Soloway, E. & Iyengar, S., eds., Empirical Studies of Programmers. Norwood, NJ: Ablex Publishing, pp. 28–47.
Rist, R. S. (1989). Schema Creation in Programming. Cognitive Science, 13, 389–414.
Rist, R. S. (1995). Program Structure and Design. Cognitive Science, 19, 507–562.
Rist, R. S. (2004). Learning to Program: Schema Creation, Application, and Evaluation. In
Fincher, S. & Petre, M., eds., Computer Science Education Research. London, UK: Taylor & Francis, pp. 175–195.
Robins, A. V., Rountree, J. & Rountree, N. (2003). Learning and teaching programming: A review and discussion. Computer Science
Education 13(2) pp. 137–172.
Rogalski J. & Samurçay R. (1990). Acquisition of programming knowledge and skills. In J. M. Hoc, T. R. G. Green, R. Samurçay & D. J. Gillmore, eds., Psychology of Programming. London: Academic Press, pp. 157–174.
Sheard, J. & Hagan, D. (1998). Our failing
students: a study of a repeat group. ACM SIGCSE Bulletin, 30(3), 223–227.
Sorva, J. (2013). Notional machines and introductory programming education. ACM Transactions on Computing Education (TOCE), 13(2), Article 8.

Information Systems Education Journal (ISEDJ) 19 (4) ISSN: 1545-679X August 2021
©2021 ISCAP (Information Systems and Computing Academic Professionals) Page 70
https://isedj.org/; https://iscap.info
Sweller, J. (1988). Cognitive load during problem
solving: Effects on learning. Cognitive Science, 12(2), 257–285.
Sweller, J. (1994). Cognitive load theory, learning
difficulty, and instructional design. Learning and Instruction, 4(4), 295–312.
Watson, C. & Li, F. W. (2014). Failure rates in introductory programming revisited. In
Proceedings of the 2014 Conference on
Innovation & Technology in Computer Science Education (pp. 39–44). New York, NY: ACM.
Winslow L E (1996) Programming pedagogy – A psychological overview. ACM SIGCSE Bulletin, 28(3), 17–22.
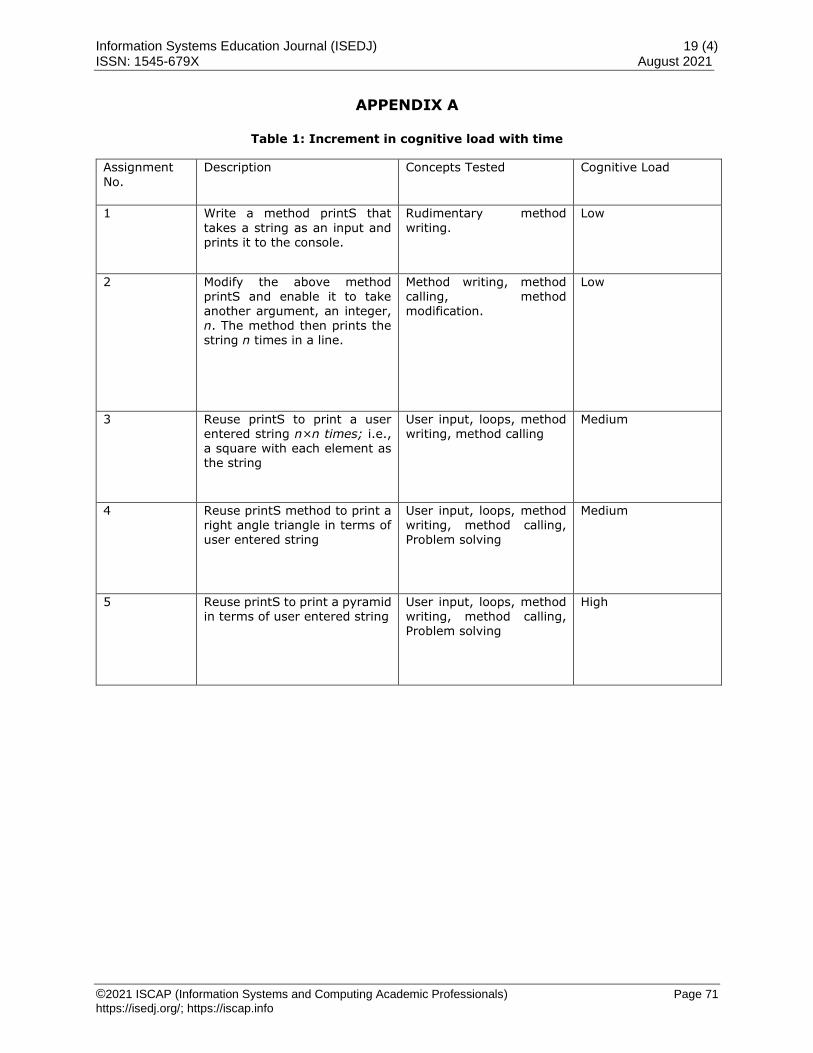
Information Systems Education Journal (ISEDJ) 19 (4) ISSN: 1545-679X August 2021
©2021 ISCAP (Information Systems and Computing Academic Professionals) Page 71
https://isedj.org/; https://iscap.info
APPENDIX A
Table 1: Increment in cognitive load with time
Assignment
No.
Description Concepts Tested Cognitive Load
1 Write a method printS that
takes a string as an input and prints it to the console.
Rudimentary method
writing.
Low
2 Modify the above method printS and enable it to take another argument, an integer, n. The method then prints the string n times in a line.
Method writing, method calling, method modification.
Low
3 Reuse printS to print a user entered string n×n times; i.e., a square with each element as the string
User input, loops, method writing, method calling
Medium
4 Reuse printS method to print a right angle triangle in terms of user entered string
User input, loops, method writing, method calling, Problem solving
Medium
5 Reuse printS to print a pyramid in terms of user entered string
User input, loops, method writing, method calling, Problem solving
High

Information Systems Education Journal (ISEDJ) 19 (4) ISSN: 1545-679X August 2021
©2021 ISCAP (Information Systems and Computing Academic Professionals) Page 72
https://isedj.org/; https://iscap.info
APPENDIX B

Information Systems Education Journal (ISEDJ) 19 (4) ISSN: 1545-679X August 2021
©2021 ISCAP (Information Systems and Computing Academic Professionals) Page 73
https://isedj.org/; https://iscap.info

Information Systems Education Journal (ISEDJ) 19 (4) ISSN: 1545-679X August 2021
©2021 ISCAP (Information Systems and Computing Academic Professionals) Page 74
https://isedj.org/; https://iscap.info
APPENDIX C

Information Systems Education Journal (ISEDJ) 19 (4) ISSN: 1545-679X August 2021
©2021 ISCAP (Information Systems and Computing Academic Professionals) Page 75
https://isedj.org/; https://iscap.info

Information Systems Education Journal (ISEDJ) 19 (4) ISSN: 1545-679X August 2021
©2021 ISCAP (Information Systems and Computing Academic Professionals) Page 76
https://isedj.org/; https://iscap.info

Information Systems Education Journal (ISEDJ) 19 (4) ISSN: 1545-679X August 2021
©2021 ISCAP (Information Systems and Computing Academic Professionals) Page 77
https://isedj.org/; https://iscap.info
Class Participation and Student Performance:
A Follow-up Study
Ernst Bekkering
Ted Ward
[email protected] Department of Mathematics and Computer Science
Northeastern State University Tahlequah, OK 74464
Abstract Student attendance in class, and participation while in class, are predictors of student performance. Last year, we reported on a new measure combining class attendance and attentiveness while in class and used this participation score as a predictor of student performance on the final exam in the class. This year, we follow up by analyzing data for four classes in the Fall semester of 2019. In each class, and for
the four classes combined, we found a statistically significant relationship between participation and score on the final exam. Keywords: participation, attendance, attentiveness, distraction, student performance
1. INTRODUCTION
Traditionally, education has taken place in face-to-face environments. The advent of distance education started in the 19th century with correspondence courses, followed by television-based courses in the mid-20th century, but the real growth of distance education occurred with
the development of the Internet in the late 20th and early 21st century (Visual Academy, 2020). The Internet enabled three forms of interactivity: interaction with content, with the instructor, and with other learners (Craig, 2020). Class participation is becoming more important than pure class attendance alone (Büchele, 2020).
When most classes were still taught face to face, participation was measured in terms of coming to class (attendance). Romer (1993) advocated mandatory attendance based on the strong relationship between attendance and performance. Other researchers examined the
usefulness of different participatory metrics (hand raising, response cards, clickers). In the Internet environment, measures of attendance
focused on time spent on the course site, clicks, and pages visited. Participation shifted to making
meaningful contributions in email conversations and on discussion boards. In general, research shows that active class participation improves subjective and objective student performance. Students perceive that they do better in class, and objective criteria like Grade Point Average
(Credé, Roch, & Kieszczynky, 2010) and scores on final exams confirm this (Duncan, Kenworthy, Mcnamara, & Kenworthy, 2012; Irwin, Burnett, & McCarron, 2018). Over the last twenty years the possibilities for virtual delivery have blossomed as networks have
greatly improved in speed, stability, and ease of connectivity. In 1998, dial-up internet was still limited to 56Kbps and connections had to be set up for each session. Broadband started to replace dial-up in the early 2000s and provided always-on connections in the Mbps range. Currently, fiber-optic broadband provides speeds in the
Gigabit range. Additionally, users are no longer limited to wired connections. Wireless connections are now fast enough to be useful in
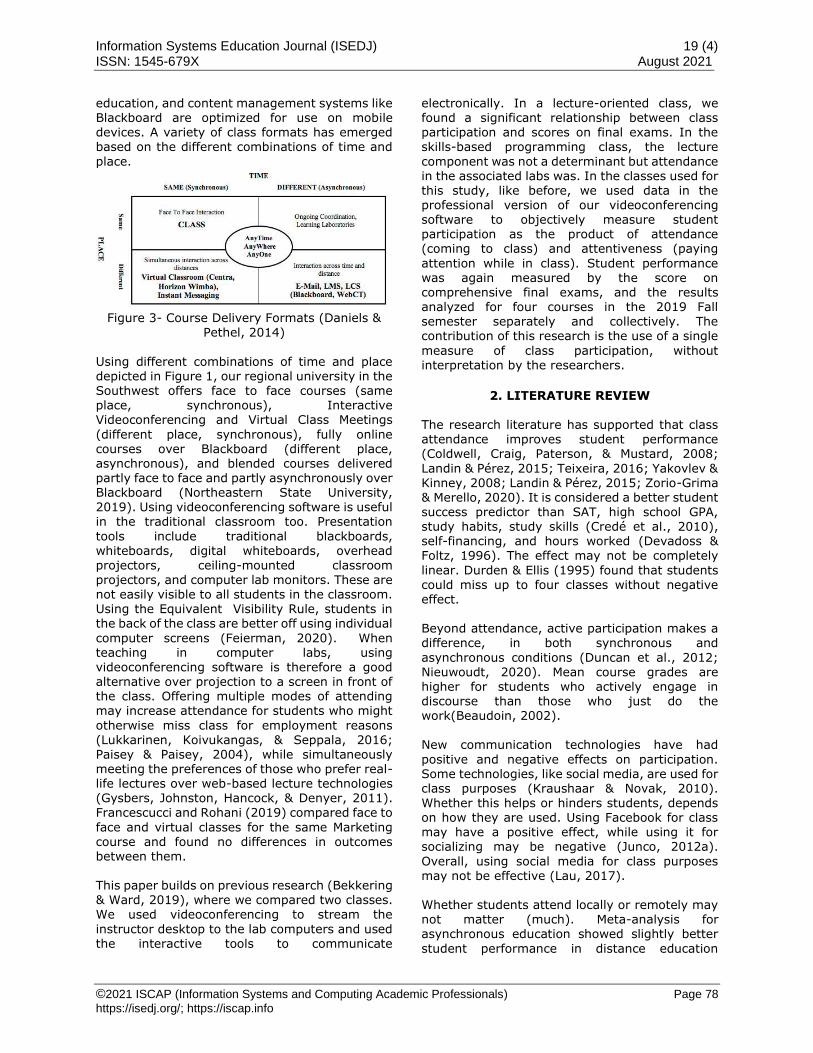
Information Systems Education Journal (ISEDJ) 19 (4) ISSN: 1545-679X August 2021
©2021 ISCAP (Information Systems and Computing Academic Professionals) Page 78
https://isedj.org/; https://iscap.info
education, and content management systems like
Blackboard are optimized for use on mobile devices. A variety of class formats has emerged based on the different combinations of time and
place.
Figure 3- Course Delivery Formats (Daniels &
Pethel, 2014)
Using different combinations of time and place depicted in Figure 1, our regional university in the Southwest offers face to face courses (same place, synchronous), Interactive Videoconferencing and Virtual Class Meetings
(different place, synchronous), fully online courses over Blackboard (different place, asynchronous), and blended courses delivered partly face to face and partly asynchronously over Blackboard (Northeastern State University, 2019). Using videoconferencing software is useful in the traditional classroom too. Presentation
tools include traditional blackboards, whiteboards, digital whiteboards, overhead projectors, ceiling-mounted classroom
projectors, and computer lab monitors. These are not easily visible to all students in the classroom. Using the Equivalent Visibility Rule, students in the back of the class are better off using individual
computer screens (Feierman, 2020). When teaching in computer labs, using videoconferencing software is therefore a good alternative over projection to a screen in front of the class. Offering multiple modes of attending may increase attendance for students who might
otherwise miss class for employment reasons (Lukkarinen, Koivukangas, & Seppala, 2016; Paisey & Paisey, 2004), while simultaneously meeting the preferences of those who prefer real-life lectures over web-based lecture technologies (Gysbers, Johnston, Hancock, & Denyer, 2011).
Francescucci and Rohani (2019) compared face to
face and virtual classes for the same Marketing course and found no differences in outcomes between them. This paper builds on previous research (Bekkering & Ward, 2019), where we compared two classes. We used videoconferencing to stream the
instructor desktop to the lab computers and used the interactive tools to communicate
electronically. In a lecture-oriented class, we
found a significant relationship between class participation and scores on final exams. In the skills-based programming class, the lecture
component was not a determinant but attendance in the associated labs was. In the classes used for this study, like before, we used data in the professional version of our videoconferencing software to objectively measure student participation as the product of attendance (coming to class) and attentiveness (paying
attention while in class). Student performance was again measured by the score on comprehensive final exams, and the results analyzed for four courses in the 2019 Fall semester separately and collectively. The contribution of this research is the use of a single
measure of class participation, without interpretation by the researchers.
2. LITERATURE REVIEW The research literature has supported that class attendance improves student performance (Coldwell, Craig, Paterson, & Mustard, 2008;
Landin & Pérez, 2015; Teixeira, 2016; Yakovlev & Kinney, 2008; Landin & Pérez, 2015; Zorio-Grima & Merello, 2020). It is considered a better student success predictor than SAT, high school GPA, study habits, study skills (Credé et al., 2010), self-financing, and hours worked (Devadoss & Foltz, 1996). The effect may not be completely
linear. Durden & Ellis (1995) found that students
could miss up to four classes without negative effect. Beyond attendance, active participation makes a difference, in both synchronous and
asynchronous conditions (Duncan et al., 2012; Nieuwoudt, 2020). Mean course grades are higher for students who actively engage in discourse than those who just do the work(Beaudoin, 2002). New communication technologies have had
positive and negative effects on participation. Some technologies, like social media, are used for class purposes (Kraushaar & Novak, 2010).
Whether this helps or hinders students, depends on how they are used. Using Facebook for class may have a positive effect, while using it for socializing may be negative (Junco, 2012a).
Overall, using social media for class purposes may not be effective (Lau, 2017). Whether students attend locally or remotely may not matter (much). Meta-analysis for asynchronous education showed slightly better
student performance in distance education

Information Systems Education Journal (ISEDJ) 19 (4) ISSN: 1545-679X August 2021
©2021 ISCAP (Information Systems and Computing Academic Professionals) Page 79
https://isedj.org/; https://iscap.info
courses (Allen, Mabry, Mattrey, Bourhis,
Titsworth, & Burrell, 2004) , but synchronous education may be equivalent to the physical classroom (Mullen, 2020). With a wide variation
in effect, positives may cancel out negatives especially when students have additional tasks to perform (Bernard, Abrami, Lu, Borkhovski, Wade, Wozney, Wallet, Fiset, & Huang, 2004). When the task load is identical, for local and distant students in a videoconferencing setting, student performance is the same (MacLaughlin,
Supernaw, & Howard, 2004). Interaction may make the difference: distance education with collaborative discussions is more effective than independent study only (Lou, Bernard, & Abrami, 2006). Just recording lectures and posting notes online may not meet students’ needs (Gysbers et
al., 2011). For synchronous online session, special attention tracking tools may be available. Zoom had an attention tracking feature until April 2020, when it was removed for security and privacy reasons (Yuan, 2020). Cisco Webex still provides group and individual attentiveness indicators and participant attention reports (Cisco
Webex, 2018) Class Participation Active participation in class can take multiple forms. In face to face classes, participation can mean the use of response cards and hand-raising (Christle & Schuster, 2003; Gardner, Heward, &
Grossi, 1994; Narayan, Heward, Gardner, Courson, & Omness, 1990). Sometimes, special
tools like clickers were used (Stowell & Nelson, 2007), but also cellphones for text messaging (Nkhoma, Thomas, Nkhoma, Sriratanaviriyaku, Truong, & Vo, 2018; L.-C. C. Wang & Morgan,
2008). In the online environment, the initial measurement of participation in asynchronous classes might be with pages visited, tools used, messages accessed, discussions posted, and email contacts (Coldwell et al., 2008; Douglas & Alemanne, 2007; Romero, Lopez, Luna, & Ventura, 2013). Some novel tools like location
and Bluetooth data have been used (Kassarnig, Bjerre-Nielsen, Mones, Lehmann, & Lassen, 2017), as has spyware installed on student laptops to check browsing and application use
(Kraushaar & Novak, 2010), but these are more for research and not for day-to-day teaching.
In the digital environment, all modern Learning Management Systems (LMS) provide some form of videoconferencing to enable virtual class meetings. Moodle has a Videoconference Edition (Moodle, Inc., 2019). Blackboard offers the Blackboard Collaborate module (BlackBoard Inc,
2019). Canvas includes the Conferences tool (Canvas LMS Community, 2019). Zoom is not an
LMS, but it is often used in education and can be
integrated in Blackboard, Moodle, and other platforms.
Modern videoconferencing software provide multiple interaction tools. Some of them are based on their physical counterparts, such as voice communication and virtual hand raising. Information can be shared through programs such as PowerPoint, sharing of the presenter’s desktop, whiteboards, slideshows, and sharing of
online videos. Collaboration tools include chat messages, annotation and drawing tools on shared desktops, and transfer of control over mouse and keyboard. These tools transform the shared view into two-way communication between instructor and students (SJSU, 2018)
Finally, some forms of interaction scale better than others. Multiple choice quizzes work well for any size audience, but voice discussions are best limited to small groups (Garner, 2018). Student Performance
Once we assume that class attendance and class participation influence how well students do in class, we need to select a way to measure their performance. Multiple metrics have been used to measure student performance. Most frequently used are readily-available items like course grades (Beaudoin, 2002; Durden & Ellis, 1995;
Kassarnig et al., 2017; Teixeira, 2016), term GPA (Wang, Harari, Hao, Zhou, & Campbell., 2015),
cumulative GPA (Lau, 2017), self-reported GPA (Kirschner & Karpinski, 2010), GPA obtained from registrars (Junco, 2012a), course credits (Giunchiglia, Zeni, Gobbi, Bignotti, & Bison,
2018), scores on final exams (Duncan et al., 2012; Lukkarinen et al., 2016) and finishing the course (Coldwell et al., 2008; Junco, 2012b). Occasionally, pre-tests and post-tests (Omar, Bhutta, & Kalulu, 2009), student ranking (Felisoni & Godoi, 2018) or multi-item scales are used (Yu, Tian, Vogel, & Chi-Wai Kwok, 2010).
On the other hand, a significant number of studies rely on self-report by students (Junco & Cotten, 2011), including self-report of GPA and hours
spent studying (Kirschner & Karpinski, 2010). However, some caution must be used since self-report may not be as reliable (Kuncel, Crede, &
Thomas, 2005) Multitasking Using computers, cell phones, and other technology does present new problems. McCoy (2016) reported that students used digital
devices 11.43 times per school day. More than 25% of effective class time may be spent on the

Information Systems Education Journal (ISEDJ) 19 (4) ISSN: 1545-679X August 2021
©2021 ISCAP (Information Systems and Computing Academic Professionals) Page 80
https://isedj.org/; https://iscap.info
phone (Kim, Kim, Kim, Kim, Han, Lee, Mark, &
Lee, 2019). Students often alternate between class-related and non-class-related computer use (Fried, 2008; Grace-Martin & Gay, 2001;
Hembrooke & Gay, 2003; Janchenko, Rodi, & Donohoe, 2018). Cell phone use among college students is becoming an addiction (Roberts, Yaya, & Manolis, 2014). Multitasking in class has evolved with the technology of the day. When laptops entered the
classroom, instant messaging and web browsing were major distractions (Fox, Rosen, & Crawford, 2009; Hembrooke & Gay, 2003). Later, Facebook became a major distractor (Kirschner & Karpinski, 2010). Now, mobile phones provide yet another source of distraction (Chen & Yan, 2016; Harman
& Sato, 2011). Cell phone applications include WhatsApp (Ahad & Lim, 2014), Snapchat and Instagram (Griffin, 2014). The negative effect of using cellphones is especially high when it takes place in class (Felisoni & Godoi, 2018), and lower performing students are especially at risk (Beland & Murphy, 2016; Chiang & Sumell, 2019). Beland
and Murphy (2016) also found significant improvement in high stakes exam scores after mobile phones were banned. Multitasking with technology negatively affects participation and student performance, subjectively (Junco & Cotten, 2011) and
objectively (Amez, Vujic, De Marex, & Baert, 2020b; Amez & Baert, January 1, 2020a; Junco &
Cotten, 2012; Kates, Wu, & Coryn, 2018). Students do not necessarily recognize the negative effect. In a study of Malaysian university students, respondents felt that they performed
better as Facebook usage increased (Ainin, Naqshbandi,Moghavvemi, & Jaafar, 2015). The general research consensus holds that multitasking does have a negative effect on student performance (Bellur, Nowak, & Hull, 2015; Burak, 2012; Junco & Cotten, 2012; Kraushaar & Novak, 2010; Kuznekoff, Munz, &
Titsworth, 2015; MacLaughlin et al., 2004), although the causality has not yet been established (van der Schuur, Baumgartner, Sumter, & Valkenburg, 2015). Controlled
experiments show that actual performance may be the same, but the time to achieve it is longer (Bowman, Levine, Waite, & Genfron, 2010;
Rubinstein, Meyer, & Evans, 2001). While some studies fail to demonstrate differences between performance of cognitive tasks with and without distraction, they do show decreased efficiency of information processing (End, Worthman, Mathews,& Wetterau, 2010) and increased
memory errors (Rubinstein et al., 2001).
3. METHODOLOGY
Data for the four classes in this study were automatically recorded by the videoconferencing
software. Data points were join time, leave time, and attentiveness score for each student in each course. Students were allowed to enter the class before it started, and before the instructor. If students entered early, the official start time of the class was used. The instructor used the full class period and closed the session after the class
was officially over. If students left after the class was officially over, the official closing time was used. Network interruptions or equipment problems occasionally dropped students from the session, and they could immediately rejoin the class without instructor intervention. The
attentiveness score reflected the percentage of time that the focus of the student’s computer was on the desktop shared by the instructor. The syllabus explained the attentiveness statistic and instructed the students to maximize the class window to avoid accidental low scores. All lectures were recorded and generally available
online after two hours and use of pen and paper for notes was suggested. Students had to use a computer with mouse and keyboard and keep the camera on at all times. Participation scores were calculated each week by multiplying the attendance and attentiveness
scores. For instance, if a student was 10 minutes late in a 50-minute class, attendance was 80%.
Likewise, if a student had the shared instructor desktop in focus only half of the time, the attentiveness score was 50%. If a student was 10 minutes late and did not keep the shared desktop
in focus half the time, the participation score was 40%. At the end of the week, each day’s participation score was posted to the gradebook for the class. For days when students were disconnected one or more times, the sum of the products for the partial sessions was used. At the end of the semester, students with average
participation below 80% lost one letter grade, and two letter grades if below 60%. The four classes in the study involved two face to
face classes in computer labs and two Virtual Class Meetings. The university defines Virtual Class Meetings as follows: “Virtual class meeting
courses allow students to use their home or university computer to attend class at designated times” (Northeastern State University, 2019). In other words, both formats are synchronous but virtual class meetings are location-independent and face to face classes are not. The same
videoconferencing software was used in all classes. Face to face classes were taught in

Information Systems Education Journal (ISEDJ) 19 (4) ISSN: 1545-679X August 2021
©2021 ISCAP (Information Systems and Computing Academic Professionals) Page 81
https://isedj.org/; https://iscap.info
computer labs, did not use overhead projectors or
whiteboards, and streamed the session directly to the students’ lab computers. All applications were shared on the instructor’s desktop. Various
features of the videoconferencing software were used to increase student participation. Students could use annotation and drawing tools on the shared desktop to ask questions, post comments, and make annotations anonymously. The Chat feature was used to post questions and comments, and answers to instructor questions.
Finally, having students take over control over mouse and keyboard was used to have students demonstrate their understanding on the common desktop. Regardless of online or local delivery, all these techniques were used to lesser or greater extent. Students in the face-to-face classes were
also allowed to participate remotely to maximize attendance. No records were kept regarding local or remote attendance for face-to-face classes. The first class, CS 3403 Data Structures, is one of the core classes in the curriculum. It was taught as a virtual class meeting twice a week for 75
minutes. The course covered common data structures and algorithms in Computer Science and used Python programming projects to illuminate the concepts. The final exam consisted of a comprehensive multiple-choice test worth 40% of the course grade. Twenty-nine students started the course, and 24 took the final exam.
The second class, CS 3643 Programming for
Cyber Security, was an elective class taught as a face-to-face class twice weekly for 75 minutes. The course covered general cybersecurity concepts and problems and used virtual machines
with Python programs to illustrate the material. The final exam consisted of a comprehensive multiple-choice test worth 40% of the course grade. Fifteen students started the course, and 11 took the final exam. The third class, CS 4203 Software Engineering, is
another core class in the CS curriculum. It was taught as a virtual class meeting thrice weekly for 50 minutes. The course covered the development process including analysis, modeling, and testing.
UML models were developed with online software, and testing was done with a scripting language. The final exam consisted of a comprehensive
multiple-choice test worth 40% of the course grade. Twenty-nine students started the course, and 28 took the final exam. The final class, CS 4223 Game Programming, was an elective class taught face to face. The class
met twice weekly for 75 minutes. The course was heavily project based with hands-on projects due
every two weeks and used Unity with Visual
Studio to develop the games. The final exam was an in-class programming project worth 30% of the course grade. Twenty-seven students started
the course, and 22 students took the final exam. One student got a zero score for the final exam for failure to follow final exam instructions. Activity Reports The videoconferencing software can generate multiple reports. For this study, we used the
details report which can list each login for each course meeting for a period of up to a month. Data include topic, join time, leave time, and the “attentiveness score.” Attentiveness in this context was defined as the percent of time that the shared Zoom window was in focus. If a
student was logged in but used another application, this did not contribute to attentiveness. If students got disconnected during class and connected again, each partial session would have its own attentiveness score. Unfortunately, the attentiveness score was removed from all reports during the COVID-19
crisis (Yuan, 2020).
4. SAMPLE STATISTICS As usual in Computer Science, the majority of students were male, traditional full-time students in their late teens and early twenties who finished the course and took the final. Details are listed in
Table 1.
course female male
CS3403 7 22
non-traditional 1
final 1
traditional 6 22
final 6 17
no_final 5
CS3643 1 14
traditional 1 14
final 1 9
no_final 5
CS4203 7 22
non-traditional 1
final 1
traditional 6 22
final 6 21
no_final 1
CS4223 5 22
non-traditional 1
no_final 1
traditional 4 22
final 3 18
no_final 1 4
Table 1 - Sample Statistics

Information Systems Education Journal (ISEDJ) 19 (4) ISSN: 1545-679X August 2021
©2021 ISCAP (Information Systems and Computing Academic Professionals) Page 82
https://isedj.org/; https://iscap.info
Class attendance and attentiveness data were
automatically recorded by Zoom, since students were required to log in to the class sessions. Participation scores were posted on the
Blackboard gradebook every two weeks, and students who scored low on participation early in the course received an email with separate data for attendance and attentiveness to explain why their scores were low. Since we measured the influence of conditions in for each student in one course only, we used the final exam in the course
to measure performance. The final multiple-choice exam was posted using the course delivery system and scores automatically calculated. Questions and answers were reviewed based on less than 50% correct answers, and no questions were found to be incorrectly stated.
5. ANALYSIS The data was analyzed in anonymous form. Daily Activity Reports were downloaded in CSV files and copied to one sheet of a spreadsheet, final exam scores were downloaded from the Blackboard gradebook and copied to another sheet, and a
third sheet was used as a lookup table with student names and random numbers between 1111 and 9999. Next, we corrected for absences which were not reflected in the activity reports. All absences received a zero score for participation, as no time
was spent in class. Absences were not corrected
for excused absences, such as attendance of events sanctioned by Academic Affairs. Students who did not finish the class and did not take the final exam were included with a zero score for the final. Final exam scores were standardized to a
percent of possible points by dividing the actual score by the maximum of 300 or 400 points. Student names in the activity reports and the final exam scores sheet were replaced with the random numbers, and linked in a fourth sheet combining the student participation with their
grades on the final exam. This sheet with random numbers, participation score, and standardized final exam score was exported in CSV format and
imported in SPSS. The data were analyzed with linear regression at the course level and at the semester level (all
courses combined). Descriptive statistics show that some students reached perfect participation and perfect scores on the final exams. Appendix A lists the descriptive statistics first at the semester level, and then at the course level.
Linear regression at the semester level, with all
courses combined, showed a statistically significant relationship between the independent participation variable and the dependent
performance variable. The level of significance was .000 for the regression and .000 for participation. The R Square statistic was strong at .648, indicating that 64% of the variance in student performance was explained by student participation. Since we used only one independent variable, the unstandardized
coefficient for participation was reviewed. At a level of 1.094, each percent increase in participation was related to about a percent of increase in performance. Appendix B shows the output of the semester level analysis.
At the course level, linear regression showed a similar result. The significance for regression in each course was .000, indicating a statistically significant relationship. The R Square statistic varied between a low of .465 and a high of .933. Coefficients for participation were all slightly above 1, again indicating that each percent
increase in participation was related to about a percent increases in performance. Appendix C shows the output of the course level analysis.
6. CONCLUSIONS AND RECOMMENDATIONS Based on these results, it appears that class participation, defined as the combination of
coming to class and paying attention while there,
is a good predictor of student performance. This would appear to be a no-brainer, but in this age where students often work significant hours and/or have family obligations, the importance of coming to class and spending this time
productively should not be underestimated. Using the participation statistic as part of the total number of points in the course can also help motivate students to change behavior in a positive manner. When students notice that the participation score is low, it is easy to see whether this is due to being distracted in class, or not
coming to class altogether. Since the videoconferencing software does not record attentiveness when students are not in class, the
percent time in class is a perfect indicator for attendance and the attentiveness score a good indicator for focus while they are there.
This does not mean that attentiveness as measured by computer focus on the shared desktop is perfect. Students can keep other applications open, especially on dual monitors,
and quickly click back and forth. The videoconferencing software only samples focus

Information Systems Education Journal (ISEDJ) 19 (4) ISSN: 1545-679X August 2021
©2021 ISCAP (Information Systems and Computing Academic Professionals) Page 83
https://isedj.org/; https://iscap.info
every 30 seconds. They can also use cell phones
to play, and dependent on the positioning of the phone, this may not be very apparent even when the camera is on and students have to keep their
face in view. Conversely, students could log with their cell phone and play on the computer if use of cell phones is not prohibited. Students could use two computers. It is even possible to record short videos with a webcam, leaving the meeting, and running the video as a background in a loop (Clark, 2020). Fortunately, there are many
communication tools instructors can use to facilitate active participation. Chat boxes record messages by name, annotation pointers have names, students can have designated areas on the shared desktop to respond, individual students can be called on to take over control of
mouse and keyboard, and so on. Unfortunately, attentiveness tracking is no longer available in the videoconferencing software used. During the CoVid-19 pandemic, use of the software increased dramatically. This made it an attractive target for outsiders to intrude and
disrupt the session with unwanted graphic content. In response, the software provider introduced several security and privacy measures, which unfortunately included the removal of the attentiveness score we used. Maybe it will be available in the future, and maybe in selected versions or subscription levels. In the
meantime, this analysis demonstrates the benefit of not only attending class but paying attention
while there. Future avenues for research include analyzing the data with attendance and attentiveness as separate independent variables. Due to the loss of attentiveness tracking, we also
need to develop alternative measures of measuring active participation while in class and encouraging students to decrease lurking behaviors. In the current educational climate with infectious diseases affecting course delivery mechanisms,
we expect an accelerated move towards more flexible class formats. Courses do not have to be purely face to face, and students should be able to seamlessly switch between face to face and
virtual formats. Allowing students to switch between face to face and synchronous virtual attendance will help to keep attendance high, and
measures to increase two-way communication between instructors and students will help to maintain the quality of instruction.
7. REFERENCES
Ahad, A. D., & Lim, S. M. A. (2014). Convenience or Nuisance?: The ‘WhatsApp’ Dilemma.
Procedia - Social and Behavioral Sciences, 155, 189–196.
Ainin, S., Naqshbandi, M. M., Moghavvemi, S., & Jaafar, N. I. (2015). Facebook usage, socialization and academic performance. Computers & Education, 83, 64–73.
Allen, M., Mabry, E., Mattrey, M., Bourhis, J.,
Titsworth, S., & Burrell, N. (2004). Evaluating the Effectiveness of Distance Learning: A Comparison Using Meta-Analysis. Journal of Communication, 54(3),
402–420.
Amez, S., & Baert, S. (January 1, 2020a).
Smartphone use and academic performance: A literature review. International Journal of Educational Research, 103, 101618.
Amez, S., Vujic, S., De Marez, L., & Baert, S. (2020b). Smartphone Use and Academic Performance: First Evidence from
Longitudinal Data (SSRN Scholarly Paper ID 3521679). Social Science Research Network.
Beaudoin, M. F. (2002). Learning or lurking? Tracking the ‘“invisible”’ online student. Internet and Higher Education, 5(2), 147–
155.
Bekkering, E., & Ward, T. (2019, November 6).
Class Participation and Student Performance: A Tale of Two Courses. 2019 Proceedings of the EDSIG Conference. EDSIG Conference on Information Systems & Computing Education, Cleveland, OH.
Beland, L.-P., & Murphy, R. (2016). Ill
Communication: Technology, distraction & student performance. Labour Economics, 41, 61–76.
Bellur, S., Nowak, K. L., & Hull, K. S. (2015). Make it our time: In class multitaskers have lower academic performance. Computers in Human Behavior, 53, 63–70.
Bernard, R. M., Abrami, P. C., Lou, Y., Borokhovski, E., Wade, A., Wozney, L., Wallet, P. A., Fiset, M., & Huang, B. (2004). How Does Distance Education Compare with Classroom Instruction? A Meta-Analysis of the Empirical Literature. Review of Educational Research, 74(3), 379–439.
BlackBoard Inc. (2019). Blackboard Collaborate. https://www.blackboard.com/online-

Information Systems Education Journal (ISEDJ) 19 (4) ISSN: 1545-679X August 2021
©2021 ISCAP (Information Systems and Computing Academic Professionals) Page 84
https://isedj.org/; https://iscap.info
collaborative-learning/blackboard-
collaborate.html
Bowman, L. L., Levine, L. E., Waite, B. M., & Gendron, M. (2010). Can students really
multitask? An experimental study of instant messaging while reading. Computers & Education, 54(4), 927–931.
Büchele, S. (2020). Evaluating the link between attendance and performance in higher education: The role of classroom engagement dimensions. Assessment &
Evaluation in Higher Education, 6(2), 1–19.
Burak, L. (2012). Multitasking in the University Classroom. International Journal for the Scholarship of Teaching and Learning, 6(2),
1–12.
Canvas LMS Community. (2019). What are
Conferences? https://community.canvaslms.com/docs/DOC-10738
Chen, Q., & Yan, Z. (2016). Does multitasking with mobile phones affect learning? A review. Computers in Human Behavior, 54, 34–42.
Chiang, E. P., & Sumell, A. J. (2019). Are your students absent, not absent, or present? Mindfulness and student performance. The Journal of Economic Education, 50(1), 1–16.
Christle, C. A., & Schuster, J. W. (2003). The
Effects of Using Response Cards on Student Participation, Academic Achievement, and
On-Task Behavior During Whole-Class, Math Instruction. Journal of Behavioral Education, 12(3), 147–165.
Cisco Webex. (2018, July 12). Webex—Track Participant Attention in Cisco Webex Training. https://help.webex.com/en-
us/st7tr1/Track-Participant-Attention-in-Cisco-Webex-Training
Clark, B. (2020, March 23). People are skipping Zoom meetings by looping videos of themselves paying attention. The Next Web. https://thenextweb.com/corona/2020/03/23/adapt-evolve-overcome/
Coldwell, J., Craig, A., Paterson, T., & Mustard, J. (2008). Online Students: Relationships between Participation, Demographics and Academic Performance. 6(1), 10.
Craig, R. (2020). A Brief History (And Future) Of Online Degrees. Forbes. https://www.forbes.com/sites/ryancraig/20
15/06/23/a-brief-history-and-future-of-online-degrees/
Credé, M., Roch, S. G., & Kieszczynka, U. M.
(2010). Class Attendance in College: A Meta-Analytic Review of the Relationship of Class Attendance With Grades and Student
Characteristics. Review of Educational Research, 80(2), 272–295.
Daniels, T., & Pethel, M. (2014, December 8). Computer Mediated Instruction—Emerging Perspectives on Learning, Teaching and Technology. http://epltt.coe.uga.edu/index.php?title=Co
mputer_Mediated_Instruction
Devadoss, S., & Foltz, J. (1996). Evaluation of Factors Influencing Student Class Attendance and Performance. American Journal of Agricultural Economics, 78(3),
499–507.
Douglas, I., & Alemanne, N. D. (2007). Measuring student participation and effort. IADIS International Conference on Cognition and Exploratory Learning in Digital Age, Algarve, Portugal.
Duncan, K., Kenworthy, A. L., Mcnamara, R., & Kenworthy, D. A. (2012). The Effect of
Synchronous and Asynchronous Participation on Performance in Online Accounting Courses. Accounting Education, 21(4), 431–449.
Durden, G. C., & Ellis, L. V. (1995). The Effects of Attendance on Student Learning in Principles
of Economics. The American Economic
Review, 85(2), 343–346.
End, C. M., Worthman, S., Mathews, M. B., & Wetterau, K. (2010). Costly Cell Phones: The Impact of Cell Phone Rings on Academic Performance. Teaching of Psychology, 37(1), 55–57.
Feierman, A. (2020, April 30). Equivalent Visibility and The 4/6/8 Rules—Choosing the right Display Size For Each Classroom. Projector Reviews. https://www.projectorreviews.com/articles-guides/equivalent-visibility-and-the-4-6-8-rules-choosing-the-right-display-size-for-
each-classroom/
Felisoni, D. D., & Godoi, A. S. (2018). Cell phone usage and academic performance: An experiment. Computers & Education, 117, 175–187.
Fox, A. B., Rosen, J., & Crawford, M. (2009). Distractions, Distractions: Does Instant
Messaging Affect College Students’ Performance on a Concurrent Reading
Information Systems Education Journal (ISEDJ) 19 (4) ISSN: 1545-679X August 2021
©2021 ISCAP (Information Systems and Computing Academic Professionals) Page 85
https://isedj.org/; https://iscap.info
Comprehension Task? CyberPsychology &
Behavior, 12(1), 51–53.
Francescucci, A., & Rohani, L. (2019). Exclusively Synchronous Online (VIRI) Learning: The
Impact on Student Performance and Engagement Outcomes. Journal of Marketing Education, 41(1), 60–69.
Fried, C. B. (2008). In-class laptop use and its effects on student learning. Computers & Education, 50(3), 906–914.
Gardner, R., Heward, W. L., & Grossi, T. A.
(1994). Effects of Response Cards on Student Participation and Academic Achievement: A Systematic Replication with Inner-City Students During Whole-Class
Science Instruction. Journal of Applied Behavior Analysis, 27(1), 63–71.
Garner, B. (2018, April 6). Distance Learning Methods Which Scale: A Review of the Literature. 2018 Proceedings of the Information Systems Education Conference. ISECON, San Antoinio, Texas.
Giunchiglia, F., Zeni, M., Gobbi, E., Bignotti, E., & Bison, I. (2018). Mobile social media usage
and academic performance. Computers in Human Behavior, 82, 177–185.
Grace-Martin, M., & Gay, G. (2001). Web Browsing, Mobile Computing and Academic Performance. Journal of Educational
Technology & Society, 4(3), 95–107.
Griffin, A. (2014). Technology Distraction in the
Learning Environment. SAIS 2014 Proceedings, 10.
Gysbers, V., Johnston, J., Hancock, D., & Denyer, G. (2011). Why do Students Still Bother Coming to Lectures, When Everything is Available Online? International Journal of
Innovation in Science and Mathematics Education, 19(2).
Harman, B. A., & Sato, T. (2011). Cell Phone Use and Grade Point Average Among Undergraduate University Students. College Student Journal, 45(3), 544–549.
Hembrooke, H., & Gay, G. (2003). The laptop and
the lecture: The effects of multitasking in learning environments. Journal of Computing in Higher Education, 15(1), 46–64.
Irwin, N., Burnett, K. M., & McCarron, P. A. (2018). Association between attendance and overall academic performance on a module
within a professional pharmacy degree.
Currents in Pharmacy Teaching and
Learning, 10(3), 396–401.
Janchenko, G., Rodi, A., & Donohoe, M. J. (2018). Impact of computers in the classroom
environment—A distraction or an essential tool? Issues in Information Systems, 19(4), 6.
Junco, R. (2012a). Too much face and not enough books: The relationship between multiple indices of Facebook use and academic performance. Computers in Human
Behavior, 28(1), 187–198.
Junco, R. (2012b). In-class multitasking and academic performance. Computers in Human Behavior, 28(6), 2236–2243.
Junco, R., & Cotten, S. R. (2011). Perceived academic effects of instant messaging use.
Computers & Education, 56, 370–378.
Junco, R., & Cotten, S. R. (2012). No A 4 U: The relationship between multitasking and academic performance. Computers & Education, 59(2), 505–514. https://doi.org/10.1016/j.compedu.2011.12.023
Kassarnig, V., Bjerre-Nielsen, A., Mones, E., Lehmann, S., & Lassen, D. D. (2017). Class attendance, peer similarity, and academic performance in a large field study. PLOS ONE, 12(11), 15.
Kates, A. W., Wu, H., & Coryn, C. L. (2018). The effects of mobile phone use on academic
performance: A meta-analysis. Computers & Education, 127, 107–112.
Kim, I., Kim, R., Kim, H., Kim, D., Han, K., Lee, P. H., Mark, G., & Lee, U. (2019). Understanding smartphone usage in college classrooms: A long-term measurement
study. Computers & Education, 141, 103611.
Kirschner, P. A., & Karpinski, A. C. (2010). Facebook® and academic performance. Computers in Human Behavior, 26(6), 1237–1245.
Kraushaar, J. M., & Novak, D. C. (2010).
Examining the Affects of Student Multitasking With Laptops During the Lecture. Journal of Information Systems Education, 21(2), 241–251.
Kuncel, N. R., Credé, M., & Thomas, L. L. (2005). The Validity of Self-Reported Grade Point Averages, Class Ranks, and Test Scores: A
Meta-Analysis and Review of the Literature. Review of Educational Research, 75(1), 63–

Information Systems Education Journal (ISEDJ) 19 (4) ISSN: 1545-679X August 2021
©2021 ISCAP (Information Systems and Computing Academic Professionals) Page 86
https://isedj.org/; https://iscap.info
82.
https://doi.org/10.3102/00346543075001063
Kuznekoff, J. H., Munz, S., & Titsworth, S. (2015).
Mobile Phones in the Classroom: Examining the Effects of Texting, Twitter, and Message Content on Student Learning. Communication Education, 64(3), 344–365.
Landin, M., & Pérez, J. (2015). Class attendance and academic achievement of pharmacy students in a European University. Currents
in Pharmacy Teaching and Learning, 7(1), 78–83.
Lau, W. W. F. (2017). Effects of social media usage and social media multitasking on the
academic performance of university students. Computers in Human Behavior,
68, 286–291.
Lou, Y., Bernard, R. M., & Abrami, P. C. (2006). Media and Pedagogy in Undergraduate Distance Education: A Theory-Based Meta-Analysis of Empirical Literature. Educational Technology Research and Development, 54(2), 141–176.
Lukkarinen, A., Koivukangas, P., & Seppälä, T. (2016). Relationship between Class Attendance and Student Performance. Procedia - Social and Behavioral Sciences, 228, 341–347.
MacLaughlin, E. J., Supernaw, R. B., & Howard, K. A. (2004). Impact of Distance Learning
Using Videoconferencing Technology on Student Performance. American Journal of Pharmaceutical Education, 68(3), 58.
Moodle, Inc. (2019). Moodle plugins directory: Video Conference. Activities: Video Conference.
https://moodle.org/plugins/mod_videoconference
Mullen, C. A. (2020). Does modality matter? A comparison of aspiring leaders’ learning online and face-to-face. Journal of Further and Higher Education, 44(5), 670–688.
Narayan, J. S., Heward, W. L., Gardner, R.,
Courson, F. H., & Omness, C. K. (1990). Using response cards to increase student participation in an elementary classroom. Journal of Applied Behavior Analysis, 23(4), 483–490.
Nieuwoudt, J. E. (2020). Investigating synchronous and asynchronous class
attendance as predictors of academic success in online education. Australasian
Journal of Educational Technology, 36(3),
15–25.
Nkhoma, C. A., Thomas, S., Nkhoma, M. Z., Sriratanaviriyakul, N., Truong, T. H., & Vo,
H. X. (2018). Measuring the impact of out-of-class communication through instant messaging. Education+ Training, 60(4), 318–334.
Northeastern State University,. (2019). Academic Information—Northeastern State University—Acalog ACMSTM. Academic
Information. http://catalog.nsuok.edu/content.php?catoid=19&navoid=661
Omar, A., Bhutta, M. K. S., & Kalulu, D. (2009).
Assessment of Student Outcomes in Management Information Systems Online
Course Participation. 10.
Paisey, C., & Paisey, N. J. (2004). Student attendance in an accounting module—Reasons for non-attendance and the effect on academic performance at a Scottish University. Accounting Education, 13, 39–53.
Roberts, J., Yaya, L., & Manolis, C. (2014). The invisible addiction: Cell-phone activities and addiction among male and female college students. Journal of Behavioral Addictions, 3(4), 254–265.
Romer, D. (1993). Do Students Go to Class? Should They? Journal of Economic
Perspectives, 7(3), 167–174.
Romero, C., López, M.-I., Luna, J.-M., & Ventura, S. (2013). Predicting students’ final performance from participation in on-line discussion forums. Computers & Education, 68, 458–472.
Rubinstein, J. S., Meyer, D. E., & Evans, J. E. (2001). Executive control of cognitive processes in task switching. Journal of Experimental Psychology: Human Perception and Performance, 27(4), 763–797.
SJSU. (2018, May 14). Zoom Features and Use Cases. ECampus.
http://www.sjsu.edu/ecampus/teaching-tools/zoom/features/index.html
Stowell, J. R., & Nelson, J. M. (2007). Benefits of Electronic Audience Response Systems on Student Participation, Learning, and Emotion. Teaching of Psychology, 34(4), 253–258.
Teixeira, A. A. C. (2016). The impact of class absenteeism on undergraduates’ academic

Information Systems Education Journal (ISEDJ) 19 (4) ISSN: 1545-679X August 2021
©2021 ISCAP (Information Systems and Computing Academic Professionals) Page 87
https://isedj.org/; https://iscap.info
performance: Evidence from an elite
Economics school in Portugal. Innovations in Education and Teaching International, 53(2), 1–13.
van der Schuur, W. A., Baumgartner, S. E., Sumter, S. R., & Valkenburg, P. M. (2015). The consequences of media multitasking for youth: A review. Computers in Human Behavior, 53, 204–215.
Visual Academy. (2020, July 15). The History of Online Schooling. OnlineSchools.Org.
https://www.onlineschools.org/visual-academy/the-history-of-online-schooling/
Wang, L.-C. C., & Morgan, W. R. (2008). Student Perceptions of Using Instant Messaging
Software to Facilitate Synchronous Online Class Interaction in a Graduate Teacher
Education Course. Journal of Computing in Teacher Education, 25(1), 15–21.
Wang, R., Harari, G., Hao, P., Zhou, X., & Campbell, A. T. (2015). SmartGPA: How Smartphones Can Assess and Predict Academic Performance of College Students.
Proceedings of the 2015 ACM International
Joint Conference on Pervasive and Ubiquitous Computing, 295–306. https://doi.org/10.1145/2750858.2804251
Yakovlev, P., & Kinney, L. (2008). Additional Evidence on the Effect of Class Attendance on Academic Performance. Atlantic Economic Journal, 36(4), 493.
Yu, A. Y., Tian, S. W., Vogel, D., & Chi-Wai Kwok, R. (2010). Can learning be virtually boosted? An investigation of online social networking
impacts. Computers & Education, 55(4), 1494–1503.
Yuan, E. (2020, April 2). A Message to Our Users. Zoom Blog. https://blog.zoom.us/a-
message-to-our-users/
Zorio-Grima, A., & Merello, P. (2020). Class-
attendance and Online-tests Results: Reflections for Continuous Assessment. Journal of Teaching in International Business, 31(1), 75–97. https://doi.org/10.1080/08975930.2019.1698394

Information Systems Education Journal (ISEDJ) 19 (4) ISSN: 1545-679X August 2021
©2021 ISCAP (Information Systems and Computing Academic Professionals) Page 88
https://isedj.org/; https://iscap.info
APPENDIX A: DESCRIPTIVE STATISTICS
Descriptive Statistics
N Minimum Maximum Mean
participation 100 0.5% 100.0% 77.075%
standardized as % of max score possible 100 0.0% 100.0% 67.790%
Valid N (listwise) 100
Descriptive Statistics
course N Minimum Maximum Mean
2019Fall-CS3403 participation 29 7.0% 100.0% 74.162%
standardized as % of max score possible 29 0.0% 96.0% 65.655%
Valid N (listwise) 29
2019Fall-CS3643 participation 15 0.5% 90.3% 60.993%
standardized as % of max score possible 15 0.0% 90.0% 56.500%
Valid N (listwise) 15
2019Fall-CS4203 participation 29 45.6% 98.9% 86.510%
standardized as % of max score possible 29 0.0% 100.0% 81.638%
Valid N (listwise) 29
2019Fall-CS4223 participation 27 6.4% 98.3% 79.004%
standardized as % of max score possible 27 0.0% 100.0% 61.481%
Valid N (listwise) 27

Information Systems Education Journal (ISEDJ) 19 (4) ISSN: 1545-679X August 2021
©2021 ISCAP (Information Systems and Computing Academic Professionals) Page 89
https://isedj.org/; https://iscap.info
APPENDIX B: COMBINED COURSES
Variables Entered/Removeda
Model
Variables
Entered Variables Removed Method
1 participationb . Enter
a. Dependent Variable: standardized as % of max score possible
b. All requested variables entered.
Model Summary
Model R R Square Adjusted R Square Std. Error of the Estimate
1 .805a .648 .644 18.7685%
a. Predictors: (Constant), participation
ANOVAa
Model Sum of Squares df Mean Square F Sig.
1 Regression 63501.016 1 63501.016 180.270 .000b
Residual 34521.074 98 352.256
Total 98022.090 99
a. Dependent Variable: standardized as % of max score possible
b. Predictors: (Constant), participation
Coefficientsa
Model
Unstandardized Coefficients
Standardized
Coefficients
t Sig.
95.0% Confidence Interval for B
B Std. Error Beta Lower Bound Upper Bound
1 (Constant) -16.496 6.552 -2.518 .013 -29.498 -3.493
participation 1.094 .081 .805 13.426 .000 .932 1.255
a. Dependent Variable: standardized as % of max score possible

Information Systems Education Journal (ISEDJ) 19 (4) ISSN: 1545-679X August 2021
©2021 ISCAP (Information Systems and Computing Academic Professionals) Page 90
https://isedj.org/; https://iscap.info
APPENDIX C: SEPARATE COURSES
Variables Entered/Removeda
course Model
Variables
Entered
Variables
Removed Method
2019Fall-CS3403 1 participationb . Enter
2019Fall-CS3643 1 participationb . Enter
2019Fall-CS4203 1 participationb . Enter
2019Fall-CS4223 1 participationb . Enter
a. Dependent Variable: standardized as % of max score possible
b. All requested variables entered.
Model Summary
course Model R R Square
Adjusted R
Square
Std. Error of the
Estimate
2019Fall-CS3403 1 .845a .714 .703 17.6498%
2019Fall-CS3643 1 .966a .933 .928 9.7440%
2019Fall-CS4203 1 .731a .535 .518 12.4119%
2019Fall-CS4223 1 .682a .465 .443 26.4172%
a. Predictors: (Constant), participation

Information Systems Education Journal (ISEDJ) 19 (4) ISSN: 1545-679X August 2021
©2021 ISCAP (Information Systems and Computing Academic Professionals) Page 91
https://isedj.org/; https://iscap.info
ANOVAa
course Model Sum of Squares df Mean Square F Sig.
2019Fall-CS3403 1 Regression 20989.648 1 20989.648 67.379 .000b
Residual 8410.903 27 311.515 Total 29400.552 28
2019Fall-CS3643 1 Regression 17175.696 1 17175.696 180.899 .000b
Residual 1234.304 13 94.946 Total 18410.000 14
2019Fall-CS4203 1 Regression 4781.484 1 4781.484 31.038 .000b
Residual 4159.464 27 154.054 Total 8940.948 28
2019Fall-CS4223 1 Regression 15144.015 1 15144.015 21.700 .000b
Residual 17446.726 25 697.869 Total 32590.741 26
a. Dependent Variable: standardized as % of max score possible b. Predictors: (Constant), participation
Coefficientsa
course Model
Unstandardized
Coefficients
Standardized
Coefficients
t Sig.
95.0% Confidence Interval for
B Std. Error Beta Lower Bound Upper Bound
2019Fall-CS3403 1 (Constant) -19.653 10.897 -1.803 .082 -42.012 2.706
participation 1.150 .140 .845 8.208 .000 .863 1.438
2019Fall-CS3643 1 (Constant) -5.520 5.253 -1.051 .312 -16.868 5.828
participation 1.017 .076 .966 13.450 .000 .854 1.180
2019Fall-CS4203 1 (Constant) -34.376 20.951 -1.641 .112 -77.364 8.613
participation 1.341 .241 .731 5.571 .000 .847 1.835
2019Fall-CS4223 1 (Constant) -30.553 20.400 -1.498 .147 -72.568 11.463
participation 1.165 .250 .682 4.658 .000 .650 1.680
a. Dependent Variable: standardized as % of max score possible