Information Science International Journal of Geographical
17
This article was downloaded by: [University Of Maryland] On: 10 July 2014, At: 07:54 Publisher: Taylor & Francis Informa Ltd Registered in England and Wales Registered Number: 1072954 Registered office: Mortimer House, 37-41 Mortimer Street, London W1T 3JH, UK International Journal of Geographical Information Science Publication details, including instructions for authors and subscription information: http://www.tandfonline.com/loi/tgis20 Colour‐coded pixel‐based highly interactive Web mapping for georeferenced data exploration Haixia Zhao Correspongding author a & Ben Shneiderman a a Human‐Computer Interaction Laboratory and Department of Computer Science , University of Maryland , College Park, MD 20742, USA Published online: 20 Feb 2007. To cite this article: Haixia Zhao Correspongding author & Ben Shneiderman (2005) Colour‐coded pixel‐based highly interactive Web mapping for georeferenced data exploration, International Journal of Geographical Information Science, 19:4, 413-428, DOI: 10.1080/1365881051233125120 To link to this article: http://dx.doi.org/10.1080/1365881051233125120 PLEASE SCROLL DOWN FOR ARTICLE Taylor & Francis makes every effort to ensure the accuracy of all the information (the “Content”) contained in the publications on our platform. However, Taylor & Francis, our agents, and our licensors make no representations or warranties whatsoever as to the accuracy, completeness, or suitability for any purpose of the Content. Any opinions and views expressed in this publication are the opinions and views of the authors, and are not the views of or endorsed by Taylor & Francis. The accuracy of the Content should not be relied upon and should be independently verified with primary sources of information. Taylor and Francis shall not be liable for any losses, actions, claims, proceedings, demands, costs, expenses, damages, and other liabilities whatsoever or howsoever caused arising directly or indirectly in connection with, in relation to or arising out of the use of the Content. This article may be used for research, teaching, and private study purposes. Any substantial or systematic reproduction, redistribution, reselling, loan, sub-licensing, systematic supply, or distribution in any form to anyone is expressly forbidden. Terms & Conditions of access and use can be found at http://www.tandfonline.com/page/terms- and-conditions
Transcript of Information Science International Journal of Geographical

This article was downloaded by: [University Of Maryland]On: 10 July 2014, At: 07:54Publisher: Taylor & FrancisInforma Ltd Registered in England and Wales Registered Number: 1072954 Registeredoffice: Mortimer House, 37-41 Mortimer Street, London W1T 3JH, UK
International Journal of GeographicalInformation SciencePublication details, including instructions for authors andsubscription information:http://www.tandfonline.com/loi/tgis20
Colour‐coded pixel‐based highlyinteractive Web mapping forgeoreferenced data explorationHaixia Zhao Correspongding author a & Ben Shneiderman aa Human‐Computer Interaction Laboratory and Department ofComputer Science , University of Maryland , College Park, MD20742, USAPublished online: 20 Feb 2007.
To cite this article: Haixia Zhao Correspongding author & Ben Shneiderman (2005) Colour‐codedpixel‐based highly interactive Web mapping for georeferenced data exploration, InternationalJournal of Geographical Information Science, 19:4, 413-428, DOI: 10.1080/1365881051233125120
To link to this article: http://dx.doi.org/10.1080/1365881051233125120
PLEASE SCROLL DOWN FOR ARTICLE
Taylor & Francis makes every effort to ensure the accuracy of all the information (the“Content”) contained in the publications on our platform. However, Taylor & Francis,our agents, and our licensors make no representations or warranties whatsoever as tothe accuracy, completeness, or suitability for any purpose of the Content. Any opinionsand views expressed in this publication are the opinions and views of the authors,and are not the views of or endorsed by Taylor & Francis. The accuracy of the Contentshould not be relied upon and should be independently verified with primary sourcesof information. Taylor and Francis shall not be liable for any losses, actions, claims,proceedings, demands, costs, expenses, damages, and other liabilities whatsoeveror howsoever caused arising directly or indirectly in connection with, in relation to orarising out of the use of the Content.
This article may be used for research, teaching, and private study purposes. Anysubstantial or systematic reproduction, redistribution, reselling, loan, sub-licensing,systematic supply, or distribution in any form to anyone is expressly forbidden. Terms &Conditions of access and use can be found at http://www.tandfonline.com/page/terms-and-conditions
Research Article
Colour-coded pixel-based highly interactive Web mapping forgeoreferenced data exploration
HAIXIA ZHAO* and BEN SHNEIDERMAN
Human-Computer Interaction Laboratory and Department of Computer Science,
University of Maryland, College Park, MD 20742, USA
(Received 19 February 2003; in final form 7 July 2004 )
This paper describes a pixel-based technique that enables highly interactive Web
choropleth maps for georeferenced data publishing and visual exploration.
Instead of delivering geographic knowledge to the client in polygon-based vector
formats, we encode geographic object IDs and shape information into highly
compact pixel images (decoding maps). This allows the combination of raster and
vector characteristics while avoiding the problems in the currently existing pixel-
based (raster-image-based) or vector-based techniques. Differing from traditional
pixel-based techniques that are static and allow very little user interaction, our
pixel-based technique allows varieties of sub-second (less than 1 s) interface
controls such as dynamic query, dynamic classification, geographic object data
identification, user-setting adjusting, as well as turning on/off layers, panning and
zooming, with no or minimum server support. Compared with Web GIS
techniques that use vector geographic data, our technique avoids transferring
over the network large vector geographic data. It also avoids the non-trivial
client-side computation to interpret the vector data and render the maps. Our
technique features a short initial download time, near-constant performance
scalability for larger numbers of geographic objects, and download-map-
segment-only-when-necessary which potentially reduces the overall data transfer
over the network. As a result, it accommodates general public users with slow
modem network connections and low-end machines, as well as users with fast
T-1 connections and fast machines. The client-side (browser) is implemented
as lightweight Java applets. YMap, an easy-to-use, user-task-oriented highly
interactive mapping tool for visual georeferenced data exploration is im-
plemented using this technique. The performance comparison of YMap to some
other vector-based Web GIS demonstrates the feasibility and benefits of this
technique.
Keywords: Web GIS; Choropleth map; Universal usability; Information
visualization; Dynamic query
1. Introduction
The Internet has become an important medium for georeferenced data publishing forpublic access. The well-documented benefits include distributed access, centralized
control for updates, and modest development cost. Existing mainstream online
mapping techniques can be classified into two categories: pixel-based (raster-
image-based) and vector-based. In a typical pixel-based technique, servers generate
*Corresponding author. Email: [email protected]
International Journal of Geographical Information Science
Vol. 19, No. 4, April 2005, 413–428
International Journal of Geographical Information ScienceISSN 1365-8816 print/ISSN 1362-3087 online # 2005 Taylor & Francis Group Ltd
http://www.tandf.co.uk/journalsDOI: 10.1080/1365881051233125120
Dow
nloa
ded
by [
Uni
vers
ity O
f M
aryl
and]
at 0
7:54
10
July
201
4

maps as pictures (display maps) in one of the standard raster graphic formats supported
by graphical Web browsers. Interaction is accomplished by submitting a request to the
server for a new display map. Even simple user actions such as turning on or off display
attributes often require such a ‘round-trip’ and complete screen refreshes. Examples
include multiple Web mapping sites powered by ESRI’s ArcView IMS, MapObjects
IMS, or ArcIMS (ESRI 2000), MapInfo’s MapeXtreme (MapInfo 2000).
This typical pixel-based technique places severe restrictions on the map
interactivity and interface design flexibility. It poses additional limitations such as
slow map update, increased network load, and often poor scalability in terms of
number of simultaneous users (Andrienko and Andrienko 1999, Zaslavsky 2000).
Designs that promote higher levels of interactivity with rapid visual interaction
methods, such as dynamic query and linked brushing, have been proposed and
employed in some desktop mapping tools (Monmonier 1989, Symanzik et al. 1996,
MacEachren and Kraak 1997, Dang et al. 2001). These powerful methods enable
users to explore large data sets, discover trends, and identify key features. However,
these sub-second-response interface controls characterizing desktop environments
are typically missing in the Web environment. Researchers have been exploring the
possibility of highly interactive Web mapping by switching to client-side solutions,
and some excellent examples have already emerged. Client-side solutions typically
ship vector geographic data (in a format such as ESRI shapefile, Vector Markup
Language (VML), Scalable Vector Graphics (SVG) or Geography Markup
Language (GML)) to the client computer, where the data are interpreted and
rendered. The two typical solutions are (1) by software implemented in Java, such as
Descartes (Andrienko and Andrienko 1999) (which later became part of
CommonGIS (CommonGIS Consortium 2002)), DC Maps (Dynamic Choropleth
Maps) (United States EPA 2003), Interactive Map Applet (Sorokine et al. 1998),
and CIESIN’s Demographic Viewer (CIESIN 2002), (2) or with the help of various
specialized browser plug-ins (or special browsers), such as AXIOMAP (Zaslavsky
2000), CDV (Dykes 1997), GeoMedia Web Map (Intergraph Corp. 2000), Autodesk
MapGuide (Autodesk 2000), and Flash Geovisualization prototype (Steiner et al.
2002). Mapping software is either pre-installed on the client computer or down-
loaded each time along with map and data information. Golub and Shneiderman
(2003) described a client-side solution for dynamic query using Dynamic HTML.
Each geographic object is shipped to the client as an individual image with
transparent background. Each image is displayed on an individual DHTML layer
whose visibility can be set. However, these approaches typically face some of the
following problems:
1. Large size of geographic data files to be transmitted over the network. This
causes the initial download time to be very long, especially over modem
network connections. The problem becomes more severe when the number of
geographic objects (states, rivers, etc.) increases. For example, a map of 3140
USA counties is about 1.54 Mb as ESRI Shapefile core components
including .shp and .shx (the third core component .dbf file is excluded here
because its size depends on the number of data attributes). It takes more than
3 min to download over a 56 K modem connection to a Pentium-III 1.0 GHz
CPU, 256 Mb RAM notebook. The long initial download time has a strong
negative effect onThe Internet has become an important medium for
georeferenced data publishing for public access. The well-documented
414 H. Zhao and B. Shneiderman
Dow
nloa
ded
by [
Uni
vers
ity O
f M
aryl
and]
at 0
7:54
10
July
201
4

benefits include distributed access, centralized control for updates, and
modest development cost. Existing mainstream online mapping techniques
can be classified into two categories: pixel-based (raster-image-based) and
vector-basedusers, often causing users to give up the attempt. Although more
compact, but lower-quality, vector formats could be defined especially for
Web GIS (such as being employed by DC Maps) to replace the widely used
high-quality standards for desktop mapping, the compression is limited,
considering the impact on image quality. Also, it is costly and hard to
convert the huge amount of geographic data already in use, owned by
government agencies, communities, organizations and the mapping
industry.
2. Unsatisfactory interaction performance scalability to the number of geographic
features, or inability to efficiently render complex maps. For example, with
dynamic queries, users alter query criteria by adjusting sliders and
immediately observe corresponding search result changes graphically.
Such dynamic interaction requires response times to be less than 0.1 s
in order to ensure a smooth animation (Shneiderman 1998). However,
CommonGIS shows significant map update delay for a USA county
view map during dynamic query (with dynamic map update on). AXIOMAP
does not scale up beyond about 200 or so geographic objects using VML.
It can render more using SVG, but still far from enough for complicated
maps such as a USA county view map. Performance scalability problems
are also reported in (Steiner et al. 2002) and (Golub and Shneiderman
2003).
3. Possible incompatibility with a client computer. For example, AXIOMAP
requires Microsoft Internet Explorer 5.0 or the SVG plug-in, and CDV
requires Tcl/Tk plug-in. In terms of client compatibility and platform
independence, Java applets, which can be executed by most Web browsers,
are more suitable (Kahkonen et al. 1999, Brinkhoff 2000).
The above limitations have important social implications. First, one goal of many
Web mapping applications is to share statistics data with the general public. The
above limitations inhibit such data sharing, contradicting the goal of universal
usability, as stated in Hochheiser and Shneiderman (2001). The following issues will
not be solved any time soon for a large portion of public users or users from
developing countries.
1. Slow network connection. Even in the USA, recent data show that most
users still access the Internet via modem connections (56 K and less) (based
on the data by Nielsen//NetRatings 2003), and analysts do not expect the
majority of homes to have broadband access (fast access) for at least five
years (Romero 2002).
2. Home users may not have powerful end machines to meet the compu-
tation demand for handling the interpretation and rendering of the vector
data.
3. Occasional users usually do not have the required plug-ins or special
software (if any) installed and may not want to invest the time or do not have
the knowledge to install them. Second, until consensus is reached on an
acceptable-quality, highly compact map data standard for the Web, it still
Web mapping 415
Dow
nloa
ded
by [
Uni
vers
ity O
f M
aryl
and]
at 0
7:54
10
July
201
4

remains infeasible for most map-referenced data publishers to provide highly
interactive mapping services on the Web and make it accessible to
general public users. Even when a consensus is reached, the cost for the
organizations and companies to transform existing map data into the new
standard will be high, enforcing a de-facto ‘digital mapping divide’ (only big
organizations who can afford powerful servers and expensive mapping
packages are able to publish their data) (Zaslavsky 2000).
This paper presents a pixel-based technique that enables highly interactive Web
choropleth maps with sub-second-response interface controls such as dynamic
query, dynamic classification, object data identifying, user-setting adjustments, as
well as turning on/off layers, panning and zooming, with no or minimum server
support. By encoding geographic object IDs and shapes into compact pixel images
(decoding maps), this technique enables flexible client-side map manipulations such
as those enabled by vector geographic data, but avoids the delivery of large vector
geographic data to the client. As a result, it avoids the delivery of large software
components needed for interpreting and rendering the vector data. The client-side
browser is implemented with lightweight Java applets, requiring no special plug-ins,
thus minimizing users’ effort. Short initial download times, rapid rendering, and
minimum need for server support during interactions make real-time interaction
possible even for public users with slow network connections. The technique also
has the benefit of near constant performance scalability, independent of the number
of geographic objects. And it can use geographic data in many formats, with the
assistance of many mapping tools, freeware or commercial, that can interpret the
data and export maps as pixel images. After the basic map images are generated, the
system can run without any external mapping tool support. Using this pixel-based
technique, we developed YMap, a prototype of an easy-to-use, task-oriented, highly
interactive Web choropleth map exploration tool.
The paper is organized as follows: section 2 introduces the key idea of the pixel-
based technique by describing the pixel decoding maps and how geographic object
IDs and shapes are encoded/decoded into/from the decoding maps. Section 3 gives
the overall system architecture, and explains the differences of our technique from
vector-based techniques and traditional pixel-based techniques. Section 4 describes
how varieties of user interactions can be fulfilled under the technique, with our
YMap prototype as an illustration. Section 5 compares the performance of YMap
with vector-based Web GIS techniques. Section 6 concludes and suggests directions
for future work.
2. Pixel decoding maps and geographic object knowledge encoding/decoding
The core idea of our pixel-based technique is to encode geographic object knowledge
(geographic object IDs and shapes) as pixel colours in map pictures that we refer to
as decoding maps. Geographic object knowledge is delivered to the client in the form
of decoding maps, together with an attribute data file containing records of attribute
values related to the geographic objects. To generate display maps (map pictures for
display) from decoding maps, the client decodes the geographic object IDs of the
pixels in the decoding maps, and uses the IDs to refer to the values in the attribute
data file to decide the display colours of the pixels (see figure 2 for an example). The
rules to encode/decode geographic object knowledge into/from decoding maps are
described in the following sections.
416 H. Zhao and B. Shneiderman
Dow
nloa
ded
by [
Uni
vers
ity O
f M
aryl
and]
at 0
7:54
10
July
201
4

2.1 Encoding/decoding rules for a small number of geographic objects
At the server-side, a geographic object ID is encoded into a pixel colour in the
decoding maps:
red IDð Þ~ min 28{1,ID
ng|nb
� �mod nr
� �|
28
nr{1
� �� �ð1Þ
green IDð Þ~ min 28{1,ID
nb
� �mod ng
� �|
28
ng{1
� �� �ð2Þ
blue IDð Þ~ min 28{1, ID mod nbð Þ| 28
nb{1
� �� �ð3Þ
At the client-side, the pixel colour is decoded to obtain the geographic object ID:
ID~redz 28
nr{1ð Þ|2
28
nr{1
$ %|ng|nbz
greenz 28
ng{1ð Þ|2
28
ng{1
$ %|nbz
bluez 28
nb{1ð Þ|2
28
nb{1
$ %ð4Þ
N The result of xb c where x is a number is the largest integer that does not exceed
x.
N ID is the unique ID assigned by the system to a geographic object (state,
county, river, etc.) in a map layer.
N nr is the number of different red colours used in the encoding/decoding rules.
N ng is the number of different green colours used in the encoding/decoding rules.
N nb is the number of different blue colours used in the encoding/decoding
rules.
N red is the red value of the colour used to encode the geographic object ID,
based on the 24-bit colour scale.
N green is the green value of the colour used to encode the geographic object ID,
based on the 24-bit colour scale
N blue is the blue value of the colour used to encode the geographic object ID,
based on the 24-bit colour scale
Figure 1 shows the colour space and illustrates the relationship between the
geographic object IDs and the colours used to encode the IDs (nr5ng5nb54). The
colours at the grid vertices are actually used.
GIF format was chosen as the decoding map format for YMap because of its high
compression rate and excellent image quality for images with many pixels but not
many colours. A GIF image can have a maximum of 256 colours. Theoretically, a GIF
image can store the knowledge of 256 geographic objects. In the Ymap implementa-
tion, only 64 (46464) colours are used, and a colour is rounded to the nearest grid
vertex colour during decoding, considering the quantization errors introduced by the
GIF image compression tool we used. Figure 2 shows a sample decoding map
consisting of 51 USA states (50 states and the District of Columbia) (figure 2(a)), a
georeferenced data file (figure 2(c)), and a sample display map generated from the
decoding map and the data file (figure 2(b)). Each assigned ID is a unique ID assigned
to a geographic object in the map by our pixel-based technique and serves as the link
Web mapping 417
Dow
nloa
ded
by [
Uni
vers
ity O
f M
aryl
and]
at 0
7:54
10
July
201
4

between the object in the decoding map and the corresponding attribute record in the
data file. Colour black (RGB value 0x000000) and white (RGB value 0xFFFFFF) are
used for the border and the background, respectively. The geographic objects here are
not restricted to states but can also be of other shapes, such as roads and rivers.
2.2 Hierarchical encoding/decoding for a large number of geographic objects
When the number of geographic objects exceeds the number of colours to be used
(maximum 256 for GIF images. 64 in YMap), a hierarchical encoding/decoding
method is used. For example, in a two-level encoding/decoding scheme, all geographic
objects are divided into groups. Colours are used to encode both the group IDs and the
IDs within each group. Figure 3 illustrates a two-level encoding/decoding for USA
3,140 county view. After reserving black and white for the border and the background
respectively, we use the remaining 62 colours to encode the 3,140 counties, making the
group size 62 instead of 64. Because some states have more than 62 counties, we do not
group the counties by state. Instead, we simply order the counties by their FIPs. We
then assign the first 62 counties to group 1, the second 62 counties to group 2, and so
on. If the border and the background are treated the same as counties, 64 colours can
encode 6466454096 IDs. So, theoretically, two GIF images can store the geographic
knowledge of 2566256565 536 geographic objects.
3. Architecture and the differences from vector-based client-side techniques and
traditional pixel-based server-side techniques
3.1 Architecture
Figure 4(a) shows the architecture of our technique. Upon the client’s request for
new geographic objects (such as states, rivers, etc.) and georeferenced data, decoding
Figure 1. Colour space and the relationship between the geographic object IDs and thecolours used to encode the IDs (nr5ng5nb54). (Colour version available online.)
418 H. Zhao and B. Shneiderman
Dow
nloa
ded
by [
Uni
vers
ity O
f M
aryl
and]
at 0
7:54
10
July
201
4

maps that carry the knowledge of geographic shapes are delivered to the client
applet along with the georeferenced attribute data file. Interactions such as dynamic
query and dynamic classification are handled solely by the Java applet by decoding
geographic object IDs (used to locate the records in the attribute data file) out of the
decoding maps and generate display maps from the decoding maps in less than a
second, without communicating with the server.
The round-trip of requesting and delivering happens only when a new set of
attribute data or geographic shapes is needed (explained in more detail in the next
section). Additionally, decoding maps are very small (see section 5), as are the
georeferenced data files (depending on the number of attributes requested and the
number of geographic objects, e.g. ,100 kb for an uncompressed data file with 15
attributes for 3,140 USA counties). As a result, the network transfer load is
relatively low.
GIF decoding maps can be provided in two different ways, depending on how
flexible the zooming needs to be. If zooming levels are pre-defined for the system, as
is often the case with online mapping services, a hierarchical set of GIF decoding
maps can be pre-generated for those zooming levels, residing on the server as
the decoding map repository for client-side use. Any mapping tools, commercial,
(a) (b)
(c)
Figure 2. (a) Sample decoding map of USA states (6.3 KB, 3426224 pixels). (b) Sampledisplay map shaded by ‘Average income’. To generate the display map, the client raster scansthe decoding map, uses the decode rule to obtain the ID for each pixel in the decoding map,and uses the ID to obtain the average income value from the data file to decide the pixel’sdisplay colour in the display map. (c) Corresponding georeferenced data file (columns with anasterisk are not included in the actual data file). Each assigned ID is a unique ID assigned to ageographic object in the map by our pixel-based technique, and serves as the link between theobject in the decoding map and the corresponding attribute record in the data file. Theencoding–decoding rules in equations (1)–(4) are used to establish the link.
Web mapping 419
Dow
nloa
ded
by [
Uni
vers
ity O
f M
aryl
and]
at 0
7:54
10
July
201
4

freeware or shareware, can be used to pre-generate those decoding maps, as long as
they can read and render the vector geographic shape data of some common
standard, and export the maps as pixel image files. The mapping tool is then not
needed when the service is running. If arbitrary zooming scales are desired, the
mapping tool can generate decoding maps on the fly. However, dynamically
generating a response will increase the response delay and the server burden, as is
true for any Web service.
3.2 Differences from vector-based and traditional pixel-based techniques
Compared with the architecture of vector-based techniques (figure 4(c)) that
demand the client to do all the work of interpreting vector data and generating
display maps, our technique redistributes the workload between the client and the
server, by leaving the work of interpretation and decoding map generation to the
server. As a result, no vector geographic data need to be delivered over the network,
and the client is lightweight. Although the client has no vector geographic data, it
can obtain geographic knowledge (geographic object IDs and object shapes) from
the highly compact colour-coded decoding maps by using the decoding rules. Then,
(a) (b)
(c)
Figure 3. Example of two-level encoding/decoding for USA 3140 county view. Group size is62 because two of the 64 colours are reserved for the border and the background. The IDs areassigned by our pixel-based technique. Assigned ID5Group ID6Group size+ID withingroup. Assigned ID is used as the link between a geographic object in the decoding maps andthe corresponding record in the attribute data file. (a) Top-level decoding map (10 KB).(b) Bottom level decoding map (11 KB). Both maps are 3426224 pixels. (c) Data file.
420 H. Zhao and B. Shneiderman
Dow
nloa
ded
by [
Uni
vers
ity O
f M
aryl
and]
at 0
7:54
10
July
201
4

it can generate new display maps without communicating with the server. As a
result, our technique has the client-side flexibilities similar to those enabled by the
vector-based technique.
Compared with the architecture of traditional pixel-based techniques (figure 4(b))
that depends on the server to provide every single display map, our technique
enables the client to generate new display maps without server support. This enables
a real-time response to user interactions. In addition, the server workload is reduced,
and the network transfer load declines, enabling improved service for all users.
4. Highly interactive online map manipulation
This section explains how our pixel-based technique enables varieties of common
user interactions that have been introduced and employed in many interactive
choropleth map tools.
N Dynamic query by scrolling sliders. Dynamic query is a very powerful
exploratory interaction method for both open-ended questions (such as ‘where
is a nice place to live?’) and specific tasks (such as ‘which state has the lowest
population density?’). Dynamic query has been employed in a lot of previous
work such as the work by Dang et al. (2001) and CommonGIS Consortium
(2002). Dynamic query requires real-time (less than 0.1 s) acquisition and
update of the result on map in order to ensure a smooth animation
(Shneiderman 1998). Dynamic query will be impossible if any server support
is involved, because of the unpredictable network delay, regardless of the
Figure 4. Architectures of (a) our pixel-based technique, (b) traditional pixel-based server-side technique, and (c) vector-based client-side technique.
Web mapping 421
Dow
nloa
ded
by [
Uni
vers
ity O
f M
aryl
and]
at 0
7:54
10
July
201
4

network bandwidth. In our pixel-based technique, geographic knowledge is
stored in the GIF decoding maps. When the user adjusts a dynamic query
slider, a series of new query ranges are issued. To change the display map
responding to a new query range, the client Java applet raster scans the pixels
in the decoding maps. For each pixel, the applet uses the decoding rule to
obtain the pixel’s geographic object ID from the pixel colour. It then uses the
ID to obtain the attribute values associated with this pixel’s geographic object.
These attribute values are compared with the query range to determine if the
geographic object should be filtered out, and to change the pixel’s display
colour accordingly. This process is done solely by the client Java applet without
communicating with the server. The geographic objects noted here are not
limited to states or counties, but include other common shapes, such as lines
(rivers, roads) and dots (cities).
N Dynamic classification. Dynamic classification is useful in exploring optimal
statistic class breaks. Andrienko and Andrienko (1999) give an excellent
example of it. Our pixel-based technique allows real-time dynamic classifica-
tion on map, using a process similar to that described above for the dynamic
query.
N Scatterplot and linked brushing with the choropleth map. Linked brushing has
appeared in many systems (Monmonier 1989, Dykes 1997, Dang et al. 2001,
Steiner et al. 2001). With the attribute data file on the client, scatter plots can
be easily implemented using the Java graphic package. The mapping between
map colour and data set record index enables real-time linked brushing since
the client can get geographic object IDs from decoding map colours and vice
versa, without server support.
N Multiple thematic layers, background layers and labels. Sometimes, users want
to view a thematic layer on a background layer (e.g. a highly interactive river
layer with the state borders as the background) or view multiple thematic
layers overlapped together. All the thematic or background layers that do not
need to be dynamically manipulable can be generated on the server and sent to
the client as raster images with transparent background, and rendered on top
of the dynamically updated choropleth map layers. Labels can either be part of
the decoding maps or overlaid as a separate layer.
N Zoom. Zooming is important for observing data patterns in smaller or denser
regions. Zooming could be done either by simply enlarging/shrinking the
current available decoding map or having the server deliver a new decoding
map of the desired zoom factor. The first choice does not need server support
but may have aliasing problems during resampling, and does not generate as
good quality map images as the second choice. It can be used alone when the
zooming scale does not jump by more than a factor of 60–80%. The second
choice ensures good map quality. When map tools are used on the server to
generate decoding maps on the fly (for arbitrary zooming), the client simply
notifies the server about the geographic range of the desired decoding map.
The decoding map file size does not vary too much, since the client map
viewport has a fixed size. If a repository of pre-generated decoding maps is
used, the pre-generated decoding maps must be designed carefully, because a
complete decoding map of a close zoom-in may be very large. In order to
minimize network transfer volume and response time, a large complete
decoding map is broken down to several much smaller decoding map segments.
422 H. Zhao and B. Shneiderman
Dow
nloa
ded
by [
Uni
vers
ity O
f M
aryl
and]
at 0
7:54
10
July
201
4

Only those segments needed for the current client view will be delivered to the
client. Figure 5 illustrates a case where a decoding map is broken down into
464516 equal-sized segments, and only two segments (row2-col3 and row3-
col3) need to be delivered to the client for the current view. If the size of
segments is the same as the client map viewport size (for both width and
height), then the number of segments that needs to be delivered to the client
(a)
(b)
Figure 5. (a) Large decoding map broken down to several smaller segments. (b) Twosegments loaded. Only segments overlapping with the current view will be fetched to the clientfrom the server.
Figure 6. YMap screen snapshot.
Web mapping 423
Dow
nloa
ded
by [
Uni
vers
ity O
f M
aryl
and]
at 0
7:54
10
July
201
4

varies from 1 to 4 when zooming in, depending on which part the user is
viewing. Since the client viewport size is fixed (and relatively small, no larger
than the screen resolution), the size of GIF decoding maps transferred on the
network is upper-bounded by a small value. This deliver-only-when-needed
mechanism ensures a fast system response upon user zoom-in, and potentially
significantly reduces the total size of decoding maps to be transferred on the
network. Most of the map segments may not need to be delivered at all,
because in many cases, users examine only the overview or only view a small
portion of the map.
N Pan. In panning, the system’s action with the decoding maps is similar to that
in zooming. During panning, only the part of map that changes visibility is
updated in shading and filtering status. The update can be done when users
release the mouse.
N Obtain information on a geographic object or multiple geographic objects. When
users mouse-over a geographic object, its attribute data can be obtained from
the attribute data file in less than a second by using the decoded geographic
object ID as the index.
To demonstrate some of the above concepts/techniques, we have built YMap.
YMap is a Java applet running on a Web browser. Figure 6 shows a screen snapshot
of the YMap applet. The design of YMap applies an important general interface
design methodology for exploring large data sets (Shneiderman 1998): overview
first, zoom and filter, then details-on-demand. YMap gives an overview of the data
distribution via visualization (on the shaded choropleth map and histogram bars on
the sliders), allows dynamic query (by adjusting double-box sliders) to filter out
unwanted entries and to narrow down to the result set of interests, and provides
details-on-demand to further examine individual entries of interests (mouse over a
county to view the associated data, or select counties to compare their data in the
detail information panel). The snapshot shows a county view of continental USA
shaded by the furniture and home furnishing store sale volume in 1992. Counties
with a low number of new private housing units or with median population age out
of range (26, 42) are filtered out (in grey).
5. Performance comparison and benefit analysis
To demonstrate the benefits of our pixel-based technique, we measured YMap
performance and compared it with other Web GIS systems. We chose CommonGIS
(CommonGIS Consortium 2002) to compare with YMap, because CommonGIS is
one of the fastest Web GIS packages that uses vector geographic data, and has
comparable functions. Tables 1 and 2 show some performance data about YMap,
including package and data sizes, the system response time under different network
connection speeds and for maps with different complexities. Since CommonGIS and
YMap do not have exactly the same functionality, it is not our emphasis to compare
their package sizes. Rather, the measurements associated with the package sizes are
to illustrate the effect of the package size on the download time.
From the tables, we can see that both CommonGIS and YMap show a smooth
dynamic query on a map of a small amount of geographic objects (e.g. 51 states).
But when the number of objects increases (e.g. 3,140 counties), CommonGIS shows
a significant delay in dynamic query, while YMap still shows a smooth response.
Actually, YMap has a near-constant performance scalability for dynamic query
424 H. Zhao and B. Shneiderman
Dow
nloa
ded
by [
Uni
vers
ity O
f M
aryl
and]
at 0
7:54
10
July
201
4

(also other dynamic features, such as dynamic classification) because the number of
decoding map pixels needed to be checked is bounded by the size of current client map
viewport. The current YMap implementation uses a simple raster scanning method. To
generate a display map, YMap raster scans every decoding map pixel to decide the
pixel’s display colour. While this simple scanning method already provides a fast
enough display update, the display map generation process could be further speeded up
by using polygon-fill methods. For example, the client can pre-process the decoding
maps to detect the boundary pixels of each geographic object. To generate a display
map, the client can simply use polygon-fills based on those boundary pixels.
Under fast network connection (T-1), both CommonGIS and YMap have
reasonable initial download times and a fast response to zoom and pan, though
CommonGIS takes two to seven times longer than YMap to initially download the
data. However, when using a 56 K modem connection, CommonGIS needs more
than 3 min to download the map data on USA counties and 3 min to download the
software, before anything can be rendered onto the screen for the user. In contrast,
YMap only takes about 20 s to download the data and 12 s to download the
software. Zoom and Pan are fast in both CommonGIS and YMap under T-1
connection or for relatively simple maps (e.g. 51 USA states). For a complicated
map of 3140 USA counties, and under a 56 K modem connection, zoom and pan in
YMap usually takes less than 10 s for the first-time zoom/pan. Once a part of the
map has been viewed at a certain zoom scale, the decoding map segments are cached
by the applet and takes less than 1 s for later visits. Sometimes, the initial zoom and
pan will take a longer time (e.g. 40 s), when six to eight decoding map segments (two
level encoding/decoding) need to be downloaded at once, and those segments
contain dense tiny counties. The sizes of decoding map segments are mostly under
5 kb, but they can vary from 0.5 to 33 kb, depending on where the user zooms in/
pans to. For example, a segment of size 3426224 about the north-east part can be
33 kb, a segment of the same size about the middle west part can be 9 kb, a segment
about Hawaii can be only 1 kb, and a background segment of the same size can be
only 0.5 kb. A variety of techniques can be used to reduce the maximum value and
also the deviation of response delay during first-time zoom/pan. These techniques
are not implemented in our current prototype but will be described shortly.
Considering the initial download time, zoom and pan, CommonGIS and YMap
show different Internet delay patterns under slow network connections.
CommonGIS takes a long time to download everything before anything becomes
viewable and available for the user to explore. This could be a serious problem for
occasional first-time public users who are uncertain about the result quality and not
willing to spend a lot of time downloading something that may turn out to be
Table 1. Comparisons of package size and package download time of vector-basedCommonGIS and pixel-based YMap under different network connection speedsa.
CommonGIS YMap
Package size ,1 Mb (.jar) ,60 kb (.jar)
Package down-load time
56 kbps modem T-1 56 kbps modem T-1
,180 s ,13 s ,12 s ,2 s
aThe data were obtained using Microsoft Internet Explorer 5.0 in Windows 2000 Professional,on a Pentium III 1.0 GHz CPU, 252 Mb RAM Fujitsu notebook. The modem connection wasrunning at 31 kbps.
Web mapping 425
Dow
nloa
ded
by [
Uni
vers
ity O
f M
aryl
and]
at 0
7:54
10
July
201
4
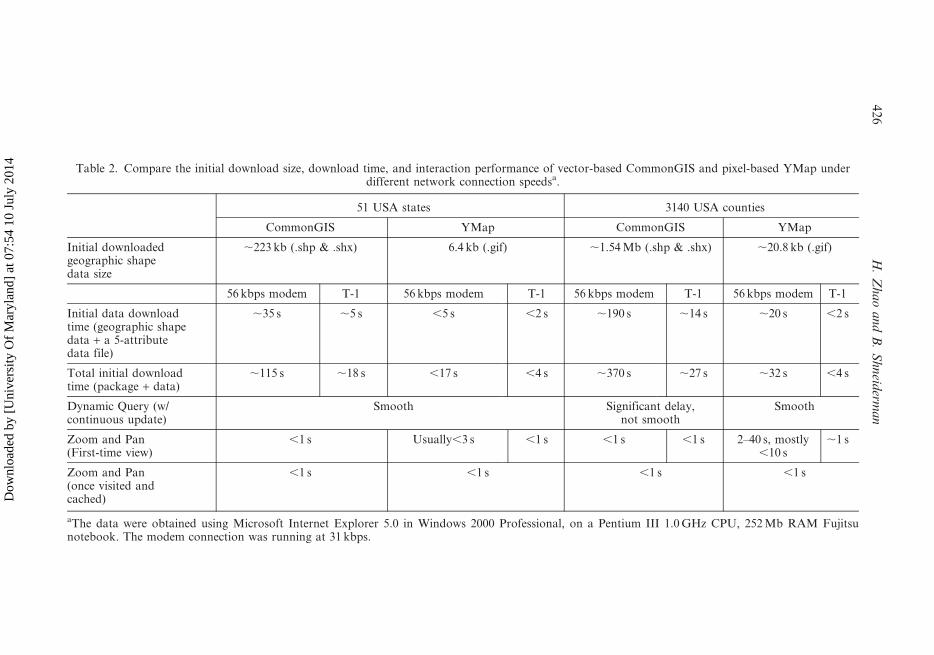
Table 2. Compare the initial download size, download time, and interaction performance of vector-based CommonGIS and pixel-based YMap underdifferent network connection speedsa.
51 USA states 3140 USA counties
CommonGIS YMap CommonGIS YMap
Initial downloadedgeographic shapedata size
,223 kb (.shp & .shx) 6.4 kb (.gif) ,1.54 Mb (.shp & .shx) ,20.8 kb (.gif)
56 kbps modem T-1 56 kbps modem T-1 56 kbps modem T-1 56 kbps modem T-1
Initial data downloadtime (geographic shapedata + a 5-attributedata file)
,35 s ,5 s ,5 s ,2 s ,190 s ,14 s ,20 s ,2 s
Total initial downloadtime (package + data)
,115 s ,18 s ,17 s ,4 s ,370 s ,27 s ,32 s ,4 s
Dynamic Query (w/continuous update)
Smooth Significant delay,not smooth
Smooth
Zoom and Pan(First-time view)
,1 s Usually,3 s ,1 s ,1 s ,1 s 2–40 s, mostly,10 s
,1 s
Zoom and Pan(once visited andcached)
,1 s ,1 s ,1 s ,1 s
aThe data were obtained using Microsoft Internet Explorer 5.0 in Windows 2000 Professional, on a Pentium III 1.0 GHz CPU, 252 Mb RAM Fujitsunotebook. The modem connection was running at 31 kbps.
42
6H
.Z
ha
oa
nd
B.
Sh
neid
erma
n
Dow
nloa
ded
by [
Uni
vers
ity O
f M
aryl
and]
at 0
7:54
10
July
201
4

useless. Also, precious network bandwidth could be wasted on transferring large
files that the users ignore and discard. By contrast, YMap responds rapidly,
providing users with an overview of the result, which is also something that users
can use immediately to explore the georeferenced data. Additionally, YMap uses
‘levels of detail’ for map information and defers the map segment transfer until
necessary, which may reduce the overall data transfer volume significantly, because
users may simply discard the result or only be interested in examining a small part of
the map after overview. Although sometimes zoom/pan takes a little longer, a
variety of techniques can be applied to further speed it up:
N Combine the usage of a newly delivered high-quality decoding map with the
usage of an enlarged version of the currently available decoding maps. Upon
zooming, a decoding map already cached on the client can be resampled to
produce a larger/smaller decoding map. This decoding map can immediately be
rendered to respond to the user’s zoom-in request. At the same time, a separate
Java thread fetches a new high-quality decoding map from the server. When
the new decoding map arrives, it is rendered to replace the resampled one. This
way, users can continue their task without waiting, and they feel the response is
immediate.
N Pre-fetching: When users are using other functions such as dynamic query on
the current zoom-level map, the system can predict the user’s next zoom/pan
need and use a separate Java thread to pre-fetch the decoding maps from the
server.
6. Conclusion
We described a pixel-based technique for highly interactive Web mapping for
georeferenced data publishing and visual exploration. Compared with tradi-
tional vector-based techniques, this technique has a significantly shorter initial
download time and near-constant performance scalability, and can potentially
significantly reduce the overall data transfer over precious Internet bandwidth.
It can accommodate general public users with slow network connections and
low-end machines. Extensions of this technique could be used for any highly
interactive Web application in which shape data for visualization and dynamic
update are large.
Acknowledgements
This work is partially supported by a grant from the US Census Bureau and a grant
from the National Science Foundation (grant no. ITR-0086143). Also, we thank Dr
Gennady L. Andrienko, German National Research Center for Information
Technology, and Dr Ilya Zaslavsky, University of California, San Diego
Supercomputer Center, for providing information and help with their systems
(CommonGIS and AXIOMAP respectively). We thank Dr Catherine Plaisant, Ann
Rose, Human–Computer Interaction Lab, University of Maryland, and Dr Evan
Golub, Department of Computer Science, University of Maryland, for their
suggestions and comments during the work.
ReferencesANDRIENKO, G.L. and ANDRIENKO, N.V., 1999, Interactive maps for visual data exploration.
International Journal of Geographical Information Science, 13, pp. 355–374.
Web mapping 427
Dow
nloa
ded
by [
Uni
vers
ity O
f M
aryl
and]
at 0
7:54
10
July
201
4

AUTODESK, INC. 2000, Autodesk MapGuide. Available online at: http://www.autodesk.com.
BRINKHOFF, T., 2000, The impacts of map-oriented internet applications on Internet clients,
map servers and spatial database systems. In Proceedings of the 9th International
Symposium on Spatial Data Handling, 10–12 August 2000, Beijing, China.
CIESIN (Center for International Earth Science Information Network), 2002, Demographic
data viewer. Available online at: http://www.ciesin.org, http://plue.sedac.ciesin.org/
plue/ddviewer/ddv20/index.html (demo) (accessed 8 November 2002.
COMMONGIS CONSORTIUM, 2002, The CommonGIS project. Available online at: http://
www.commongis.com
DANG, G., NORTH, C. and SHNEIDERMAN, B., 2001, Dynamic queries and brushing on
choropleth maps. In Proc. International Conference on Information Visualization 2001,
IEEE Press, Los Alamotos, pp. 757–764.
DYKES, J.A., 1997, Exploring spatial data representations with dynamic graphics. Computers
& Geosciences, 23, pp. 345–370.
ESRI, 2000, www.esri.com/software/arcgis/arcims
GOLUB, E. and SHNEIDERMAN, B., 2003, Dynamic query visualizations on World Wide Web
clients: a DHTML solution for maps and scattergrams. International Journal of Web
Engineering Technology, 1, pp. 63–78.
HOCHHEISER, H. and SHNEIDERMAN, B., 2001, Universal usability statements: marking the
trail for all users. In ACM Interactions 8(2) March–April, pp. 16–18.
INTERGRAPH CORP. 2000, GeoMedia Web Map. Available online at: imgs.intergraph.com/
geomedia
KAHKONEN, J., LEHTO, L., KILPELAINEN, T. and SARJAKOSKI, T., 1999, Interactive
visualization of geographical objects on the Internet. International Journal of
Geographical Information Science, 13, pp. 429–438.
MACEACHREN, A. and KRAAK, M., 1997, Exploratory cartographic visualization: advancing
the agenda. Computers and Geosciences, 23, pp. 335–344.
MAPINFO 2000, Mapextreme. Available online at: extranet.mapinfo.com/products/overview.
cfm.
MONMONIER, M., 1989, Geographic brushing: enhancing exploratory analysis of the
scatterplot matrix. Geographical Analysis, 21, pp. 81–84.
NIELSEN//NEtRATINGS, 2003, Available online at http://www.nielsen-netratings.com/pr/
pr_030618_us.pdf
ROMERO, S., 2002, Price is limiting demand for broadband. The New York Times. 5 December
2002.
SHNEIDERMAN, B., 1998, Designing the User Interface. 3rd ed. (Reading, MA: Addison-
Wesley Longman).
SOROKINE, A. and MERZLIAKOVA, I., 1998, Interactive map applet for illustrative purpose. In
Proceedings of the 6th International Symposium on Advances in Geographic Information
Systems, 6–7 November 1998, Washington DC, pp. 46–51 (Kansas City, MO: ACM
Press).
STEINER, E.B., MACEACHREN, A.M. and GUO, D., 2001, Developing and assessing
lightweight data-driven exploratory geovisualization tools for the Web. In
Proceedings of the 20th International Cartographic Conference, 6–10 August 2001,
Beijing, China.
SYMANZIK, J., MAJURE, J. and COOK, D., 1996, Dynamic graphics in a GIS: a bidirectional
link between ArcView 2.0 and Xgobi. Computing Science and Statistics, 27, pp.
299–303.
UNITED STATES EPA (Environmental Protection Agency), 2003, http://www.epa.gov/. The
Dynamic Choropleth Maps. Available online at: http://users.erols.com/turboperl/
dcmaps.html (last accessed on 4 April 2004).
ZASLAVSKY, I., 2000, A new technology for interactive online mapping with vector markup
and XML. In Proceedings of the 8th International Symposium on Advances in
Geographic Information Systems, 2000.
428 Web mapping
Dow
nloa
ded
by [
Uni
vers
ity O
f M
aryl
and]
at 0
7:54
10
July
201
4