Information scan on WASH unit costs and financial planning ...
61
Information sc financial plann Water and San IRC International Wat Uganda Final Report 13.01.2013 Fontes Uganda Ltd Lucrezia Biteete Patrick Jangeyanga can on WASH unit cos ning and budgeting of nitation Sector in Ugan ter and Sanitation Centre sts and f the nda
Transcript of Information scan on WASH unit costs and financial planning ...

Information scan on WASH unit costs and
financial planning and budgeting of the
Water and Sanitation Sector in Uganda
IRC International Water and Sanitation Centre
Uganda
Final Report
13.01.2013
Fontes Uganda Ltd
Lucrezia Biteete
Patrick Jangeyanga
Information scan on WASH unit costs and
financial planning and budgeting of the
Water and Sanitation Sector in Uganda
IRC International Water and Sanitation Centre
Information scan on WASH unit costs and
financial planning and budgeting of the
Water and Sanitation Sector in Uganda
Table of contents
1 Introduction ..................................................................................................................................... 1
1.1 The Ugandan Rural Water and Sanitation Sector ................................................................... 1
1.2 The Information Scan .............................................................................................................. 2
2 Methodology ................................................................................................................................... 3
2.1 Data collection ......................................................................................................................... 3
2.2 Data Analysis and Representation........................................................................................... 3
2.2.1 Stakeholder Maps ............................................................................................................ 3
2.2.2 Cost Matrix ...................................................................................................................... 4
2.3 Challenges with data collection ............................................................................................... 5
3 The Life Cycle Costs Approach ......................................................................................................... 6
3.1 Cost Categories ........................................................................................................................ 6
3.1.1 CapEx ............................................................................................................................... 6
3.1.2 OpEx ................................................................................................................................. 7
3.1.3 CapManEx ........................................................................................................................ 7
3.1.4 ExpDS ............................................................................................................................... 7
3.1.5 ExpIDS .............................................................................................................................. 7
3.1.6 CoC ................................................................................................................................... 8
4 Funding and Reporting Flows .......................................................................................................... 9
4.1 Main Funding Agencies ........................................................................................................... 9
4.1.1 Government of Uganda ................................................................................................... 9
4.1.2 Joint Partnership Fund..................................................................................................... 9
4.1.3 Donor Funds .................................................................................................................... 9
4.2 UNICEF ................................................................................................................................... 10
4.2.1 Peace Recovery and Development Plan ........................................................................ 10
4.2.2 Uganda Sanitation Fund ................................................................................................ 11
4.3 Main Government Players at National Level ......................................................................... 11
4.3.1 Ministry of Water and Environment ............................................................................. 11
4.3.2 Ministry of Finance, Planning and Economic Development .......................................... 12
4.3.3 Ministry of Health .......................................................................................................... 12
4.3.4 Ministry of Education and Sports .................................................................................. 12
4.3.5 Office of the Prime Minister .......................................................................................... 12

4.4 UWASNET .............................................................................................................................. 12
4.5 International NGOs ................................................................................................................ 13
4.6 Appropriate Technology Centre ............................................................................................ 13
4.7 Main Government Players at Regional Level ........................................................................ 13
4.7.1 Water and Sanitation Development Facilities ............................................................... 13
4.7.2 Umbrella Organisations ................................................................................................. 14
4.7.3 Technical Support Units................................................................................................. 14
4.8 Main Government Players at Local Level .............................................................................. 15
4.8.1 District Local Governments ........................................................................................... 15
4.8.2 Sub-Counties.................................................................................................................. 15
4.8.3 Town Councils ................................................................................................................ 16
4.8.4 Health Centres ............................................................................................................... 17
4.8.5 Schools ........................................................................................................................... 18
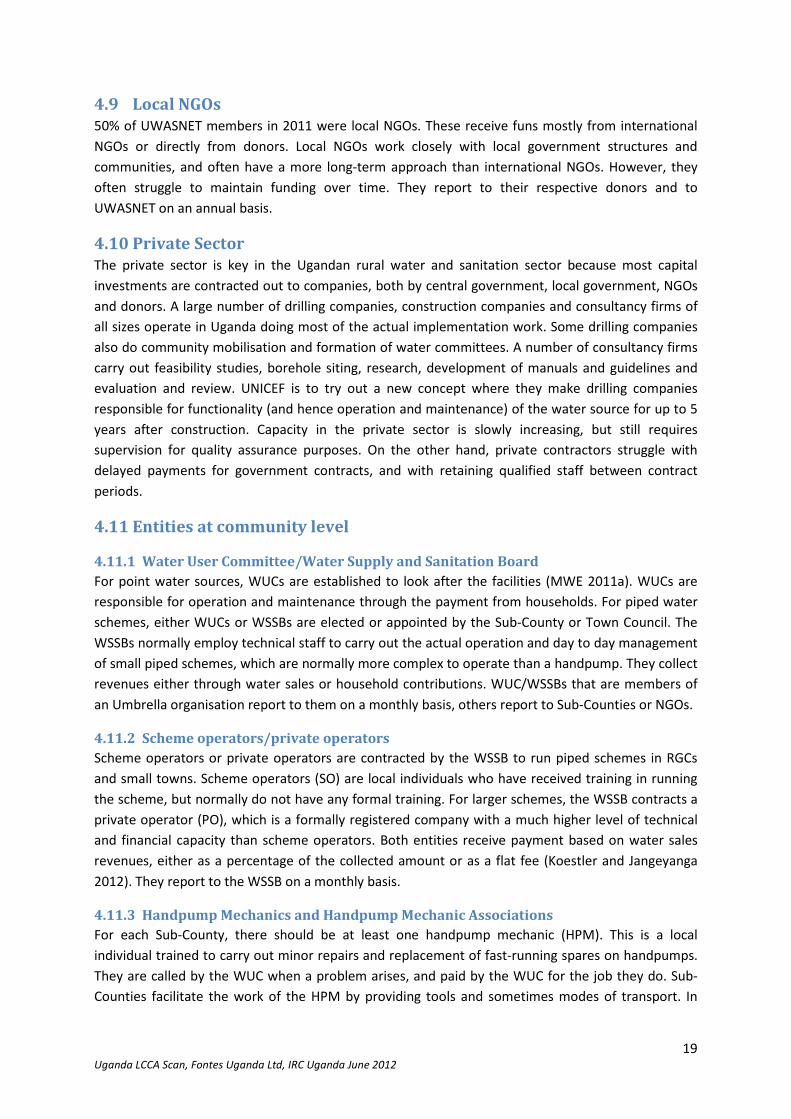
4.9 Local NGOs ............................................................................................................................ 19
4.10 Private Sector ........................................................................................................................ 19
4.11 Entities at community level ................................................................................................... 19
4.11.1 Water User Committee/Water Supply and Sanitation Board ....................................... 19
4.11.2 Scheme operators/private operators ............................................................................ 19
4.11.3 Handpump Mechanics and Handpump Mechanic Associations ................................... 19
4.11.4 Communities ................................................................................................................. 20
5 Costs Categories ............................................................................................................................ 21
5.1 Capital Expenditures .............................................................................................................. 21
5.2 Operation Expenditures ........................................................................................................ 22
5.3 Capital Maintenance Expenditures ....................................................................................... 24
5.4 Direct Support Expenditures ................................................................................................. 26
5.5 Indirect Support Expenditures .............................................................................................. 29
5.6 Cost of Capital ....................................................................................................................... 31
6 Budgeting and Planning Tools ....................................................................................................... 32
6.1 Output Budgeting Tool .......................................................................................................... 32
6.2 District Budgeting .................................................................................................................. 32
6.2.1 Conditional Grant .......................................................................................................... 32
6.3 Per Capita Investment Cost ................................................................................................... 34
6.4 Unit Costs .............................................................................................................................. 34
6.4.1 Borehole Drilling Unit Cost Tool .................................................................................... 34
6.4.2 Sector Investment Model .............................................................................................. 34
6.5 Tools of Other Actors ............................................................................................................ 35
6.6 Opportunities and Constraints .............................................................................................. 35
6.6.1 Benefits of Life Cycle Costs Approach ........................................................................... 35
6.6.2 Constraints for LCCA in Uganda ..................................................................................... 36
7 Conclusion and Way Forward: Extended Unit Cost Table ............................................................. 38
7.1 Main Variables ....................................................................................................................... 38
7.2 Factors to Consider ................................................................................................................ 38
7.3 Example ................................................................................................................................. 39
8 References ..................................................................................................................................... 41
9 Appendices .................................................................................................................................... 42

List of Acronyms
AFDB – African Development Bank
ATC – Appropriate Technology Centre
CapEx – Capital Expenditure
CapManEx – Capital Maintenance Expenditure
CBO – Community Based Organisation
CDO – Community Development Officer
CG – Conditional Grant
CLTS – Community Led Total Sanitation
CoC – Cost of Capital
DANIDA – Danish International Development Agency
DEO – District Education Office
DHO – District Health Office
DHSCG – District Hygiene and Sanitation Conditional Grant
DHSCG – District Hygiene and Sanitation Conditional Grant
DIM – District Implementation Manual
DLG – District Local Government
DWD – Directorate of Water Development
DWO – District Water Office
DWSCG – District Water and Sanitation Conditional Grant
EU – European Union
ExpDS – Expenditure on Direct Support
ExpIS – Expenditure on Indirect Support
FY – Financial Year
GFS – Gravity Flow Scheme
GoU – Government of Uganda
HH - household
HMP – Handpump Mechanic
HW – Hardware
IDP – Internally Displaced Person
JPF - Joint Partnership Fund
KFW – Kreditanstalt für Wideraufbau (German Development Bank)
LCC – Life Cycle Costs
LCCA – Life Cycle Costs Approach
MDG – Millennium Development Goals
MoES – Ministry of Education and Sports
MoFPED – Ministry of Finance, Planning and Economic Development
MoH – Ministry of Health
MoU – Memorandum of Understanding
MTEF – Medium Term Expenditure Framework
MWE – Ministry of Water and Environment
NGO – Non Governmental Organisation
O&M – operation and maintenance
OpEx – Operations Expenditure
OPM – Office of the Prime Minister
PAF – Poverty Action Fund
PHAST – Participatory Hygiene and Sanitation Transformation
PO – Private Operator
PRDP – Peace Recovery and Development Plan
PS – Private Sector

RGC – Rural Growth Centre
RWSS – Rural Water and Sanitation Sector
SO – Scheme Operator
SW – Software
Triple-S – Sustainable Services at Scale
TSU – Technical Support Unit
Umbrella – Umbrella Organisation for Water and Sanitation
USF – Uganda Sanitation Fund
UWASNET – Uganda Water and Sanitation NGO Network
WASH – Water Sanitation and Hygiene
WSDF – Water and Sanitation Development Facility
WSSB – Water Supply and Sanitation Board
WSSCC – Water Supply and Sanitation Coordination Committee
WUC – Water User Committee
WWSCC – World Water and Sanitation Collaborative Council
Executive Summary
In order to address sustainability challenges in the rural water and sanitation sector, there is
increased focus on understanding the costs involved in post-construction activities such as operation
and maintenance, large repairs and activities of support mechanisms. This study aims to get an
overview over the income and expenditure flows in the Ugandan rural water and sanitation sector,
with a special focus on sustainability. Through a better understanding of income and expenditure
flows, reporting flows, funding instruments, budgeting and planning tools and the areas of
intervention of the different entities, gaps can be identified. The study will use the Life Cycle Costs
Approach (LCCA) promoted by WASHCost to specifically focus on post-construction costs, and also
discuss potential benefits of adopting the approach in Uganda.
The study was carried out by Fontes Uganda Ltd for IRC Uganda, in close cooperation with the
Department for Rural Water in the Directorate of Water Development (DWD) at the Ministry of
Water and Environment (MWE).
Data was mainly collected through 23 stakeholder interviews, and from sector documents. The data
is presented in two tools: cost matrices and maps. The cost matrices are arranged by cost category,
and show the different stakeholders involved with each cost category. The maps are generated for
each sector (water and sanitation), each technology (point sources, piped schemes, public latrines,
household sanitation, school sanitation) and for each cost category. The matrices are presented in
the appendix and the specific maps are presented in the report. “Master maps” are also to be found
in the appendix.
The Life Cycle Costs Approach (LCCA) is a tool to show what is needed to sustain, repair and replace a
water or sanitation system through the whole of its cycle of wear, repair and renewal. Life Cycle
Costs (LCC), therefore, “represent the aggregate cost of ensuring delivery of adequate, equitable and
sustainable water, sanitation and hygiene (WASH) services to a population in a specified area”
(Fonseca et al 2010). Based on this, the LCCA “seeks to raise awareness of the importance of LCC in
achieving adequate, equitable and sustainable WASH services, to make reliable cost information
readily available and to mainstream the use of LCC in WASH governance processes at every level”
(Fonseca et al 2010).
The main cost categories are:
CapEx: Capital expenditure includes expenses on hardware and software related to the initial
investment in water and sanitation infrastructure. It includes pre-studies, software approaches to
promote household sanitation and engineering works.
OpEx: Expenditure on operation and maintenance includes operation expenditure as well as minor
repairs such as replacements of taps or valves.
CapManEx: Capital maintenance expenditures include costs of rehabilitation and replacement. These
are large repairs that are not part of the daily running of the systems.
ExpDS: Expenditure on direct support include activities focused on the individual community or
scheme that take place after the handover of the systems such as capacity building, follow up,
monitoring and evaluation.

ExpIS: Expenditure on indirect support refers to support on macro-level for policy development and
sector coordination, including capacity building and monitoring and evaluation costs that cannot be
broken down for each scheme or community.
CoC: Cost of capital are mainly interests paid on loans.
Chapter four explains the maps, which show the funding and reporting flows in the Ugandan rural
water and sanitation sector. The main funding agencies are Government of Uganda (GoU) and donor
funds, through various funds such as the Joint Partnership Fund (JPF), Peace Recovery and
Development Plan (PRDP) and Uganda Sanitation Fund.
Main stakeholders at national level are the Ministry of Water and Environment (MWE), which is the
lead agency in the sector. Ministry of Finance, Planning and Economic Development (MoFPED) is
responsible for disbursement of funds and preparing national budgets. Ministry of Health (MoH) is
responsible for household sanitation and Ministry of Education and Sports (MoES) for sanitation in
schools. Office of the Prime Minister (OPM) manages the PRDP, and Uganda Water and Sanitation
NGO Network represents (UWASNET) civil society and collects information on the activities and
expenses of the NGOs active in the sector. In addition, there are international NGOs and the
Appropriate Technology Centre (ATC), which carries out research on water and sanitation
technologies.
At regional level, the government recently created Water and Sanitation Development Facilities
(WSDF) for the entire country, which identify rural growth centres (RGC) and small towns for
development of small piped water schemes and public toilets. The post-construction follow up of
these structures is carried out by regional Umbrella Organisations. Technical Support Units (TSU)
provide technical support to districts.
At local level, the main entity responsible for implementation of rural water and sanitation structures
is the District Water Office (DWO), based on the District Water and Sanitation Conditional Grant
(DWSCG) and the District Hygiene and Sanitation Conditional Grant (DHSCG). Sub-Counties carry out
small-scale activities and mobilisation and software activities. Town Councils are considered part of
the rural sector when their water schemes are not large enough to be formally contracted out to the
private sector. In addition, individual health centres and schools are responsible for their sanitation
facilities. A number of local NGOs support the sector with a wide range of activities from
implementation of structures to advocacy, capacity building and monitoring.
At community level the main role is played by the water and sanitation services users, and in Uganda
they are also the ones responsible for operation and maintenance of the structures. Management is
organised through water user committees (WUC) or water supply and sanitation boards (WSSB), and
technical work is done by scheme operators (SO) or private operators (PO) for pipes schemes, or
handpump mechanics (HPM) for boreholes.
In chapter five, maps show which entities are involved in the different cost categories outlined
above.
Chapter six summarises the main budgeting and planning tools in the sector. The main financing
instrument of government is the DWSCG, and its guidelines provide 70% for new water (and
sanitation) structures (CapEx), 11% for software (CapEx and ExpDS), 8% for rehabilitation

(CapManEx), 6% for construction of public latrines (CapEx) and 5% for supervision and monitoring
(ExpDS). This shows that government is still largely focusing on CapEx in order to achieve the
Millennium Development Goals (MDG) and its own targets. In the financial year 2010-11, 52.1 billion
Uganda shillings (20 million USD) was released to local governments through the DWSCG (MWE
2011b).
Per capita investment costs are calculated each year as a measurement of effectiveness and
efficiency of the sector investment. However, the indicator is easily biased by different technologies
that have very different per capita investment costs. Unit costs are average costs of construction of
different technologies. Most stakeholders surveyed by this study base their budgeting on bills of
quantities of previous projects. However, the government has developed two tools for the
calculation of unit costs. The borehole drilling unit cost tool is used by central government to
estimate unit costs for boreholes. The sector investment model also provides unit costs for other
technologies as well as sanitation technologies, and even includes yearly operation and maintenance
costs. However, it has not been updated and is rarely used.
Adopting the Life Cycle Costs Approach (or parts of it) could have a number of benefits for the
Ugandan rural water and sanitation sector. It would help to factor in the costs spent after a water
system is put in place, such as OpEx, CapManEx and ExpDS. These categories play an important part
in ensuring sustainability of the structures. A cost analysis exercise, based on the tools and the
framework given in this report, could provide valuable data on how much is spent on these
categories, and where the gaps are. It could also provide government with strong arguments to focus
more on post-construction costs, both internally and for NGOs and donors.
At the same time, cost tracking and LCCA thinking could face a number of constraints. A number of
cost categories are currently lumped under general budget lines, and it would take some effort and
some estimation to disaggregate these costs. Not all entities will be willing to give away cost
information, and cost information might not be reliable due to corruption and poor reporting and
verification routines. In addition, focus on post-construction costs would take focus away from
expanding coverage and could slow down progress towards achieving targets in the short term, even
if it would be better off in the long term.
Adopting the LCCA in full would probably mean a change in the budgeting, planning and policy
framework, something that will take time. However, in the short term it could be beneficial to carry
out a cost analysis exercise, in order to get a better overview of the real costs in the sector. Data
from this exercise could be used to make Extended Unit Costs Tables, where costs are calculated
according to technology and settlement pattern for each cost category. This provides the possibility
to calculate yearly costs of keeping different systems in different settings running over time, as well
as per capita costs for the entire life cycle of a system.

1 Uganda LCCA Scan, Fontes Uganda Ltd, IRC Uganda June 2012
1 Introduction One of the critical topics in the Rural Water and Sanitation (RWSS) sector is sustainability of the
structures, and hence also the financing of operations and maintenance. IRC International Water and
Sanitation Centre (IRC) is focusing on this aspect through a number of initiatives, amongst them the
WASHCost1 project and the Sustainable Services at Scale (Triple-S) project. This study aims to get an
overview over the income and expenditure flows in the Ugandan rural water and sanitation sector,
with a special focus on sustainability. Through a better understanding of the income and expenditure
flows, reporting flows, funding instruments, budgeting and planning tools and the areas of
intervention of the different entities, gaps can be identified. The study will use the Life Cycle Costs
Approach (LCCA) developed by IRC and its partner organisations under the WASHCost project to
specifically focus on post-construction costs, and also discuss potential benefits of adopting the
approach in Uganda.
The study was carried out by Fontes Uganda Ltd for IRC Uganda, in close cooperation with the
Department for Rural Water in the Directorate of Water Development (DWD) at the Ministry of
Water and Environment (MWE).
The report is written for an audience already familiar with the basic characteristics of the Ugandan
rural water and sanitation sector, and will therefore not discuss the policy and legal framework in
detail. The topic covered by this study is extremely vast and detailed, and therefore some
generalisations had to be made. Please see the main assumptions for the matrix and the maps in the
methodology chapter. In addition, the study only had limited time and resources to verify the
information given by the informants, therefore omissions or errors are not to be excluded.
1.1 The Ugandan Rural Water and Sanitation Sector
The Ugandan rural water and sanitation sector is anchored in the Rural Water Department in the
Directorate of Water Development, Ministry of Water and Environment. The Department is
responsible for providing the rural population with improved water sources, such as deep boreholes,
hand dug shallow wells, protected springs, gravity flow schemes and to some extent promotion of
rainwater harvesting. The Department was also responsible for the construction of small piped water
schemes for Rural Growth Centres (RGCs), however this responsibility is increasingly taken over by
the Water and Sanitation Development Facilities (WSDF), which are regional funding mechanisms
currently rolled out to cover the entire country. In addition, the rural water department is also
responsible for sanitation in RGCs and in public spaces, as well as hygiene promotion around the
water sources. The implementation is normally done at decentralised level, mostly through the
District Water Offices (DWO). In addition to the governmental structures, about 200 NGOs are active
in the water and sanitation sector, with activities ranging from good governance and advocacy to
provision of structures.
The sector is going through a number of changes, with the most important being decentralisation,
increased focus on solar systems and small piped schemes, and post-construction follow up carried
out by regional Umbrella Organisations and Handpump Mechanic Associations. This study covers
both point sources and small piped schemes, including those for rural small towns where the system
1 See www.washcost.org

2 Uganda LCCA Scan, Fontes Uganda Ltd, IRC Uganda June 2012
is not big enough to formally contract the management out to the private sector. It covers both
household sanitation, public latrines and sanitation in institutions such as schools and health centres.
Please refer to the Sector Performance Report of 2011 (MWE 2011b) for a detailed description of the
policy and legal framework. For a detailed description of the activities of the District Water Offices,
who are the key players both in implementation of rural water supplies, the District Implementation
Manual (DIM) gives a good overview (MWE 2007), although it is currently undergoing revision. The
Operations and Maintenance Framework (2004, revised in 2011) spells out the responsibilities for
covering costs for both minor and major repairs (MWE 2004, 2011a).
1.2 The Information Scan
This study aims to map expenditure channels, planning and budgeting tools in the Ugandan rural
water and sanitation sector and create an overview over what cost information is used for decision
making. The study will inform sector stakeholders in Uganda on the potential of using the Life Cycle
Costs Approach (LCCA) for financing and planning water services that last. The LCCA aims to support
water, sanitation and hygiene (WASH) governance by identifying the real and disaggregated costs of
water, sanitation and hygiene services, and the range of physical, social, economic and political
factors that influence those costs.
The findings of this study are divided into four main sections. After explaining the methodology and
how to understand the annexes of this report, as well as a brief introduction into the LCCA, chapter
four will focus on the main funding and reporting flows in the sector, outlining the different agencies
and sector players through the use of maps. Chapter five then goes more into detail and looks at
what types of costs the different entities cover, and is summarised in the cost matrices and cost
maps. Chapter six looks at the current planning and budgeting tools such as unit costs and the Sector
Investment Model, and discusses the opportunities and constraints with the current practices, as
well as the potential benefits of adopting LCCA. Chapter seven looks beyond this study and gives an
example on how the tools explained in chapter four and five (maps and matrix) can be extended to
give a more accurate picture of the cost of providing sustainable rural water services.

3 Uganda LCCA Scan, Fontes Uganda Ltd, IRC Uganda June 2012
2 Methodology
The study was carried out using the following methodologies:
1. Desk study of documents
2. Interviews with key informants
3. Travel to one sample District and interview with key informants to gather information about
the tools used at District, Sub-County and Community level
4. Analysis of data
2.1 Data collection
The main source of information was key informants, who were asked questions through semi-
structured interviews. Where necessary, documents were asked for to provide more information on
for example planning tools or budget lines. Please see a complete list of people interviewed in
appendix 3.
Stakeholders consulted were (number of people interviewed):
1. DWD, Rural Water Departmern (3)
2. DWD, Urban Water Department (1)
3. DWD, Sanitation (1)
4. DWD, General (2)
5. DWD, Planning Unit (2)
6. Ministry of Health, Environmental Health Division (1)
7. District Water Office (Jinja and Kanungu Districts) (2)
8. Sub County (Lake Katwe, Kasese) (1)
9. Water and Sanitation Development Facility, Central (1)
10. Appropriate Technology Centre (2)
11. Office of the Prime Minister (1)
12. Private Contractors (1)
13. NGOs (3)
14. UWASNET (1)
15. UNICEF (1)
In total 23 people from 13 different agencies/departments were interviewed.
2.2 Data Analysis and Representation
The data was structured in two main tools for analysis and graphic representation; maps and
matrices.
2.2.1 Stakeholder Maps
The first is through stakeholder maps, indicating the flow of funds and the reporting streams. In
order to simplify a very complex picture, maps have been created in three categories:
1. Different sectors: water and sanitation
2. Different technologies: point sources, small piped water schemes, household sanitation,
public latrines, latrines in schools
3. Different cost categories: CapEx, OpEx, CapManEx, ExpDS and ExpIS
4 Uganda LCCA Scan, Fontes Uganda Ltd, IRC Uganda June 2012
The maps have been developed based on the data in the matrix. Regular arrows are funding flows
and dotted arrows are reporting streams. Text on the arrows either refer to the type of cost (CapEx,
CapManEx etc, see next chapter), or the frequency of reporting (annually, quarterly, monthly). Black
arrows show the actual service provision and not necessarily a funding flow, although some costs
might be involved. For example, the private sector actually carries out most of the construction
works, or in the case of the Town Council, it is the Private Operator (PO) who does the actual service
provision and not the Town Council. The black arrow therefore indicates the entity directly in contact
with the users.
Some entities have been merged for simplicity. For example, UNICEF is presented as a separate
entity in the matrix, but does not figure in the map. This is because in Uganda, its activities are largely
the same as the category called “international NGO” and it was therefore not necessary to make a
separate figure. Higher Education Institutions are so diverse in funding and type of activity that they
were not included in the map. These institutions mostly come in only for research projects. It was
difficult to find examples of Cost of Capital for households or Scheme Operators and these are
therefore not presented in the map and only as theoretical possibilities in the matrix. Some minor
details such as locally generated revenue for districts and sub-counties (mostly insignificant amounts)
have been left out for simplicity purposes.
The “master maps” are presented in appendices 1 and 2.
More maps can be extrapolated from the same data set on request.
2.2.2 Cost Matrix
Secondly, the agencies as well as their main immediate source of funds were grouped according to
the cost categories (see chapter 3 below). There are two matrices, one for water and one for
sanitation. The matrices are organised by cost category, and give information on which entity is
involved, where the funds come from and some comments on what type of activities the entity is
involved in. Please refer to the list of acronyms for better understanding of the matrices.
The main assumptions in making the matrices were:
1. Only the immediate source of funds is listed. For example, if the Sub-County receives money
from MoFPED through the District, it is only the District that is listed. Please refer to the
maps to identify the original source of funding.
2. Activities related to Integrated Water Resource Management are not specific for the rural
water sector and are therefore not included, although they can be relevant for the sector,
such as groundwater mapping
3. It was not possible to find any examples on projects for sewerage or drainage in the rural
sector (even for RGCs and small town councils) so there is no data on this in the matrix
4. Activities related to environmental management are not specific for the rural sanitation
sector and are therefore not included
These two tools can be used to easily respond to questions. For example, if you want to know how
the Water and Sanitation Development Facilities (WSDF) are funded, you can just look at the map
and see it is funded by the Joint Partnership Fund (JPF) and the Ministry of Water and Environment
(MWE). If you want to study costs of Capital Maintenance Expenditure, you can refer to the matrix
5 Uganda LCCA Scan, Fontes Uganda Ltd, IRC Uganda June 2012
where you find a list of the entities involved. You can thereafter refer to the CapManEx map to find
out how funds are channelled to the entities involved and how reporting is done. Or, for example, if
you want to know who is involved in funding the construction and operations and maintenance of
public latrines, you can easily see this from the public latrine map.
2.3 Challenges with data collection
Wherever possible, information from informants was confirmed by looking at policy documents and
guidelines. However, sometimes the information was conflicting. This is because things might not be
done in practice how they are prescribed in the policy documents. Where these conflicts were found,
it was prioritised to show what is done in practice, but the theory is also added in form of a comment
or in the text in the report.
6 Uganda LCCA Scan, Fontes Uganda Ltd, IRC Uganda June 2012
3 The Life Cycle Costs Approach The Life Cycle Costs Approach (LCCA) is a flexible approach to show what is needed to sustain, repair
and replace a water or sanitation system through the whole of its cycle of wear, repair and renewal.
Life Cycle Costs (LCC), therefore, “represent the aggregate cost of ensuring delivery of adequate,
equitable and sustainable water, sanitation and hygiene (WASH) services to a population in a
specified area” (Fonseca et al 2010). Based on this, the LCCA “seeks to raise awareness of the
importance of LCC in achieving adequate, equitable and sustainable WASH services, to make reliable
cost information readily available and to mainstream the use of LCC in WASH governance processes
at every level” (Fonseca et al 2010). LCC should always be compared and analysed only when related
to particular service levels, and WASHCost has also developed guidelines to assess service levels in
Moriarty et al 2010. The Ugandan water and sanitation sector has its own service level indicators, see
Koestler and Jangeyanga 2012 for more information.
LCCA is actively being promoted by the WASHCost2 project under IRC Water and Sanitation Centre in
the Netherlands, and is gaining pace as an accepted framework to analyse cost data and service level
criteria in the rural water and sanitation sector. One of the main strengths of the approach is that it
looks beyond the initial investments and includes post-construction maintenance costs and the
software aspects related to follow up, capacity building and support to the sector as a whole. An
analysis done by the NGO Fontes Foundation in Uganda in 2010 using this framework, found for
example that it costs an average between 5000 and 15,000 USD per year3 to keep a small piped
scheme running (including operation costs, maintenance costs and direct support costs) (Koestler et
al 2010). If you multiply 5000 USD with 19 years (assuming a life cycle of 20 years) it becomes 95,000
USD, which is more than the initial investment of 80,000 USD. In reality, however, costs arising after
the end of construction are rarely budgeted for. It is hoped that by raising awareness of the costs
related to keeping water systems running over time, sustainability and functionality could be
massively improved.
3.1 Cost Categories
The WASHCost project has outlined a set of cost categories especially adapted for the rural water
and sanitation sector. One of the objectives of this study is to look at the possibility for the Ugandan
water and sanitation sector to adopt LCCA or parts of it, and it was therefore natural to also structure
the data collection in the same categories. Since they will be referred to frequently in this report,
they are presented below. The information for the next paragraphs is mainly taken from Fonseca et
al 2011.
3.1.1 CapEx
Capital Expenditure is composed of both hardware (construction materials and engineering works)
and software components. The software part includes the studies done prior to implementation
(such as feasibility studies, assessments and willingness to pay surveys) and also the initial interaction
with stakeholders and water users, as well as the establishment of management structures such as
2 See www.washcost.org for more information
3 The Fontes Foundation projects have a relatively expensive support mechanism because it is based on
international staff and only serves 4 projects. It is likely that the cost could be substantially reduced by using a
locally based support mechanism and Fontes Foundation is researching on local options.

7 Uganda LCCA Scan, Fontes Uganda Ltd, IRC Uganda June 2012
water user committees (WUC)4 or water supply and sanitation boards (WSSB)
5. Community Led Total
Sanitation (CLTS) approaches and other sanitation promotion campaigns that aim at expanding
sanitation coverage also count to CapEx expenses. CapEx also includes new investments for
extensions that can be added on further down the road.
3.1.2 OpEx
Operating and minor maintenance expenditure covers the costs of daily operation of the water
system as well as minor repairs. For a handpump, this means the replacement of fast moving spares
such as bolts and chains, and for small piped schemes and gravity flow schemes (GFS) it means
replacement of taps and valves as well as expenses on fuel and chemicals. OpEx also includes the
payment of allowances for the people involved in running the systems. In Uganda, this can mean
paying sitting allowances for committees or boards, or paying pump caretakers or scheme plumbers6.
For sanitation structures, OpEx includes cleaning, provision of soap and water for hand washing and
minor maintenance of the structures.
3.1.3 CapManEx
Capital maintenance expenditure includes asset renewal, replacement and rehabilitation costs. These
are expenses on work that goes beyond the daily running of the systems, but that is required to keep
them running. Examples in Uganda are borehole rehabilitation, major repair on a pump or storage
tank in a piped scheme or the replacement of a faulty generator. In the sanitation sector it means pit-
emptying or the relocation of the latrine once the pit is full, as well as major repair or rehabilitation
of the superstructure.
3.1.4 ExpDS
Expenditure on direct support includes post-construction activities related to each individual scheme
or community. Activities in Uganda include refresher trainings and follow up of WUCs and WSSBs,
technical back-stopping and other activities such as helping WUCs to make operation and
maintenance (O&M) plans or to establish a revolving fund with the household collections for the
handpump. It also involves continuous hygiene and sanitation promotion, as well as monitoring and
evaluation at community level.
3.1.5 ExpIDS
Expenditure on indirect support include macro-level support, planning and policy-making which is
essential to an enabling environment but where it is not possible to break down costs for each
specific water system or community. In Uganda, this also involves capacity building of government
entities at different levels, research, knowledge management and developing guidelines, manuals
and maintaining good sector coordination.
4 In Uganda, WUCs are established for point water sources. See O&M Framework for further details (MWE
2011) 5 In Uganda, WSSBs are established for some piped water schemes in rural growth centres (RGCs) and small
towns, especially under the development facilities. See Koestler and Jangeyanga 2012 for a detailed description
of this management model 6 WUC members normally work on a voluntary basis, but sitting allowances (paying people to attend meetings)
are becoming increasingly necessary to keep people motivated

8 Uganda LCCA Scan, Fontes Uganda Ltd, IRC Uganda June 2012
3.1.6 CoC
Cost of capital refers to the cost of financing the programme or project. In Uganda this mainly means
the payment of interests by Government to multilateral lending agencies, as well as payment of
interest for loans taken by other stakeholders such as households or WSSBs.

9 Uganda LCCA Scan, Fontes Uganda Ltd, IRC Uganda June 2012
4 Funding and Reporting Flows This chapter will describe the main stakeholders in the Ugandan water and sanitation sector, in order
to better understand the funding and reporting flows. Maps are inserted randomly throughout this
chapter for a graphic representation of the funding and reporting flows. Please also refer to the
master maps in appendices 4 and 5.
4.1 Main Funding Agencies
4.1.1 Government of Uganda
The overall water and sanitation (rural and urban) sector budget for the financial year 2010-11 was
369.3 billion UGX (142 million USD)7. The main funding agencies are donors and Government of
Uganda (GoU) (MWE 2011b). Approximately 1/4 of GoU funds is funded by development partners,
the rest is from locally raised revenues8. On-budget funds (funds part of the Government’s sector
medium term expenditure framework) were 69.4% of the budget in FY 2010-11, and off-budget
funds (resources outside the framework such as donor funds independently accessed by civil society
organisations) were 30.6%. Compared to 2009-10, the total budget increased by 16.1%, but on-
budget funds dropped by 5.5%. The water and sanitation sector made out 3.1% of the overall budget
for Uganda in 2010-11. Estimates for 2011-12 show a reduction in the share to 2.4% (MWE 2011b).
An important problem for the sector is that the budget has remained stagnant for many years,
whereas inflation and population growth make it hard to expand coverage quick enough reach
targets.
In 1998 GoU crated the Poverty Action Fund (PAF) which is a ring-fenced fund for key development
sectors such as water, education, health and rural infrastructure. It is part of the Government’s
Medium Term Expenditure Framework (MTEF), and the conditional grants (CG) that are sent to the
districts are taken from this fund within GoU (MWE 2011b).
4.1.2 Joint Partnership Fund
In addition to funds channelled through GoU, a number of donors fund individual projects or funds.
The Joint Partnership Fund (JPF) is a special basket fund for the water and sanitation sector that
funds specific projects but falls under on-budget modalities (MWE 2011b). A number of donors
participate in the Sector Wide Approach (SWAP), where donors provide funding in this basket fund
and planning and budgeting is done jointly under the leadership of Government through the Sector
Working Group. For example, the JPF funds the Technical Support Units (TSU) and partly funds the
Water and Sanitation Development Facilities (WSDF), Umbrella Organisations, Appropriate
Technology Centre (ATC) and the development of urban water supplies for small towns.
4.1.3 Donor Funds
In addition, specific donors fund specific programmes, such as the EU funding certain activities of the
Umbrella Organisations. UWASNET is also funded by a number of different donors comprising both
development partners such as DANIDA and international NGOs such as Water Aid and Dutch WASH
Alliance.
7 Exchange rates are of June 2012 and amounts are rounded to the nearest 10.
8 In the New Vision of the 16
th of June 2012, the budget for 2012-13 was presented and the share of
development partners set to 25% (p. 11)

10 Uganda LCCA Scan, Fontes Uganda Ltd, IRC Uganda June 2012
4.2 UNICEF
UNICEF plays an important role in the sector as it has a large programme mainly focusing on
provision of boreholes. In 2010-11, UNICEF drilled more than 70 boreholes in 11 districts (MWE
2011b). In addition, UNICEF supports the government in policy development and and capacity
building. UNICEF also provides latrines for institutions such as schools, and promotion of household
sanitation and hygiene. UNICEF contracts out activities to the private sector or local NGOs, and
districts and MWE report to UNICEF on a quarterly basis.
4.2.1 Peace Recovery and Development Plan
Another fund is the Peace Recovery and Development Plan (PRDP), a “Marshall plan” fund provided
by the GoU for the reconstruction of Northern Uganda, which was affected by insurgencies. The main
components of the fund are water, education, health and roads. The fund is managed by the Office
of the Prime Minister (OPM) and disbursed to District Local Governments (DLG). The fund exists since
2009.
Fig. 1: Stakeholder map for point water sources. Most stakeholders except WSDF and Umbrellas do
both point sources and small piped schemes. Town Councils mostly have piped schemes so they are
also left out. Implementation is mainly done through private companies (drilling companies) and
O&M is ensured by the community and with assistance from Handpump Mechanics (HPM).

11 Uganda LCCA Scan, Fontes Uganda Ltd, IRC Uganda June 2012
4.2.2 Uganda Sanitation Fund
This is a fund of 1 million USD provided by the World Water and Sanitation Collaborative Council
(WWSCC) going to 16 pilot districts in Eastern Uganda to improve rural sanitation.
4.3 Main Government Players at National Level
4.3.1 Ministry of Water and Environment
In the rural water and sanitation sector, the main government agency is the Ministry of Water and
Environment (MWE). The ministry’s Rural Water Department is responsible for overseeing the
provision of rural water supplies handled by decentralised structures. Following a MoU between line
ministries in 2001, MWE is also responsible for sanitation in RGCs and public spaces (MWE 2010). The
Urban Water Department is in charge of Umbrella Organisations which also largely follow up RGCs
and small town councils, and therefore also covers the rural water and sanitation sector through the
work of the Umbrellas. MWE is no longer an implementing agency but rather focuses on technical
Fig. 2: Stakeholder map for piped schemes. Main developers of piped schemes are WSDF (for RGCs
and small towns) with Umbrellas responsible for post-construction. However, Districts also still
build piped schemes, as well as MWE (large schemes) and NGOs. Post construction follow up is also
carried out to some extent by Districts, Sub-Counties and Town Councils, as well as NGOs.

12 Uganda LCCA Scan, Fontes Uganda Ltd, IRC Uganda June 2012
support, supervision and policy development, however, MWE can get involved in direct
implementation in certain cases such as in emergencies, to follow up political pledges and in case
schemes are too big for the districts to handle.
The Urban Water Department can also fund extensions and large repairs of water systems in RGCs
and town councils, and the management of the contracts is now increasingly handled by the WSDFs.
The Ministry also leads the Joint Annual Sector Review process, where donors, civil society
organisations and government players evaluate the performance of the sector using 11 Golden
Indicators (MWE 2011b). The review produces the Sector Performance Report each year. The sector
also carries out a Joint Technical Review yearly.
4.3.2 Ministry of Finance, Planning and Economic Development
The Ministry of Finance receives budgets and workplans from MWE and disburses funds. It sends the
different conditional grants (DWSCG, DHSCG and Urban O&M Conditional Grant) to the Districts (and
in the case of the O&M CG for the RGCs, to the Umbrella).
4.3.3 Ministry of Health
Through the Environmental Health Division, Ministry of Health is responsible for household
sanitation. The division has an annual budget of approximately 100 million UGX (38,500 USD) to
cover 112 districts. However, MWE still has the lead on sanitation activities and therefore much of
the implementation is done by MWE. Districts reports to MWE are copied to MoH on a quarterly
basis, but it is not always clear where funds for the different activities come from. MoH does capacity
building, policy formulation and provides technical support to decentralised levels. Current priority
areas are awareness raising (advocacy), sanitation marketing and environmental aspects.
4.3.4 Ministry of Education and Sports
Ministry of Education and Sports is responsible for sanitation in schools, whereas water supply for
government primary schools is still theoretically the responsibility of MWE. Water and sanitation in
secondary schools is the responsibility of each school (MWE 2010). The ministry provides guidance to
government schools on how to practice good hygiene and sanitation, and how to include hygiene
and sanitation education to some extent in the curriculum. Through decentralised structures, the
MoES also enforces guidelines on sanitation in private schools.
4.3.5 Office of the Prime Minister
The Office of the Prime Minister (OPM) manages the Peace Recovery and Development Plan (PRDP).
Funds are channelled directly to the benefiting districts outside the Conditional Grant based on
workplans submitted by the districts. Funds are allocated based on criteria such as population and
performance the previous year, and only districts affected by the insurgency in Northern Uganda can
benefit. Districts report quarterly using a standard format, and OPM monitors projects in the districts
twice a year. In case of large projects, such as valley dams in Karamoja, OPM signs a MoU with MWE
for technical assistance.
4.4 UWASNET
Uganda Water and Sanitation NGO Network (UWASNET) currently has 220 members out of which
most are national NGOs and Community Based Organisations (CBO). Every year, members are asked
to report on activities including spending on different technologies, software and hardware activities

13 Uganda LCCA Scan, Fontes Uganda Ltd, IRC Uganda June 2012
as well as post-construction support. UWASNET produces an annual report, and figures are
integrated in the Joint Annual Sector Review and presented in the Sector Performance Report.
However, there are still a number of NGOs that are not members, or do not report on expenditures.
UWASNET provides different services to its members, such as capacity building, knowledge
management, support to liaise with districts and financial audits. It also does research and has a
resource centre with documents relevant to the sector. In addition, UWASNET participates on a
number of committees and working groups for policy formulation as a representative of civil society.
UWASNET is funded by Water Aid, Dutch WASH Alliance, DANIDA, McKnight Foundation, AFDB and
some corporate organisations and commercial banks. 75% of the budget goes to advocacy.
4.5 International NGOs
21% of UWASNET members were international NGOs in 2011 (MWE 2011b). These include large
organisations such as Water Aid, Plan International, World Vision, CARE International, GOAL etc.
Some are active in the emergency sector. Development programmes are normally carried out
through local partner organisations, with technical support, supervision and capacity building
provided by the international NGO. International NGOs are also strong in advocacy, knowledge
management, research and monitoring and evaluation at national level. A number of international
NGOs base their budgets on previous bills of quantities and add overheads of about 20% of the
budget. The members of UWASNET report annually to the network.
4.6 Appropriate Technology Centre
The Appropriate Technology Centre (ATC) was launched in 2011 and its mandate is to carry out
research and development of appropriate technology options in the rural water and sanitation
sector. The project is currently funded by the Joint Partnership Fund (JPF) and managed by the NGO
NETWAS. ATC has established a model village in Mukono and develops manuals and guidelines for
different technology options. They also carry out training of TSUs, NGOs and Districts as well as
artisans/masons on the different technology options. ATC reports to MWE on a quarterly basis.
4.7 Main Government Players at Regional Level
4.7.1 Water and Sanitation Development Facilities
Four regional WSDFs were established after the successful work of the South Western Towns Water
and Sanitation Project. The WSDF identifies RGCs and small towns for the development of water and
sanitation services, and manages the funds provided by MWE, KFW and AFDB (through JPF)
(unknown 2011). KFW provided 40 million Euro (49 million USD) for 2 years, AFDB 30 million USD for
4 years and GoU provides 1 million USD per facility per year. The WSDF has technical staff that
support and oversee the planning, implementation and handover process. For larger projects, design
and planning is contracted out to consultants, however for smaller projects this is done by WSDF
staff. Technically the works are tendered out through the districts, however the contracts are paid
and managed by WSDF. WSDF closely interlinks with the districts, and also provide technical support
and capacity building (unknown 2011). WSDF projects are typically small piped schemes managed by
a Water Supply and Sanitation Board (WSSB), which contracts operations either to a Scheme

14 Uganda LCCA Scan, Fontes Uganda Ltd, IRC Uganda June 2012
Operator or a Private Operator (for gazetted towns)9. The projects also include a sanitation
component, with hygiene and sanitation promotion as well as the construction of public latrines
(unknown 2011). After completion, the system is handed over to the Umbrella organisation, who
continues to support the WSSB and SO/PO in operation and maintenance (see below). O&M for the
water structures is paid for using revenues from water sales, and WSSBs are also responsible for
O&M of the public latrines. This has shown to be a challenge, and there is a plan to integrate
sanitation in the management contracts with the SO/PO. WSDFs are anchored in the urban water
department in DWD and report on a quarterly basis. However, since many of the projects take place
in Rural Growth Centres (RGCs) and rural small towns, they are included in this study.
WDSF can also handle major breakdowns and extensions, however for these cases an application
needs to be made to MWE’s Urban Department. If the application is granted WSDF manages the
funds and the contracts as a re-investment. However, this process is quite slow since it has to follow
national budgeting and disbursement calendars.
4.7.2 Umbrella Organisations
Umbrella organisations were created based on the successful experience of the South Western
Umbrella for Water and Sanitation. This organisation was created in 2002 in order to support WSSBs,
Sub-Counties, Town Councils, scheme operators (SO) and private operators (PO) with operation and
maintenance challenges, both technical, financial and managerial (Koestler and Jangeyanga 2012).
Today there are three operating Umbrellas in Uganda, with two more being set up. Their mandate is
limited to small piped schemes and they are attached to the Urban Water Department, but since a
large part of their members are RGCs and rural small towns, they are included in this study.
Umbrellas get detailed reports on a monthly basis from each member, and report on a quarterly
basis to the Urban Water Department.
Umbrellas were initially created as membership organisations which would run based on
membership fees. However, 95% of their budgets is still funded from outside. Approximately 240
million UGX (92,000 USD) per year is provided by the Joint Partnership Fund (JPF) and 150 million
(58,000 USD) is part of the Urban O&M Conditional Grant that is now sent directly to the Umbrellas.
The rest is provided by MWE and donors such as the Austrian Development Cooperation and the EU
providing specific support such as vehicles or capacity building.
4.7.3 Technical Support Units
TSUs are regional entities created to represent the Ministry at local level and to oversee rural water
and sanitation provision at District and Sub-County level. TSUs support the DWOs on request with
capacity building, technical advice and monitoring and evaluation, and report to the Rural Water
Department. They also help enforce reporting and monitoring routines. They are funded by the Joint
Partnership Fund (JPF), and today there are 8 TSUs in Uganda (MWE 2011b).
9 In Uganda, in order for a town to formally contract out the management of its water supply, it needs to be
constituted as a “Water Authority” by the Minster of Water and Environment (gazetted). A WSSB is created to
manage the contract on behalf of the Water Authority. A performance contract is signed between the Water
Authority and MWE, and a management contract is signed between the Water Authority and the private
operator. Gazetted towns fall under urban water supply.
15 Uganda LCCA Scan, Fontes Uganda Ltd, IRC Uganda June 2012
4.8 Main Government Players at Local Level
4.8.1 District Local Governments
There are currently 112 districts in Uganda, up from about 56 only a few years ago. The District is the
key entity at local level in charge or rural water and sanitation service provision. However, due to the
rapid creation of new districts, large amounts of the conditional grants have gone to setting up and
equipping offices, and districts are struggling to find adequate staff.
Rural water and sanitation activities mainly take place from the District Water Office (DWO), which
receives its main funding through the District Water and Sanitation Conditional Grant (DWSCG). This
grant is sent from the MoFPED on a quarterly basis, based on district workplans and budgets. In total,
52.1 billion Uganda Shillings (20 million USD) was disbursed in CG in 2010-11 to DWOs (MWE 2011b).
DWOs must use the grant based on guidelines from MWE (see chapter 6.2.1). Part of it can be passed
on to Sub-County after approved project plans. In addition, districts in Northern Uganda can access
the PRDP fund for water infrastructure development (see section 4.2.1). From FY 2011-12, the DWO
also receives the District Hygiene and Sanitation Conditional Grant (DHSCG), which is currently only
about 20 million (7690 USD) per district but it is hoped it will increase with time. 16 districts in
Eastern Uganda can also access the Uganda Sanitation Fund (see section 4.2.2). In addition,
household sanitation promotion is carried out from District Health Office (DHO) budgets, as well as
sanitation in health centres. The District Education Offices (DEO) also supports the rural water and
sanitation sector by enforcing sanitation and hygiene guidelines in both government and private
schools.
The DWO carries out supervision, community mobilisation, monitoring and evaluation and sanitation
promotion with own staff resources, however all design and construction works are contracted out
to the private sector. The district reports to MoFPED on a quarterly basis, with copy to MWE (and
MoH for household sanitation). Some annexes, such as information on new water sources, are sent
directly to MWE. See the District Implementation Manual for detailed reporting schedules (MWE
2007).
4.8.2 Sub-Counties
Sub-Counties are currently the lowest decentralised government structures that receive funds from
central government. They can access funding from the DWSCG by submitting plans for specific
activities to the DWO. Although the sector guidelines specify that 65% of the CG should go to the
Sub-Counties (MWE 2010), only limited activities are carried out by the Sub-Counties due to lack of
capacity. The Sub-County can also pay for small rural water and sanitation structures such latrines at
health centres or in public places from other funds received from the district outside the DWSCG. In
addition, software activities such as hygiene and sanitation promotion and water committee training
and follow up are carried out by Sub-County staff such as the Health Assistant and the Community
Development Officer (CDO). In rare cases the Sub-County can help with operation and maintenance
costs of water supplies, however all major repairs are referred to the district.

16 Uganda LCCA Scan, Fontes Uganda Ltd, IRC Uganda June 2012
4.8.3 Town Councils
Town Councils are small towns with a more than 5000 people and theoretically fall under urban
water and sanitation. However, for political or other reasons, even smaller localities can be lifted to
town council status. Some of these small town councils still use water and sanitation systems that are
largely rural, such as gravity flow schemes and simple piped schemes with public taps and public
latrines. For the purpose of this study, town councils that use scheme operators and not private
operators are considered rural. This is because towns with private operators normally have water
systems with a larger number of private connections that make them more financially viable and
hence interesting for the private sector to run. Schemes with large numbers of private connections
have more complicated distribution networks and are therefore considered as part of urban water
supply.
Town councils receive an Urban Operation and Maintenance Conditional Grant (the O&M CG for
RGCs is channelled through the Umbrellas). This grant was initially set up to bridge the gap between
Fig. 3: Stakeholder map for household sanitation. MoH through the DHO is responsible for
household sanitation. Activities are carried out from Sub-County and District level. Other main
actors are NGOs. ATC, TSU and UWASNET provide indirect support on promotion of technologies
and capacity building on different approaches. Umbrellas and WSDF only do household sanitation
as a minor component, same as MWE.

17 Uganda LCCA Scan, Fontes Uganda Ltd, IRC Uganda June 2012
water sales revenues and operating costs, but can also be used for large repairs and extensions
(MWE 2010). Staffing levels at town council level vary, but larger town councils have town engineers
that can give technical support to the SO or PO. Town council officials are also part of the WSSB
which oversees the SO/PO. However, the town councils cannot contract out activities, and
procurement therefore has to be done by the district.
4.8.4 Health Centres
Health centres at the different local levels are responsible for their own water and sanitation
supplies, which is funded through the health budget. However, they can call upon the DWO for
technical support. Operations costs of both water and sanitation facilities are to be covered by the
running budgets of the individual health centres, however operations and maintenance is a
challenge. A number of NGOs also support water and sanitation facilities in health centres. Health
centres report to the DHO.
Fig. 4: Stakeholder map for public sanitation. MWE through the DWO is responsible for latrines in
public places. Sub-Counties and Town Councils are indirectly responsible for their management by
supervising and monitoring the users. NGOs and donors also build public latrines. Part of the WSDF
programme is to provide public eco-san latrines in each place where they build a water scheme,
and the Umbrella follows up their management through support to the WSSB. UWASNET, TSU and
ATC as well as NGOs provide direct and indirect support through capacity building, advocacy and
technical guidance.

18 Uganda LCCA Scan, Fontes Uganda Ltd, IRC Uganda June 2012
4.8.5 Schools
Water and sanitation in government primary schools can be constructed using the DWSCG, or under
the education budget. The responsibility for new sanitation structures is not entirely clear, with both
the DWO and DEO and sometimes the Sub-County contributing in practice. Secondary schools and
private schools are responsible for their own water and sanitation facilities. A large number of NGOs
also support water and sanitation in schools. Operation and maintenance of water and sanitation
facilities must be covered by each school’s running budget, however the district can come in for large
repairs or pit emptying. Sometimes NGOs also help schools empty pits or rehabilitate structures.
Schools report to the DEO.
Fig. 5: Stakeholder map for sanitation in schools. Construction of latrines in schools can be done by
the DWO, DEO, Sub-County, NGOs or the school itself. Guidance on maintenance, technical support
and management support is provided by MoES, NGOs, DEO and MWE. ATC and UWASNET provide
indirect support through advocacy and technology research and development. MWE is also
involved in trying out new approaches and for example builds demonstration units.
19 Uganda LCCA Scan, Fontes Uganda Ltd, IRC Uganda June 2012
4.9 Local NGOs
50% of UWASNET members in 2011 were local NGOs. These receive funs mostly from international
NGOs or directly from donors. Local NGOs work closely with local government structures and
communities, and often have a more long-term approach than international NGOs. However, they
often struggle to maintain funding over time. They report to their respective donors and to
UWASNET on an annual basis.
4.10 Private Sector
The private sector is key in the Ugandan rural water and sanitation sector because most capital
investments are contracted out to companies, both by central government, local government, NGOs
and donors. A large number of drilling companies, construction companies and consultancy firms of
all sizes operate in Uganda doing most of the actual implementation work. Some drilling companies
also do community mobilisation and formation of water committees. A number of consultancy firms
carry out feasibility studies, borehole siting, research, development of manuals and guidelines and
evaluation and review. UNICEF is to try out a new concept where they make drilling companies
responsible for functionality (and hence operation and maintenance) of the water source for up to 5
years after construction. Capacity in the private sector is slowly increasing, but still requires
supervision for quality assurance purposes. On the other hand, private contractors struggle with
delayed payments for government contracts, and with retaining qualified staff between contract
periods.
4.11 Entities at community level
4.11.1 Water User Committee/Water Supply and Sanitation Board
For point water sources, WUCs are established to look after the facilities (MWE 2011a). WUCs are
responsible for operation and maintenance through the payment from households. For piped water
schemes, either WUCs or WSSBs are elected or appointed by the Sub-County or Town Council. The
WSSBs normally employ technical staff to carry out the actual operation and day to day management
of small piped schemes, which are normally more complex to operate than a handpump. They collect
revenues either through water sales or household contributions. WUC/WSSBs that are members of
an Umbrella organisation report to them on a monthly basis, others report to Sub-Counties or NGOs.
4.11.2 Scheme operators/private operators
Scheme operators or private operators are contracted by the WSSB to run piped schemes in RGCs
and small towns. Scheme operators (SO) are local individuals who have received training in running
the scheme, but normally do not have any formal training. For larger schemes, the WSSB contracts a
private operator (PO), which is a formally registered company with a much higher level of technical
and financial capacity than scheme operators. Both entities receive payment based on water sales
revenues, either as a percentage of the collected amount or as a flat fee (Koestler and Jangeyanga
2012). They report to the WSSB on a monthly basis.
4.11.3 Handpump Mechanics and Handpump Mechanic Associations
For each Sub-County, there should be at least one handpump mechanic (HPM). This is a local
individual trained to carry out minor repairs and replacement of fast-running spares on handpumps.
They are called by the WUC when a problem arises, and paid by the WUC for the job they do. Sub-
Counties facilitate the work of the HPM by providing tools and sometimes modes of transport. In

20 Uganda LCCA Scan, Fontes Uganda Ltd, IRC Uganda June 2012
some districts, HPMs have been encouraged to form HMP Associations. These support their
members with refresher trainings and follow up. HPM Associations are also able to do preventive
maintenance and monitoring to a larger extent than individual HPMs. They are supported by NGOs
and districts, and some have reached high level of expertise and are contracted by NGOs and District
to carry out certain large repairs as well (Brecht and Nekesa 2010).
4.11.4 Communities
Communities are the water users and mainly responsible for operation and maintenance of rural
water and sanitation services in Uganda (MWE 2011a). They contribute towards operation and
maintenance of water schemes through water tariffs or through monthly household contributions.
They also play a part in managing public sanitation facilities through village health teams and clubs.
As required by the sector schedules, they also contribute fixed cash amounts towards new water
facilities and rehabilitation of boreholes (see matrix) (MWE 2010).

21 Uganda LCCA Scan, Fontes Uganda Ltd, IRC Uganda June 2012
5 Costs Categories The different entities above carry out different types of activities and therefore contribute to the
different cost categories in the Ugandan water and sanitation sector. This section will look at more in
detail who does what, and what costs are covered by whom. The main guiding tool for this section is
the matrices, which can be found in appendix 4 and 5.
5.1 Capital Expenditures
This category is challenging because it encompasses a large number of activities; from baseline
studies, community mobilisation and promotion of self supply10
(software) to the construction of the
actual structures. In the sanitation sector it includes both the software activities trying to mobilise
people to build latrines and the actual cost of building the latrine. Software (SW) and hardware (HW)
activities are indicated on the map. CapEx also involves extensions of piped schemes, both the
software and hardware part. According to MWE, 71% of the DWSCG was spent on capital
expenditures in 2010-11 meaning 36.99 billion Uganda Shillings (14.2 million USD). This was mainly
spent on point water sources.
10
Self Supply is an approach that has been piloted by MWE in 6 pilot districts. The approach encourages
household investment in the improvement of low-cost technologies such as hand dug wells and rainwater
harvesting tanks (MWE 2011b).
Fig. 6: Stakeholder map for capital expenditures in water. The main players are the Districts, WSDF
and NGOs, and MWE in certain cases. Sub-Counties can contribute to a smaller extent, and
Umbrellas are only involved for extensions. Pre-studies and hardware construction is normally
carried out by the private sector. Communities contribute small cash amounts (see matrix) for each
technology.

22 Uganda LCCA Scan, Fontes Uganda Ltd, IRC Uganda June 2012
5.2 Operation Expenditures
Operations expenditures involves small repairs as well as expenses on running costs such as fuel,
chemicals and wages for water systems and soap, water and cleaning for sanitation structures. The
picture is quite different from the one above, since the main responsibility of OpEx in both the water
and sanitation sector lies with the users. This is a challenge, due to the low income levels of
households in rural areas. There are also still challenges with changing attitudes towards paying for
services, especially since other government services such as primary education and health care are
free (MWE 2011a). In addition, there is lack of capacity at community level in financial management,
safe storage of money and committee work, especially if communities are left in charge after only an
introductory training session. Challenges in OpEx are expressed by stagnant functionality of rural
water supplies (it has been fairly stable around 80%) and large numbers of dysfunctional water
points and public latrines (MWE 2011b).
Fig. 7: Stakeholder map for capital expenditures in sanitation. For household sanitation, the bulk of
the hardware expenditure lies with the households, since few programmes provide subsidies.
However, NGOs, WSDF, Districts and Sub-Counties are all conducting software activities to
promote latrine construction on household level. Public latrines are mainly constructed by WSDF
and the District, whereas latrines at schools and health centres are either constructed with district
funds or with help from NGOs. Most construction works are contracted out to private contractors
or masons.

23 Uganda LCCA Scan, Fontes Uganda Ltd, IRC Uganda June 2012
Fig. 8: Stakeholder map for operation expenditures in water. Users are the the key players. MWE
and the Umbrella only cover OpEx in case of emergencies or to pay for arrears or help out for
limited time. Scheme Operators and Private Operators are key players for piped schemes, and are
responsible for paying OpEx costs. The Urban O&M CG gives the Town Council the possibility to
subsidise the PO in case revenues from water sales are not enough. The only case in which the
DWO pays for OpEx is in IDP camps.

24 Uganda LCCA Scan, Fontes Uganda Ltd, IRC Uganda June 2012
5.3 Capital Maintenance Expenditures
CapManEx is one of the critical categories for sustainability. It includes large repairs, rehabilitation
and replacement; activities that are often too costly to cover by the users who are mainly tasked with
operation and maintenance in Uganda. The CapManEx maps can be a bit misleading because they
show a number of stakeholders involved, however in both the water and sanitation sector funds are
very scarce for CapManEx and difficult to obtain. However, the map still gives a good picture of which
entities are involved and where efforts can be concentrated. Details are provided in the matrix.
If the DWSCG guidelines are used as a basis, districts spent 4.16 billion (USD 1.6 million) mainly on
borehole rehabilitation in 2010-11. Divided by 112 districts, this is only 14,300 USD per district,
enough to rehabilitate one or two boreholes.
Fig. 9: Stakeholder map for operation expenditures in sanitation. For household latrines,
households are of course the main responsible for OpEx. In addition, communities are responsible
for OpEx of public latrines either through payment on use or through voluntary work on health
teams. In RGCs and small towns, Scheme Operators manage public latrines along with the water
system. There is a plan to integrate the management of public latrines in the contracts of the
Private Operators too, however currently it is not the case. OpEx at schools and health centres is
covered by the running budgets of the respective institution. In all cases, OpEx is a challenge.

25 Uganda LCCA Scan, Fontes Uganda Ltd, IRC Uganda June 2012
Fig. 10: Stakeholder map for capital maintenance expenditures in water. Ideally, SOs, POs and
communities should save money for CapManEx. However, this is rarely the case in practice. For
point sources the main source is the 8% for rehabilitation given in the DWSCG. However, this is
rarely enough for all rehabilitations and large repairs in a district. For piped schemes, the RGC or
town council can apply to MWE through the WSDF, however this process is long and the funds are
limited. The Umbrella can provide funds for large repairs, either as grants or as soft loans to the
WSSBs. Otherwise, town councils can use the Urban O&M CG for repairs. CapManEx is a challenge
because as the number of water infrastructure increases, the 8% of the CG stretches even less far.
In addition, many piped schemes and boreholes build in the 1990s and early 2000s have reached
the end of their life cycles and are due for major rehabilitation or replacement. NGOs sometimes
help but struggle raising funds for repairing systems that are already in place, as opposed to
constructing new schemes.

26 Uganda LCCA Scan, Fontes Uganda Ltd, IRC Uganda June 2012
5.4 Direct Support Expenditures
This category is poorly understood and documented, since it is extremely broad and involves
everything from monitoring and evaluation to overheads and administration costs of NGOs and
Districts that are directly supporting communities in the post-construction phase. An attempt has
been made to break down the category to some main sub-categories, but there are probably still
many activities missing. ExpDS has shown to be increasingly important for sustainability, especially in
order to maintain follow up, capacity building and mobilisation of WSSB/WUC and communities after
water and sanitation structures have been put in place. It is based on this recognition that the
Fig. 11: Stakeholder map for capital maintenance expenditures in sanitation. Pit emptying and
major repair of structures of household latrines is obviously covered by households. For public
latrines, the DWO is theoretically responsible but it is rarely carried out in practice. Some NGOs can
come in and help. Pit emptying for latrines at schools and health centres is the responsibility of
each institution, however since the costs involved are high they may apply to local government for
help. Major repair of structures is the responsibility of the District. Pit emptying can be a challenge
especially in schools, where latrines have many users and pits fill up quickly. Instead of emptying
pits, structures are often relocated in rural areas but this also involves a high cost. NGOs frequently
help schools improve sanitation by supporting CapManEx. Public latrines are often not constructed
with provisions for pit emptying either, and only few eco-san public latrines are emptied for re-use.

27 Uganda LCCA Scan, Fontes Uganda Ltd, IRC Uganda June 2012
Umbrella model is now rolled out across the country, based on successful experiences in South
Western Uganda, where functionality has been significantly higher amongst members than in other
areas of the country (MWE 2008). Post construction follow up of point water sources is theoretically
the responsibility of Sub-Counties and Districts (under the 11% of the CG for software activities),
however, NGOs are often reinforcing this effort. Although NGOs struggle to obtain funding for long-
term follow up, they often cross-finance follow up of previously constructed water points with the
construction of new ones in the same area.
If the guidelines for the DWSCG are taken as a basis, both the 11% for software and the 5% for
monitoring and evaluation could be considered under direct support. This would mean that 8.3
billion Uganda Shillings (USD 3.2 million) was spent by districts on rural water supply direct support in
2010-11. This is only 28,600 USD per district, and considering a new pickup costs between 30 and
40,000 USD in Uganda it is quickly finished especially by new districts. This figure means that the
spending on direct support costs in Uganda is approximately 0.1 USD/capita/year. Much lower than
the required benchmark range of 1-3 USD for point sources with handpumps found by the WASHCost
study (WashCost 2012). Direct support is an activity that needs a lot of movement to visit
communities and carry out refresher trainings and mobilization, so transport and salaries are the
highest expenditure categories at district level. Due to the activities of the Umbrella which mainly
consists of direct support activities, the entire Umbrella budget could be added to this figure which
would make it USD 3.35 million at a country basis for point and piped sources through government
channels.
For sanitation, the 6% of the DWSCG for household sanitation could be considered part of direct
support, which would be 3.1 billion Uganda Shillings (1.2 million USD), equalling 10,700 USD per
district. This can be added to the 1 million USD in the Uganda Sanitation Fund at a country level,
which is also mainly spent on direct support.

28 Uganda LCCA Scan, Fontes Uganda Ltd, IRC Uganda June 2012
Fig. 12: Stakeholder map for expenditures on direct support in water. The main players are NGOs,
Sub-Counties, Districts and the Umbrella. Town Councils provide some limited support to the WSSB
and PO. TSUs mainly provide support to the DWO, but can also interact directly with individual
schemes and communities. MWE also carries out some limited direct monitoring. Although the
main responsibility lies with the government structures (Sub-Counties and Districts), the most
comprehensive programmes are provided by the NGOs for point sources and by the Umbrellas for
piped schemes. This direct support to communities, WUC/WSSB include capacity building, help
with financial management, technical support and monitoring. Some support in how to play an
active role in managing individual schemes is also provided to Sub-Counties and Town Councils.

29 Uganda LCCA Scan, Fontes Uganda Ltd, IRC Uganda June 2012
5.5 Indirect Support Expenditures
This category is even more vast than ExpDS, because it involves basically the entire portfolio of MWE,
as well as activities in line ministries and international NGOs that are difficult to disaggregate. These
costs cannot be broken down to individual schemes or communities, but are still important in
providing an enabling environment in which construction and follow up of rural water and sanitation
systems can take place. A suggestion of sub-categories is provided in the matrix, but also here there
are probably a number of activities that could be added. ExpIS includes basically everything that has
to do with the rural water and sanitation sector but that cannot be allocated to a specific community
or scheme.
Fig. 13: Stakeholder map for expenditures on direct support in sanitation. Direct support activities
in sanitation include technical support, monitoring, continuous mobilisation and hygiene
promotion activities and training of masons in construction of latrine technologies. The main actors
are the District, Sub-County and NGOs. WSDF does limited household sanitation promotion and
post-construction baseline survey. The Umbrella only indirectly follows up through guiding the
WSSBs in how to manage their public latrines. TSUs also only have limited activities. NGOs and the
District provide technical support to health centres and schools in how to properly manage their
structures. In addition, ATC carries out training of TSU, Districts, NGOs and masons in construction
of different technologies.

30 Uganda LCCA Scan, Fontes Uganda Ltd, IRC Uganda June 2012
According to the Sector Performance Report (MWE 2011b), 104.2 billion Uganda Shillings (40 million
USD) was budgeted for activities at a central level in 2010-11. Although this would mainly consist of
indirect support expenditures, it has to be noted that MWE also directly carries out some large
infrastructure programmes. This is for both the water and sanitation sector, and both rural and urban
sectors.
Fig. 14: Stakeholder map for expenditures on indirect support in water. The main actor is MWE,
who carries out most of policy making, sector coordination, provision of guidelines and also
technical support and capacity building to lower government entities. Entities like TSU and
UWASNET also mainly do ExpIS activities, as well as ATC. WSDF carries out some capacity building
of Districts only, same as the Umbrella. Local NGOs often support Sub-Counties and Districts on a
general basis with training, monitoring and technical support, and some international NGOs have a
large advocacy component and support government in preparing manuals and guidelines, carrying
out monitoring and evaluation and research.

31 Uganda LCCA Scan, Fontes Uganda Ltd, IRC Uganda June 2012
5.6 Cost of Capital
Only limited actors are involved in CoC expenditures, therefore this category is not illustrated with
maps. The largest part of CoC is paid by MoFPED to funding agencies such as the World Bank and
AFDB to service loans. Interests on these loans are significantly lower than commercial interest rates
but re-payments also go over longer periods, often longer than the duration of the infrastructure the
loans fund. Other loan servicing costs might be incurred by WSSB or SO for repayment of loans taken
for large repairs or extensions, although most get loans from the Umbrella which are interest free.
Households may take personal loans with microfinance institutions or banks to build household
latrines, and incur interest costs to service these loans.
Fig. 15: Stakeholder map for expenditures on indirect support in sanitation. The actors and their
roles are largely the same as for the water sector. Except some indirect support is given to schools
and health centres from MoH and MoES such as guidelines and curriculum development.

32 Uganda LCCA Scan, Fontes Uganda Ltd, IRC Uganda June 2012
6 Budgeting and Planning Tools In order to find out how costs are monitored in the sector, budget and planning tools were
investigated. Only budgeting and planning tools that involve cost data were considered during this
study. The aim of this chapter is not to provide in-depth description and analysis of the tools, but
rather an overview to map what is used in the sector.
6.1 Output Budgeting Tool
The output budgeting tool is a MsAccess (Microsoft Data Base Access) tool used by all government
departments to prepare budgets based on workplans, and then forwarded to Ministry of Finance,
Planning and Economic Development. Each sector sends their priorities to MoFPED using the tool,
which then prepares the national budget and budget framework paper. Departments use unit costs
for different rural water and sanitation technologies based on previous bills of quantities for different
water and sanitation infrastructure to prepare the budgets, but budgets also involve other costs such
as salaries and running costs.
6.2 District Budgeting
Districts receive Indicative Planning Figures or District Resource Envelopes which are guidelines of
approximately how much the District will receive the next financial year. The District then prepares a
workplan which is submitted to MWE for approval. MWE guides the districts on priority areas, both
geographical and in terms of technology. After the work plan has been approved, it is sent to
MoFPED for allocation of the funds. Funds are released to the districts on a quarterly basis, but
districts complain about delayed release of funds and less funds received than in the approved
workplans (only 91% of funds were released in FY 2010-11, MWE 2011b). Unused funds at the end of
the financial year must be returned to MoFPED (MWE 2010). In 2010-11, the absorption capacity in
the entire water and sanitation sub-sector was 96.3%, out of which 63.2% was for projects managed
by central government and 35.3% managed by local governments (MWE 2011b). This shows that the
decentralisation process still has to be implemented to a larger extent in practice, given that districts
are supposed to be the main players in rural water and sanitation provision according to sector
documents such as the District Implementation Manual (MWE 2007).
Districts prepare workplans and budgets based on historic cost information from previous bills of
quantities. This is mainly because the cost of technologies varies by region, and costs change year by
year with inflation. An exception is boreholes, where a unit cost tool exists for capital expenditures
(see section 6.4.1).
Please see the District Implementation Manual (MWE 2007) for a detailed description of the planning
and budgeting cycle of the DLG.
6.2.1 Conditional Grant
The main funding for the rural water and sanitation sector comes through the District Water and
Sanitation Conditional Grant (DWSCG). The grant is released from MoFPED based on district
workplans and budgets, approved by MWE. The amount released per district depends on coverage
and performance the previous year. This means that in practice, districts with low coverage should
receive more than districts which already have high coverage. There are strict guidelines of how the
district should use the CG, which are reviewed every year.
For the year of 2009-10, the guidelines were as follows (MWE 2010):
33 Uganda LCCA Scan, Fontes Uganda Ltd, IRC Uganda June 2012
- Not less than 70% of the CG is for rural water and sanitation hardware. This includes pre-
studies such as design and sometimes construction of public latrines (the practice is not
entirely clear) as well as water quality monitoring. DWOs focus on point sources but the CG is
also used for construction of GFS and small piped schemes. This responsibility is to be taken
over by the WSDF. MWE handles large schemes that are beyond the capacity of the DWO to
handle, and funds are not taken from the CG. However, DWO is normally supposed to use
the CG for software activities and post-construction follow up of these large schemes. This is
mainly CapEx hardware, but also some CapEx software.
- Up to 11% is for software activities for rural water and sanitation. This includes CapEx
software such as initial training of water committees, but also post-construction follow up of
both water and sanitation facilities. It mainly falls under ExpDS, but monitoring has its own
allocation.
- Up to 8% is for borehole rehabilitation (CapManEx). This can also be used for large repairs
and replacement of small piped schemes, although this responsibility is increasingly handed
over to the Umbrellas. According to the O&M framework, DWSCG is only to be used for large
repairs in the short term, whereas in the long term communities should be able to pay for it
themselves (MWE 2011a). However, this will take time and is generally considered not to be
enough to cover the increasing needs for large repairs and borehole rehabilitation.
- Up to 6% can be used for construction of public sanitation facilities (CapEx). It is now
complimented by the DHSCG. Districts are supposed to follow up facilities up to 3 months
after construction.
- 5% can be used for supervision, monitoring and district operational costs. This includes
supervision of works (CapEx) and monitoring (ExpDS)
- = total 100%
In addition to this, the guidelines specify that not more than 4% of the total grant (not to be confused
with the 5% for supervision and monitoring) can be used for general DWO activities such as
reporting, accounting, running costs for vehicles etc (MWE 2010). The guidelines also give budget
headings to help districts with planning and budgeting.
The large amount allocated to new water (and sanitation) structures reflect the government’s focus
on achieving the Millennium Development Goals (MDG) (Uganda is on track for water) and its own
targets which are 77% access for the rural population and 100% access for the urban population by
2015. However, due to challenges in functionality, a large number of people that have gained access
are in risk of “slipping”. In addition to challenges on OpEx level, the 8% allocated for large repairs and
rehabilitation is not enough to maintain sources when districts get more and more sources every
year. For example, Jinja district was allocated 579 million UGX (220,000 USD) in 2011-12 meaning
only 42.32 million (16,000 USD) is for CapManEx for the entire district.
Another problem is that since the total water budget has remained stagnant, the proliferation of
districts means each district gets less every year. For example, Jinja saw a reduction from 800 million
UGX (305,000 USD) to 579 million UGX (220,000 USD) from FY 10-11 to FY 11-12. Another challenge
is that many districts have already exhausted the areas where low cost technologies such as shallow
wells and springs are possible, and now have to move to more expensive types of water supplies
such as deep boreholes and pipes schemes to supply the remaining communities. This means higher
investment costs per capita and therefore the possibility to serve less people.

34 Uganda LCCA Scan, Fontes Uganda Ltd, IRC Uganda June 2012
6.3 Per Capita Investment Cost
One of the golden indicators is the per capita investment cost of water and sanitation schemes
(although it is only calculated for water). The indicator is calculated by taking the total MWE and DLG
expenditure on new systems divided by the number of people served (CapEx , both hardware and
software). The per capita cost in the rural sector was 47 USD, up from 41 the previous year, and the
per capita cost in the urban sector was 40 USD11
, down from 46 the previous year (MWE 2011b). The
indicator is also calculated specifically for the DWSCG, and for hardware only as well (see Sector
Performance Report, MWE 2011b).
This indicator is mainly used by the government to report to donors on the effectiveness of their
funds. However, there are several challenges attached to this indicator. For example, costs keep
increasing due to inflation. In addition, per capita investment costs vary significantly from technology
to technology. For example, a gravity flow scheme (GFS) can serve a large number of people at a
relatively low cost. Therefore, if many GFS were constructed in one year, the per capita investment
cost will appear low. If a large number of solar systems are constructed the next year, the cost will
jump back up. The trends over the last years in the rural per capita investment costs could confirm
this statement: after steadily increasing from 31 USD in 04/05 to 44 USD in 07/08, the cost dropped
again to 41 USD in 09/10, before in jumped up to 47 USD in 10/11 (MWE 2011b). The need to
construct more expensive systems to reach the still un-served communities is likely to bring the cost
up again over the next years.
6.4 Unit Costs
Unit costs should not be confused with the Per Capita Investment Costs mentioned in the previous
paragraph. Unit costs refer to the average costs of specific technologies, and are used for budgeting
purposes. Unit costs can vary greatly due to a number of factors such as geography (distance from
Kampala), geology, pipe distance, topography and settlement pattern. Most respondents said they
mainly base budgets on previous costs of similar technologies, however the government has
developed two tools to calculate unit costs.
6.4.1 Borehole Drilling Unit Cost Tool
This Excel based tool is used by the engineers in the Rural Water Department to assist districts in
calculating the costs of borehole drilling. Examples of input variables are depth, type of casing and
diameter. The tool is mainly used by officials at the MWE at a central level, when asked for assistance
by the districts.
6.4.2 Sector Investment Model
In connection with the development of the Sector Investment Plan, an Excel based tool was
developed in 2005. It includes the rural and urban water sector, as well as water for production. Its
formulas are based on a number of variables such as location (district), hydro-geology, topography,
distance from capital and proportion of tarmac roads etc. It calculates costs per capita for a number
of rural technologies such as springs, boreholes, gravity flow schemes, piped schemes and rainwater
tanks. Figures for the urban sector are given in cost per m3. It also includes estimates for household
latrines, public latrines and latrines for schools. Yearly operation and maintenance costs are also
11
It is not clear from the SPR if inflation is controlled for, however it is to be assumed otherwise a sharp
increase would be noticed from year to year with an annual inflation rate at 15% for the year ending in June
2011 (MWE 2011b)

35 Uganda LCCA Scan, Fontes Uganda Ltd, IRC Uganda June 2012
calculated for the different technologies. The tool is currently used by the WSDFs, however it has not
been updated for a while and is not commonly used by the districts or MWE.
6.5 Tools of Other Actors
NGOs mainly reported that they base budgets on previous projects and their bills of quantities; some
revise and update with market prices. Some have standard shares for hardware and software costs,
for example WaterAid budgets 50% for hardware, 20% for overheads and 30% for software,
monitoring and evaluation.
6.6 Opportunities and Constraints
It was generally difficult to find standardised tools for budgeting and planning, most entities
including districts seem to base budgets on previous costs. This could be, according to MWE and
district officials interviewed, because costs vary largely based on regional differences, and previous
costs therefore give better estimate than generalised tools. Consequently, it is the private sector that
does the main work in preparing bills of quantities and budgets when they bid on projects, based on
their own experience and expertise. The developed tools such as the Sector Investment Model, is
only very rarely used and most respondents did not even know it existed.
A common characteristic of all the methods and tools is that they mostly focus on hardware. The
Sector Investment Model calculates a cost for yearly operation and maintenance (but not ExpDS) of
the different structures, and some NGOs include software shares in their budgets. However, focus in
the sector is still largely on hardware. This has a direct effect on the budgeting and hence the
financing available for OpEx, CapManEx and ExpDS, something has proven to be crucial for
sustainability.
In addition, budgeting tools are only effective if the input variables are updated frequently. For
example, it is important to keep updating the cost of materials with market prices, otherwise there
will be a large discrepancy between the budgets and the actual costs.
6.6.1 Benefits of Life Cycle Costs Approach
Applying the LCCA (or elements of it) in Uganda would put more emphasis on other costs than CapEx,
giving a complete picture of how much it will cost not only to extend a certain service level to the
entire population, but also how much it will cost to maintain these services and renew or upgrade
the required infrastructure once their life time has expired. Some benefits of the LCCA are (based on
Fonseca et al 2011):
- The LCCA is a commonly used tool for utility management and any business that aims to stay
viable in the foreseeable future. There are no compelling reasons why this approach should
not also be applied to the rural water and sanitation sector
- Technology choice will be done based on the full LCC of an infrastructure and not only based
on its CapEx or OpEx. This means that CapMaEx and ExpDS will also be considered. For
example, some low cost technologies require high and frequent CapManEx, and more
complicate systems will require higher ExpDS
- LCCA raises awareness amongst government, NGOs and donors about the importance of
ensuring OpEx, CapManEx and ExpDS is catered for before embarking on a project
36 Uganda LCCA Scan, Fontes Uganda Ltd, IRC Uganda June 2012
- It is possible to calculate the cost of NOT allocating sufficient funds for OpEx and ExpDS;
analysis would show that without the relatively low OpEx and ExpDS costs, much larger
expenses have to be incurred in form of CapManEx (or CapEx if the system is beyond repair).
- It would entail an assessment of the life cycles of different technologies. This could help local
government plan their CapManEx expenditure and budget for it, similar to what WUC and
WSSB are asked to do in their O&M plans
- For piped schemes, calculation of water tariffs would include CapManEx and ExpDS costs and
not only OpEx. If tariffs show to be prohibitively high at least the gap between willingness to
pay and real cost is identified and alternative sources of funds can be sought. This would
avoid situations where the private sector is given systems to run that are not really financially
viable. The Umbrella reports that WSSBs are only barely able to cover their operating costs
(MWE 2008), and the LCCA could help identify the magnitude of this gap and look for ways to
close it in a more systematic way than on a case to case basis.
- LCCA cost analysis would give government a better understanding of costs in the sector,
something that would improve budgeting, planning and also provide good basis for fund
raising. In addition, it would be possible to identify in which areas the different entities could
become more efficient.
- LCCA cost analysis data could provide the background for Government to make a strong case
for the need for better financing of OpEx, CapManEx and ExpDS in order to ensure
sustainability
- LCCA cost analysis would provide a better accountability for donors and improve good
governance in the sector
- LCCA cost analysis together with service level data could provide a good benchmarking tool
for local government structures (and NGOs)
- It would be possible to investigate the value for money of investments in the sector, for
different service levels
- Understanding the LCC in the rural water and sanitation sector could have a positive impact
on long term sustainability because it would point out the weaknesses in financing, the
entities involved and hence where emphasis has to be put in order to address the
weaknesses. By understanding and disseminating LCC the government could influence
donors, partners and NGOs to take a long-term approach to water and sanitation
development and steer implementation towards interventions that take into consideration
the real LCC of rural water and sanitation systems.
6.6.2 Constraints for LCCA in Uganda
A full adoption of LCCA may require the re-structuring of the budgeting, planning and policy
framework of the country. However, the LCCA can be adopted partly or in phases, and by opening up
for the LCCA thinking, government would already have taken a big step in the right direction. One of
the first exercises to be done could be to carry out a cost analysis exercise, linking service levels to
costs in the different cost categories. This report already provides part of the tools and the
framework to do this. Secondly, the data from such a cost analysis can be used to estimate life cycle
costs for different service delivery models in Uganda, and this can slowly be built into the policy
framework as well as the review processes. However, there are still a number of challenges to
overcome:

37 Uganda LCCA Scan, Fontes Uganda Ltd, IRC Uganda June 2012
- The Ugandan water sector does not have an asset registry (apart from the DWD database,
which can provide some guidance). It is therefore difficult to calculate life cycles of the
different components in place
- A number of cost categories are lumped up under current budget lines. It would take an
effort to for example disaggregate all the costs of MWE into rural/urban and then to the
different cost categories
- CapEx is a difficult category since it lumps up both software and hardware costs. If water
service provision is looked at as a continuous activity over time, it becomes difficult to
separate software costs for a new extension from ExpDS (you could argue that all the ExpDS
is in fact a preparation for the next extension). Uganda should therefore consider breaking
down this category or adapting it more to the local context.
- It would be difficult to estimate the expenses of entities such as donors and NGOs that
operate outside of the government framework and do not report to MWE or UWASNET,
unless they can be motivated to take part of the learning alliance
- It would be challenging to estimate the costs incurred by the communities in running the
facilities because most do not report to anyone. However, communities followed up by
Umbrellas are encouraged to keep monthly records and even some rural communities keep
records
- It would take an effort to survey the NGOs, since their activities and budgets are very diverse
and practices vary from organisation to organisation. However, they are often more flexible
and willing to take part in such an exercise than the private sector, donors or the government
- Data from the districts is not always reliable. Districts are supposed to submit detailed
reports and accountability, but Ministries complain that they are not always truthful in their
reporting. It is very expensive to verify data on the ground.
- The DWSCG does not follow the cost categories and some categories therefore need to be
disaggregated.
- Some entities might not be willing to share cost data
- Inclusion or partial adoption of LCCA may mean a major restructuring of key financing
instruments such as the conditional grant. Such processes take time and are driven by many
other factors such as pressure from donors, development considerations for the country as a
whole and political issues. However, this is not necessary for the cost analysis stage.
- A drastic change in approach with focus on LCC can take focus away from expanding
coverage and could mean that the progress towards achieving targets could slow down in the
short term. However, in the long term the country will be better off and having a clear
overview over costs will make it easier to find a good balance between capital investments
and operations and maintenance. In addition, if monitored correctly, by efficiently
maintaining infrastructure you can actually increase coverage and avoid “slippage” where
populations lose access every year due to poor maintenance.
- There is still a significant level of corruption in the sector (MWE 2009a). This can skew costs
in various directions and cost data from the different entities might not be correct as
kickbacks and bribes are factored in.

38 Uganda LCCA Scan, Fontes Uganda Ltd, IRC Uganda June 2012
7 Conclusion and Way Forward: Extended Unit Cost Table This report provides the basis for a potential cost analysis of LCC in the Ugandan water and sanitation
sector, linking different types of costs to certain service levels. Using the matrices and the maps, the
entities involved in each cost category can be easily identified and approached for cost data.
Once collected, the data can be used in a number of ways. However, with focus on sustainability, one
of the ways of presenting the data is given below as an example. The Extended Unit Cost Table would
give a deep insight into the cost of establishing and maintaining different types of rural water and
sanitation services over 20 years, in different environments. This information would be valuable for
planning and budgeting purposes, but also for leverage towards development partners and NGOs in
order to ensure their programmes support the same long-term approach as government. It would
also provide hard facts to identify where there are financing gaps.
7.1 Main Variables
The Extended Unit Cost Table would be based on the existing unit cost calculation tools for budgeting
of hardware costs. However, in addition to calculating the cost of providing a new water source, it
could be extended to the other cost categories in order to get an impression of how much it costs to
maintain the structure over time. From there, a yearly average can be calculated to keep the systems
running, and this could be a powerful tool for government to re-structure the institutional setup and
financing streams in a way that have higher impact on sustainability. In addition, by looking at the
different categories, the government would also be in position to plan what capacities are needed in
the sector in the next 20 years in order to provide the necessary services. In addition to costs per unit
of infrastructure, tables could calculate costs per capita.
Tables could be produced for each technology choice (deep borehole, shallow well, gravity flow
scheme, small piped scheme, small piped solar scheme etc.), or even disaggregated to regional
levels. They should also take into account the settlement patterns of the population, which has a
direct impact on per capita costs. At least six categories (semi-nomadic, rural farming, rural
community, rural growth centre, urban fringes and central urban areas) should be considered.
7.2 Factors to Consider
It is necessary to carefully a number of factors when preparing the Extended Unit Cost Tables.
Reaching conclusions on each of them is beyond the scope of this study, but some have been listed
below for consideration in future studies:
- It has to be decided whether to use reported population (based on government standard
estimates per technology), actual population or design population figures to calculate per
capita costs
- The definitions of the different categories of settlement patterns have to be clearly spelled
out
- A careful choice has to be made of which technologies to consider, both in the water and
sanitation sector to get a list of the most prominent technologies used in the different
service models
- It is generally acknowledged that the financing of OpEx, CapManEx and ExpDS is not
adequate in the rural water and sanitation sector (MWE 2011b). Using data based on historic
data therefore only gives the current situation, and not how it should be to improve

39 Uganda LCCA Scan, Fontes Uganda Ltd, IRC Uganda June 2012
sustainability. The data is therefore only of limited use for planning purposes as it is. For
these categories it is therefore necessary to estimate “ideal” situations. This can be done
using successful schemes as models, or by making careful estimates. The difference between
the two costs would illustrate the current funding gap.
- The age of the water and sanitation structures surveyed must be taken into account
- Manufacturer lifetime has to be compared to actual life time (in most cases, the actual
lifetime is shorter than the manufacturer lifetime, Ratna Reddy 2010)
- The potential for extensions has to be factored in, for example with an “extension factor”. In
theory, all systems should be extended at one point in time.
- It should be considered to break down the CapEx category to better see the different
components of it. Software should maybe run as a continuous activity instead of being part
of CapEx until handover, and then part of ExpDS.
7.3 Example
The example is done for a borehole. Costs are not real and just put there for purposes of showing
how the table will work.
Table 1: Extended Unit Cost Table for Borehole in Rural Farming Area
in USD
CapEx
(Hardware
and
Software)
OpEx
(including
wages)
CapManEx
(assuming
OpEx is
continuously
paid)
ExpDS
(assuming
economies
of scale)
Total
Borehole (in lifetime) 15,000 1500 2000 15,000 33,500
Borehole (per year)
assuming 20 years
lifespan
750 75 100 750 1675
Borehole (per capita
per year) assuming
200 people
3.75 0.375 0.5 3.75 8.375
The table shows that it will cost society 1675 USD yearly to put in place a borehole and keep the
system running for 20 years (925 USD per year for post-construction costs if the initial investment is
removed), and that the entire “project” (providing a person with a water system and keeping it
running for 20 years) will cost 8.375 USD per capita per year.
In developing countries, unit costs and per capita costs vary immensely between regions in the
country. However, through tax systems, clever payment schemes and government subsidies, people
in areas with low per capita costs cross-finance access to water and sanitation for people in areas
with high per capita costs, for example in rural areas. The average yearly figure (average of all
technologies and settlement patterns) represents the cost of everyone having access to water and
sanitation on a continuous basis. Since right to water and basic sanitation is a human right, the
average per capita LCC would tell us how much it would cost for everyone in the country to have
access. These figures could also inform the way government implements projects; for example, due
to economies of scale and cross-financing it could be economically more efficient to provide 100%
coverage to an entire district before moving to the next.

40 Uganda LCCA Scan, Fontes Uganda Ltd, IRC Uganda June 2012
Since the water and sanitation sector budgets in most developing countries are constraint both by
local revenues and by the availability of donor funds, the Extended Unit Cost Table would be an
important tool to allocate the available funds in a way that ensure continuous operations (and hence
continuous access for the population) of all water and sanitation systems already improved.
Continuous access could be expressed in new indicators such as Water-Person-Years, in order to
indicate that the country is making an effort to prevent slippage and to maintain the access gained. If
more systems were functional, money put into rehabilitation and new systems to replace
dysfunctional ones could be put towards increasing coverage, and this could be enough for the
country still to reach its targets. By what margin is only possible to know once the cost tracking
exercise has been carried out in a detailed and consistent way.

41 Uganda LCCA Scan, Fontes Uganda Ltd, IRC Uganda June 2012
8 References
Brecht and Nekesa (2010) ‘Connected Hand Pump Mechanics for Improved Service Delivery – A Case
Study of District Based Associations of Hand Pump Mechanics in Uganda as a Supporting
Mechanism, Pumps, Pipes and Promises, IRC 2010 Symposium, the Hague
Fonseca et al (2010) Life-Cycle Costs Approach- Glossary and cost components, Briefing Note 1,
WASHCost, IRC International Water and Sanitation Centre, the Netherlands
Fonseca et al (2011) Briefing Note 1a, Life Cycle Costs Approach – Costing Sustainable Services,
WASHCost, IRC International Water and Sanitation Centre, the Netherlands
Koestler and Jangeyanga (2012), Development of Service Delivery Indicators for the Water Supply
and Sanitation Boards (WSSB) Service Delivery Model, Triple-S Uganda, Uganda
Koestler et al (2010) ‘The cost of keeping a rural water system running – Cost tracking of three rural
water supplies in Uganda’, Pumps, Pipes and Promises, IRC 2010 Symposium, the Hague
Moriarty et al (2010) Ladders for assessing and costing water service delivery, Working Paper 2,
WASHCost, IRC International Water and Sanitation Centre, the Netherlands
MWE (2004) A national framework for operation and maintenance of rural water supplies,
Directorate of Water Development, Ministry of Water and Environment, Uganda
MWE (2007) Water and Sanitation Sector District Implementation Manual, Ministry of Water and
Environment, Government of Uganda, Uganda
MWE (2008) Feasibility Review of the Umbrella Organisations Model of Operation and Maintenance
of Small Towns and Rural Growth Centres Water Supply and Sanitation Systems, Directorate of
Water Development, Ministry of Water and Environment, Uganda
MWE (2009a) Baseline Survey on Integrity in the Uganda Water Supply and Sanitation Sector (WSS),
Executive Summary, Ministry of Water and Environment, Uganda
MWE (2009b) Operations Manual for the Water and Sanitation Development Facility, Directorate of
Water Development, Ministry of Water and Environment, Uganda
MWE (2010) Water and Sanitation Sector Sectoralspecific Schedules/Guidelines 2009/10, Ministry of
Water and Environment, Government of Uganda, Uganda
MWE (2011a) National Framework for Operation and Maintenance of Rural Water Supplies in
Uganda, Directorate of Water Development, Ministry of Water and Environment, Uganda
MWE (2011b) Water and Environment Sector Performance Report 2011, Ministry of Water and
Environment, Government of Uganda, Uganda
Ratna Reddy et al (2010) ‘Life-Cycle Costs Approach (LCCA) for Sustainable WASH Service Delivery: A
Study in Rural Andhra Pradesh, India’, Pumps, Pipes and Promises, IRC 2010 Symposium, the
Hague
Unknown (2011) Institutional Needs Gap Assessment and Detailed Design of the proposed Water
and Sanitation Development Facility (WSDF) Uganda, ??
WashCost (2012) Funding recurrent costs for improved rural water services, WASHCost Infosheet 3,
December 2012, IRC, The Netherlands
42 Uganda LCCA Scan, Fontes Uganda Ltd, IRC Uganda June 2012
9 Appendices
List of appendices:
1. Water Master Map
2. Sanitation Master Map
3. List of people interviewed
4. Cost Matrix Water
5. Cost Matrix Sanitation


List of People Interviewed
Institution Sn Name Title Telephone
Contact
E-mail Information
Water Aid 1 Geoffrey Kidega Snr Programme
Coordinator
256392947412 geoffreykidega@water aid.org
Water Aid 2 Milly Akwi Snr Programme
Coordinator
256782611708 [email protected]
Ministry of Water and
Environment
3 Ivan Biiza Peter Economist 256782848455
256704933982
Ministry of Water and
Environment
4 Mogens Mechta Senior Sector Advisor
DWD
256775494491
256414505943
Ministry of Water and
Environment
5 Helmut Jung O & M Technical
Advisor
256783143831
25641
PLAN International 6 Dan Barigye EC-WASH Project
Manager256776891864 [email protected]
Office of the Prime Minister
(OPM)
7 Benon Snr Ass. Secretary
NUR
Ministry of Health 8 Julian M. Kyomuhangi Ass. Commissioner
Env.l Health Div.
256772429336 [email protected]
Appropriate Technology
Center (ATC)
9 Paul Kimera Snr research and
T raining Officer
256772685053 [email protected]
Appropriate Technology
Center (ATC)
10 Ashabrick Nantege
Bamutaze
Training and
Development Officer
256702723475
256414690806
UWASNET 11 Josephine Mugala Prog Officer Research
& Development
256782449167
256782723475
WE-Consult 12 Ron Sloots Director 256772222049 [email protected]
Ministry of Water and
Environment
13 David Mukama Sanitation Coordinator 256772435634 [email protected]
WSDF-Central 14 FelixTwinomucunguzi Branch Manager 256772588651 [email protected]
Ministry of Water and
Environment
15 Ronald Nyakana Monitoring Officer 256772439115 [email protected]
Ministry of Water and
Environment
16 Erisa Kyeyune Snr. Water Officer 256782618154 [email protected]
Ministry of Water and
Environment
17 Richard Kirya Economist 256752956215 [email protected]
Ministry of Water and
Environment
18 James Sseguya Engineer
Rural Water Dept
256772883022 [email protected]
Ministry of Water and
Environment
19 Paul Nyeko Ogiramoi Principal Engineer
Planning &
256712813380
UNICEF 20 Prakash Lamsal Wate, Sanitation &
Hygiene Specialist
256717173450 [email protected]
District Local Government -
Jinja
21 David Mwase Ass. District Water
Officer
256772524058
256701524058
256754524058
Kanungu nDistrict Local
Government
22 Ambrose Byaruhanga Ass. District Water
Officer
256782292216
256702292216
256752292216
Kasese District Local
Government
23 Robenson Masereka
Kalende
Healt Assistant Lake
Katwe Sub County
256776545021
256704382505

Cost Category Cost Sub-Category Organization/Agency paying Sources of Funds CommentsNGOs International NGOs, Donor Funds Consultants are used for more technical studies like borehole
siting, participatory assessments etc. are often done by the
NGOs
MWE GoU Only for large schemes, emergency, political pledges. Usually
hires consultants but sometimes engages own technical
personnel
DWO MoFPED Designs for piped schemes must always be approved by
MWE
Multilateral agencies/UNICEF Multilateral agencies/UNICEF Through consultants, paid directly by UNICEF but done
together with DWO
Donors Donors Normally contracting consultants
Private contractors NGOs, MWE, DWO, UNICEF, WSDF,
Donors
Hired to carry out the actual studies
WSDF MWE, JPF, Donor Funds For RGCs and Small Towns. Hires consultants for large
schemes, do it themselves for small ones
NGOs International NGOs, Donor Funds Normally carried out by local partner NGOs
MWE GoU For larger projects
WSDF MWE, JPF, Donor Funds For RGCs and Small Towns. In cooperation with Umbrella
Multilateral agencies/UNICEF Multilateral agencies/UNICEF
Donors Donors This is quite rare because most donors provide funding
through sector support or JPF. However, some, like USAID
still do direct implementation
DWO MoFPED up to 11% of CG can be spent on software, both pre and post
construction
NGOs International NGOs, Donor Funds
Private contractors DWO, NGOs, Donor Funds Technically competent person on contracture team is to
supervise works at the site throughout construction
DWO MoFPED MWE can assist DWO in supervision of contracts for small
piped schemes
WSDF MWE, JPF, Donor Funds The procuremnt is done by the Districts but the contracts are
managed and supervised by WSDF
Multilateral agencies/UNICEF Multilateral agencies/UNICEF Together with DWO
Donors Donors This is quite rare because most donors provide funding
through sector support or JPF. However, some, like USAID
still do direct implementation
NGOs International NGOs, Donor Funds
DWO MoFPED In six pilot districts
NGOs International NGOs, Donor Funds construction works are usually contracted out to private
companies, communities often contribute with labour or in
kind
Sub County DLG small works such as rainwater harvesting tanks for public
buildings. Part of DWSCG or other grants.
Private contractors DWO, NGOs, MWE, DWO, WSDF,
UNICEF
Carry out the actual construction works
Community Labour, household collections, in kind,
individual households pay for their own
sources (self supply)
A GoU requirement to encourage community ownership of the
system. Small & Medium spring 45,000, Ex-large spring
100,000, deep borehole 200,000, shallow well 100,000, GFS
45,000 per tap, buy/offer land for piped schemes and 50,000
per kiosk. 50,000 in connection fee for private connections
MWE GoU Only for large schemes, emergency, political pledges. Mostly
contracted out to private companies
DHO MoFPED Water at health centres. With technical support from DWO
DWO MoFPED, OPM No less than 70% of CG should be used for construction of
new infrastructure. OPM funds only to districts affected by the
insurgency. Usually contracted out to private companies. This
includes water for Primary Schools (rarely done in practice
because of O&M challenges)
Multilateral agencies/UNICEF Multilateral agencies/UNICEF Contracted to PS, paid directly by UNICEF but done together
with DWO
Donors Donors This is quite rare because most donors provide funding
through sector support or JPF. However, some, like USAID
still do direct implementation, contracted to PS
WSDF MWE, JPF, Donor Funds construction works are usually contracted out to private
companies
MWE GoU Based on application by RGC or town council
DWO MoFPED, OPM Can be co-financed by sub-counties
Town Council MoFPED, DLG O&M Conditional Grant was initially meant for operations but
should also be used for extensions to increase coverage
WSDF MWE, JPF, Donor Funds Major activities applied for by the LG to MWE and WSDF
implement as re-investment mandate
(CapEx
Capital Expenditure)
Software: Supervision, monitoring and
evaluation of construction works
Extensions of piped schemes (Hardware)
Software: Promotion of self supply
(direct interaction with communities)
WASHCost Matrix: Water
Software: Pre-studies: (feasibility studies,
baseline surveys, etc)
Hardware (Capital investments,
engineering works etc)
Software (mobilization, training,
consultations, formation of committees
etc)

Umbrellas JPF, MoFPED, Donor Funds Financing of some extensions as part of O&M conditional
grant for RGCs. MWE acknowledges low capacity of the
Umbrella to implement expansion and extension, thus MWE
focuses on extension and new connections. Give soft loans to
WSSB for extensions
Multilateral agencies/UNICEF Multilateral agencies/UNICEF
DWO MoFPED Mobilise WSSB/WUC
Umbrellas JPF, MoFPED, Donor Funds Help WSSBs apply for extensions, help Sub-Counties and
Town Councils manage and supervise contracts for
extensions
Community Household collections for handpumps,
water sales revenue for small piped
schemes
Funds are normally managed by a water user committee,
water board/scheme operator or tap committees.
Handpump Mechanics Community, Sub-County, NGOs Hanpump Mechanics are paid by the community through the
WUC to carry out minor repairs. Sub-County supports HPMs
with tools etc. Some NGOs also support HPMs with modes of
transport etc.
Private contractors Multilateral agencies/UNICEF New system where drilling companies sign 5 year guarantee
contracts. Still in planning/testing phase
Scheme Operator Household collections or water sales
revenue
Small piped schemes in RGCs and small towns
Community Household collections or water sales
revenue
Through WUC, WSSB/SO
Town Council DLG Urban O&M conditional grant can be used to cover gaps in
operations expenses
MWE GoU Rarely happens, just in case of crisis or emergency, or to pay
arrears before new management takes over
DWO MoFPED Districs can use conditional grant funds for operations in IDP
camps because of effect of displacement on people's
livelihoods
Umbrella JPF, MoFPED, Donor Funds Just to cover arrears or in specific cases when emergency
interventions are necessary
Scheme Operator Household collections or water sales
revenue
In case people are employed by the SO. If not, allowances are
paid directly by the WUC/WSSB
Community, Household collections or water sales
revenue
Through WUC, WSSB
Community Household collections or water sales
revenue
Through WUC, WSSB. Loans can be accessed from for
example Umbrella. Bank charges in Uganda are high and can
represent a substantial cost for WUC/WSSB
Scheme Operator Household collections or water sales
revenue
Paid as part of SO operational expenditures
Scheme Operator Household colections or water sales
revenue
This can be bought either by the SO or by the WUC/WSSB
directly
DWO MoFPED Districs can use conditional grant funds for operations in IDP
camps because of effect of displacement on people's
livelihoods
Town Council DLG Urban O&M conditional grant can be used to cover gaps in
operations expenses
Community Household collections or water sales
revenue
Through WUC, WSSB
MWE GoUOne-off activity which takes place in event where district fails.
RGCs and TC can apply for major/emergency repair through
WSDF or directly to urban water department
DWO MoFPED up to 8% of Conditional Grant is for rehabilitation an can be
used for major repairs where community fails
Town Council DLG Urban O&M conditional grant can be used for large repairs
WSDF MWE, JPF, Donor FundsFor RGCs and small towns. District applies to MWE for funds
and WSDF contracts out major repair as re-investment. Slow
procedure because budgeting cycle has to be followed
Private contractors MWE, DWO, WSDF, Umbrella, NGOs Carry out the actual construction works
Community Household collections, saved revenue
from water salesThe community rarely has sufficient saved funds for major
repairs. Some try to mobilise extra funds with house to house
campaigns. GoU requires 90,000 cash contributions for
borhole rehabilitation
Umbrella JPF, MoFPED, Donor Funds Can pay for large repairs directly or give soft loans to WSSB.
Helps organise spares and replacements
HPM Associations DWO, NGOs In some cases, where the HPM Association is capable, it can
be contracted by the DWO or NGOs to carry out large repairs
such as fishing dropped rods etc.
NGOs International NGOs, Donor Funds Normally not in policy but done on case by case basis
DWO MoFPED, OPM 8% of CG is for rehabilitation, normally contracted out to
private companies
MWE GoU In emergencies, political pledges
HPM Associations DWO, NGOs Where the HPM Association is capable, they can do parts of
borehole rehabilitation, however not the part that requires
expensive machinery
Private contractors MWE, DWO, NGOs Carry out the actual works
NGOs International NGOs, Donor Funds As part of specific project/programme
Major repairs
Borehole rehabilitation
Extensions of piped schemes (Software)
Bank charges, loan repayments
OpEx
(Operational Expenses)
Fuel/power
CapManEx
(Capital Maintenance
Expenditures)
Minor repairs/preventive maintenance
Salaries and wages, sitting allowances
Chemicals, cleaning materials, etc

MWE GoU Limited to emergencies such as disaster occurance,
presidential pledge
Umbrella JPF, MoFPED, Donor Funds WSSB can apply for soft loan or support from Umbrella for
replacements, especially emergency failures
WSDF MWE, JPF, Donor Funds For RGCs and small towns. WSDF applies to MWE and for
funds and contracts out replacement as part of re-investment
activity
NGOs International NGOs, Donor Funds Normally not in policy but done on case by case basis
DWO MoFPED DWO usually has limited capacity due to insufficient funds
under th CG. 8% for rehabilitation can be used for
replacements
NGOs International NGOs, Donor Funds,
Multilateral agencies/UNICEF
Some NGOs can follow up over time, and sometimes pay for
follow up after end of project period through cross-financing
from new projects in the same area. Can be integrated in
sanitation/hygiene/education programme
Umbrella JPF, MoFPED, Donor Funds Only to WSSBs of piped schemes. Quarterly visits to all
members, support financial management,
Sub County DLG Through community development officer (CDO)
DWO MoFPED up to 11 % of CG is for software (both for pre and post
construction). This is the main role of DWO but often limtied in
practice due to lack of resources for transport
TSU JPF Mainly supports DWO but also goes directly to the
communities
NGOs International NGOs, Donor Funds,
Multilateral agencies/UNICEF
Town Council MoFPED Through town engineers
DWO MoFPED Part of 11% of CG software budget for existing water points
HPM Associations Community, Sub-County, NGOs Training of pump caretakers, technical advice
Umbrella JPF, DLG Only to WSSBs of piped schemes mostly on request. Has
qualified staff to support SO or WSSB on technical problems
DWO MoFDEP This is sometimes part of the software activity. O&M plans for
point sources and business plans for piped schemes are a
requirement from GoU
Umbrella JPF, MoFPED, Donor Funds For RGCs and Small Towns. Encourages WSSBs to have
O&M/business plans and helps them make requests for
extensions etc.
NGOs International NGOs, Donor Funds Special focus in the last years has been on how to create
revolving funds from handpump household collections
Umbrella JPF, MoFPED, Donor Funds For RGCs and small towns. Should be done on a quarterly
basis
DWO MoFDEP For point water sources. Not carried out very regularly. Part of
CG hardware budget
Umbrella JPF, MoFPED, Donor Funds For RGCs and small towns, audits once a year
NGOs International NGOs, Donor Funds Mostly for larger GFS or small piped schemes
Legal services Umbrella JPF, MoFPED, Donor Funds For RGCs and small towns, on request
DWO MoFPED 5% of the CG is for M&E, Districts reports quarterly to MWE
on fixed indicators based on reports from Sub-Counties
Sub County DLG Reports to District, can be asked to carry out surveys on
specific indicators by District
Umbrella JPF, MoFPED, Donor Funds Monthly reports from schemes to Umbrella, report on a
quraterly basis to Urban Water Dep. In MWE
TSU JPF Carries out some monitoring in cooperation with DWO
MWE GoU Mostly through districts but some direct monitoring is done
NGOs Interntional NGOs, Donor Funds Mostly on own projects, some not all report to UWASNET
annually. Some report to DWO where they work
MWE GoU This is one of the main roles of MWE
DWO MoFPED Through quarterly reporting and annual work plans sent to
MWE
MoFPED GoU Allocates money based on budgets and available funds
Technical backstopping and support
(directly to individual
schemes/communities)
Replacement
Support to Water Committees (refresher
training, follow up)
Mobilisation for sustainability:
preparation of O&M/business plans,
funding requests, savings and income
generating schemes
Monitoring and Evaluation (data from
individual communities)
Water Quality Testing
Financial Services, Audits
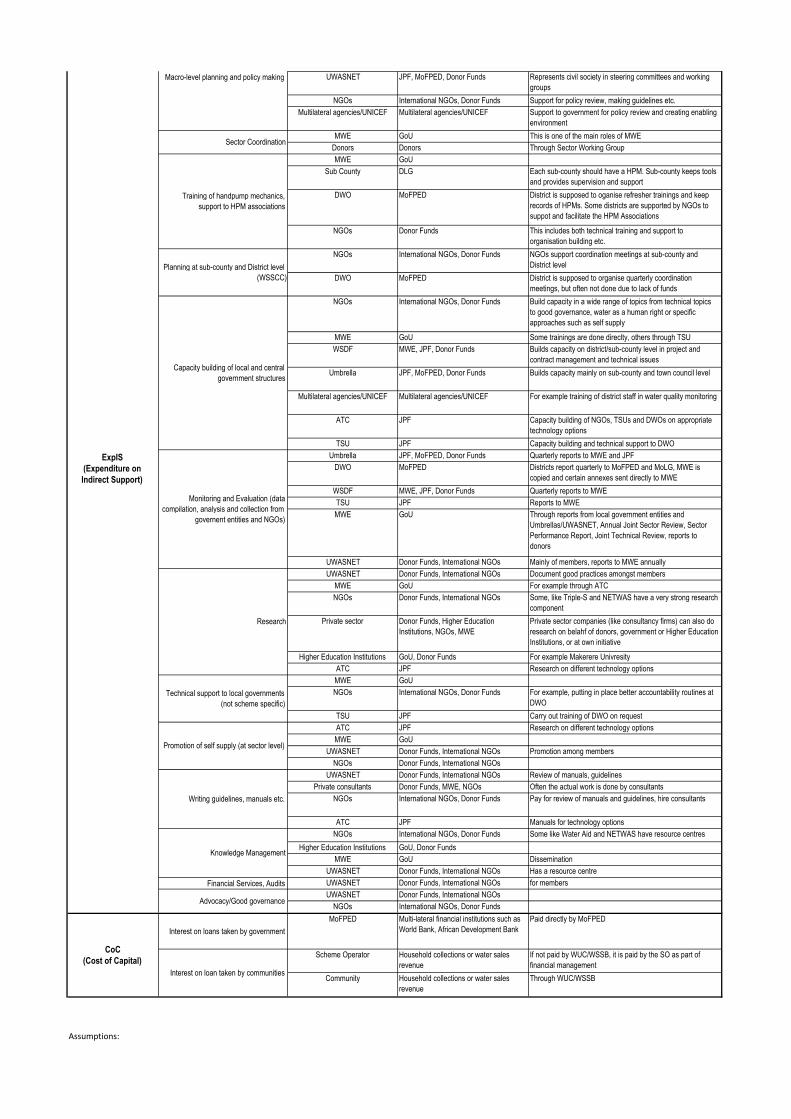
UWASNET JPF, MoFPED, Donor Funds Represents civil society in steering committees and working
groups
NGOs International NGOs, Donor Funds Support for policy review, making guidelines etc.
Multilateral agencies/UNICEF Multilateral agencies/UNICEF Support to government for policy review and creating enabling
environment
MWE GoU This is one of the main roles of MWE
Donors Donors Through Sector Working Group
MWE GoU
Sub County DLG Each sub-county should have a HPM. Sub-county keeps tools
and provides supervision and support
DWO MoFPED District is supposed to oganise refresher trainings and keep
records of HPMs. Some districts are supported by NGOs to
suppot and facilitate the HPM Associations
NGOs Donor Funds This includes both technical training and support to
organisation building etc.
NGOs International NGOs, Donor Funds NGOs support coordination meetings at sub-county and
District level
DWO MoFPED District is supposed to organise quarterly coordination
meetings, but often not done due to lack of funds
NGOs International NGOs, Donor Funds Build capacity in a wide range of topics from technical topics
to good governance, water as a human right or specific
approaches such as self supply
MWE GoU Some trainings are done direclty, others through TSU
WSDF MWE, JPF, Donor Funds Builds capacity on district/sub-county level in project and
contract management and technical issues
Umbrella JPF, MoFPED, Donor Funds Builds capacity mainly on sub-county and town council level
Multilateral agencies/UNICEF Multilateral agencies/UNICEF For example training of district staff in water quality monitoring
ATC JPF Capacity building of NGOs, TSUs and DWOs on appropriate
technology options
TSU JPF Capacity building and technical support to DWO
Umbrella JPF, MoFPED, Donor Funds Quarterly reports to MWE and JPF
DWO MoFPED Districts report quarterly to MoFPED and MoLG, MWE is
copied and certain annexes sent directly to MWE
WSDF MWE, JPF, Donor Funds Quarterly reports to MWE
TSU JPF Reports to MWE
MWE GoU Through reports from local government entities and
Umbrellas/UWASNET, Annual Joint Sector Review, Sector
Performance Report, Joint Technical Review, reports to
donors
UWASNET Donor Funds, International NGOs Mainly of members, reports to MWE annually
UWASNET Donor Funds, International NGOs Document good practices amongst members
MWE GoU For example through ATC
NGOs Donor Funds, International NGOs Some, like Triple-S and NETWAS have a very strong research
component
Private sector Donor Funds, Higher Education
Institutions, NGOs, MWE
Private sector companies (like consultancy firms) can also do
research on belahf of donors, government or Higher Education
Institutions, or at own initiative
Higher Education Institutions GoU, Donor Funds For example Makerere Univresity
ATC JPF Research on different technology options
MWE GoU
NGOs International NGOs, Donor Funds For example, putting in place better accountability routines at
DWO
TSU JPF Carry out training of DWO on request
ATC JPF Research on different technology options
MWE GoU
UWASNET Donor Funds, International NGOs Promotion among members
NGOs Donor Funds, International NGOs
UWASNET Donor Funds, International NGOs Review of manuals, guidelines
Private consultants Donor Funds, MWE, NGOs Often the actual work is done by consultants
NGOs International NGOs, Donor Funds Pay for review of manuals and guidelines, hire consultants
ATC JPF Manuals for technology options
NGOs International NGOs, Donor Funds Some like Water Aid and NETWAS have resource centres
Higher Education Institutions GoU, Donor Funds
MWE GoU Dissemination
UWASNET Donor Funds, International NGOs Has a resource centre
Financial Services, Audits UWASNET Donor Funds, International NGOs for members
UWASNET Donor Funds, International NGOs
NGOs International NGOs, Donor Funds
Interest on loans taken by government
MoFPED Multi-lateral financial institutions such as
World Bank, African Development Bank
Paid directly by MoFPED
Scheme Operator Household collections or water sales
revenue
If not paid by WUC/WSSB, it is paid by the SO as part of
financial management
Community Household collections or water sales
revenue
Through WUC/WSSB
Assumptions:
CoC
(Cost of Capital)
Macro-level planning and policy making
ExpIS
(Expenditure on
Indirect Support)
Interest on loan taken by communities
Capacity building of local and central
government structures
Research
Writing guidelines, manuals etc.
Knowledge Management
Advocacy/Good governance
Monitoring and Evaluation (data
compilation, analysis and collection from
governent entities and NGOs)
Technical support to local governments
(not scheme specific)
Promotion of self supply (at sector level)
Sector Coordination
Planning at sub-county and District level
(WSSCC)
Training of handpump mechanics,
support to HPM associations

Cost Category Cost Sub-Category Organization/Agency involved Sources of Funds Comments
NGOs International NGOs, Donor Funds
WSDF MWE, JPF, Donor Funds Public latrines in RGCs and small towns, sanitation baseline survey
at pre construction stage
NGOs International NGOs, Donor Funds Many NGOs use approaches such as CLTS
DWO MoFPED, USF 11% of conditional grant is for software for sanitation (and water).
From 2012, District Hygiene and Sanitation Conditional Grant. USF
only for 16 pilot districts in Eastern Uganda
MWE GoU For demonstration public latrines
Multilateral agencies/UNICEF Multilateral agencies/UNICEF For household sanitation, no subsidy
Sub County DLG promotionof household sanitation, training of village health teams,
training of health workers
WSDF MWE, JPF, Donor Funds Promotion for household sanitation in RGCs and small towns,
setting up management of public latrines in cooperation with
Umbrella
DHO MoFPED Ditrict Health Office is in charge of household latrines
DWO MoFPED For public latrines and latrines in schools.
DHO MoFPED For latrines at health facilities
WSDF GoU, Donor Funds Public latrines in RGCs and small towns
NGOs International NGOs, Donor Funds Public latrines, latrines at health facilities and schools
DEO MoFPED For latrines at schools
DWO MoFPED, USF For public latrines and latrines in schools. 6% of DWSCG is for
construction of latrines. From 2012, DSHCG. USF for 16 pilot
districts in Eastern Uganda. Sometimes part of 70% hardware
component of DWSCG can also be used for public latrines.
DHO MoFPED For latrines at health facilities
Sub County DLG Sub county can use part of their grant to build public latrines or
latrines at health centres
DEO MoFPED For latrines at schools
WSDF MWE, JPF, Donor Funds Public latrines in RGCs and small towns, household demonstration
latrines
Multilateral agencies/UNICEF Multilateral agencies/UNICEF Only public latrines
NGOs International NGOs, Donor Funds Public latrines, latrines at health facilities and schools, some give
subsidy to household latrines as well
Private Contractors/Companies,
local masons
DLG, MWE, NGOs, households,
Multilateral agencies/UNICEF
Carrying out the actual construction works and selling sanitation
materials such as pans and slabs. Often informal sector
Community household spending on own latrine Household latrines are mostly paid entirely by households
Community Household spending on own latrine or
household contributions to public latrines or
schools
For household latrines each household is responsible. For public
latrines, committees can ask for contributions in cash
Health Centres DLG Part of running budget
Schools DLG, household contributions Part of running budget, sometimes schools ask for contributions
from households in addition to UPE funds
Community Household spending on own latrine or
household contributions to public latrines or
schools
For household latrines each household is responsible.
Health Centres DLG Part of running budget
Schools DLG, household contributions Part of running budget, sometimes schools ask for contributions
from households in addition to UPE
Community Household spending on own latrine or
household contributions to public latrines or
schools
For household latrines each household is responsible. For public
latrines, committees can ask for contributions in cash or labour
Health Centres DLG Part of running budget
Schools DLG, household contributions Part of running budget, sometimes schools ask for contributions
from households in addition to UPE
Community Household spending on own latrine or
household contributions to public latrines or
schools
For household latrines each household is responsible. For public
latrines, committees can ask for contributions in cash
Health Centres DLG Part of running budget
Schools DLG, household contributions Part of running budget, sometimes schools ask for contributions
from households in addition to UPE
DWO MoFPED Public latrines (conflicting information)
NGOs International NGOs, Donor Funds Public and institutional latrines, not normally part of programme
Community Household spending on own latrine or
household contributions to public latrines or
schools
For household latrines each household is responsible. For public
latrines, committees can ask for contributions in cash
OpEx
(Operational Expenses)
Soap
CapManEx
Minor repairs/preventive maintenance
Cleaning
Water
Pit Emptying
WASHCost Matrix: Sanitation
CapEx
Capital Expenditure
Pre-studies: (feasibility studies,
baseline surveys, etc) for all types of
latrines
Software for household sanitation,
CLTS and other approaches, setting
up management structures for public
facilities
Supervision, monitoring and
evaluation of construction works
Hardware (Capital investments,
engineering works etc)

Health Centres DLG own latrines
Schools DLG own latrines
DWO MoFPED Public latrines
Community Household spending on own latrine or
household contributions to public latrines or
schools
For household latrines each household is responsible. For public
latrines, committees can ask for contributions in cash
Health Centres DLG
Schools DLG
NGOs International NGOs, Donor Funds Different NGOs continue mobilisation for different periods, from 3
months to 2 years
Multilateral agencies/UNICEF Multilateral agencies/UNICEF hygiene and sanitation promotion
Sub County DLG promotion of household sanitation, training of village health teams,
training of health workers
DHO MoFPED Household latrines
DWO MoFPED, USF Follow up of management of public latrines until 3 months after
construction
NGOs International NGOs, Donor Funds Demonstrations, explanation of different technologies
Umbrella JPF, MoFPED, Donor Funds Support to WSSB and SO in RGCs and small towns
DWO MoFPED, USF Public latrines
DHO MoFPED Household latrines
Multilateral agencies/UNICEF Multilateral agencies/UNICEF Sanitation in schools
NGOs Donor Funds, International NGOs
DWO MoFPED, USF
NGOs International NGOs, Donor Funds Different approaches are currently piloted
MoH GoU This is a priority area for MoH
ATC JPF
MWE GoU
WSDF MWE, JPF, Donor Funds In construction of eco-san public latrines in RGCs and small towns
NGOs International NGOs, Donor Funds In construction of different technologies
DWO MoFPED, USF Reports quarterly to MWE, copies MoH
WSDF MWE, JPF, Donor Funds Sanitation baseline survey at post construction stage
Umbrella JPF, MoFPED, Donor Funds WSSBs report monthly to Umbrella
NGOs Donor Funds, International NGOs mostly on own projects
NGOs Donor Funds, International NGOs Support for policy review, making guidelines etc.
UWASNET Donor Funds, International NGOs Represents civil society in steering committees and working groups
Multilateral agencies/UNICEF Multilateral agencies/UNICEF
MoE GoU Sanitation in schools
MWE GoU Household sanitation, public sanitation. Through an MoU between
line ministries signed in 2001, MWE is responsible for planning and
provision of sanitation facilities in RGCs and private places
MoH GoU Household sanitation, latrines at health centres
MWE GoU MWE has a lead role
MoE GoU
MoH GoU
Donors Donors Through Sector Working Group
NGOs International NGOs, Donor Funds NGOs support coordination meetings at sub-county and District
level
DWO MoFPED District is supposed to organise quarterly coordination meetings,
but often not done due to lack of funds
NGOs International NGOs, Donor Funds Training in participatory approaches, sanitation promotion
approaches, different technologies and sanitation marketing
Multilateral agencies/UNICEF Multilateral agencies/UNICEF
UWASNET Donor Funds, International NGOs Promotion of approaches and technologies
MWE GoU Training of TSU and district staff on CLTS, PHAST
Umbrella JPF, MoFPED, Donor Funds Builds capacity mainly on sub-county and town council level
ATC JPF Capacity building of NGOs, TSUs and DWOs on appropriate
technology options
TSU JPF Support to DWO, with guidance from MWE
MWE GoU through reports from districts and Umbrellas, Annual Sector
Review, reports to donors
DWO MoFPED Districts report quarterly to MoFPED and MoLG, MWE is copied
and certain annexes sent directly to MWE. On public latrines and
latrines in RGCs
TSU JPF Reports to MWE
WSDF GoU, Donor Funds Quarterly reports to MWE
MoH GoU Household sanitation, sanitation in health facilities
Continuous community mobilisation,
hygiene promotion, PHAST, CLTS
(post construction)
Sector coordination
Technical support to institutions
(schools, health centres)
Sanitation Marketing
Training of masons
Macro-level planning and policy
making
Planning at sub-county and District
level (WSSCC)
CapManEx
(Capital Maintenance
Expenditures)
Technical support to communities
Capacity building of local and central
government structures
Monitoring and Evaluation (data
compilation, analysis and collection
from governent entities and NGOs)
Rehabilitation of structures
ExpDS
(Expenditure on Direct
Support)
Monitoring and Evaluation (data from
individual communities)

Umbrella JPF, MoFPED, Donor Funds Quarterly reports to MWE and JPF
UWASNET Donor Funds, International NGOs through reports from members, reports to MWE
UWASNET Donor Funds, International NGOs Document good practices amongst members
MWE GoU For example through ATC
NGOs Donor Funds, International NGOs Some, like Triple-S and NETWAS have a very strong research
component
Private sector Donor Funds, Higher Education Institutions,
NGOs, MWE
Private sector companies (like consultancy firms) can also do
research on belahf of donors, government or Higher Education
Institutions, or at own initiative
Higher Education Institutions GoU, Donor Funds For example Makerere Univresity
ATC JPF Research on different technology options
NGOs International NGOs, Donor Funds
ATC JPF appropriate technology options
MWE GoU New technologies such as Ecosan for schools
MWE GoU For example on CLTS, demonstration latrines
MoH GoU Household sanitation, sanitation in health facilities
TSU JPF with guidance from MWE
NGOs Donor Funds, International NGOs On different technologies, re-use
UWASNET Donor Funds, International NGOs Review of manuals, guidelines
Private consultants Donor Funds, MWE, NGOs Often the actual work is done by consultants
NGOs International NGOs, Donor Funds Pay for review of manuals and guidelines, hire consultants
ATC JPF Manuals for technology options
NGOs International NGOs, Donor Funds Some like Water Aid and NETWAS have resource centres
Higher Education Institutions GoU, Donor Funds
MWE GoU Dissemination
UWASNET Donor Funds, International NGOs Has a resource centre
Financial Services, Audits UWASNET Donor Funds, International NGOs for members
NGOs International NGOs, Donor Funds
MoH GoU
MWE GoU
NGOs Donor Funds, International NGOs
MoH GoU
International NGOs Donor Funds
UWASNET Donor Funds, International NGOs
MoH GoU
Local NGOs/CBO Donor Funds, International NGOs
Interest on loans taken by
government
MoFPED Multi-lateral financial institutions Paid directly by MoFPED
Interest on loan taken by householdsHouseholds Households Loans can be accessed at micro-finance institutions
Assumptions/Comments:
No data on drainage or sewerage projects in rural centres found
Funding source: the immediate source the money is transferred from, not the original source. See map for further details
Environmental management is not specific for the rural sanitation sector and therefore not included
Writing guidelines, manuals etc.
Demonstration units
Knowledge Management
Advocacy/Good governance
Sanitation Marketing (promotion at
national level)
Environmental Aspects
CoC
(Cost of Capital)
Research
Technical support to local
governments