Information dissemination for farming communities in Thailand.
211
Edith Cowan University Research Online eses: Doctorates and Masters eses 2011 Information dissemination for farming communities in ailand. Khumphicha Tantisantisom. Edith Cowan University is esis is posted at Research Online. hps://ro.ecu.edu.au/theses/428 Recommended Citation Tantisantisom., K. (2011). Information dissemination for farming communities in ailand.. Retrieved from hps://ro.ecu.edu.au/ theses/428
Transcript of Information dissemination for farming communities in Thailand.
Edith Cowan UniversityResearch Online
Theses: Doctorates and Masters Theses
2011
Information dissemination for farmingcommunities in Thailand.Khumphicha Tantisantisom.Edith Cowan University
This Thesis is posted at Research Online.https://ro.ecu.edu.au/theses/428
Recommended CitationTantisantisom., K. (2011). Information dissemination for farming communities in Thailand.. Retrieved from https://ro.ecu.edu.au/theses/428

Edith Cowan University
Copyright Warning
You may print or download ONE copy of this document for the purpose
of your own research or study.
The University does not authorize you to copy, communicate or
otherwise make available electronically to any other person any
copyright material contained on this site.
You are reminded of the following:
Copyright owners are entitled to take legal action against persons who infringe their copyright.
A reproduction of material that is protected by copyright may be a
copyright infringement. Where the reproduction of such material is
done without attribution of authorship, with false attribution of
authorship or the authorship is treated in a derogatory manner,
this may be a breach of the author’s moral rights contained in Part
IX of the Copyright Act 1968 (Cth).
Courts have the power to impose a wide range of civil and criminal
sanctions for infringement of copyright, infringement of moral
rights and other offences under the Copyright Act 1968 (Cth).
Higher penalties may apply, and higher damages may be awarded,
for offences and infringements involving the conversion of material
into digital or electronic form.

Information Dissemination for Farming Communities in
Thailand
A dissertation submitted in fulfilment of the requirements for the degree of
Doctor of Information Technology
By: Khumphicha Tantisantisom Student ID: 10003708
Faculty of Computing, Health and Science Edith Cowan University
Supervisors: Dr. Leisa Armstrong and Dr. Judy Clayden
Date of submission: 18 August 2011

2

USE OF THESIS
The Use of Thesis statement is not included in this version of the thesis.

ii
ABSTRACT
The use of information and communication technology tools has been applied in many disciplines, including agricultural sectors. It may be applied in many modules such as data gathering, data processing, information management and information dissemination. One issue that cannot be neglected is the readiness of technology service users, or farmers in this case. It was found that most Thai farmers were poor and illiterate; therefore, offering them the best available tools and services may not be always what they would like to use. To answer the research questions, action research methodology was selected in this study to find a practical way to deliver agricultural information to Thai farmers. Groups of participants from two villages in a northern Thai province were targeted; as a result, case study methodology was also used in this study. Accordingly, a needs analysis using a survey technique, in conjunction with an analysis of the current situation and relevant documents, was conducted in order to find answers about the types of information truly required by Thai farmers. Additionally, questions about how Thai farmers currently received agricultural information, and factors affecting their information requirements, were to be answered. Then, information dissemination through the short message service on mobile phones was found to be the most appropriate alternative for Thai farmers in this study. The free-of-charge experimental service was offered to participating farmers for a period of eight weeks. After that the user satisfaction survey and group interviews were conducted to determine the effectiveness of the system framework. A number of findings and discussion points will be useful for policy makers, relevant government agencies and other researchers who attempt to conduct viable projects in the actual field. This study revealed that income, age and education were significant factors related to the success of the agricultural information dissemination project. Also, relationships between agricultural information extension workers and farmers affected the preferences for, and attitudes to, receiving information among Thai farmers. Subsequently, a new framework was proposed and was obtained comments from agricultural extension workers in order to improve the framework for a wider scale. Finally, the main objective of this research, which was to find out how information and communication technologies can be used to enhance information dissemination to Thai farmers, was achieved. In summary, these outputs are likely to be useful and workable in practice, together with collaborations with third parties such as local councils, mobile phone service providers or academic sectors.

iii
DECLARATION
I certify that this thesis does not, to the best of my knowledge and belief:
i. incorporate without acknowledgment any material previously submitted for a degree or diploma in any institution of higher education;
ii. contain any material previously published or written by another person except where due reference is made in the text; or
iii. contain any defamatory material.
Sign Date 23 January 2012

iv
ACKNOWLEDGEMENT
Unconditional support from my family including my uncle, Mr. Naowarat Khananai, who facilitated all connections to the participants, was a great help to make this work accomplished. This thesis cannot be completed without support from my supervisors, Dr.Leisa Armstrong and Dr.Judy Clayden. Thank you for helping me through all the difficult times. Also, this work could not have been accomplished without the support from the Thai government that foresaw the importance of higher education at the international level including Phrae Provincial Organization which welcomed the researcher to conduct a study to improve resident‟s livelihoods.

v
TABLE OF CONTENTS
USE OF THESIS .................................................................................................................... i
ABSTRACT ........................................................................................................................... ii
DECLARATION ................................................................................................................. iii
ACKNOWLEDGEMENT .................................................................................................... iv
TABLE OF CONTENTS ....................................................................................................... v
LIST OF FIGURES ........................................................................................................... viii
LIST OF TABLES ................................................................................................................. x
CHAPTER 1 INTRODUCTION .......................................................................................... 1
1.1 Background of the Study .............................................................................................. 3 1.1.1 Thai farming .......................................................................................................... 3 1.1.2 Thailand social structure at the village level ........................................................ 4 1.1.3 Use of ICT in Thailand .......................................................................................... 5
1.2 Significance of the Study ............................................................................................. 5 1.3 The Purpose of the Study ............................................................................................. 6
1.4 Research Questions ...................................................................................................... 6 1.5 Definitions of terms...................................................................................................... 7 1.6 List of Abbreviations.................................................................................................... 8
CHAPTER 2 REVIEW OF THE LITERATURE .............................................................. 11
2.1 ICT tools used in agriculture ...................................................................................... 11 2.1.1 Telephones and mobile phones ........................................................................... 11 2.2.2 Networking and/or the Internet ........................................................................... 13 2.2.3 TV/radio .............................................................................................................. 14 2.2.4 VCD/DVD ........................................................................................................... 15
2.2.5 Other technologies used for agricultural developments ..................................... 16 2.2 Types of agricultural information delivered .............................................................. 16 2.3 The sources of agricultural data and information ...................................................... 17
2.4 Use of ICT in agriculture in developing countries ..................................................... 18 2.5 Use of ICT in agriculture in developed countries ...................................................... 19 2.6 Drivers for the use of ICT in agriculture .................................................................... 21 2.7 Barriers to the use of ICT in agriculture .................................................................... 22 2.8 Impacts ....................................................................................................................... 25
2.9 Case Studies ............................................................................................................... 26 2.9.1 e-Sagu .................................................................................................................. 26 2.9.2 e-Choupal ............................................................................................................ 27
2.9.3 Village knowledge centre (VKC) in Pondicherry, India ..................................... 28 2.10 Literature Summary ................................................................................................. 30
vi
CHAPTER 3 METHODOLOGY ....................................................................................... 31
3.1 Action Research ..........................................................................................................31 3.1.1 Advantages of action research .............................................................................33 3.1.2 Disadvantages of action research ........................................................................34
3.2 Case Study Research ...................................................................................................34 3.3 Questionnaire ..............................................................................................................35 3.4 Attitude Measurement .................................................................................................36 3.5 Interviews ....................................................................................................................37 3.6 Documentary Analysis ................................................................................................39 3.7 Research Activities .....................................................................................................39
3.8 Limitations ..................................................................................................................45
CHAPTER 4 PARTICIPANTS .......................................................................................... 47
4.1 Background of the study areas ....................................................................................47 4.2 Research Participants ..................................................................................................50
CHAPTER 5 CURRENT SITUATIONAL ANALYSIS AND FURTHER ANALYSIS ... 51
5.1 Current ICT situation in Thailand ...............................................................................51 5.2 Analysis of similar systems.........................................................................................54
5.3 Results of Questionnaire of Representative Farming Groups .....................................55 5.3.1 Demographic data................................................................................................58 5.3.2 Presently used ICT tools and the preference .......................................................61 5.3.3 Information channels ...........................................................................................64 5.3.4 Types of agricultural information required and the delivery preference ............66 5.3.5 Previous experiences from applying agricultural information received .............69 5.3.6 Newly-grouped variables for statistical balance .................................................70 5.3.7 Cross tabulation analysis .....................................................................................72
5.4 Assessment of Current Situation .................................................................................78
CHAPTER 6 NEW FRAMEWORK ................................................................................... 81
6.1 Introduction .................................................................................................................81 6.2 Development of Framework .......................................................................................81 6.3 Implementation of Framework ....................................................................................84 6.4 Analysis of Implementation ........................................................................................89
6.4.1 Demographic data................................................................................................89 6.4.2 Information and its dissemination in the experiment ...........................................91 6.4.3 Opinions of the information dissemination in the experiment .............................95 6.4.4 Further requested agricultural information ........................................................96 6.4.5 Difficulties from the experiment ...........................................................................98
6.4.6 Crossed analyses among variables ......................................................................99
6.5 Evaluation of the Framework ....................................................................................107
6.6 Summary of the Implementation ...............................................................................109 6.7 Results of Group Interview .......................................................................................111

vii
6.7.1 Similar opinions between Muang and Soongmen district ................................. 112 6.7.2 Different opinions between Muang and Soongmen districts ............................ 114 6.7.3 Recommendations from farmers ....................................................................... 116
CHAPTER 7 NEW PROPOSED FRAMEWORK ............................................................ 117
7.1 A New Framework for a Wider Scale ...................................................................... 117 7.2 Comparisons with Other Frameworks ..................................................................... 119
CHAPTER 8 ASSESSMENT OF THE NEW FRAMEWORK ....................................... 122
CHAPTER 9 DISCUSSION .............................................................................................. 128
9.1 Introduction .............................................................................................................. 128
9.2 General Discussion................................................................................................... 128 9.2.1 Participation between gender groups ............................................................... 128 9.2.2 Participation among age groups ....................................................................... 129 9.2.3 Participation among levels of education .......................................................... 129 9.2.4 Time preference to receive agricultural information ........................................ 130 9.2.5 Satisfaction with the experiment between two districts..................................... 130 9.2.6 Agricultural information requirements between two districts .......................... 131 9.2.7 Participation among income groups ................................................................. 132 9.2.8 Limitations in the experiment ............................................................................ 133
9.3 A comparison of the interviews of farmers and agricultural extension workers ..... 133
CHAPTER 10 CONCLUSION AND FURTHER STUDIES ........................................... 137
10.1 Answers to research questions ............................................................................... 137 10.1.1 Types of necessary agricultural information required by Thai famers .......... 137 10.1.2 Current agricultural information dissemination channels for Thai farmers .. 138 10.1.3 Factors needed to be considered for information delivery to Thai farmers ... 138 10.1.4 Effectiveness of the implementation developed in this study .......................... 139 10.1.5 Framework improvement for a wider scale .................................................... 140 10.1.6 How ICT can be used to enhance agricultural information dissemination to selected groups of Thai farmers ................................................................................. 141
10.2 Further Studies ....................................................................................................... 143 10.2.1 Adaptation to other parts of Thailand or other countries ............................... 143
10.2.2 Possible technology advancements employed ................................................. 144
References .......................................................................................................................... 147
Appendix A: The questionnaire for the needs analysis ...................................................... 158
Appendix B: Consent Form ............................................................................................... 162
Appendix C: Data from the needs survey .......................................................................... 165
Appendix D: The prototype user interface ......................................................................... 182
Appendix E: The user satisfaction questionnaire ............................................................... 190
Appendix F: Data from the user satisfaction survey ......................................................... 192

viii
LIST OF FIGURES
Figure 1. An action research model.............................................................................. 32
Figure 2. Overall research activities............................................................................. 40
Figure 3. Processes in research activity – Stage One.................................................... 41
Figure 4. Processes in research activity – Stage Two................................................... 42
Figure 5. Processes in research activity – Stage Three................................................. 44
Figure 6. Processes in research activity – Stage Four................................................ 45
Figure 7. A map of Thailand......................................................................................... 48
Figure 8. A map of Phrae Province showing eight districts......................................... 49
Figure 9. Percentage of male and female participants between Muang and
Soongmen District. .......................................................................................
58
Figure 10. A graph presenting a percentage of participants in each age group
compared between two villages....................................................................
59
Figure 11. Percentage of participant preference towards the length of information and
frequency of information dissemination........................................................
68
Figure 12. The bar chart shows a comparison between two districts in each positive
outcome.........................................................................................................
69
Figure 13. Relationships between variables in the needs survey.................................... 80
Figure 14. The proposed system framework………...................................................... 84
Figure 15. The percentage of male and female participants in each village................... 90
Figure 16. The percentage of participants in each income group between two
villages...........................................................................................................
91
Figure 17. Percentage of participants receiving each type of information between two
villages...........................................................................................................
92
Figure 18. The percentage of participants choosing a frequency they preferred to
receive agricultural information for the experiment in each village.............
93
Figure 19. The percentage of participants requesting a new information frequency in
each village....................................................................................................
93
Figure 20. The comparison of information frequency between before and after the
experimental service among participants in the Muang District...................
94

ix
Figure 21. The comparison of information frequency between before and after the
experimental service among participants in the Soongmen District.............
94
Figure 22. A comparison of the requirement various information topics between the
two villages....................................................................................................
97
Figure 23. A percentage of participants who required and did not require pest
management information in each income group...........................................
102
Figure 24. Comparison between participants who found unfamiliar ICT tools to be a
problem and those who did not.....................................................................
103
Figure 25. The percentage of participant preference to receive further information
categorised by information type they previously obtained............................
104
Figure 26. Relationship diagram between variables in the user satisfaction
survey............................................................................................................
110
Figure 27. Presumed relationship diagram between variables in the user satisfaction
survey............................................................................................................
111
Figure 28. A framework of information dissemination via mobile phone, proposed for
wider scale operation. .............................................................................
118
Figure 29. A further framework information dissemination via mobile phone.............. 145
x
LIST OF TABLES
Table 1 List of Abbreviations......................................................................................... 8
Table 2 Research Techniques Employed in Each Stage of Research Activities............ 40
Table 3 The Percentage of ICT Tools Used Between Two Districts............................. 62
Table 4 Preferred ICT Tools Between Two Groups of the Participant......................... 63
Table 5 The Use of Agricultural Information Providers Between Two Groups of the
Participants......................................................................................................
64
Table 6 The Credibility Toward Information Providers Between Two Groups of the
Participants......................................................................................................
65
Table 7 Agricultural Information Requirements Between Two Groups of the
Participants......................................................................................................
66
Table 8 Negative Outcomes After Applying the Received Information Between Two
Groups of the Participants...............................................................................
70
Table 9 Newly-Grouped Age Categories for Balancing the Statistical Weight............ 71
Table 10 Newly-Grouped Education Categories for Balancing the Statistical Weight.. 72
Table 11 Newly-Grouped Income Categories for Balancing the Statistical Weight....... 72
Table 12 Detail of the Types of News Table.................................................................... 87
Table 13 Detail of the Message Table............................................................................. 87
Table 14 Detail of the Mobile Phone User Table............................................................ 88
Table 15 Detail of the Message Sending Table............................................................... 88
Table 16 Opinions Toward the Experimental SMS Service Between Two Villages........ 95
Table 17 Opinions Toward the Experimental SMS Service Between Male and Female
Participants......................................................................................................
99
Table 18 The Average Score and Standard Deviation in Each Aspect of the Service..... 107
Table 19 The Total Percentage of Participants Against the Service Shortcomings........ 108
Table 20 Similarities and Differences Between Agricultural Extension Workers’
Opinions...........................................................................................................
123
Table 21 Agreements on Benefits and Concerns Between Agricultural Extension
Workers.............................................................................................................
123

1
CHAPTER 1 INTRODUCTION
The global population increased from 3 billion to 6 billion within the 40 years between
1959 and 1999 (U.S. Census Bureau, 2009). Furthermore, it is forecasted that this number
will reach 9 billion by 2043 (U.S. Census Bureau, 2009). This has resulted in a need to
increase the production of food for human consumption. However, statistical data source
has revealed that the percentage of farmers has gradually decreased from 50.4% of total
world labour force in 1980 to 39.9% in 2010 (Economic and Social Development
Department, Food and Agriculture Organization of the United Nations [FAO], 2011). In
some countries, the number of agricultural workers has decreased due to unbearable
poverty and the development of industrial sectors. China after the economic reform was an
exemplar for rural-urban migration (Zhu & Luo, 2010). Although the number of
agricultural workers is not as large as it used to be, advances in agriculture technology and
farm machinery have compensated to some degree for the reduction in agriculture labours.
Enormous investments and efforts have been put into research, studies and projects in order
not only to improve agricultural processes but also to enhance the livelihood of poor
farmers in disadvantaged areas. Improvements in production methods in both developed
and developing countries have been brought about through targeted programs (International
Institute for Communication and Development [IICD], 2006). Basic infrastructure,
language and literacy are outstanding examples of problems in needy areas of many
developing countries. On the other hand, in developed countries these issues receive little
attention.
Improvements in agricultural systems in both developed and developing countries have
come about through tackling specific problems. For example, insufficient infrastructure and
poor literacy levels are barriers to improve agriculture in some developing countries such as
Ethiopia, India and Nigeria (Irivwieri, 2007; Kari, 2007; Opara, 2008; Sood, 2001);
whereas the focus on marketing, plant varieties, choices and precision agriculture has
greater relevance in developed countries.

2
Information and communication technologies (ICT) have proved to be a prominent key to
improve both agricultural practices and farmers‟ livelihood. Information may function as a
tool for acquiring knowledge, for making decisions and for communicating (Kalusopa,
2005). ICT embraces relevant technologies used for processing data and then
communicating among participants.
Even though agricultural research has progressively improved production systems, useful
findings from research have not always been delivered to the farmers who could benefit
from these findings. Useful information and suggestions have been circulated among
researchers and academics rather than disseminated to people who should be the target of
these research results. Without new knowledge, farmers have been left with traditional
agricultural approaches and oral recommendations from other farmers (Kalusopa, 2005). A
combination of traditional practices, personal experience and trial-and-error approaches
was the only one option left without access to information sources (Mittal & Tripathi,
2009). This means there will only be slow improvement in agricultural practices among
increasingly needy farmers. Poor information dissemination may also result from
insufficient agricultural extension workers, low levels of literacy, different languages and
farm locations far from agricultural research centres.
These barriers may be alleviated by employing ICT tools to provide an information bridge
between agricultural experts and farmers. For example, communication via mobile phones
can reach farmers in distant areas where land line phones are limited. Video conference or
voice over IP (VoIP), for instance, could also be used to transfer information between an
expert and groups of farmers in several areas. Such an approach could reduce the need for
travelling to remote areas, the costs of travelling and the time spent with those farmers.
Agricultural extension workers may thereby assist more farmers in the same period of time.
This thesis will report on research which examined the dissemination of information for
two groups of Thai farmers. A background to the study, a discussion of its significance and
a review of literature will set the scene for the research questions and the justification of the
3
research methods employed. Subsequent chapters will describe the research processes
undertaken and analyse the findings, before recommending further development.
1.1 Background of the Study
1.1.1 Thai farming Countries such as Thailand and India, which rely heavily on agriculture based commodities,
are usually described as developing. According to the United States Department of
Agriculture - USDA (2009), Thailand has been the largest rice exporter in the world since
2004, with the highest amount of rice exported being 10011 million tons in 2007. In 2006,
Thai rice exports made up about 25 percent of the world rice trade; since then the share has
increased to 35 percent in 2008 (Department of Agriculture, 2009). Moreover, in 2006 the
total value of Thai exports was about 4937372 million baht, of which 1071543 million baht
were received for agricultural products. In other words, about one fifth of Thai export value
was derived from the agricultural sector.
The population in Thailand was about 66.5 million in 2008 and increased to 66.9 million in
2009 (Office of the National Economic and Social Development Board [ONESDB],
2010a). Of this number, in 2008 approximately 24.572 million people were in the
agricultural sector and this became 24.863 million farmers in 2009 (Agricultural
Information Center, Office of Agricultural Economics [OAE], 2010). This number of
people accounts for approximately 39 percent of the Thai population; in other words, nearly
one third of the Thai population are farmers.
In general, Thai farm revenue is relatively low compared to national income per capita. On
average, each Thai person earned 101,216 baht in 2008 and the annual income reduced to
97,351 baht in 2009 (ONESDB, 2010a). In contrast, Thai farmers‟ income in 2009 was
223,296 baht per household and after considering other expenditure only the amount of
42,710 baht remained per household (Agricultural Information Center, OAE, 2011) More
seriously, a debt, on average 54,409 baht per household, still needed to be paid off
(Agricultural Information Center, OAE, 2011). Thai farmers still encounter the problem of
income shortage although their production has been at top of the world export ranking. In

4
general one quarter of the Thai people, those who are farmers, can be considered to be
impoverished.
The amount of land used for rice production in Thailand was about 28.75 million acres in
2009 while the total rice production was about 32.11 million tons (Agricultural Information
Center, OAE, 2011). An acre of land in Thailand could produce only approximately 1.097
tons of rice. In the United States of America (USA) one acre of rice can produce
approximately 7,082 pounds or 3.2 tons (International Rice Research Institute [IRRI],
2009). It can be seen that a developed country like the USA can produce almost three times
more rice than Thailand within the same area of land.
Furthermore, the total number of government officials in the Department of Agricultural
Extension working in regional area throughout the country was 11465 in 2009 whereas the
number of farmers all over Thailand was 24.863 million (Agricultural Information Center,
OAE, 2010). As a result, one agricultural extension worker takes care of approximately
2168 farmers. Therefore, face-to-face knowledge transfer only will not be adequate for all
farmers. The implementation of available and familiar ICT tools may be an alternative to
improve Thai farmers‟ knowledge which will lead to higher yields and better quality of
produces.
1.1.2 Thailand social structure at the village level
Since an announcement by the Ministry of Interior, Thailand in 1996, populous
communities should have at least either 1200 people or 240 households in order to establish
a village (Division of General Administration, 2009). In less densely populated areas,
communities should include either 600 people or 120 households to form a village. The
village, called Moo Baan in the Thai language, consists of a village chairman, village
chairman assistants, village committee and village members (Division of General
Administration, 2009). The village chairman assistants can be either administration
assistants or security assistants. In addition, the village committee consists of the village

5
chairman, the administration assistants and another five to nine village members. Each
position will typically be held for a period of five years. After that, an election will be held.
1.1.3 Use of ICT in Thailand
In 2008, only 3.9% of Thai farmers used a computer in their households and only 2.1% also
surfed the Internet (National Statistics Office [NSO], 2009a). By 2009, the number of
computer users and Internet surfers among Thai farmers had decreased to be 3.4% and
1.9%, respectively (NSO, 2010a). These numbers contrasted to industrial sectors which
increased from 10.6% to 14.3% in the use of computers and from 4.8% to 7.8% in the use
of the Internet. In comparison, in 2008 about 18.4% of the overall Thai workforce had a
computer and 13.2% of them surfed the Internet (NSO, 2009a). By 2009, this number had
changed to be 18.7% and 14.1%, respectively (NSO, 2010a). The growth of computer users
and Internet surfers in Thailand in general is still taking place at a relatively slow rate.
In contrast to the number of computers, the number of households owning a television has
increased from 94.0% in 2006 to be 96.1% in 2008. It may be assumed that almost all Thai
households possess a television (NSO, 2010b).
In addition, the number of mobile phone users in Thailand has rapidly increased from
52.8% in 2008 to be 56.8% in 2009 (NSO, 2010b). In other words, more than a half of the
Thai population has a mobile phone whereas the number of landline telephone users has
gradually decreased from 23.5% in 2008 to be 22.4% in 2009 (NSO, 2010b).
1.2 Significance of the Study
While information supporting agricultural production and processes is available, the major
proportion is published in English and not in the local languages of developing countries.
Most developing countries do not use English as the formal or the first language. This
problem hinders the learning process among needy farmers in rural areas. This issue is

6
exaggerated by illiteracy, poor infrastructure plus scarce information and communication
technologies and tools. A number of poor farmers still use traditional methods inherited
from their descendants. These methods are sub-optimal as far as production efficiency is
concerned and can result in low crop yields. This results in farmers‟ profits being reduced
and increased difficulty in covering farm production costs. This may in turn lead to other
problems such as debt traps and land abandonment. Learning new techniques and more
profitable agricultural production methods through using ICT tools may encourage farmers
to adapt their practices and to improve their agricultural processes. Disseminating
agricultural information effectively to farmers in formats that they find easy to use will be a
suitable approach for this study. In order to do so, research activities including data
collection, data analysis, framework development and actual field implementation are
necessary. This study may inspire and encourage Thai farmers to acquire valuable
information and eventually adapt their rural lifestyle. As a result, farmers‟ livelihoods may
be enhanced and agriculture will become more sustainable.
1.3 The Purpose of the Study
This study aims to define a framework for the improvement of the dissemination of
agricultural information among farmer groups in Thailand. Information and communication
technologies will be utilised to deliver information in easily understandable formats to rural
groups. Thai farmers and their families may thereby become aware of the usefulness of
information and communication technologies for enhancing their access to the information
that will assist them to improve productivity and enhance the sustainability of their
farming.
1.4 Research Questions
The central research question of this study may be specified as the following:
How may modern information and communication technologies be used to enhance the
delivery of timely agricultural information to selected groups of Thai farmers?
7
Additionally, the main question leads to five sub-questions:
1. What kinds of information are most necessary for these Thai farmers?
2. How is agricultural information delivered at present to these Thai farmers?
3. What factors need to be considered if information delivery to these Thai farmers is
to be improved?
4. How effective were the implementations of information and communication
technologies in the agricultural areas studied?
5. How may the outcomes of this study be implemented on a wider scale?
1.5 Definitions of terms
Action Research
“Action research entails studying your own situation to change the quality of processes and results within it.” (Schmuck, 2006)
Agricultural Information System (AIS)
“An AIS is therefore defined as a system in which information is generated, transformed, transferred, consolidated, received, and fed back in such a way that these processes function synergically to underpin knowledge utilization by agricultural producers” (Ro ling 1990 cited in Castillo, 2000).
Agricultural Extension Worker (AEW)
“AEW serves as an administrative leader and coordinator for formulating, developing, implementing and evaluating agricultural extension programmes as well as develop farmers in managing resources in the rural areas. He guides the extension education activities for farmers as groups or individuals towards the purposeful pursuance of given objectives within a particular situation by means of extension communication methods” (Khalil, Ismail, Suandi, & Silong, 2008).
Delivery
“the carrying and turning over of letters, goods, etc., to a designated recipient or recipients.” (Dictionary.com, LLC, 2009).
8
Developed country
Developed countries present an average income of $11906 or more in Gross National Product (GNI) per capita except Hong Kong (China), Israel, Kuwait, Singapore and the United Arab Emirates. Usually they are highly industrialised and most people in these countries have a high standard of living (World Bank Group, 2004; World Bank Group, 2009).
Developing country
Developing countries present an average income of lower than $11906 in GNI per capita including Hong Kong (China), Israel, Kuwait, Singapore and the United Arab Emirates. Developing countries contain 80 percent of the world‟s population (World Bank Group, 2004; World Bank Group, 2009).
Disseminate/Dissemination
“to spread or give out something, especially news, information, ideas, etc., to a lot of
people” (Cambridge University Press, 2009).
Information and Communication Technology (ICT)
Electronic facilities used to create, store, manage and disseminate information (Gerster
& Simmermann, 2003 cited in Curtain, 2003).
1.6 List of Abbreviations
Table 1
List of Abbreviations
Abbreviation Full name
3G the third generation
AEW Agricultural Extension Worker
AIS Agricultural information system
AGMARKNET Agricultural Marketing Information Network
AgrIDS Agricultural Information Dissemination System
ARSONET Africa Regional Standards Organization Network
BAAC Bank for Agriculture and Agricultural Co-operatives

9
Abbreviation Full name
CD-ROM Compact disc read-only memory
CSIRO Commonwealth Scientific & Industrial Research Organization
DAE Department of Agricultural Extension
DEFRA Department for Environment, Food and Rural Affairs
DVD Digital video discs
FKDSF Farmer knowledge decision support framework
ICG Information and Communication Group
ICT Information and communication technology
IDRC International Development Research Center
IFFCO Indian Farmers Fertilizer Cooperative Limited
IKSL IFFCO Kisan Sanchar Limited
IICD International Institute of Communication and Development
IIT-Madras Indian Institute of Technology Madras
IIR Internet Information Research
IRRI International Rice Research Institute
GIS Geographic Information System
GNI Gross National Product
GPS Global positioning system
MSSRF M.S. Swaminathan Research Foundation
MICT Ministry of Information and Communication Technology
NSO National Statistics Office
OAE Office of Agricultural Economics
ONESDB Office of the National Economic and Social Development
Board
OPS & NECTEC
Office of the Permanent Secretary of Ministry of Information
and Communication Technology & Strategy Research and
Industry Indicator Division of National Electronics and
Computer Technology Center
RFID Radio-frequency identification
10
Abbreviation Full name
RINAF Regional Informatics Networks for Africa
RML Reuter Market Light
Rs Indian Rupee
SIM Subscriber identity module
SMS Short message service
SPSS Statistical Package for Social Sciences
TV Television
UN United Nations
UPS Uninterruptible power supply
USDA United States Department of Agriculture
USA the United States of America
VCD Video compact disc
VHF Very high frequency
VKC Village Knowledge Centre
VoIP Voice over Internet protocol
VSAT Very small aperture satellite terminal
WLL or WiLL Wireless-in-Local-Loop

11
CHAPTER 2 REVIEW OF THE LITERATURE
This section will provide a review of literature relevant to the research questions. Firstly,
there will be an examination of research into the use of the ICT tools used in agriculture.
This will be followed by a discussion of the types of agricultural information required by
farmers. Then the agricultural situations of developing and developed countries will be
contrasted. Next, drivers and barriers to the introduction of ICT tools for the purpose of
agricultural development will be analysed. Finally, two outstanding case studies of the use
of ICT in the agricultural sectors of developing countries will be discussed.
2.1 ICT tools used in agriculture
This section will provide a review of research studies related to ICT tools used in
agricultural industries. This section will examine telephony, networking and the Internet,
television (TV) and radio, Video Compact Disc/Digital Video Disc (VCD/DVD) and other
ICT tools.
2.1.1 Telephones and mobile phones
The telephone system is not only a fundamental communication infrastructure but also a
basic facility which supports the use of other technologies. For example, in some African
areas, the telephone was the only ICT tool used by most farmers (Bertolini, 2004 cited in
Munyua, Adera & Jensen, 2008). Its advantages included adaptability and the capability of
transferring both voice and data at gradually decreasing cost (Mangstl, 2008).
Additionally, mobile communication technologies have become gradually more important
in many parts of the world, especially in improving the delivery of information about
agriculture (Munyua, Adera & Jensen, 2008). These communication devices present several
advantages such as portability, wide range of coverage and instantaneous two-way
communications. For instance, mobile phones were used to communicate among Ghanaian

12
fishermen with the purpose of providing each other with information about where to fish,
weather conditions and market prices. Real-time agricultural information and fish prices
were also provided through mobile phones in Senegal (Munyua, Adera & Jensen, 2008).
The advice communicated about best place to sell their catch was also utilized by Kerala
fishermen in India (Abraham, 2007 cited in Mittal & Tripathi, 2009; Jensen, 2007 cited in
Mittal & Tripathi, 2009).
Furthermore, the availability of state-of-art technologies, which are now integrated into
mobile phones, has further improved communication. Built-in global positioning systems
(GPS), high-resolution digital cameras and short-length video recorders are exemplary
embedded technologies. These advances facilitate the use of mobile phones for sending and
receiving voice, text, image and video information (Munyua, Adera & Jensen, 2008). In
addition, most respondents in Hassan et al.‟s (2008) study claimed that telephone and
mobile phones have become ubiquitous. Other studies have found that mobile telephony is
regarded as the most successful ICT tool used in attempts to develop the global agricultural
sector (Mangstl, 2008).
Mobile telephones have been used by farmers for a variety of purposes. For example,
Jensen and Thysen (2003) reported that short message service (SMS) was used to acquire
required information, such as weather information and suitable time to spray pesticides.
Besides information delivery, the mobile phones can be applied to specific other purposes
such as transferring money from one bank account to another for labour payments and input
purchases in Kenya (Hafkin & Odame, 2002 cited in Munyua, Adera & Jensen, 2008).
Moreover, market information in voice mail formats is delivered to Kenyan farmers
(Munyua, Adera & Jensen, 2008).
Other research studies have reported that farmers and agricultural experts are sending
information as images via mobile phones with a built-in digital camera (Parikh, 2009). This
approach saved time and money in addition to providing more support by a limited number
of agricultural experts to a greater number of farmers over a larger area.
13
2.2.2 Networking and/or the Internet
For geographically remote locations, connectivity through computer networks may be an
appropriate way to provide information to farmers. For example, each village centre could
communicate with the outside world, nearby villages, other countries or other continents,
via several types of communication tools, such as dial-up telephone connections, wireless
networks or a satellite communication system called very small aperture terminal (VSAT).
The Internet‟s popularity, its efficiency in communication and the reducing price of
hardware have resulted in the implementation of Internet connectivity in several projects
such as the iKisan.com project (Tiwari, 2008), the TARAhaat project (Tiwari, 2008) and
the e-Choupal project (Rao, 2007) in India. These projects have applied a variety of
connectivity based technologies to the needs of each project. Telephone dial-up connections
may be a simple answer for limited budget projects with low amounts of data transferred
within telephone line-covered areas. Examples are the i-Village and the Gydanroot projects
(Tiwari, 2008).
Other studies have reported how the Internet has assisted farmers. The i-Community by
Hewlett-Packard project chose VSAT to solve the „last mile‟ connection problem (Tiwari,
2008). This solution accords with the e-Choupal and the i-Village project (Tiwari, 2008).
Additionally, the VSAT was also an alternative mode of connection used by the Zee
Interactive Learning System for its communication satellites (Sood, 2001). Wireless
networks are another alternative for limited and unstable telephone lines in rural areas. For
instance, a wireless system has been used occasionally to transfer off-line contents in a
project in Pondicherry (Sood, 2001). Furthermore, Wireless-in-Local-Loop (WLL), which
is able to transfer both data and voice simultaneously across long distances, was an option
implemented by the Indian Institute of Technology Madras (IIT-Madras) (Sood, 2001).
These channels have been applied to disseminate agricultural information in local
languages which were more attractive to Internet users (Sheriff, 2009). Furthermore,
alternatives of preferred languages have been made available for users (Rao, 2004). Web

14
portals, agricultural databases and Internet kiosks presented in local languages have been
developed and then introduced to needy farmers in order to encourage them to develop
more knowledge (Rao, 2004; Tiwari, 2008).
Both private and public networks have been established for use by the agricultural industry.
For example, private networks have been set up in African countries. The Regional
Informatics Network for Africa (RINAF), for instance, has been shared among Kenya,
Malawi, Tanzania, Uganda, Zimbabwe and Zambia (Kiplang, 1999). The Africa Regional
Standards Organization Network (ARSONET) project which connects Ethiopia, Egypt,
Kenya and Senegal is another good example (Kiplang, 1999). Additionally, private
networks for communicating between business and farmers or among villages are another
option.
2.2.3 TV/radio The lack of accessibility to other communication technologies and funding has led to a
combination of broadcasting and narrowcasting media which has been used to deliver
agricultural information in a number of research projects. These media also work well for
people who are not highly literate because they are attractive, easy to understand, especially
with visual and animated materials; in addition to needing only modest reading fluency
skills. Studies reported that television was the most popular tool in terms of ICT usage
(Hassan et al., 2008).
Community radio for broadcasting information has also been widely used in several
programs, both on its own and along with other methods (Kweku, 2006 cited in Munyua,
Adera & Jensen, 2008; Parikh, 2009). With the popularity of radio broadcast, it is also
reported that the radio is not only one of the top four widely used ICT tools but its
importance also has increased in improving rural agriculture. (Hassan et al., 2008; Munyua,
Adera & Jensen, 2008).

15
Radio has been used to broadcast much useful agricultural content. For example,
discussions related to agricultural problems and solutions have been broadcasted in Zambia.
This was found to be useful for the target audiences: the disadvantaged farmers (Bobblili,
2006 cited in Munyua, Adera & Jensen, 2008).
Radio has been used to broadcast in multiple languages in many areas; for example, in
Nigeria English and several local languages, such as Hausa, Igbo and Yoruba, were used in
broadcasting 14 radio programs along with three television programs (Ekoja, 2004). Using
radio to report produce prices in local languages is another example of successful radio use
in Bolivia (IICD, 2006).
2.2.4 VCD/DVD Agricultural knowledge also can be transferred through learning modules in offline
Compact Disc Read-Only Memory (CD-ROM) format which was not only used in Sujhi et
al.‟s project (2009) but also has proved viable in several other studies (Pye et al., 2003 cited
in Munyua, Adera & Jensen, 2008; Parikh, 2009; Sheriff, 2009). This format of knowledge
transfer has been recommended for use by illiterate farmers without the need for assistance
from others (Sujhi et al., 2009). This stimulates self-learning activities and also reduces
dependency on technical staff for learning new agricultural knowledge and technologies.
Moreover, not only text information can be included in CD-ROM but also other types of
data like pictures, audio and video clips (Sujhi et al., 2009). This advantage helps to
overcome the illiteracy problems hindering further learning by poor farmers in rural areas.
In addition, it is a solution to the problem of agricultural knowledge dissemination in areas
where there is no Internet connectivity or the connection is unreliable (Rao, 2007).
Furthermore, mobile cinema in local language or narrated by local extension workers were
also used to provide information to farmers in rural areas (Irivwieri, 2007).

16
2.2.5 Other technologies used for agricultural developments
Besides the technologies mentioned above, other types of ICT tools also have been applied
in agricultural studies. These technologies also have been used in order to improve
information provision for agricultural sectors. For example, radio-frequency identification
(RFID) was employed to capture data about livestock and to transmit the data to a
corresponding database for keeping records for farmers themselves, veterinarians and
health authorities (Munyua, Adera & Jensen, 2008). A geographical information system,
another example, was applied to gather relevant information about 70 villages nearby in the
Warana Wired village project (Tiwari, 2008).
Furthermore, multi-media software containing livestock-related knowledge encouraging
farmers to improve their livestock understanding was implemented on a touch screen
platform and employed in an Indian rural area (Lin & Heffernan, 2010).
Expert systems and artificial intelligence have also been used to assist agricultural
production and farmers. For example, a maize expert system was created by using a number
of relevant data such as variety selection, land preparation, irrigation and fertilization to
provide suitable suggestions to users (Sivakami & Karthikeyan, 2009).
2.2 Types of agricultural information delivered
In order to maximize the agricultural productivity of their land, farmers need to be aware of
the best practices and advancements in agronomy and plant breeding. This information
provides the farmers with information on general practices such as seeding, use of
fertilizers, pest management, harvesting and marketing.
Studies have reported on the types of agricultural information that has been delivered to
farmers. The relevant information during the before-planting period may be crop
management or scheduling of crop activities (Krishna Reddy, & Ankaiah, 2005; Tiwari,

17
2008), improved seedlings (Irivwieri, 2007), input price and availability (Rao, 2004;
Tiwari, 2008) and soil fertility (Ekoja, 2004).
During the growing season, other types of useful information may play crucial roles in
improving the amount and the quality of products. This may include weather information
(Rao, 2004; Tiwari, 2008), fertilizer supply (Ekoja, 2004), fertilizer use in terms of amount
and timing (Krishna Reddy, & Ankaiah, 2005), pest surveillance and management (Ekoja,
2004; Ratnam, Krishna Reddy & Reddy, 2005; Rao, 2004; Tiwari, 2008), type and dosage
of pesticides (Krishna Reddy, & Ankaiah, 2005), weed control (Ekoja, 2004), and disease
management (Ratnam, Krishna Reddy & Reddy, 2005; Tiwari, 2008).
Following the harvest, information about market opportunities (IICD, 2006), financial
planning and market prices may be required (IICD, 2006; Irivwieri, 2007; Tiwari, 2008).
Continuous support for relevant information from various sources, such as authorities or
related government department web sites, may improve agricultural effectiveness and the
efficiency of use of ICT tools.
2.3 The sources of agricultural data and information
Information may be provided to farmers from a variety of sources and information
providers. For instance, weather conditions and forecasts can be retrieved from local
meteorological organizations (Jensen & Thysen, 2003) or the national meteorological
department (Narula & Arora, 2010).
Other information may be obtained from information providers such as the agricultural
expert advice services of national or regional agricultural research institutes (Jensen &
Thysen, 2003), the information departments of state or federal ministries or departments of
Agriculture (IICD, 2006), research organizations such as the Commonwealth Scientific and
Industrial Research Organization (CSIRO) in Australia, the United Nations (UN) agencies,
universities and agriculture consultants. Agricultural Marketing Information Network

18
(AGMARKNET), for example, a web portal, offers daily reports of the price of of 300
products consisting of 2000 varieties (Malhan & Rao, 2007a). Furthermore, the same portal
has also been used by a private company, the Indian Farmers Fertilizer Cooperative Limited
(IFFCO), to deliver required information straight to the company‟s kiosks in rural areas
(Malhan & Rao, 2007a).
However, collecting information about price and farming availability, conducted through
portable computers at the farm level or at actual local markets, then distributed nation wide
via the Internet or web portals, is another source of farming information (IICD, 2006). In a
Jamaican project, this agricultural information was further customised to suit each target
group (IICD, 2006).
Agriculture-related information has been produced and published by a number of
government agencies and academic sectors as well as relevant private companies. The
agricultural information has been available in either primary or secondary form according
to the purpose of use. Product market price, for example, may be more accurate if it is
directly gathered from local markets. On the other hand, a proper use of new agricultural
technology, for example, dissemination of real-time data or information through wireless
sensor network, may be more reliable if it is proved and delivered from government bodies
or research centres.
2.4 Use of ICT in agriculture in developing countries
Most developing countries‟ economies are based on an agricultural or food industry. For
example, growing rice for consumption is the main agricultural activity among
impoverished families in Thailand (Office of Agricultural Economics [OAE], 2009).
However, small farm activities cannot cover all expenditure; an OAE‟s (2009) study found
that about 80% of Thai farmers were still in debt. Poor farmers thus need income from
other sources, such as out-of-farm jobs.

19
As ICT has spread throughout the world, ICT tools and techniques have been employed in
agricultural sectors with the hope that they will eventually improve agricultural
productivity, quality and values. Karnka‟s (2006) study, which provided computer sets
connected to the Internet for a specific farmer group, revealed that most participants had
positive attitudes toward the use of ICT for supporting their learning activities. These
respondents also regarded the Internet as not only a useful information source but also as a
more credible information provider (OAE, 2009). Furthermore, the success of innovations
in learning also depends on the communication channels used (Elsey & Sirichoti, 2003).
Karnka‟s (2006) study found that after becoming familiar with using the Internet, the
respondents positively changed their mind toward the complications of using ICT tools.
However, at first, attitudes toward the use of ICT tools and the Internet among farmers
were expressed as novel, extravagant and too modern for them (Karnka, 2006). These
attitudes can be seen as a challenge to overcome in order to encourage needy farmers to
adopt innovations. Moreover, foreign languages, and too generalized information in
conjunction with low-speed and unstable Internet connection were seen as barriers to access
to required information by impoverished farmers in a developing country (Karnka, 2006).
2.5 Use of ICT in agriculture in developed countries
Although a number of studies in developing countries showed that TV was a main source
of agricultural information among poor and illiterate farmers, TV did not show this kind of
significant role in some developed countries such as New Zealand and the USA (Field et.
al, 2007; Locke, 2005). The use of the Internet for agricultural purposes, such as record
keeping, online selling or purchasing and searching for information, was about 31.8% of
the farmers in Locke‟s (2005) study. This finding was in accordance with Pickernell et. al‟s
(2004) study that 71% of respondents used information technology for business purposes.
In details, 33% of the respondents had their own web sites and customers were able to
perform their purchases online on 18% of the respondents‟ web sites (Pickernell et. al,
2004). The ICT networks also facilitated the knowledge transfer, in forms of either

20
technical information or advice, between farmers and experts in a training programme held
in the Northwest of England (Lowe, 2011).
In contrast, American farmers were more likely to use traditional media, such as print
media and interpersonal sources, compared to electronic information sources (Diekmann &
Batte, 2009). In detail, it was also found that print media were more preferable to Ohio
farmers than interpersonal sources and broadcast media (Diekmann & Batte, 2009).
Additionally, it was supported in an American study that even a number of agricultural
information available in various forms, other farmers were considered as one of the most
important information sources (Velandia et al, 2011).
Despite reports that the number of computer and Internet users in developed countries was
much greater than those in developing countries (Warren, 2004), some barriers to
technology adoption among farmers in developed countries still occur. Reason behind those
obstacles is the lack of appropriate hardware: for example, a number of farmers in the USA
and the United Kingdom did not have a computer; or had a low-performance computer
(Warren, 2004). In addition, only a half of the English farmers who owned a computer used
their computer for business purposes (Department for Environment, Food and Rural Affairs
[DEFRA], 2002 cited in Warren, 2004). In England, farmers surfed the Internet for both
business and non-business purposes including checking the weather reports, checking input
and productivity prices, searching for farming information, sending emails to friends and
family and general browsing (Warren, 2004).
Moreover, lack of awareness of ICT capabilities is another issue in agricultural
development in developed countries (Warren, 2004). Even in developing countries such as
New Zealand, a difficulty on ICT infrastructure could be found in rural areas which partly
caused a delay in adapting ICT for agricultural purposes (Shiblaq & Fielden, 2008). It was
also reported that the level of education as well as household income related to the
tendency of adopting new technology (Archer, 2004 cited in Shiblaq & Fielden, 2008;
Warren, 2004).
21
Nevertheless, it is found that family members play a significant role in ICT adoption by
passing relevant information to other members who were not confident about ICT tool
usage (Warren, 2004). Additionally, family members tended to realise ICT potentials and
had positive attitudes toward using ICT tools for their business, especially if a child or a
spouse had skills in using a computer and the Internet (Warren, 2004).
Furthermore, it was found that the importance of information sources in farmers‟ point of
view may be affected by their age, land tenure and income (Velandia et al, 2011).
Additionally, extension officers were more influential to decision making than other
farmers in high income or old farmers‟ point of view (Velandia et al, 2011).
In terms of information types needed, crop farmers in Ohio State required information
related to soil tillage, water management and soil fertility management including pesticide
application and safety (Diekmann & Batte, 2009).
Computer wireless connections and the third generation (3G) mobile telephone networks
were expected to be crucial means in improving agricultural sectors in developed countries
by combining a mobile phone with a handheld computer to transfer a variety of information
types at a higher rate (Warren, 2004). Additionally, e-Commerce was anticipated to be a
key distribution channel for agricultural businesses (Pickernell et. al, 2004).
2.6 Drivers for the use of ICT in agriculture
To encourage a group of people to try something new requires effective drivers and benefits
to convince them. Turkish farmers in Sindir‟s (2005) study were a good example of a group
resisting the adoption of new technologies until the consequent advantages were realised.
Relative advantages from the changing behaviours were considered as the most important
factor among trained farmers in Elsey and Sirichoti‟s (2003) study. These advantages may
be better yields and incomes from adopting new technologies or practices including
cultivating other types of in-demand crops or even other types of farming (Kalusopa, 2005;

22
Sheriff, 2009). For example, some community members in Sheriff‟s (2009) project, who
gained new knowledge about rabbit farming and dairy farming by watching provided CD-
ROMs, earned higher revenues than previously.
Reliability of information sources is also an important issue for adopting new knowledge.
Poor credibility or unfamiliar information channels are likely to cause illiterate farmers to
be reluctant to take any risks or to experiment with new methods and practices. Moreover,
it is confirmed in Elsey and Sirichoti‟s (2003) study that the source of information was
ranked second for adopting new knowledge into practices.
Furthermore, appropriate agricultural information may directly reduce costs of agricultural
inputs, improve quality of the fresh produce and increase chances to get higher selling
prices (Kalusopa, 2005).
ICT also plays a role as an assistant for information flows from senders, who usually are
researchers, academia, government officers in the Department of Agriculture and
agricultural extension workers, to receivers who mainly are farmers and agricultural
workers. In some situations, as shown in an IICD‟s (2006) project, knowledge senders and
receivers can be farmers transferring experiences from one group to other groups.
2.7 Barriers to the use of ICT in agriculture
Studies and projects around the world related to agricultural information dissemination
have encountered different obstacles depending on several issues (Kari, 2007; Margono &
Sugimoto, 2011; Ratnam, Krishna Reddy & Reddy, 2005). These problems include
poverty, illiteracy, insufficient support, lack of timely information, user-friendly interface,
two-way communication, insufficient network infrastructure and a lack of awareness of
ICT benefits and cultures (Kari, 2007; Margono & Sugimoto, 2011; Ratnam, Krishna
Reddy & Reddy, 2005).
23
Most farmers in developing countries are not able to earn adequate incomes to cover all
expenses for living and carrying out agricultural processes. Therefore, all revenue is saved
for necessary expenditure such as food and agricultural supplies. In many studies, even
fundamental communication tools such as radios, televisions and telephones were viewed
as extravagant assets and had to be shared among community members (Irivwieri, 2007;
Opara, 2008). Moreover, in some areas, other more expensive ICT tools like computers and
mobile phones could not be taken into account unless provided by the project supporters
(Sheriff, 2009; Sindir, 2005). This issue exacerbates the lack of useful information
dissemination through ICT tools.
Illiterate unskilled workers are also a vital problem for information delivery via ICT tools
in many developing countries (Curtain, 2003). It is also claimed that poor people in
developing countries did not necessarily have fluency in their own language (Mangstl,
2008). In some areas, all members of the community disclosed that they have not used
computers before (Sheriff, 2009). Additionally, use of many state-of-art devices may
require some level of capability or experience (Sindir, 2005). This may hinder knowledge
transfer processes, particularly scientific concepts. In the worst case, farmers may be forced
to move into other types of agriculture in which they have not been involved previously
(Irivwieri, 2007).
This problem is aggravated when it comes to valuable information resources at the global
level in which English is typically used (Rao, 2004; Mangstl, 2008). Unavailability of
agricultural information in local languages may hinder the improvement of agricultural
information dissemination (Curtain, 2003). Even in some countries where different local
languages have been used, communicating and transferring information is not always easily
done. In Nigeria, different twenty five local languages had been used in different thirty
seven states (Oladele, 2006). This causes inconvenience when it is necessary to produce
materials in many different languages in order to provide the same contents. While there is
a large amount of information freely available on the Internet, financial and hardware
supports only; cannot help people in many countries to understand those contents what are
provided in a foreign language.

24
Fundamental infrastructures and ICT devices may be insufficient or poorly-functioning in
rural areas in many developing countries, for several reasons such as inadequate support
from government and private sectors, unstable or restricted power supply, unavailability of
landline phones, delayed restoration of communication networks after failure and
insufficient network connectivity (Sood, 2001; Tiwari, 2008). In an on-going project,
unreliable connectivity and hardware malfunctions also amplified the levels of displeasure
among users (IICD, 2006). These issues limit the optimal use of ICT tools for
disseminating information to needy people. Additionally, inconsistent national policies
were also claimed to be an obstacle for progress of agricultural development (Kizilaslan,
2007; Sindir, 2005).
Besides infrastructure, information and other supports from government or government
officers, have not fulfilled the requirements of needy farmers. Insufficient information
support and weak links between information users such as farmers, researchers and
extension workers were reported to be major factors for low agriculture yields (Ministry of
Agriculture, Republic of Kenya, 1997 cited in Kiplang‟at & Ocholla, 2005). The
relationships between extension workers and farmers in some areas needed to be
strengthened because some farmers had the perception that the extension workers do not
provide the necessary agricultural information; or use technical and scientific terms which
could not be easily understood (Kalusopa, 2005; Irivwieri, 2007).
Ill-timed recommendations from experts or agricultural support systems are one of the
difficulties reported in several studies. Useful information which arrives belatedly may be
considered as useless. This situation may cause unfavourable yields from agricultural
activities or result in sub-optimal incomes (Krishna Reddy & Ankaiah, 2005). Moreover,
complaints in regard to behind-schedule market prices were raised among project
participants (Rao, 2007).
Farmers unaware of the advantages and benefits from utilising ICT tools presented another
difficulty to be overcome (Rao, 2004). This issue may cause a large amount of investment
and effort to become worthless. There was no point in broadcasting agriculture programmes

25
if no farmers were listening or paying attention (Irivwieri, 2007). Research also highlighted
that many participant farmers neglected expert suggestions during agricultural procedures
(Ratnam, Krishna Reddy & Reddy, 2005). The case of Turkish farmers who were not
satisfied with keeping data records, which are important for ICT processes and
development, may emphasize this concern (Sindir, 2005). If the farmers do not realise the
benefits of ICT utilisations, it will be more difficult to run any agricultural projects
targeting them.
In addition, different cultures and beliefs in different areas may encumber knowledge
transfer and agricultural improvement. For instance, in some areas females are literally not
allowed to join the community or attend the meeting at provided access points (IICD, 2006;
Sheriff, 2009). A report from IICD stressed that majority of participants in agricultural
development projects are male (IICD, 2006).
2.8 Impacts
Attempts to apply technological tools and techniques along with agricultural knowledge
result in a number of benefits. At first, the ICT tools improve the accessibility of valuable
information in a broad range which may lead to improving agricultural productivity and
quality (Rao, 2004). The tools along with appropriate training, also emphasise the
approachability of government resources and services which will eventually lead to
continuing growth of the e-government concept (Rao, 2004). Furthermore, the
technological training not only affects the improvement of agricultural practices among
farmers but also enhances their skills in using ICT tools for other purposes such as long
distance education, life-long learning and online services (Rao, 2004). Eventually, when the
farmers are familiar with the use of ICT technologies, the opportunities for livelihood
development will be gradually increased with minor supports from outside. Further, with
the confidence, it will be easier to adopt recent and advanced ICT tools.

26
2.9 Case Studies
Although a number of agricultural improvement projects have been conducted throughout
the world, three pivotal examples are the e-Sagu, the e-Choupal and the village knowledge
centres in Pondicherry projects in India. This section provides an analysis of the successes
and potential of these examples to be adapted in a wider scale.
2.9.1 e-Sagu
This project was established with the purpose of reducing the digital divide between
farmers and agricultural experts. This was achieved by obtaining field information via
coordinators to experts in order to provide personalized and timely advices to the farmers
(Krishna Reddy, Ramaraju & Reddy, 2007). The e-Sagu system consisted of five
components: farmers, coordinators, agricultural experts, agricultural information systems
and communication systems (Ratnam, Krishna Reddy & Reddy, 2005). Firstly, the farmers
registered into the system by providing requested farm information to the coordinator.
Then, at weekly intervals, the coordinators would visit each corresponding farm to gather
crop situations and feedback about the previous advice, in order to send to the agricultural
information system (AIS) through the communication system using text and digital
photographs. Usually, one coordinator was responsible for several farmers or some
educated farmers might act as coordinators as well. After receiving farm data and crop
situational data, agricultural experts prepared specific advice for each farm. Then, all the
advices were stored in the AIS, ready to be retrieved by the coordinators for their
corresponding farmers.
This project offered several benefits to both farmers and agricultural experts. At the first
point, it conserved of time, money and energy because the agricultural experts were able to
serve a greater number of farmers in less time whilst staying at the agricultural centre
(Ratnam, Krishna Reddy & Reddy, 2005). Next, the agricultural information system, which
kept the records of the advices and other relevant information, supported the agricultural
experts to determine current circumstances and then created better suggestions (Krishna
Reddy, Ramaraju & Reddy, 2007). Finally, feedback from farmers also played a significant

27
role in improving the system performance by supporting the farming history,
recommendation provided and corresponding outcomes.
However, the project found some problems related to actual practices. For instance, the
farmers did not strictly follow the expert advice either neglecting it or doing unnecessary
activities (Ratnam, Krishna Reddy & Reddy, 2005). These situations resulted in below-
optimum productivity and extra costs. The reasons for these problems included lack of
financial support, lack of confidence in the information technology system, illiteracy and
attitudes of the farmers themselves.
2.9.2 e-Choupal
This project was launched by a private company in order to establish a direct connection to
farmers by bypassing local government middle-markets (Das & Dutta, 2004). A set of
kiosk facility containing a personal computer, Internet connection, uninterruptible power
supply (UPS) including solar-powered battery backup and a printer was provided by the
company but then operated and maintained by local villagers (Narula & Arora, 2010;
Singh, 2006). In each kiosk, farmers were able to log on and retrieve provided information
they were interested (Narula & Arora, 2010).
With the corporations between the company and meteorological department, agricultural
universities and input suppliers (Narula & Arora, 2010), the company was also able to offer
input supplies in reasonable prices, provided free agricultural expert advice including
relevant information such as weather forecasts, market price and farming practices through
the company ICT networks along with the technology training to make contact with the
company (Das & Dutta, 2004; Narula & Arora, 2010). After harvesting, farmers had
choices where to sell their produces either at local markets or at collection shops managed
by the company (Narula & Arora, 2010).
The e-Choupal project was reported to create a “win-win” situation because the company
was able to control farming processes including quality of input supplies and produce while

28
the farmers got agricultural supports and suggestions free-of-charge (Upton & Fuller,
2004). Consequently, farmers gained more knowledge regarding agricultural practices and
price mechanism (Singh, 2006).
Moreover, due to the processes bypassing local intermediaries, the company was able to
directly purchase produce from farmers at a lower price, while the farmers got higher
selling prices (Singh, 2006; Upton & Fuller, 2004).
On the other hand, a last-mile connectivity problem caused high initial costs for VSAT
connectivity. Additionally, other hindrances such as unreliable power supply, insufficient
infrastructure and a lack of Internet and computer skills among rural villagers were
encountered in this project (Narula & Arora, 2010; Singh, 2006). Furthermore, the
company had to deal with State legislation related to local middle markets (Upton & Fuller,
2004).
2.9.3 Village knowledge centre (VKC) in Pondicherry, India
This project was established with supports from the International Development Research
Center (IDRC) in Canada and the M.S. Swaminathan Research Foundation (MSSRF) in
India (Balaji, Kumaran & Rajasekarapandy, 2002). One of the project‟s main objectives
was to form up a framework to disseminate and exchange information in rural areas
through ICT tools (Balaji, Kumaran & Rajasekarapandy, 2002). Each centre where
contained facilities such as personal computers, printers, scanners, modems, Very High
Frequency (VHF) radio devices, and telephone lines, was connected to other centres either
wired or wireless connection (Arunachalam, 2002; Rao, 2004). Additionally, these village
knowledge centres were able to connect to the Internet through a main hub (Chaudhary,
2004).
However, these supports needs some conditions to operate the ICT centres in villages;
namely, villages had to provide a proper location which allowed every community

29
members to use without discrimination and villages had to accept the burden on electricity
and telephone connection bills (Subramanian & Arivanandan, 2009).
At the early stage of the project, local voluntary teams gathered information requirements
in their villages (Arunachalam, 2002). Locale-specific information included input price and
availability, pest surveillance, cattle disease, agronomic practices, produce market price,
weather and health care (Arunachalam, 2002; Rao, 2004). Websites containing requested
information were designed and developed to provide the knowledge service to villagers
along with trainings to use these knowledge repositories (Balaji, Kumaran &
Rajasekarapandy, 2002).
According to the VKC project, villagers were empowered by knowledge enhanced from
using ICT tools to obtain new information in conjunction with confidence earned from
operating modern technologies (Balaji, Kumaran & Rajasekarapandy, 2002; Rao, 2004).
The success of this project may be contributed to an attempt to obtain villagers‟
participation to demand and create local contents including the use of native language for
better understanding among farmers and the use of multimedia formats to facilitate illiterate
groups (Arunachalam, 2002; Chaudhary, 2004).
On the other hand, a drawback revealed from an interview was a caste difference in Indian
society which hindered some villagers to join the VKC operating by lower-caste villagers
(Subramanian & Arivanandan, 2009).
These three projects successfully employed ICT tools and computer networks to directly
disseminate agricultural knowledge to farmers even though they were based on different
purposes and approaches. As a result, farmers have gained both agricultural and
technological knowledge to improve their agricultural practices, produce and quality.

30
2.10 Literature Summary
An examination of the literature has located examples of successful projects which have
taken local and national factors into account. Local factors affecting the success of the use
of ICT tools for information dissemination purposes might differ in each rural area.
Farmers‟ literacy levels, income, ICT knowledge or skills, awareness toward ICT
advantages, educational background, social caste, role of gender, community cultures,
particular information requirements, relationships between information users and provides,
and local languages are exemplars of local factors which must be considered. National scale
factors included availability of networks, infrastructure, financial support and roles of
markets and middlepersons.
It can be seen from the literature that localised content, the use of native languages and
participation by villagers supported the success of ICT projects. In contrast, many issues
became barriers in the ICT implementation for disseminating agricultural information.
These hindrances included poverty, illiteracy, insufficient support from government bodies,
untimely or irrelevant information, inadequate infrastructure, unreliable networks, lack of
awareness toward ICT advantages and community cultures.
Each of the successful projects has relied on an analysis of existing conditions. The next
chapter will discuss the methodology needed to carry out this study, specifically an action
research approach.

31
CHAPTER 3 METHODOLOGY
This chapter will explain the research methodologies and research techniques employed in
this study. Then, the four stages of research activities (situational analysis, further analysis,
framework development and framework improvement) will be described and the techniques
appropriate to each stage identified.
This study mainly employed the concept of action research in terms of practical and
continuous development. The participants of this study included two specific villages;
therefore, case study methodology was also applied. Some techniques were employed
throughout multiple stages of this research study, including questionnaires or surveys,
attitude measurement, interviews and documentary analysis.
3.1 Action Research
This project used an action research methodology in order to achieve the purpose of the
study, which was to improve the agricultural learning process in the long term. Action
research is practical; it starts with a thorough investigation of current circumstances,
followed by an intervention planned to improve processes and outcomes, a subsequent
evaluation or reflection, followed ultimately by the decision whether another iteration of
the cycle is necessary (Koshy, 2005; Schmuck, 2006).
Action research is therefore not a one-stop procedure. Additionally, existing practices may
be continuously improved through action research processes (Schmuck, 2006). In order to
improve practices in real circumstances, all bodies including researchers and participants
need to be involved and participate in the research (Schmuck, 2006). As a result, the
practices will be empowered by collaboration between researchers and participants
(Schmuck, 2006). A model of the action research process is included in this chapter as
shown in Figure 1 on page 32.

32
Figure 1. An action research model (adapted from O'Brien, 2001 and Mertler, 2009).
Each action research cycle can be divided into four stages which are the planning stage, the
acting stage, the developing stage and the reflecting stage (Mertler, 2009). The planning
stage includes a process of identifying and limiting the topic, gathering information,
reviewing related literature and developing a research plan (Mertler, 2009). The process to
identify and limit the research topic is the first step to make a decision what area should be
investigated then narrow down to specify the topic (Mertler, 2009). After that, gathering
relevant information is the next step to obtain a better understanding and to clarify the
research problem (Mill, 2007 cited in Mertler, 2009). The literature review is also important
in research planning. Related information from various sources such as professional books,
research journals, complete web sites and district documents are good materials to begin
with (Creswell, 2005 cited in Mertler, 2009; Johnson, 2008 cited in Mertler, 2009). To
CYCLE 1
CYCLE 2
Reflect
Develop Action
Plan
Reflect
Develop Action
Revised Plan

33
obtain information for making decisions about the research focus and plan is the main
objective of the literature review (Mertler, 2009). Furthermore, reviewing a range of
literature helps researchers obtain guidance for narrowing down the research problem in
conjunction with designing the appropriate research plan and deciding on data collection
instruments and techniques (Parson & Brown, 2002 cited in Mertler, 2009).
The action stage involves implementing a plan, collecting and analysing data (Mertler,
2009). At this stage, data variables, data collection techniques or instruments and
procedures to obtain these data are determined, then data analysis approaches will be
applied to derive findings (Mertler, 2009).
All information and data gained from earlier stages will be employed to plan the
implementation or actual practices. At the same time these practices are implemented, they
may be monitored, assessed and revised according to the cyclic nature of action research
(Mertler, 2009). The main objective of the action research is to establish a particular
workable approach to solve an existing problem and to improve a current situation (Mertler,
2009).
Next comes a reflecting stage, which covers sharing research results and reflecting on the
procedure as the last part of the action research cycle (Mertler, 2009). After each action
research cycle, the results and findings from the study should be shared, presented or
communicated with other researchers or relevant communities in either formal or informal
presentations (Mertler, 2009). Furthermore, this stage enables researchers to review the
practices utilised in their studies, evaluate the practices‟ effectiveness and revise the
practices planned for the next cycle of the action research project (Mertler, 2009).
3.1.1 Advantages of action research Action research offers several advantages, especially for specific circumstances (Koshy,
2005). Furthermore, adjustment and continuous evaluation which can be done throughout
the progress may improve the effectiveness and efficiency of the project. Additionally,
action research emphasizes improvement of processes and outcomes rather than the

34
findings of relationships among variables and a research population (Tomal, 2003). Action
research can result in the confirmation of previously formulated theory and also newly
disclosed novel theories (Koshy, 2005).
3.1.2 Disadvantages of action research
Conducting a study using a concept of action research may consume a long period of time
(Waters-Adams, 2006). Activities in the action research, such as closely monitor
participants and repeatedly improving the action, demand continuously involvement. This
issue should be considered before applying action research into the study because it may
cause a delay of research plan. Moreover, the research action was set for a particular
circumstance or environment (Waters-Adams, 2006). Therefore, the results may not be able
to generalize for a wide scale.
3.2 Case Study Research
A case study is an investigation of particular settings to obtain deep understandings of
related entities in a particular process or context (Gillham, 2000; Woodside, 2010). Case
study research can investigate either single or multiple cases (Yin, 2009). Also it can be
appropriately employed in many study environments. For instance, it may be used to
explain causal relationship in real-life circumstances which are too complicated to use only
questionnaires or experiments (Yin, 2009). Moreover, it is useful to provide better
understandings in vaguely-defined situations (Yin, 2009).
The use of combined types of information sources, which have their own strengths and
weaknesses, is an outstanding feature of case study research (Gillham, 2000). However,
sources of information or evidence used in case study research may be divided into six
categories, namely documentation, archival records, interviews, direct observations,
participant observation and physical artefacts (Yin, 2009).

35
3.3 Questionnaire
A questionnaire is not just a list of questions but a set of well-designed questions which
will lead to the attainment of study objectives (Oppenheim, 2001). Every issue, topic and
variable of the study is explored, investigated and measured in terms of questions in various
forms (Oppenheim, 2001). Instruments for data collection can be standardized interviews,
postal questionnaires, self-administered questionnaires or group-administered
questionnaires (Oppenheim, 2001).
The self-administered questionnaires are presented to participants to explain the purpose of
data collection; then participants alone complete the questionnaires which are gathered
afterwards (Oppenheim, 2001). To name a few, high response rates, minimum bias from
interviewing and accurate sampling, are advantages of this method (Oppenheim, 2001).
After considering the current situation in this study, this method was chosen as one of the
data collection strategies in this research project.
Types of questions within the questionnaire can be roughly divided into open questions and
closed questions (Oppenheim, 2001). Open questions allow participants spontaneously to
answer the question according to their thoughts at that time; consequently its advantage is
the freedom of answers (Oppenheim, 2001). It is recommended when anticipated answers
from the respondents can be in a broad range including unpredictable responses (Ian, 2008).
However, loss of answer richness usually occurs after all answers are classified and
analysed later (Oppenheim, 2001). Additionally, responses returned from open questions
may be ambiguous and difficult to analyse (Schmuck, 2006). Additionally, participants
may only partially recognize the past experiences or may struggle to articulate their actual
answers; consequently, it may cause loss of answer richness (Ian, 2008). To answer this
type of question takes more time and more effort from respondents; this may lead to less
contribution to the participation (Oppenheim, 2001).
On the other hand, closed questions provide choices of possible answers to participants,
who are asked to select the most fitting one (Oppenheim, 2001). It is an appropriate option
if all possible responses can be defined in a set of answers (Ian, 2008). Answering the

36
questions is easy, simple and quick, together with requiring no writing (Oppenheim, 2001).
Also, the collected data are easy to process in order to make a group comparison
(Oppenheim, 2001). However, bias may arise from the choices provided and lead to
distorted results, while selecting from prepared alternatives may cause a loss of spontaneity
and expressiveness (Oppenheim, 2001; Schmuck, 2006).
Questionnaires are also appropriate for understanding participants‟ situation, perceptions,
attitudes and feelings (Schmuck, 2006). In addition, a questionnaire is not only convenient
collecting data in a short period of time but also helps participants to remain anonymous
(Schmuck, 2006). However, using a questionnaire with closed questions to collect data
means the researcher has no chance to clarify any answers with respondents (Schmuck,
2006).
3.4 Attitude Measurement
“An attitude is a state of readiness, a tendency to respond in a certain manner when
confronted with certain stimuli” (Oppenheim, 2001, p.174). The attitudes are based on
beliefs and evaluative responses toward entities (Eagly, & Chaiken, 1993; Oppenheim,
2001). When individuals are stimulated by an entity or occurrence, it will be
psychologically evaluated and affect their feelings and then lead to particular behaviours or
emotional responses (Eagly, & Chaiken, 1993; Oppenheim, 2001).
There are many techniques proposed to measure or assess individual or group attitude
toward issues or variables in research studies. However, attitudes are too complex to be
evaluated by using only a clear-cut acceptance-rejection answer (Oppenheim, 2001). The
Likert scale is a well-known and easily understandable means of providing answers for
researchers (Ian, 2008). Using the Likert scale, a list of statements regarding variables in
the study is offered to participants (Oppenheim, 2001). In each statement, participants are
provided five levels of agreement which are often strongly agree, agree, neutral, disagree
and strongly disagree. A score running from 5 to 1 or vice versa is assigned to each level,
respectively (Ian, 2008; Oppenheim, 2001). After data are gathered, the score for each

37
statement of each question will be calculated as a total and an average score, to enable the
researchers to interpret the responses. This way of offering choices gives the participants
alternatives that more accurately reflect their feelings than straight cut answers like yes or
no; consequently, the results from Likert scales are somewhat more reliable (Oppenheim,
2001). However, different scores from entire participants‟ responses may result in the same
total or average scores; therefore, the pattern of responses is also interesting (Oppenheim,
2001). In addition, the language used in the attitude statements should be neutral and
unbiased to avoid any psychological effects (Ian, 2008).
3.5 Interviews
An interview is not just a conversation, but one that aims at acquiring certain kinds of
information, either factual replies or attitudes and responses to feelings (Oppenheim, 2001).
An interview is an effective way to extract information from participants who usually do
not explain their thoughts, feelings and attitudes in writing (Schmuck, 2006). This method
is also suitable for gathering data from participants‟ intention, actions and attitude
(Hanneke, 2000). It broadens the understanding of the memory, circumstances and thoughts
(Mears, 2009). It can be categorized into two types, which are standardized interviews and
exploratory or in-depth interviews (Oppenheim, 2001). The standardized interview is
usually used for the purpose of fact or data collection whereas the exploratory interview
aims at understanding participants‟ thoughts and feelings about a particular issue; or in the
other words, idea collection (Oppenheim, 2001). In either standardized or exploratory
interviews, interviewers should not interfere in the conversation by introducing their own
attitudes and personality (Oppenheim, 2001)
To understand participants‟ attitudes and opinions, this researcher chose to employ
exploratory interviewing. The exploratory interview requires flows of spontaneous
conversations with participants or interviewees through research issues (Oppenheim, 2001).
The exploratory interview also helps in the formulation of research problems, the extended
view of the situations studied and even suggestions of new ideas and hypotheses
(Oppenheim, 2001).

38
Usually, a small typical group of participants is the main target of exploratory interviews
(Oppenheim, 2001). In addition to a group from a typical sample, key informants in study
areas may be included in the exploratory interview (Oppenheim, 2001). However, in some
studies, using two different groups of interviewees can be employed in order to compare
and contrast results between these sub-samples (Oppenheim, 2001). Even though the
number of interviews needed is not exactly specified, it was accepted that the interviewing
process should no longer continue when there were no new ideas or viewpoints proposed
(Oppenheim, 2001).
The interview may be arranged at the interviewer or interviewee‟s home, at an office or a
place where there will be no interruption or distraction for a certain period (Oppenheim,
2001). Additionally, the place setting should be private, pleasant and quiet to make
interviewees relax and feel spontaneous (Oppenheim, 2001). At the beginning of the
interview, awkwardness may normally occur (Mears, 2009). As the interview continues on,
the awkwardness should be reduced. Meanwhile, both interviewer and interviewees should
gain more confidence and comfort (Mears, 2009). A simple way to increase the response
validity is that all respondents should be treated in the same environment or setting
(Hanneke, 2000). In the exploratory interview, although fixed question lists are not
necessary, the interviewer needs to conduct the interview naturally by adding questions
according to the interviewee‟s responses and guiding them to focus on the topics of the
interview (Oppenheim, 2001).
Moreover, a group interview session is also useful for certain circumstances; for instance, it
may encourage some interviewees to express more on their thoughts and feelings when
they get ideas from other interviewees‟ responses (Oppenheim, 2001). It may also reduce
potential awkwardness if two strangers, interviewer and interviewee, have to confront each
other alone. Although the group interview is more economical in terms of expenses and
time, domination of the conversation by some interviewees may occur due to their
personalities or social roles (Oppenheim, 2001). Therefore, the interviewer should ensure
that the conversation includes all interviewees, without breaking into the flow of the
conversation (Oppenheim, 2001).

39
Nevertheless, when interviewing is used in research, some concerns may arise. For
instance, this technique is time consuming; consequently not every participant is selected
for the interview which may affect the proper selection of interviewees from entire sample
(Schmuck, 2006). Another issue is the interviewer‟s personality and social status which
may hinder interviewees from truthfully expressing their thoughts and feelings (Hanneke,
2000; Schmuck, 2006).
3.6 Documentary Analysis
Contents in relevant documents can be analysed to find out themes and meanings
(Schmuck, 2006). This type of evidence may provide useful background and context of the
study, in addition to unexpected insights (Koshy, 2005). Furthermore, collecting relevant
data through documents is not complicated in most cases (Koshy, 2005). Additionally,
documents can be reviewed multiple times without changes of contents (Yin, 2009).
However, it is inevitable that some documents may contain bias; therefore researchers
should always carefully analyse information from documentary sources (Yin, 2009).
Applying at least two data collection approaches is one of several possible ways to increase
the validity of research projects (Schmuck, 2006). Consequently, this project employed
questionnaire, interview and documentary analysis to collect data and analyse the current
situation.
3.7 Research Activities
According to Tomal (2003), action research may be broken down into six stages, which are
the problem statement or initial diagnosis, data collection, analysis and feedback, action
planning, taking action or implementation, and evaluation and follow up. These steps will
be adapted in the following research activities into situational analysis, further analysis,
framework development and framework improvement, as shown in Figure 2 on page 40.

40
Each research stage employed one or more research methods; therefore, for simplicity
Table 2 presents the summary of research techniques used in each stage. It is followed by
more detailed elaboration or each stage of the research process.
Figure 2. Overall research activities.
Table 2
Research Techniques Employed in Each Stage of Research Activities
Questionnaire Interview Attitude Measurement
Documentary Analysis
Statistical Calculation
Stage 1 Stage 2 Stage 3 Stage 4 Note. Statistical calculation includes percentages, mean scores, standard deviations and cross-tabulation analyses using Pearson Chi-square.
Current situational analysis (Stage 1)
Further Analysis (Stage 2)
New framework - Development - Implementation - Analysis
(Stage 3)
Framework improvement (Stage 4)

41
The first stage was the situational analysis to understand and evaluate the current
circumstances. It involved both study from existing documents, including other research
projects, and data collection through questionnaires. The documentary analysis, attitude
measurement and questionnaires were two methods applied in this stage. Stage One
research activities are presented diagrammatically in Figure 3.
Figure 3. Processes in research activity – Stage One.
Literature review
Available ICT tools used in agricultural information
dissemination
Potential variables affecting the use of ICT tools
Link all information to the research questions
Devise the questionnaire
Translate it into the local language
Conduct the survey

42
Then, in Stage Two, the data collected in Stage One were statistically analysed and
examined to assess the relationships amongst variables. This was carried out using
Statistical Package for Social Sciences (SPSS) tools. A variety of fundamental statistical
techniques, such as percentage, mean, standard deviation and cross-tabulated analysis using
Pearson Chi-Square technique, were applied to the gathered data. Additionally, due to
skewness of some variables such as age, income and education; newly grouped categories
were applied in order to equate data distributions. Figure 4 below outlines processes
accomplished in Stage Two.
Figure 4. Processes in research activity – Stage Two.
Regroup some categories in some questions due to the
skewness of data
Categorize data according to types of questions
Close-ended questions Attitude questions using Likert scale
Cross-tabulated analysis using Pearson Chi-Square to find out relationships among
variables
Compare results to other studies
Establish factors affecting the use of ICT tools among
target farmers
Calculate percentage
Calculate mean score and standard deviation

43
Next, all relevant documents, publications, articles, journals and results from Stage Two,
including on-going projects in Thailand, were carefully examined in order to analyse the
effectiveness of the implementations of information and communication technologies in the
two agricultural areas. Figure 5 on page 44 presents all activities in Stage Three.
All information derived from the previous stages was used to design a framework in order
to determine an appropriate and effective approach to disseminate agricultural information
to the target farmer groups.
The framework implementation was examined using user satisfaction questionnaires in
order to gather and analyse the effectiveness and efficiency of the framework. The collected
data were statistically analysed using SPSS tools. Then other related studies were referred
to compare results from the user satisfaction survey.
Group interview sessions were then conducted with participants in each district separately
to encourage them to reveal their attitudes toward the experiment unreservedly. The results
were analysed to contribute towards a feasible framework which would enhance ICT tool
usage among Thai farmers.
All outcomes from all previous steps were examined to form a framework for a wider scale
which aimed to answer the main research question as illustrated in Figure 6 on page 44.
Additionally, other related studies and research frameworks were analysed and compared to
find out an appropriate framework for disseminating agricultural information to rural
farmers in the Thai context. The interviews with agricultural extension workers as an
expected role of project administrators in the implementation in a wider scale were
arranged to obtain the validities of the framework. Limitations in current technologies
available in Thailand, and ICT adoption readiness of farmers, were also determined to
create the framework which may be adapted to a wider scale.

44
Figure 5. Processes in research activity – Stage Three.
Existing frameworks and projects Results from the survey Thailand national ICT
plan and policy
Establish a system framework
Design the database
Implement the prototype
Gather agricultural information from official and academic websites
Obtain volunteers for the experiment
Conduct the experiment
Conduct user satisfaction survey after the experiment accomplished
Analyze data using SPSS
Group interviews
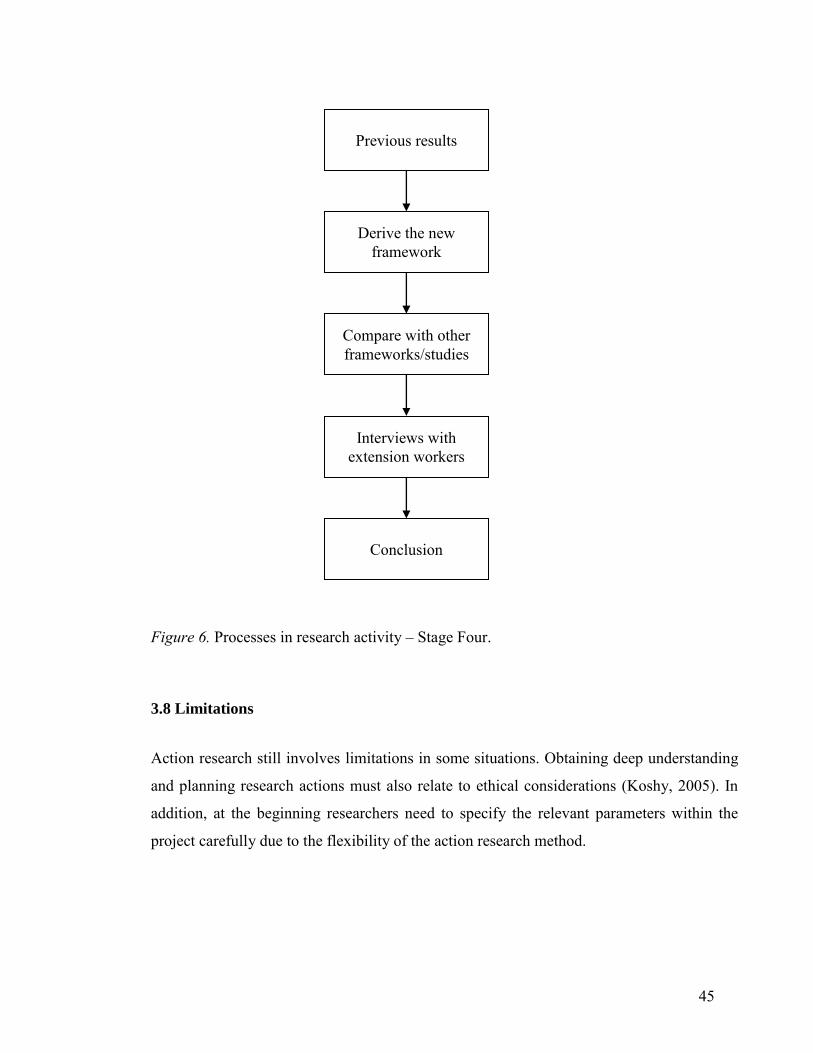
45
Figure 6. Processes in research activity – Stage Four.
3.8 Limitations
Action research still involves limitations in some situations. Obtaining deep understanding
and planning research actions must also relate to ethical considerations (Koshy, 2005). In
addition, at the beginning researchers need to specify the relevant parameters within the
project carefully due to the flexibility of the action research method.
Previous results
Derive the new framework
Compare with other frameworks/studies
Conclusion
Interviews with extension workers
46
This study targeted only specific groups of farmers in rural Thailand. The results of the
study including preferences expressed by the participants may vary from publications about
other agricultural villages in Thailand.

47
CHAPTER 4 PARTICIPANTS
4.1 Background of the study areas
At present, there are 77 provincial areas in Thailand; Phrae is one of 17 northern provinces
(Foreign Office, The Government Public Relations Department, n.d.). Phrae Province is
approximately 551 kilometres north of the capital city of Bangkok as illustrated in Figure 7
on page 48 (Information and Communication Group [ICG], Phrae Provincial Office, 2010).
Phrae Province contains 8 districts divided into 78 sub-districts or 708 villages with a total
population of 462,698 people (ICG, Phrae Provincial Office, 2010). The eight main
districts are Denchai, Long, Muang, Nongmuangkhai, Rongkwang, Song, Soongmen,
Wangchin as presented in Figure 8 on page 49 (ICG, Phrae Provincial Office, 2010). The
total area is 6538.58 square kilometres and the cultivation area accounted for 22.23% of
total provincial land (ICG, Phrae Provincial Office, 2010). The province is surrounded by
mountains in all four directions (ICG, Phrae Provincial Office, 2010). Three seasons in
Phrae Province are winter, from November to February, summer from March to May and
rainy from June to October (ICG, Phrae Provincial Office, 2010). In the last five years, the
average temperature was 26.43 degrees Celsius and average rainfall was 1126.94
millimetres per year (ICG, Phrae Provincial Office, 2010).
Agriculture is one of the main industries in Phrae and a major section of the workforce was
in the agricultural and fishery sector, with 84,449 people or 28.5% of the entire Phrae
Province workforce (ICG, Phrae Provincial Office, 2010). Main crops grown in Phrae
Province include corn, rice, mung beans, tobacco, tangerines and soy beans; moreover, on
average each farming household occupies about 3.5 rai for agricultural purposes (ICG,
Phrae Provincial Office, 2010). One rai is approximately 0.16 hectares. Among these
farmers, 72.46% own their land for agricultural procedures while 18.98% have rented
arable land and the rest have both owned and rented (Office of Northern Science Park,
n.d.). In terms of economics, people in Phrae Province earned about 47,830 baht annually

48
(ICG, Phrae Provincial Office, 2010). In comparison at national level which the annual
income per person in 2009 was 97,351 baht, Phrae residents can be considered
impoverished (ONESDB, 2010a).
Figure 7. A map of Thailand. (adapted from Davies, 2008).

49
Figure 8. A map of Phrae Province showing eight districts. (ICG, Phrae Provincial Office, 2010).
Muang District and Soongmen District were selected for this study. Muang District consists
of 116 villages while Soongmen District has 110 villages. One of villages in each district
was selected; however, to retain confidentiality the chosen villages were referred,
henceforth, as Muang and Soongmen districts, respectively. Although they were one of
many villages in both districts, in this study they were chosen to be representative villages
for these districts.
Soongmen District
Muang District
50
The village in Muang District has 762 residents comprising of 356 males and 406 females
whereas the village in Soongmen District contains 1083 community members consisting of
514 males and 569 females (NSO, 2009b).
4.2 Research Participants
In the preliminary survey, farming dwellers in Muang District and Soongmen District were
asked to complete the questionnaire. Volunteers were composed of 181 participants from
Muang District and 150 participants from Soongmen District.
For the implementation phase, only the participants from the preliminary survey who
owned mobile phones were asked to join the information dissemination. However, due to
reluctance to try something new and different from what they were familiar with, only 57
farmers from Muang District and 59 farmers from Soongmen District agreed to join this
service. When the experimental service was accomplished, all 116 participants were asked
to complete another questionnaire regarding their fundamental demographic data and
attitude toward this service to find out their satisfaction. It can be seen that participants in
the first questionnaire were not exactly the same as the participants in the second
questionnaire. In other words, the participants in the second questionnaire were only a
subset of the participants in the first survey. However, opinions from the participants who
tried out this service were all collected by the second questionnaire.

51
CHAPTER 5 CURRENT SITUATIONAL ANALYSIS AND FURTHER ANALYSIS
To understand the current situation, documents about ICT policies in Thailand, such as The
10th National Economics and Social Development Plan (2007 – 2011), The Summary of the
Direction of the 11th National Development Plan (2012 - 2016) and The Second Thailand
Information and Communication Technology Master Plan (2009 - 2013), were assessed to
determine feasibilities for the project planning. Moreover, annual reports from relevant
government agencies such as the Ministry of Information and Communication
Technologies, the Department of Agricultural Extension, the Ministry of Agriculture and
Cooperatives including statistical data from the National Statistics Office, were gathered to
examine agriculture-related or ICT projects and policies which were accomplished, have
been in progress, or will be included in future plans.
5.1 Current ICT situation in Thailand
At present, Thailand is implementing the 10th National Economics and Social Development
plan (2007 – 2011) which extensively supports Thai agriculture activities in knowledge
exchange and transfer, including research and development concerning agricultural
technology (ONESDB, 2006). However, it does not precisely state how information and
communication technology tools should be applied to these purposes.
The Summary of the Direction of the 11th national development plan (2012-2016) has been
framed to cope with immense global changes (ONESDB, 2010b). Subsequently,
implementations of information and communication tools are mentioned in various
strategies, including agricultural support. The use of information technology for the
purpose of enhancing living standards will be promoted, along with other strategies to
support the grass-root economy and farmers‟ capability to produce higher quality and
quantity of yields (ONESDB, 2010b).

52
In addition to the 11th national development plans, The second Thailand Information and
Communication Technology Master Plan (2009 – 2013) also presents several strategies in
using ICT to support agricultural sectors (Office of the Permanent Secretary of Ministry of
Information and Communication Technology & Strategy Research and Industry Indicator
Division of National Electronics and Computer Technology Center [OPS & NECTEC],
2009). The development of farming information, including the promotion of ICT learning
networks for farmers is one of the strategies related to ICT support for agriculture.
Additionally, studies on farmers‟ information needs, coupled with pilot projects for
precision agriculture, will be promoted and supported. Moreover, ICT infrastructure and
information development in the local language, Thai, will be undertaken by related
agencies in order to accelerate the processes of using ICTs for improving livelihoods.
Furthermore, agencies related to the promotion and support of ICT usage for agricultural
sectors also undertaken the responsibility for achieving these goals. The Ministry of
Information and Communication Technology, the Department of Agricultural Extension
under the supervision of the Ministry of Agriculture and Cooperatives, and the Ministry of
Agriculture and Cooperatives itself are the most directly concerned organisations.
According to the Ministry of Information and Communication Technology [MICT]‟s
annual report for 2008 (2009), a hi-speed internet extension project is being installed to
cover all areas of Thailand. Additionally, the 3G mobile phone network project has been
making some progress (MICT, 2009). A community ICT learning centre project is
considered to be successful in meeting its objectives. Forty community ICT learning
centres were established, along with properly trained ICT personnel to maintain the centre
and to support community users. Furthermore, 4100 community users across the country
were trained to use the facilities provided (MICT, 2009).
The Department of Agricultural Extension [DAE] under the supervision of Ministry of
Agriculture and Cooperatives is also another body directly responsible for information
dissemination coupled with knowledge and technology transfer to farmers. For example,
the DAE managed a project regarding announcements on pest outbreak warnings via

53
community speakers, local radio channels and DAE‟s websites (Department of Agricultural
Extension [DAE], 2010). Agricultural information was available through a call centre
service, DAE‟s website and email coupled with agricultural documentaries in VCD format
and e-books. TV documentaries were also broadcast on two channels for 67 times in total
all year round and on 10 radio channels for more than 7000 times (DAE, 2010).
Additionally, a farmer registration database system was established and promoted to
farmers throughout the country in order to keep their records for further analysis and future
plans (DAE, 2010). However, information technology skills development training courses,
including ICT facilities such as computer servers and computer sets, were arranged for
departmental staff only rather than for farmers themselves (DAE, 2010).
Moreover, the Ministry of Agriculture and Cooperatives also provided overall support to
farmers via departments under its supervision. The Ministry facilitated information and
technology transfer through broadcasting on TV and radio channels, publications, call
centre services and websites (Ministry of Agriculture and Cooperatives, 2009).
It can be seen that ICT implementations for transferring information and technologies to
farmers are in the government interests and are planned to achieve tangible outcomes.
Research development and studies regarding this issue are also being encouraged.
However, according to the summary of Thai ICT indicators published by the National
Statistical Office of Thailand (2007), it indicated that TV and radio can be considered as
providing nearly universal access, reaching 95.3% and 60.3% of the population,
respectively. However, only one TV programme created by the DAE was broadcast, along
with radio broadcasts through 10 channels across the country (DAE, 2010). Although
related government bodies tried to publish valuable agricultural information on the Internet
(DAE, 2010; Ministry of Agriculture and Cooperatives, 2009), the percentage of Thai
residents using computers and the Internet were rather low at 29.3% and 20.1%,
respectively (NSO, 2010a). The percentages of these ICT users were even worse in the
agricultural sector at only 3.4% and 1.9%, respectively (NSO, 2010a).

54
The percentage of mobile phone users in Thailand has rapidly increased from 47.2% in
2007 to 56.8% in 2009 (NSO, 2010a; OPS & NECTEC, 2009). However, it seems that the
third generation (3G) mobile phone concession contract has encountered many problems
which caused delays and timing of the completion of the rollout remains uncertain
(Chantanusornsiri, 2011; Tortermvasana, 2011).
5.2 Analysis of similar systems
Attempts to deliver useful information to farmers or rural communities using mobile phone
technologies in the hope of enhancing rural livelihoods and lessening the digital divide
have succeeded. IFFCO Kisan Sanchar Limited (IKSL) and Reuter Market Light (RML)
projects were two exemplars for employing mobile phone services to disseminate
information directly to farmers.
The Indian Farmers Fertiliser Cooperative (IFFCO) collaborated with a leading
telecommunication company, Bharti Airtel, to establish a project called IFFCO Kisan
Sanchar Limited (IKSL) in June, 2007. (Mittal & Tripathi, 2009; Sulaiman, Kalaivani,
Mittal & Ramasundaram, 2011). After purchasing a Green subscriber identity module
(SIM), farmers received five free voice messages a day at un-predefined times regardless of
location and crop types. These messages related to agricultural information such as
weather, market price, fertiliser availability and crop advice (Mittal & Tripathi, 2009;
Sulaiman et al., 2011). If the farmers did not listen to the voice messages when they were
first delivered, the messages remained available for the farmers to listen to them at a cost of
one rupee per minute (Mittal, Gandhi & Tripathi, 2010). These mobile phone users were
also eligible to call for customised advice to the helpline service at a cost of one rupee per
minute (Mittal & Tripathi, 2009).
Reuter Market Light (RML) is another agricultural information service which has been
available to Indian farmers since October 2007 (Mittal & Tripathi, 2009). Subscribers had
the choice of receiving market price information for two crops through four text messages a

55
day at specific times (Mittal & Tripathi, 2009; Sulaiman et al., 2011). Information related to
the weather was delivered every morning for the entire year, while crop advisory messages
were available from the beginning of sowing to the end of harvesting (Sulaiman et al.,
2011). The subscriptions were available for a period of 3, 6 and 12 months with a cost of
Rs175, Rs350 and Rs650, respectively (Mittal & Tripathi, 2009).
RML‟s strengths were the options for the farmers to choose the crops in which they were
interested, and to receive market information in their local language (Rao, Ramamritham &
Sonar, 2010).
The IKSL voice messages needed farmers to act at the time they received the messages.
This caused the receivers some inconvenience, particularly if they were not available at the
time the messages arrived. On the other hand, text messages can be stored in the mobile
phones until the farmers were available to check and read them.
However, voice messages were more suitable for illiterate residents because they did not
require high literacy levels. It was reported in Mittal and Tripathi‟s (2009) findings that
most voice message subscribers preferred the service because of their illiteracy.
5.3 Results of Questionnaire of Representative Farming Groups
A preliminary survey concerning farmers‟ information needs, their farming data and ICT
usage behaviours was conducted to frame a study implementation. This idea was suggested
by the success of other projects which had ensured the participation of users at an early
stage (Arunachalam, 2002; Chaudhary, 2004).
The questionnaire contained three types of questions, namely closed questions, open-ended
questions and opinion questions using Likert scales. General demographic data including
education, age, gender, marital status, the number of family members and income level
were collected through a questionnaire (see Appendix A).

56
Within the questionnaire‟s detail, as the Internet became commercialized in Thailand by
1995 (Palasri, Huter & Wenzel, 1999), the number of Internet users in Thailand has
gradually increased from 1.5 million in 1999 to 18.3 million in 2009 (Internet Information
Research [IIR], 2009). These figures show that the Internet has recently become popular
nation-wide; therefore, it may be assumed that young users use more Internet than older
generations. Furthermore, the number of computer users and Internet users was highly
different among each age group (NSO, 2010a). Consequently, the age of farming
participants in this study should be collected to determine if there was any relationship with
the use of ICT tools.
Although the percentages of male and female computer users and Internet users in Thailand
were somewhat similar (NSO, 2010a), it was reported in many studies that the farming
sector is male-dominant (Elizabeth & Zira, 2009; Cidro & Radhakrishna, 2006). As a
result, participants‟ gender should be considered, to see whether it is related to the use of
ICT among farmers.
Additionally, the use of computers and the Internet in Thailand showed remarkable
differences among each educational category (NSO, 2010a). It was also revealed that most
farmers were illiterate (Kari, 2007); hence, the relationship between educational
background and the use of ICT tools among target farming groups should be taken into
account.
It was stated in many studies that a number of rural residents had to share even basic
communication tools. They had a chance to use high technology tools, such as computers
and mobile phones only when they were offered free by research projects (Irivwieri, 2007;
Opara, 2008; Sheriff, 2009; Sindir, 2005). It may be assumed that affordability is another
reason affecting the use of ICT tools among rural community members. Therefore, the
relationship between income and the use of ICT tools for obtaining new agricultural
knowledge should be determined to see whether earlier findings are true for this study‟s
participants.

57
Moreover, other characteristics of farmers, such as family size, farm size and marital status,
were included to examine whether these factors affect the use of ICT tools for obtaining
agricultural information. In addition, the types of information required, ICT availability in
the target areas, farmers‟ ability to use ICT tools, expectations and attitudes toward
information delivery using ICT tools and preferred methods for information delivery were
included. Participants‟ awareness of currently available agricultural information in several
channels was examined, as were their recollections of positive and negative outcomes after
applying agricultural advice they had previously obtained.
The ethics-approved questionnaire was translated into the local Thai language by the
researcher and then checked by a lecturer in the Department of Foreign Languages, the
Faculty of Humanities, Rajabhat University of Kamphaengphet, Thailand. The researcher
then made appointments with the target groups in order to distribute the questionnaires. The
objectives and processes of this study were explained to farmers. In this stage of the study,
331 participants voluntarily agreed to complete the questionnaires. The consent letter (see
Appendix B) was explained and provided to each farmer. Participants had responded to a
general invitation to take part in this study. In order to obtain an idea of the real
circumstances of the use of ICT tools for agricultural information among Thai farmers, no
criterion to select participants was applied.
After all distributed questionnaires were collected; all data were encoded in a statistics
analysis application, SPSS. Then, basic statistical approaches such as percentages, means,
standard deviations and cross-tabulations using Pearson Chi-square were performed to
obtain findings.
The data analysis was conducted using data gathered from a sample of farmers from
Thailand who were requested to supply information on their sources of information, their
preferences toward receiving information via ICT tools and devices such as television,
radio, computer, mobile phones and the Internet. Also their perceptions of the impacts of
applying agricultural information, received before the study commenced, were gathered.
The raw data collected in this survey were presented in Appendix E.

58
5.3.1 Demographic data
The data set was from a total of 331 survey respondents which consisted of 181 from the
Muang District and and 150 from the Soongmen District, respectively. This number
accounts for 23.7% and 13.8% of residents in each district, respectively. Both study groups
were comprised of male and female participants in similar proportions. Figure 9 shows the
percentages of male and female participants between both districts and the comparisons.
Figure 9. Percentage of male and female participants between Muang and Soongmen District.
Overall, most participants (73.4%) were 46 year of age or older. In particular, most
participants in Muang District were either in the 46 to 50 years old category, or were 61
years old or above. On the other hand, the majority in Soongmen District were between the
ages of 46 to 55 years old. Figure 10 shows percentage of each age group for each of the
two districts.
54.8 57.0
45.2 43.0
0
10
20
30
40
50
60
Muang Soongmen
Perc
en
tag
e o
f P
art
icip
an
ts
District
Male
Famale
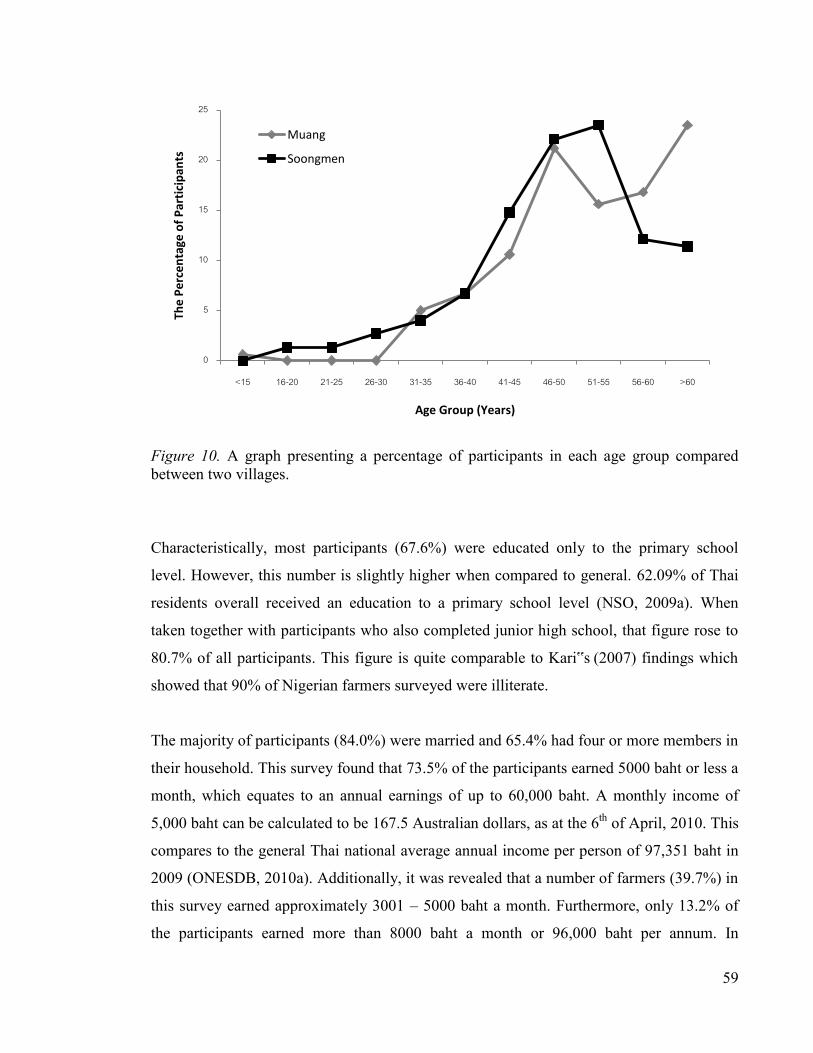
59
Figure 10. A graph presenting a percentage of participants in each age group compared between two villages.
Characteristically, most participants (67.6%) were educated only to the primary school
level. However, this number is slightly higher when compared to general. 62.09% of Thai
residents overall received an education to a primary school level (NSO, 2009a). When
taken together with participants who also completed junior high school, that figure rose to
80.7% of all participants. This figure is quite comparable to Kari‟s (2007) findings which
showed that 90% of Nigerian farmers surveyed were illiterate.
The majority of participants (84.0%) were married and 65.4% had four or more members in
their household. This survey found that 73.5% of the participants earned 5000 baht or less a
month, which equates to an annual earnings of up to 60,000 baht. A monthly income of
5,000 baht can be calculated to be 167.5 Australian dollars, as at the 6th of April, 2010. This
compares to the general Thai national average annual income per person of 97,351 baht in
2009 (ONESDB, 2010a). Additionally, it was revealed that a number of farmers (39.7%) in
this survey earned approximately 3001 – 5000 baht a month. Furthermore, only 13.2% of
the participants earned more than 8000 baht a month or 96,000 baht per annum. In
0
5
10
15
20
25
<15 16-20 21-25 26-30 31-35 36-40 41-45 46-50 51-55 56-60 >60
The
Pe
rce
nta
ge o
f P
arti
cip
ants
Age Group (Years)
Muang
Soongmen

60
summary, a majority of participating farmers earned much less than the national average.
This result is in agreement with other international studies of developing countries that
concluded that most farmers were poor (Kari, 2007).
In terms of agricultural activities, it was found that 85.6% of the entire group of participants
grew rice. However, it was found that rice culture was more extensive in Soongmen
District, involving 92% of its participants, compared to Muang District where rice was
grown by 80% of the participants. Interestingly, few participants in Muang District were
growing other crops with only 15.9% growing soya beans or other crops. Participants from
Soongmen District were more flexible in their crop choice. Twenty eight percent of the
participants in Soongmen District grew corn and 73.3% also grew soya beans with a few
participants also growing sugarcane, cassava and mung beans. While 28% of the
participants in Soongmen District grew corn, none of the participants in Muang District did
so.
The participants from both districts were also shown to engaged in other farming activities
such as raising poultry (54.1%), pig farming (7.2%) and cattle farming (15.9%). However,
cattle farming was more prevalent in Muang District (22.4%) as compared to Soongmen
District (8.7%).
In terms of agricultural land usage and arable areas, most participants from both groups
(54.6%) were found to use only two acres or less. Furthermore, 36.1% of farmers in the two
districts used two-to-four acres for their agricultural activities. Although both groups of the
participants used the land in similar proportions, all participants in Muang District used 12
acres or less while 3.5% of participants in Soongmen District used more. Comparing to
Sirdir‟s (2005) study, about one-third of Turkish farmers (34.9%) used two hectares or less
whereas up to 90.7% of Thai farming participants carried out their agricultural activities on
two hectares or less. Moreover, only 1.6% of Thai farming respondents used an agricultural
area larger than five hectares, compared to 33.0% of Turkish farmers.

61
However, according to World Bank (2011) data regarding the percentage of agricultural
land in total country land, in 2007 Turkey contained 51.3% of agricultural land throughout
the country while only 38.7% of Thailand areas are used for agricultural purposes. Consequently,
it is reasonable that Thai farmers may own smaller agricultural areas than Turkish farmers.
The participants either owned or rented the land for agricultural purposes in similar
percentage, with 42.0% owning land and 41.3% having to rent. The remaining 16.7% of the
farmers both owned and rented land for agriculture.
5.3.2 Presently used ICT tools and the preference
In terms of ICT tools currently used by the participants, Table 3 shows the percentage of
ICT tools used between two districts. The survey showed that television (73.6%) was the
most popular ICT tool used as an agricultural information source. This conforms with
Irivwieri‟s (2007) conclusion that television and radio programmes were the main sources
of agricultural information among illiterate Ehtiopian females. Its popularity may be due to
the high incidence of illiteracy among farmers. This type of communication needs only
simple conversation skills supplemented with visual presentations in television
programmes. It helps farmers better understand agricultural information and material.
By contrast, this result was different to Tarnoczi and Berkes‟ (2010) findings which showed
that television and radio as mass media only played an additional role to other sources of
information. The supporting roles of television and radio were shown in a New Zealand
survey (Locke, 2005); using television as a source of agricultural information accounted for
only 10.8% of farmers in 2003, then reduced to be 4.3% in 2004 along with only 5.9% and
7.4% receiving information via radio in 2003 and 2004, respectively. Additionally, radio
and television were reported as the least communication channels among urban farmers
(Ogunlade, Oladele & Falaki, 2006).

62
Table 3
Currently Used ICT Tools Between Two Groups of the Participants
ICT tools Muang District Soongmen District
Television 68.5% 79.6%
Radio 44.2% 52.8%
VCD 13.9% 33.8%
Landline phones 16.4% 16.2%
Mobile phones 38.8% 68.3%
Computers 7.3% 14.8%
Internet 6.1% 13.4%
Community loud speakers 32.1% 36.6%
Contrary to many international studies that rural farmers rarely received agricultural
information from television due to their poverty (Kari, 2007), or lack of electricity and
infrastructure (Ekoja, 2004), 95.3% of Thai people have a television at home and 60.3%
have a radio (NSO, 2007). However, the different percentages between television
possession and the use of television as an information source may support IICD‟s (2006)
findings that a majority of the participants regarded television and radio as a source of
entertainment rather than information.
Although each participant group provided different percentages of ICT tool used, both the
groups revealed similar distribution in the rankings, except the regard to the use of mobile
phones and radios. In Soongmen District, the participants preferred the use of mobile
phones (68.3%) as compared to radio (52.8%). On the other hand, participants in Muang
District showed a preference reversal of 44.2% for radios and 38.8% for mobile phones.
Even though the proportions of radio usage amongst the participants from both groups were
similar, the farmers from Soongmen District used the radio more. In Muang District, 44.2%
used radios for receiving agricultural information with the remaining 55.8% did not use it
all for this purpose. Conversely, 52.8% of participants in Soongmen District mentioned that
they used the radio for agricultural information and the remaining 44.2% of them did not.
This result was consistent with the usage of mobile phones to get agricultural information.
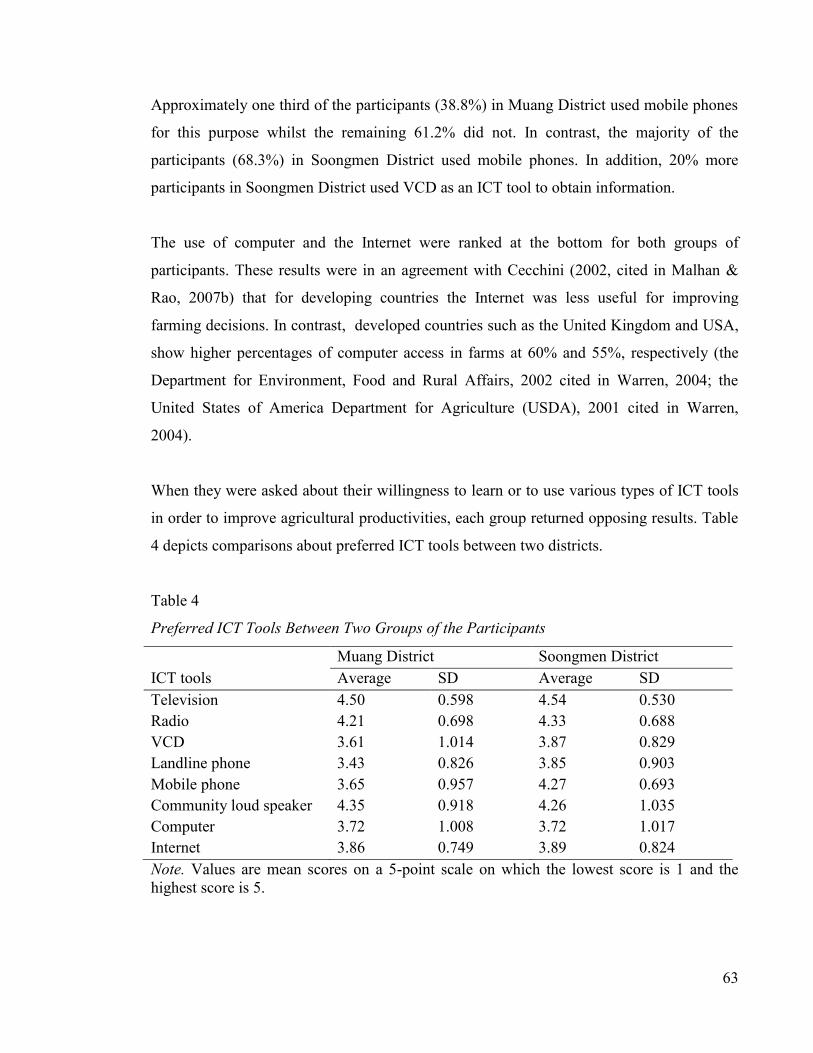
63
Approximately one third of the participants (38.8%) in Muang District used mobile phones
for this purpose whilst the remaining 61.2% did not. In contrast, the majority of the
participants (68.3%) in Soongmen District used mobile phones. In addition, 20% more
participants in Soongmen District used VCD as an ICT tool to obtain information.
The use of computer and the Internet were ranked at the bottom for both groups of
participants. These results were in an agreement with Cecchini (2002, cited in Malhan &
Rao, 2007b) that for developing countries the Internet was less useful for improving
farming decisions. In contrast, developed countries such as the United Kingdom and USA,
show higher percentages of computer access in farms at 60% and 55%, respectively (the
Department for Environment, Food and Rural Affairs, 2002 cited in Warren, 2004; the
United States of America Department for Agriculture (USDA), 2001 cited in Warren,
2004).
When they were asked about their willingness to learn or to use various types of ICT tools
in order to improve agricultural productivities, each group returned opposing results. Table
4 depicts comparisons about preferred ICT tools between two districts.
Table 4
Preferred ICT Tools Between Two Groups of the Participants
Muang District Soongmen District ICT tools Average SD Average SD Television 4.50 0.598 4.54 0.530 Radio 4.21 0.698 4.33 0.688 VCD 3.61 1.014 3.87 0.829 Landline phone 3.43 0.826 3.85 0.903 Mobile phone 3.65 0.957 4.27 0.693 Community loud speaker 4.35 0.918 4.26 1.035 Computer 3.72 1.008 3.72 1.017 Internet 3.86 0.749 3.89 0.824 Note. Values are mean scores on a 5-point scale on which the lowest score is 1 and the highest score is 5.
64
Both groups revealed similar preference toward the use of ICT tools to gain agricultural
knowledge, except with regard to mobile phone. From the 5-point scale, Soongmen
participants obviously preferred to use mobile phones, compared to Muang participants,
with average scores at 4.27 and 3.65, respectively. Additionally, the standard deviation
value of each group strengthened the preference toward the use of mobile phone among
Soongmen participants, with values of 0.693 and 0.957 for Muang participants.
5.3.3 Information channels
Moreover, the most frequently cited main sources of agricultural information were as
follows: the participants themselves (62.9%), their spouses (24.3%) and their children
(6.4%), whereas other family members played an insignificant role in passing on relevant
information, ranging from 0.35 to 2.6%.
Additionally, other agricultural information providers also played an important role among
the participants, even though the first, extension workers, and the third, neighbours, most
mentioned information sources were different between the two districts. The comparison
between the rankings of other agricultural information providers in both districts is shown
in Table 5.
Table 5
The Use of Agricultural Information Providers Between Two Groups of the Participants
Information Provider Muang District Soongmen District
Extension workers 65.6% 46.2%
Local councils 57.1% 57.3%
Neighbours 46.6% 68.5%
Government officers 28.7% 31.5%
Sales agents 12.3% 20.3%
Related web sites 5.5% 8.4%
Private company 0.6% 6.3%

65
It can be seen from Table 5 that the participants in Muang District mainly depended on
extension workers (65.6%) while neighbours (68.5%) were the main information providers
in Soongmen District. The results from Muang District was in line with those of Banmeke
and Ajayi (2007), Opara (2008) and Ekoja (2004) where extension agents were the highest
ranked among available information providers. Nevertheless, the most popular information
provider in Soongmen District was consistent with the findings of Tarnoczi and Berkes
(2010) that farming neighbours were the most common sources of information. Contrary to
this finding, extension agents were considered as one of the least used information sources
among urban farmers in Nigeria (Ogunlade, Oladele & Falaki, 2006). This highlights
different approaches to information provision in different cultural and national contexts.
Furthermore, sales agents, web sites and private companies were minor information sources
for this group of the participants. It also paralleled results from Banmeke and Ajayi (2007)
in Nigeria, that commercial agents and the Internet occupied the two bottom ranks of nine
information sources.
In terms of information provider credibility, participants in both districts ranked them in the
same order, as shown in Table 6.
Table 6
The Credibility toward Information Providers Between Two Groups of the Participants
Muang District Soongmen District Information Providers Average SD Average SD Extension workers 4.34 0.685 4.24 0.673 Local councils 4.24 0.659 4.14 0.783 Government officers 4.11 0.750 4.07 0.768 Neighbours 3.95 0.666 4.02 0.567 Related web sites 3.55 0.753 3.64 1.008 Sales agents 3.31 0.767 3.53 0.885 Private companies 3.04 0.601 3.47 0.924 Note. Values are mean scores on a 5-point scale which the least credible score is 1 and the most credible score is 5.

66
It can be seen from Table 6 that participants in both districts placed more trust in
government-related bodies. Table 6 showed that extension workers, local councils and
extension workers were placed at the top three ranks in both district.
According to Tarnoczi and Berkes‟ (2010) study, industries regularly provided information
related to their product demonstrations or by their own extension workers; this may be the
reason why sales agents and private companies were ranked last in terms of information
credibility.
5.3.4 Types of agricultural information required and the delivery preference
All participants really needed relevant agricultural information in order to improve their
productivity, although their requirements were slightly different. Table 7 presents
agricultural information needs compared between the two villages.
Table 7
Agricultural Information Requirements Between Two Groups of the Participants
Information Requirements Muang District Soongmen District
Use of fertilizer 68.7% 64.6%
Organic farming 62.7% 41.0%
Soil improvement 62.0% 59.7%
Pest management 56.6% 65.3%
Market price 56.6% 59.0%
Use of insecticide 32.5% 36.1%
Financial management 28.9% 34.7%
Weather forecast 16.9% 11.1%
From Table 7, it can be seen that nearly two third of the participants (62.7%) in Muang
District needed information related to organic farming while less than a half of the
participants (41.0%) in Soongmen District showed an interest for this type of information.
As shown in Table 7, information topics related to the use of insecticide, financial

67
management and weather forecasts were the least required information among both groups,
on average at 34.2%, 31.6% and 14.2%, respectively.
This survey had similar findings to several other studies (Ekoja, 2004; Elizabeth & Zira,
2009; Ogunlade, Oladele & Falaki, 2006) where the use of fertilizer and pest management
occupied the top ranks of information needs. Furthermore, it is in conformity with Aboyade
(cited in Ekoja, 2004) that the use and the procurement of fertilizer was the highest ranked
request from farmers. The need of information relevant to soil improvement and pest
management from these participants was also similar to those in Banmeke and Ajayi (2007)
and Ozawa (cited in Ekoja, 2004).
Participants were asked for feedback about the frequency of information transmission and
the time devoted to that transmission. Their opinions about various frequencies and times
were sought. Similar results were obtained from both groups. Nearly a half of the
participants (45.3%) preferred a 5-minute-information session for daily transmission,
whereas another 32.1% preferred the length of 15-minute long information sessions. When
asked about a potential weekly transmission, the majority of the participants (43.6%) also
had a preference for 15-minute information sessions while another 29.3% favoured 30-
minute long information sessions. In addition, 36.3% of the participants preferred a 30-
minute long information session for a fortnightly transmission. However, a smaller
percentage of the participants (31.9%) also preferred to keep the information session at a
length of 15 minutes. Furthermore, 43.8% of the participants preferred a 60-minute
information session to be transmitted once a month while another 29.0% preferred only a
30-minute long information session monthly. Overall, it can be seen that the longer the
length of information, the less often it was preferred by the participants as shown in Figure
11.

68
Figure 11. Percentage of participant preference towards the length of information and frequency of information dissemination.
The time of the day that participants preferred for receiving information was also an
interesting factor which should be considered. It was found that for the majority of the
participants (46.8%), it was convenient to obtain information between six and nine o‟clock
in the evening whereas another 22.7% preferred to receive the information in the morning
between six and ten o‟clock. Even though both groups of the participants resulted in similar
preferences, the group from Muang District preferred the early morning information session
twice as much as the group from Soongmen District, with percentages of 30.6% and 14.2%,
respectively.
45.3
32.1
16.1
0.7
5.8
10.5
43.6
29.3
6
10.5
5.5
31.936.3
15.4
11
4.1
13
29
10.1
43.8
0
5
10
15
20
25
30
35
40
45
50
5min 15min 30min 45min 60min
perc
en
tag
e
length of information
daily
weekly
fortnightly

69
5.3.5 Previous experiences from applying agricultural information received
Participants received positive outcomes from applying the information that they received
and this included higher quality of productivity (69.3%), increased amount of productivity
(68.0%), higher selling price (51.5%) and lower cost (42.9%). However, it seemed that
participants from Soongmen District (72.1%) enjoyed more positive experiences in terms of
increasing productivity after applying agricultural information received than those from
Muang District (64.1%). A reverse trend was noted for the higher quality of productivity
where Muang District recorded 76.9% while Soongmen District showed 61.2% for this
benefit. Figure 12 presents the comparison between two districts in terms of percentage of
participants having positive results from utilizing the received information.
Figure 12. The bar chart shows a comparison between two districts in each positive outcome.
The negative outcomes that participants had after utilizing the received agricultural
information were low selling prices, and/or higher costs together with lower productivity
and the lack of follow-up from information providers after the information was received.
For both districts, 45.8% cited low selling price, with 45.5% recording higher costs but
lower productivity and 45.2% listing the lack of follow-up after information delivery as the
negative outcomes.
64.1
76.9
46.2
59.0
72.1
61.2
43.539.5
0102030405060708090
increasing amount
higher quality lower cost higher selling price
Perc
en
tag
e
positive outcomes
MuangSoongmen
70
It can be seen that the participants had these three experiences at similar percentages.
However, on closer examination, apart from the failure of productivity, participants in both
groups provided totally opposing results, as shown in Table 8.
Table 8
Negative Outcomes After Applying the Received Information Between Two Groups of the
Participants
Negative Outcomes Muang District Soongmen District
Higher cost but lower productivity 55.1% 35.2%
Low selling price 53.8% 37.2%
No follow-up process to stimulate the success 41.7% 49.0%
Complicated process 30.8% 44.8%
Failure of productivity 23.1% 23.4%
The participants described support from the information providers which was designed to
help them increase their productivity. Respondents, questioned about the type of support
they received, revealed that they got the most support through the medium of VCD/DVD
(51.4%). Its popularity amongst participants far exceeded other types of support, such as
receiving the market price via mobile phone service (27.2%), weather forecast on the web
(14.4%) and agricultural forums and web boards (12.1%).
5.3.6 Newly-grouped variables for statistical balance
It was found from the gathered data that data in some variables such as age, income and
education were skewed only in a few categories. In order to analyse data statistically, those
variables therefore were regrouped to make the distribution balance. Table 9 – 11 present
newly grouped variables. In detail, Table 9 depicts a comparison between age groups and
newly-grouped age categories. Due to the small number of participants aged 35 years and
below, the participants in every under-35-year-old age group were aggregated into one
group. This situation confirmed that the agricultural workforce in these villages has been

71
shifting to older age groups, while only a small amount of younger aged workers
contributed to agricultural activities.
Table 9
Newly-Grouped Age Categories for Balancing the Statistical Weight
Age groups New age groups
Below 15 years old
Below 35 years old
16 – 20 years old
21 – 25 years old
26 – 30 years old
31 – 35 years old
36 – 40 years old 36 – 40 years old
41 – 45 years old 41 – 45 years old
46 – 50 years old 46 – 50 years old
51 – 55 years old 51 – 55 years old
56 – 60 years old 56 – 60 years old
over 61 years old over 61 years old
Also due to the imbalance in the percentage of each educational group, some groups were
combined together to balance the groups as shown in Table 10. The certificate and
undergraduate diploma group were aggregated as well as the bachelor degree and the
master degree and higher group. It supports results from other studies (Banmeke & Ajayi,
2007; Irivwieri, 2007; Kari, 2007) that most farmers have low levels of formal education
and were considered as illiterate.
Furthermore, the percentage of farmers in each income group was imbalanced. The
percentage of farmer groups earning more than 8001 baht a month was disproportionate
comparing to other income groups. Therefore, the participants who earned 8001 baht
monthly or higher were assembled as shown in Table 11. This circumstance also replicated
results from similar international studies of developing countries (Kari, 2007) that most
farmers were very poor.

72
Table 10
Newly-Grouped Education Categories for Balancing the Statistical Weight
Education groups New education groups
primary school primary school
junior high school junior high school
high school high school
certificate Certificate/Diploma
undergraduate diploma
bachelor degree Bachelor degree or higher
master degree or higher
Table 11
Newly-Grouped Income Categories for Balancing the Statistical Weight
Income groups New income groups
less than 3000 baht less than 3000 baht
3001 – 5000 baht 3001 – 5000 baht
5001 – 8000 baht 5001 – 8000 baht
8001 – 10000 baht
More than 8001 baht 10001 – 15000 baht
15001 – 25000 baht
more than 25000 baht
5.3.7 Cross tabulation analysis
Using cross-tabulated analysis between the use of computers and the use of Internet
(Pearson Chi-Square, p < 0.01) in both groups, it was found that about two-third of the
participants who used computers to obtain new information also used the Internet.
However, the majority of participants (86.97%) did not use both computers and the
Internet. This finding may be contributed to their poorly educated background and low

73
level of income. Statistics New Zealand (2004), cited in Locke (2005), found that
household income and educational level were one of the most influential factors for farmers
for determining Internet access at home.
Additionally, in terms of the relationship between income and the use of computer (Pearson
Chi-Square, p < 0.01), it was found that the higher the income, the higher the percentage
use of computers, increasingly ranging from 3.9% to 40.5%. This finding is in agreement
with Sindir‟s (2005) findings that the higher income group used computers more than the
lower income group.
Also this trend is in line with the other types of technology tools they used. There is a
statistical significance between income and ICT tools such as radio, VCD, phone, mobile
phone, computer, Internet and speaker (Pearson Chi-Square, p < 0.05). It was found that the
higher the income participants earned the higher percentage of these technology tools they
used to receive information. This result conforms to Sindir‟s (2005) study that the high-
income group owned many more mobile phones than participants from low-income group.
This type of finding also presented in the relationship between high income group and the
use of Internet that the higher income group used the Internet much more than those from
low income group (Sindir, 2005). It may be assumed the affordability of these technology
tools is a main reason why the richer participants were more likely to get used to these
technology tools.
Additionally, it is statistically significant that higher income group tends to receive
information from other sources more than the poorer groups. Those information providers
include neighbours, extension workers, suppliers, government officers and web sites. For
example, 77.5% of the richest participant group received agricultural information from their
neighbours whereas 49.5% of the poorest participant group did. Another example is
agricultural information acquisition from responsible extension workers. Approximately
75% of the highest income group revealed that they obtained related agricultural
information from the extension worker while only 46.5% of the lowest income group did
74
the same. This pattern also showed in suppliers, government officers and web sites as other
information sources.
In addition, a relationship between participants‟ income and their educational background
revealed that the percentage of participants in the lowest education group had decreased if
the income level of the participants increased. In details, 83.3% of the lowest income group
got only primary educational qualification and 75.8% of the next lowest income got the
same educational level while only 23.3% of the highest income group did. Additionally, no
graduate participants earned less than 3000 baht monthly and the percentage of graduate
participants tended to increase from 18.8% to 62.5% in other higher income groups. In
other words, it may conclude that the higher the education the participants had the higher
income they earned.
Moreover, a statistical significance also existed in the relationship between income and the
experience in using agricultural forums or web boards (Pearson Chi-Square, p < 0.01).
About one-third of the highest income participants (35.7%) gained agricultural information
from web sites whereas other groups used the Internet for this purpose varying from 5.1%
to 13.9%. This relationship is in agreement with the percentage of computer and Internet
use among this richest group. Therefore, it may be considered that their income supports
their greater experience of ICT tools.
Although this survey consisted of male and female participants in similar proportions, male
participants (71.4%) showed a statistically significant higher use of VCD than did female
participants (28.6%) (Pearson Chi-Square, p < 0.05). However, this relation did not
significantly show in other ICT tools.
Moreover, gender also affected roles in conveying new agricultural information to
participants. Male were more likely to be the main source of information in household
(72.5%) while 17.4% of male participants revealed that their wives played the main role.
About a half of female participants (50.8%) stated that they mainly provided agricultural
information to their family whereas 33.1% of them indicated that their husbands did. It can

75
be seen that male is more self-confident in terms of the leading role in the household; the
female participants accept the leading role of their spouse more than the male participants
do.
Moreover, several relationships between age groups and the use of ICT tools were found to
be significant. It revealed that participants aged between 51- 55 years were the major users
of radio (24.1%) and VCD (32.9%) among participants who also received agricultural
information through these two types of ICT tools (Pearson Chi-Square, p < 0.02). However,
relationships between this age group and other types of ICT tools did not show statistical
significance. It may be assumed that people from this age group did not have as many
responsibilities for their family and their work. Their successors should be adults who
already have their own family and work. These participants‟ work may be in a steady
status; therefore, these participants were able to spend time gathering information through
radio and VCD. However, another study found that farmers may use ICT services for
entertainment purposes rather than for knowledge enhancement (IICD, 2006).
The relationship between age groups and ICT tools also exists in the use of mobile phones.
The majority of participants aged below 35 years (69.6%) and those between 36 and 40
years (80.0%) were more likely to use mobile phones to receive relevant information.
However, only 30.8% of the elderly, who were more than 60 years of age, obtained
information through mobile phones.
Additionally, the younger participants tended to use the Internet in order to receive
information more than the older groups. About 30.4% of the youngest group, who were
below 35 years of age, stated that they used the Internet; while the group of 36-to-40 year
old participants reported that 15.0% of them used the Internet. In contrast, only 10% or less
of each of the older groups of participants used the Internet. Furthermore, similar
percentages also were apparent in the use of information from web sites, where groups of
participants below 35 (26.1%) and between 36 and 40 years old (10.5%) received
information from web sites, compared to less than 10% of each of the older groups.

76
The younger groups were more enthusiastic in their use of technology tools than the older
groups. Another factor which should be considered is the time technology tools were
introduced and became widespread in Thailand.
It was found that in almost all age groups the majority of participants stated that they were
the main agricultural information providers for the household; except the participants aged
36-to-40 years (35.0%) who claimed that their spouse (60.0%) was the primary source of
information. In addition, the role of their successors as an information provider increased
following the age group of participants. Their children had no role at all in the group of
below-40-year-old participants whereas their successors gradually played more roles from
2.5% in the 41-to-45-year-old group up to 16.1% in the oldest participant group. In other
words, the older the participants the more strongly do their successors take on the roles of
information providers.
It is noticeable that more than half of each age group received agricultural information from
their neighbours; except the oldest group, 61 years old or above, which only 37.3%
mentioned that they obtained information from their neighbours. This similarity also
showed in receiving information from suppliers. Only a small number of the oldest group
used information from suppliers (3.9%), which less than all other age groups.
It may be assumed that the member of oldest participants group tend to be confident in
themselves as major source of information. This can be seen from their role of household
information providers and because they rely the least on other information sources such as
neighbours and suppliers. A reason behind this behaviour may be their own knowledge and
skills in farming including previous experiences from other information sources.
A significant statistical relationship (Pearson Chi-Square, p < 0.021) between the age group
of participants and the negative outcome related to the failure to increase the productivity
also showed in this result. Nearly half of the 51-to-55-year-old participants (42.1%)
experience this circumstance; however, a small percentage of other age groups faced this
situation. It may be a connection between the use of specific information sources and this

77
experience of the 51-to-55-year-old age group which showed the highest percentage of
receiving agricultural information from suppliers.
The education level of participants also related to the percentage use of ICT tools such as
VCD, phone, mobile phone, computer and the Internet (Pearson Chi-Square, p < 0.01). In
each of ICT tools mentioned above, a minority of the lowest educational participants group,
which completed their schooling at the primary school level, used them to obtain
agricultural information. This resulted in 14.8% for VCD, 12.3% for phone, 44.3% for
mobile phones, 3.4% for computer and 3.0% for the Internet. In contrast, a majority of the
well-educated group, each having at least a bachelor degree, used VCD (62.5%), phone
(56.3%), mobile phone (75.0%), computer (62.5%) and Internet (62.5%) to receive useful
information. Additionally, these findings, particular to the higher use of computer and
Internet among well-educated participants compared to the illiterate group, are in line with
Sirdir‟s (2005) result. These obvious differences did not show between the other levels of
education groups, all of which reported similar percentages of use of ICT tools.
A majority of well-educated participants (68.8%) also received more agricultural
information from government officers than did other educational groups, especially the
primary school educated participants of which only 22.5% received information from this
kind of provider. Additionally, a high percentage of this second group (81.8%) also
suffered because agricultural information providers failed to offer any follow-up process to
encourage their success. Even though they needed to improve their farming activities and
were enthusiastic about learning new techniques, their lack of skills and experience resulted
in their need for monitoring from information providers to enhance their knowledge and
skills. In this circumstance, user-friendly intervention in local languages may be an
effective guideline for poor-educated farmers to follow the suggestions and monitor the
outcomes.
However, none of the well-educated group reported that they received product market
prices through the short message service (SMS) on mobile phones, while about one third of
the least educated group (30.8%) and some participants in the other educational groups did.
78
It may be assumed that the well-educated group may have neglected this type of
information source because they usually used information from other sources, such as
government officers (68.8%) and web sites (68.8%). This assumption is in line with the use
of web boards or forums for agricultural information. About a half of the well educated
participants (53.3%) used this service, whereas few from the other less educated groups did.
5.4 Assessment of Current Situation
According to the needs analysis survey, types of agricultural information required by
farmers were identified. The use of fertilizer, organic farming and soil improvement
information were the most mentioned topics among farmers. Other topics, such as pest
management and market price, also were requested by the majority of participants.
However, information concerning the use of insecticides, financial management and
weather forecast was required by less than a half of the participants.
The participants in this study were asked what kind of ICT tools they used to receive
agricultural information. They revealed that television (73.6%) is the most popular ICT
tool, followed by mobile phones (52.4%), radio (48.2%) and community loud speakers
(34.2%). Other ICT tools, such as the VCD (23.1%), landline phones (16.3%), computers
(10.7%) and the Internet (9.4%), were less popular sources of information.
Even though a huge percentage of the participants did not use computers (89.3%) or the
internet (90.6%) to receive agricultural information, overall they were eager to try the
Internet for this purpose. This intention was shown in their preference for using ICT tools
to receive information, in these preferences the Internet was ranked above VCDs,
computers and landline phones.
However, face-to-face communication was also a common channel among these
participants. The participants still received agricultural information via extension workers,
local councils, neighbours, government officers, and sales agents. From the survey results,

79
it was found that extension workers (56.5%), local councils (57.2%) and neighbours
(56.9%) were highly ranked as sources of information.
When it came to the trustworthiness of face-to-face information providers, it was apparent
that participants put their trust in extension workers first, followed by local councils,
government officers and neighbours. Interestingly, average scores in Likert scale, the
participants trusted information from government officers (4.09) more than that from
neighbours (3.99), even though they obtained information from neighbours (56.9%) more
often than from government officers (30.1%). It may be concluded that farmers in this
study were more likely to put their trust in official information providers than in private
sources.
Additionally, the participants reported that the use of ICT tools for the purpose of
agricultural information dissemination occurred because of various public projects. They
were:
1) receiving market price via mobile phone (27.2%)
2) VCD/DVD about agricultural improvement (51.4%)
3) online forum or web board (12.1%)
4) weather forecast announced on a website (14.4%).
This is in conformity with the DAE‟s annual report (2010) that it provided useful
information on their web sites along with agricultural documentaries in a VCD format.
From the first survey of these two groups of farmers, it was found that many variables had
relationships with other variables as previously mentioned. Some variables related to more
than one variable such as relationships between income and ICT tools used; income and a
variety of information sources; and income and education. In addition, participants in each
age group differently responded to other factors such as ICT tools used, roles of household
information provider and information sources chosen. A relationship between gender and

80
roles of household information provider is also shown in the data analysis. These
relationships are depicted in Figure 13.
Figure 13. Relationships between variables in the needs survey.
ICT tools used to receive information
Age Income
Information source
Education
Role of information provider in household
Gender
81
CHAPTER 6 NEW FRAMEWORK
6.1 Introduction
Results from literature reviews, the farmers‟ needs survey and relevant documents were
analysed to form a new information dissemination framework. The newly created
framework was then implemented for a period of eight weeks, from mid June to mid
August, 2010 during the rainy cultivation season. This chapter will provide detail of the
design implementation and evaluation of the new framework.
6.2 Development of Framework
Television and radio were frequently used tools for receiving information. It can be seen
from the preliminary survey that, of all the participants in this study, 73.6% used television
and 48.2% used radio for receiving agricultural information. In addition nation-wide, TV
and radio have been used as communication tools at 93% and 63.6%, respectively.
However, only one TV programme and 10 radio channels throughout the country have
broadcast agricultural information and news, under the production of the related
government bodies (DAE, 2010). These tools may not be efficient if the programmes were
broadcast at times that participants were neither available nor at home. This assumption
was based on the results in Section 5.3 that the majority of participants preferred to receive
agricultural information either between 6 and 9 AM or between 6 and 10 PM which were
the prime times for TV broadcasting. Additionally, news and information delivered by
these tools cannot be repeatedly watched or heard by the users themselves. After a while,
the memory of the contents may fade. It may therefore be concluded that the use of
television and radio as communication tools in this research may not be suitable.
Although computers and the Internet offered related information in attractive multimedia
formats, they were expensive, unfamiliar, and somewhat beyond the farmers‟ daily lives.
Moreover, the National Statistical Office‟s report (NSO, 2010a) revealed that only 3.4%

82
and 1.9% of the agricultural sector used computers and Internet, respectively which can be
viewed as very low percentages. This number was in line with the needs survey‟s results
which showed that computers and the Internet were the least used ICT tools among this
study‟s participants at only 10.7% and 9.4%, respectively.
Furthermore, providing computer sets and Internet connections for free use at the local
council still may be inconvenient for these farmers due to the office hours. Usually the
offices are open from 8 o‟clock in the morning to 4 o‟clock in the evening. This time period
is similar to the time that these farmers spend in their fields. By the time they returned from
field work the council may have already been closed. Moreover, other studies found that a
lack of computer or Internet skills was another major hindrance among rural residents in
using these tools for agricultural purposes (for example, Narula & Arora, 2010). Therefore,
these tools may not be considered as advantageous alternatives.
From the data analysis of the first survey, it was found that a majority of target groups
(52.4%) had mobile phones along with familiarity in using mobile phones. Moreover, their
preference for the use of mobile phones as an agricultural information channel was
considerably higher, with a raw score of 4 out of a possible 5. Additionally, the growth rate
of mobile phone users in Thailand was relatively high, from 36.7% in 2005 to 56.8% in
2009 (NSO, 2010a). Statistical data indicated that the percentage of landline phone
possession in Thailand had decreased from 26.8% in 2005 to 22.1% in 2009 (NSO, 2010a).
It can be seen that implementations based on the use of landline phones may not be as
successful as the mobile phone-based applications. Agricultural information dissemination
through mobile phones may be a suitable option to be considered.
However, most participants had an educational qualification at only a primary school level;
consequently, they were considered as an illiterate group. Although audio contents through
mobile phone service were proved to be effective for illiterate groups (Mittal & Tripathi,
2009), its success was limited by the time that audio information was fed to farmers. If the
farmers were not available at that time, they might miss vital news or information. Also, the
farmers did not have the option of listening again to the information provided at times when

83
they had forgotten what was said or did not hear it properly. Even if a call-back service was
arranged for repeated listening, this created an extra expense for farmers to retrieve
required information. It may hinder the full involvement in the experiment by needy
farmers.
Due to lack of experience in using ICT tools for receiving agricultural information, a push
technique to provide information directly to users was chosen. However, in another study it
was found that a service providing options for users to opt out would be more successful
(Rao, Ramamritham & Sonar, 2010). As a result, top agricultural information requirements
from the needs analysis; namely use of fertilizer, organic farming and soil improvement,
were selected as the information to be delivered to participants.
Although state of art communication tools, such as computers and the Internet, are
commonly used around the world, their appropriateness within specific situations and the
readiness of potential users are unavoidable concerns to take into account when offering
new services to users. Most farmers in this study were poor and not accustomed to the use
of computers and the Internet. A simple, effective and inexpensive ICT tool, such as the
mobile phone, should be the most suitable tool for this study. Furthermore, as the users
were considered to be almost illiterate, a short text should be proper for their reading skills.
Even though video clips may be more appropriate to illiterate farmers than text messages,
they require higher performance mobile phones which are usually unaffordable for poor
farmers. Therefore, an application using a simple service called the short message service
(SMS), which is supported in every model of mobile phones and does not require high
bandwidth, was selected as the most appropriate option for this study. Additionally,
contexts using local languages were proved to be more acceptable for non-English
audiences (Arunachalam, 2002; Chaudhary, 2004; Rao, Ramamritham & Sonar, 2010);
consequently, the messages should be delivered in Thai.

84
6.3 Implementation of Framework
An outline of the framework design is presented as Figure 14. The service prototype was
developed with Visual Basic 6 tools connecting to a database using Microsoft Access 2007.
This prototype connected to an assigned mobile phone via a Bluetooth connection in order
to disseminate scheduled contents to participants‟ mobile phones on the list (See Appendix
D for the prototype interfaces).
Figure 14. The proposed system framework.
The prototype application contained four main modules which were:
1) instant message delivery
2) information contents and delivery schedules
3) member management
4) Bluetooth connection
database development and coding
database update
report queries
information contents
delivered Information
application developer administrators
mobile phone host
farmer‟s mobile phone

85
Firstly, the instant message delivery was designed to send a message out immediately to a
mobile phone. Only the receiver‟s mobile phone number and a message were required to
complete the text boxes provided then the messages were instantly delivered after the Send
button was clicked.
Secondly, the information content management and the delivery scheduling were placed on
the same interface for convenience. In the information content management, the
administrator was able to create, update and delete the content topics, message subjects and
details. However, due to Thai character encoding a message was limited to only 70
characters. The administrator might assign the delivery schedule for each message if
required with two options which were now or date-time assignment. Later, these messages
were able to be assigned in conjunction with receivers‟ mobile phone numbers. Therefore,
the messages were disseminated to the assigned receivers at the times and dates specified.
Next, the membership management module supported the administrator to create, edit and
delete the members of the system. Only the name and mobile phone number were necessary
to manage each member‟s account. All member lists were displayed on the content
management module to be linked with the messages delivered.
Finally, the Bluetooth connection module was used to configure the port used to transfer
data to the connected mobile phone. After the Bluetooth connection between the computer
and the mobile phone was connected on the Windows operating system platform, the
assigned port would be shown. This port was assigned to this Bluetooth connection module
afterwards.
There were three groups of users which were:
1) the system developer
2) the system administrator
3) farmers receiving information from the system

86
Firstly, the system developer worked on collecting agricultural information according to the
target group‟s requirements. Then, the information from any formats was transformed into
a database in order to be readily distributed to the target group through an SMS service on
mobile phones. Furthermore, the developer was responsible for implementing a software
application for connecting the agricultural information database to an information-sending
tool like a mobile phone. In addition, the developer had all rights to access the whole
system including any sub-systems within. These rights included implementing, editing and
adjusting both the software application and the database. Moreover, the system developer
was able to grant the system access to authorized officers in order to update the agricultural
information and user registration within the database.
Next, the system administrator‟s main responsibility was to update the relevant recent
agricultural information in the database. The administrator accessed information contents in
the database in order to update agricultural data and mobile phone registration. However,
the administrator was not able to modify the software application. In this experiment, the
developer also covered the administrator‟s work.
Lastly, the farmers receiving information from the system were determined as the system
users who obtained specifically required information via an SMS service on registered
mobile phones.
Additionally, types of data within the database implemented were composed of agricultural
information contents and user registration information. Three types of agricultural
information, which were selected from the most required information in the previous needs
survey, were the use of fertilizer, organic farming and soil improvement. The relevant
contents were excerpted from government websites to ensure accuracy of information.
Official websites of the Department of Agricultural Extension, the Department of
Agriculture, the Land Development Department, all of which are under the supervision of
the Ministry of Agricultural and Cooperatives, were the exemplar websites used.

87
Moreover, user registration information consisted of registered mobile phone numbers, and
a set of coded required agricultural information topics.
In regards to the design of database, a relational database was applied. It consisted of four
tables which were:
1) types of news (Table 12)
2) message (Table 13)
3) mobile phone user (Table 14)
4) message sending (Table 15)
Firstly, the types of news table contained news topics and their descriptions. Secondly, the
message table contained the sub-topic, its contents and sending schedule. Each message
was linked to the main topic in the types of news table via a topic identification number.
Thirdly, the mobile phone user table consisted of registered recipients‟ names, mobile
phone numbers and date-time of registration. Finally, the message sending table was used
to link each message to be sent to each recipient.
Table 12 Detail of the Types of News Table Field Name Data Type Description
id auto number topic identification number
name text topic name
detail text topic description
Table 13 Detail of the Message Table
Field Name Data Type Description
id auto number message identification number
type_news_id number topic identification number
message name text sub-topic name
message detail text message content
message type text either instantly or scheduled sending
message date-time date-time date and time to deliver the message
message created date date-time date and time that the message was created

88
Table 14 Detail of the Mobile Phone User Table
Table 15
Detail of the Message Sending Table
After the development of the prototype was accomplished, participants from the needs
survey were asked in a community meeting to try this service, at no cost. However, not all
participants from the previous survey undertook this service. Then, only participants, who
agreed on this trial, were asked to register into the service with their mobile phone
numbers, one type of information request, frequency of receiving information and preferred
time for receiving information.
All registration data were updated into the prototype system through the application
interface; therefore, all participants in this experiment became members of the service.
Then, an information dissemination configuration and schedule was assigned to participant,
according to their requirements.
Field Name Data Type Description
id auto number recipient identification number
name text recipient's name
mobile number text recipient's mobile phone number
registration date date-time date and time that the recipient registered
Field Name Data Type Description
id auto number recipient identification number
message id number message id from the message table
mobile number number recipient id from the mobile phone user table
sending status text status either already sent or in schedule
89
6.4 Analysis of Implementation
After conducting an experiment to deliver agricultural information according to
participants‟ particular information requests, a survey to evaluate the participants‟
satisfaction with the prototype and means of information dissemination was carried out.
The user satisfaction questionnaires (see Appendix E) were distributed only to the
participants who joined the experiment. Therefore, these participant groups were subsets of
the participants in the first questionnaire which was the requirement survey. The collected
data (see raw data in Appendix F) were statistically analysed using SPSS tools with
statistical techniques such as percentage, mean, standard deviation and cross-tabulated
analysis using Pearson Chi-Square technique.
6.4.1 Demographic data
The participants were composed of 57 (49.1%) farmers from the Muang District and 59
(50.9%) farmers from the Soongmen District. In total, the number of male participants
(71.6%) was many more than female participants (28.4%). However, the majority of
participants from the Muang District (84.2%) were male, while male (59.3%) and female
participants (40.7%) from Soongmen District were more similar in number (see Figure 15).
The proportion of male and female farmers in total was in line with many studies (Elizabeth
& Zira, 2009; Cidro & Radhakrishna, 2006) that a majority of farmers are male. However,
this experiment was involved with voluntarily using a mobile phone service. With some
studies finding that females were less comfortable than males in dealing with technology
tools (Saghir, Ashfaq & Noreen, 2009), the idea that some female farmers may have
refused to participate in this experiment, could not be discounted.
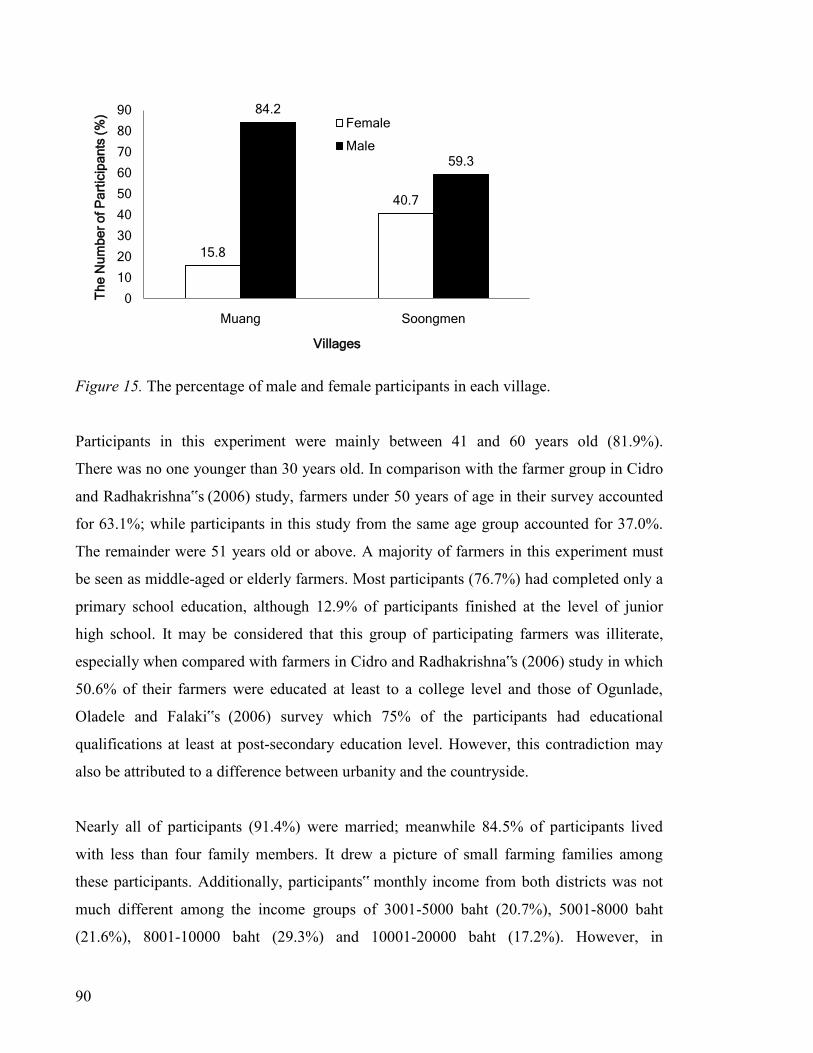
90
Figure 15. The percentage of male and female participants in each village.
Participants in this experiment were mainly between 41 and 60 years old (81.9%).
There was no one younger than 30 years old. In comparison with the farmer group in Cidro
and Radhakrishna‟s (2006) study, farmers under 50 years of age in their survey accounted
for 63.1%; while participants in this study from the same age group accounted for 37.0%.
The remainder were 51 years old or above. A majority of farmers in this experiment must
be seen as middle-aged or elderly farmers. Most participants (76.7%) had completed only a
primary school education, although 12.9% of participants finished at the level of junior
high school. It may be considered that this group of participating farmers was illiterate,
especially when compared with farmers in Cidro and Radhakrishna‟s (2006) study in which
50.6% of their farmers were educated at least to a college level and those of Ogunlade,
Oladele and Falaki‟s (2006) survey which 75% of the participants had educational
qualifications at least at post-secondary education level. However, this contradiction may
also be attributed to a difference between urbanity and the countryside.
Nearly all of participants (91.4%) were married; meanwhile 84.5% of participants lived
with less than four family members. It drew a picture of small farming families among
these participants. Additionally, participants‟ monthly income from both districts was not
much different among the income groups of 3001-5000 baht (20.7%), 5001-8000 baht
(21.6%), 8001-10000 baht (29.3%) and 10001-20000 baht (17.2%). However, in
15.8
40.7
84.2
59.3
0
10
20
30
40
50
60
70
80
90
Muang Soongmen
Th
e N
um
be
r o
f P
art
icip
an
ts (
%)
Villages
Female
Male

91
comparison the majority of participants from Muang District (77.2%) earned about 8001 –
20000 baht whereas 69.5% of those from Soongmen District earned 3001 – 8000 baht as
shown in Figure 16. It may show that, in general, farmers from the Muang District are more
likely to be richer than their counterparts from the Soongmen District.
Figure 16. The percentage of participants in each income group between two villages.
6.4.2 Information and its dissemination in the experiment
In terms of information requests from participants in the experiment, the use of fertilizer
(37.1%), soil improvement (34.5%) and organic agriculture (28.4%) were requested in a
similar percentage, as depicted in Figure 17. Nevertheless, the types of information needs
from both districts were very different. Muang District mainly required information related
to the soil improvement which is account for 61.4% of those in the village; whereas
participants from Soongmen District paid more attention in the use of fertilizer (47.5%) and
the organic agriculture (44.1%).
0.0 0.0
14.0
43.9
33.3
8.8
13.6
40.7
22.8
15.3
1.70.0
0
5
10
15
20
25
30
35
40
45
50
< 3K 3K-5K 5K-8K 8K-10K 10K-20K > 20K
Th
e P
erc
en
tag
e o
f P
art
icip
an
ts (
%)
Income (Baht)
Muang
Soongmen

92
Figure 17. Percentage of participants receiving each type of information between two villages.
Preference toward the frequency of information received was totally dissimilar between
two villages. Although receiving information weekly (63.2%) was the option chosen most
among participants from Muang District, all of those from Soongmen District (100%)
chose this frequency, as illustrated in Figure 18. This unusual circumstance may be affected
by participants‟ uncertainty to the use of ICT tool features like sending and receiving short
message service (SMS). Getting information daily may seem too often for them who were
not familiar with technology; meanwhile monthly information may seem unworthy to try a
new offered service.
Nevertheless, after the information dissemination experiment their preference of
information frequency changed. Participants from Muang District mainly required
agricultural information either daily (43.9%) or weekly (40.4%). In contrast, there was no a
vast difference on preference of information delivery frequency among participants from
Soongmen District twice-a-week (25.4%), weekly (23.7%), fortnightly (23.7%) and
monthly (25.4%), as show in Figure 19.
26.3
61.4
12.3
47.5
8.5
44.1
0
10
20
30
40
50
60
70
Use of Fertilizer Soil Development Organic Farming
Th
e P
erc
en
tag
e o
f P
art
icip
an
ts (
%)
Types of Information received
Muang
Soongmen

93
Figure 18. The percentage of participants choosing a frequency they preferred to receive agricultural information for the experiment in each village.
Figure 19. The percentage of participants requesting a new information frequency in each village.
Before the information delivery experiment all participants chose their receiving frequency
according to their expectations of the service which was about to be provided. After the
testing period, they were able to opt for the frequency that suited their own convenience
22.8
63.2
14.0
0.0
100.0
0.0
0
20
40
60
80
100
120
Daily Weekly Fortnightly
Th
e P
erc
en
tag
e o
f P
art
icip
an
ts (
%)
Information Frequency
Muang
Soongmen
3.5
43.9
7.0
40.4
5.3
0.00.01.7
25.423.7 23.7
25.4
0
5
10
15
20
25
30
35
40
45
50
Twice-a-day Daily Twice-a-week Weekly Fortnightly Monthly
Th
e P
erc
en
tag
e o
f P
art
icip
an
ts (
%)
Requested Information Frequency
Muang
Soongmen
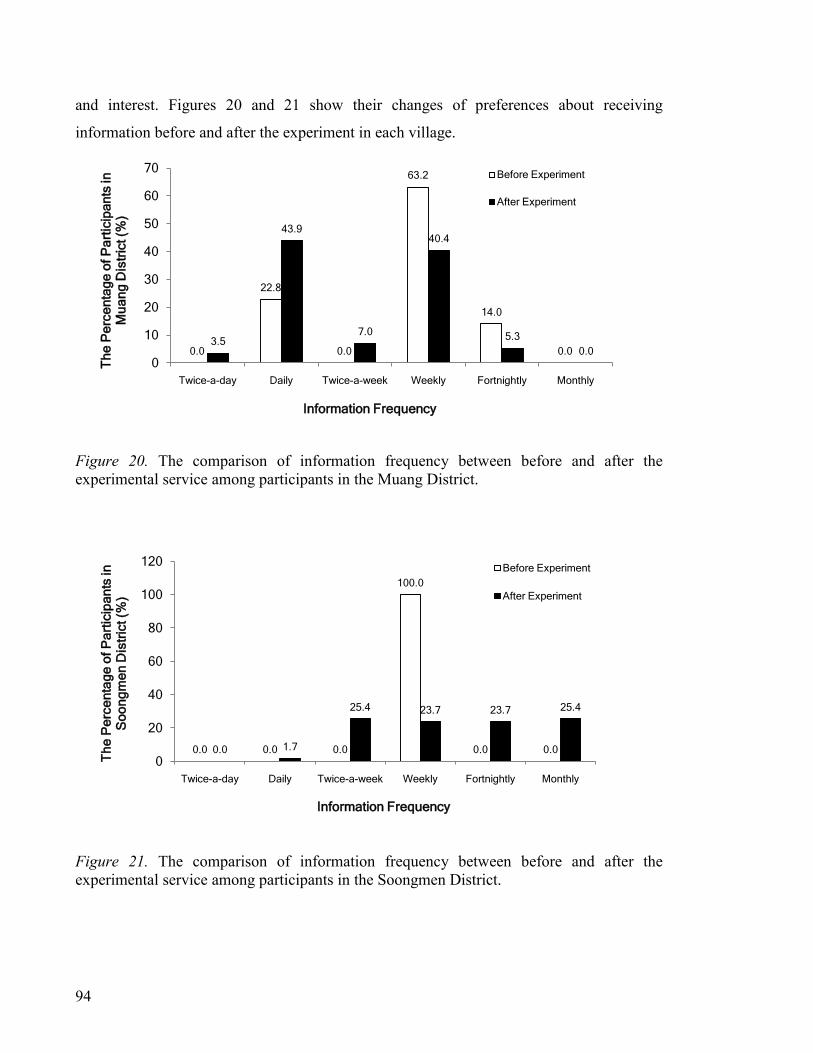
94
and interest. Figures 20 and 21 show their changes of preferences about receiving
information before and after the experiment in each village.
Figure 20. The comparison of information frequency between before and after the experimental service among participants in the Muang District.
Figure 21. The comparison of information frequency between before and after the experimental service among participants in the Soongmen District.
0.0
22.8
0.0
63.2
14.0
0.03.5
43.9
7.0
40.4
5.3
0.0
0
10
20
30
40
50
60
70
Twice-a-day Daily Twice-a-week Weekly Fortnightly Monthly
Th
e P
erc
en
tag
e o
f P
art
icip
an
ts in
M
ua
ng
Dis
tric
t (%
)
Information Frequency
Before Experiment
After Experiment
0.0 0.0 0.0
100.0
0.0 0.00.0 1.7
25.4 23.7 23.7 25.4
0
20
40
60
80
100
120
Twice-a-day Daily Twice-a-week Weekly Fortnightly Monthly
Th
e P
erc
en
tag
e o
f P
art
icip
an
ts in
S
oo
ng
me
n D
istr
ict (%
)
Information Frequency
Before Experiment
After Experiment

95
6.4.3 Opinions of the information dissemination in the experiment
In terms of participants‟ opinions of the information delivery service, participants from the
two villages revealed differences on some aspects; namely convenience, ease of use, a free-
of-charge service, knowledge enhancement, a technology practice, information timeliness
and an information format. The average score and standard deviation value in each category
of opinions toward the service is shown for each in Table 16 below.
Table 16
Opinions Toward the Experimental SMS Service Between Two Villages
Muang District Soongmen District
Opinions Average SD Average SD
Convenience 4.86 0.35 4.56 0.57
Ease of use 4.82 0.38 4.64 0.58
Free of charge 4.95 0.23 4.53 0.57
Knowledge enhancement 4.88 0.38 4.54 0.57
Technology practice 4.77 0.44 4.39 0.62
Information timeliness 4.86 0.35 4.40 0.64
Information format 4.84 0.37 4.42 0.62
Note. Values are mean scores on a 5-point scale which the lowest score is 1 and the highest score is 5.
It can be seen from Table 16 that on average participants in the Muang District had more
positive opinions toward the service in every aspect than those from the Soongmen District.
Moreover, the standard deviation in each category also showed that the opinions among
participants in the Muang District alone were less variable than those from the Soongmen
District.
Furthermore, in terms of opinion ranking from Table 16 it showed that participants from
the Muang District were more interested in the benefit of free services and the knowledge
they gained, while participants from the Soongmen District perceived advantages in the
convenience of the service followed by the ease of use.

96
Compared to the survey results obtained from research activity Stage 1, this survey
revealed that the Soongmen participants used ICT tools for receiving information more than
Muang participants did for every sample tool except landline phones. In addition, the
percentage of mobile phone users among the Soongmen farmers (68.3%) was much higher
than those from the Muang District (38.8%). Also the preference toward the use of ICT
tools among the Soongmen farmers was higher than, or at least equal to, those from the
Muang District for every tool, including the preference for the use of mobile phone as an
information source. Consequently, it may be assumed that familiarity with using ICT tools
positively affected opinions toward the use of these technologies for agricultural purposes.
Furthermore, in regard to the knowledge enhancement from the information received, the
Muang participants scored this issue at the second rank. Percentages of the Muang
participants‟ educational backgrounds were higher than those from the Soongmen
participants at all levels except the primary school level. In other words, the Muang
participants had higher educational qualifications than the Soongmen participants. This
factor may have affected the understanding and learning effectiveness of information
obtained by the participants.
6.4.4 Further requested agricultural information
All participants were also asked, in case they would like to continue this information
dissemination service, what kind of agricultural information they would require.
Information related to market price was the most requested topic (44.8%) followed by pest
management (40.5%), financial management (22.4%), the use of insecticide (15.5%) and
weather forecast (5.2%).
The requirement for pest control information among these participants was different from
participants in Ekoja‟s (2004) Nigerian study where information regarding pest control was
in high demand at 93.1% of all participants. This different requirement for pest control
information highlights the fact that pest control is very specific to particular locations.
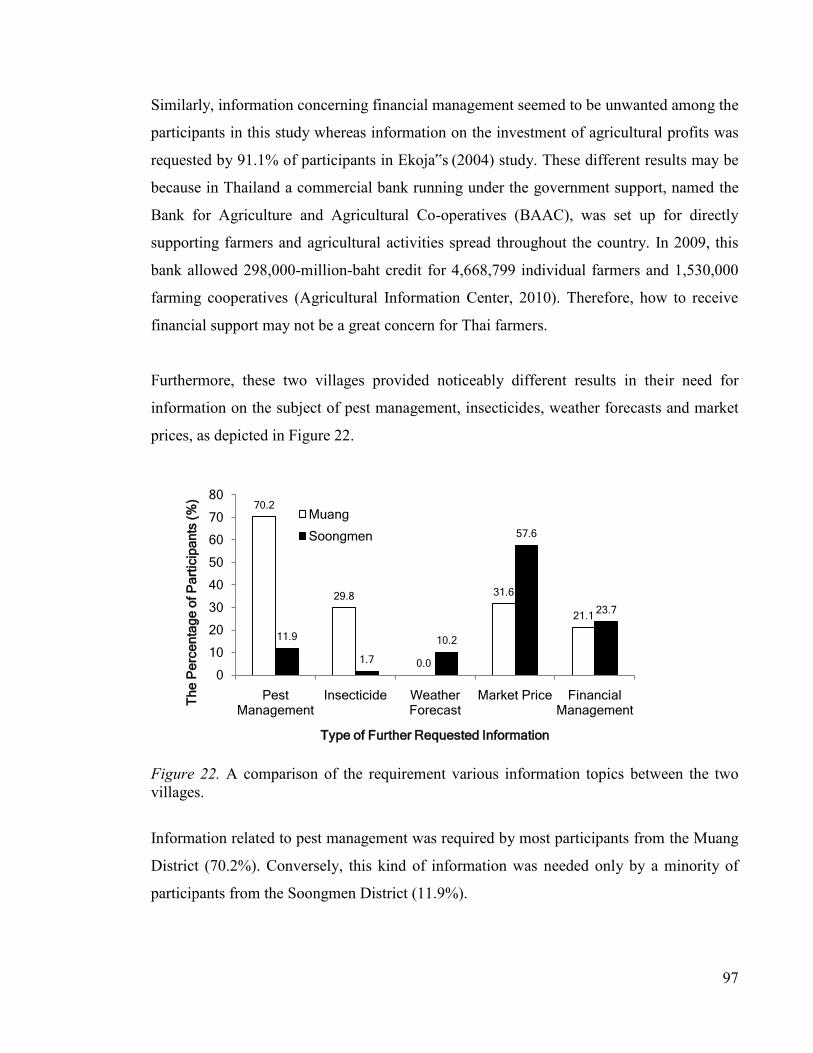
97
Similarly, information concerning financial management seemed to be unwanted among the
participants in this study whereas information on the investment of agricultural profits was
requested by 91.1% of participants in Ekoja‟s (2004) study. These different results may be
because in Thailand a commercial bank running under the government support, named the
Bank for Agriculture and Agricultural Co-operatives (BAAC), was set up for directly
supporting farmers and agricultural activities spread throughout the country. In 2009, this
bank allowed 298,000-million-baht credit for 4,668,799 individual farmers and 1,530,000
farming cooperatives (Agricultural Information Center, 2010). Therefore, how to receive
financial support may not be a great concern for Thai farmers.
Furthermore, these two villages provided noticeably different results in their need for
information on the subject of pest management, insecticides, weather forecasts and market
prices, as depicted in Figure 22.
Figure 22. A comparison of the requirement various information topics between the two villages.
Information related to pest management was required by most participants from the Muang
District (70.2%). Conversely, this kind of information was needed only by a minority of
participants from the Soongmen District (11.9%).
70.2
29.8
0.0
31.6
21.1
11.9
1.7
10.2
57.6
23.7
0
10
20
30
40
50
60
70
80
Pest Management
Insecticide Weather Forecast
Market Price Financial Management
Th
e P
erc
en
tag
e o
f P
art
icip
an
ts (
%)
Type of Further Requested Information
Muang
Soongmen

98
How to use insecticide also was not in demand among participants from either village
(Pearson Chi-square, p < 0.01). However, nearly all participants from the Soongmen
District (98.3%) mentioned they did not require it, while 29.8% of participants from the
Muang District indicated that they still needed it.
It seemed that information in relation to weather forecasts was not a priority among these
participants (Pearson Chi-square, p < 0.02). No participant from the Muang District stated
that they needed it while only a small percentage of participants from the Soongmen
District (10.2%) requested it.
The need for information concerning product market prices showed diverse results between
these two villages (Pearson Chi-square, p < 0.01). Only 31.6% of the participants from the
Muang District stated that they required this kind of information whereas more than half of
the participants from the Soongmen District (57.6%) did. It can be seen that participants
from the Soongmen District were nearly twice as interested in receiving market price
information as those from the Muang District.
6.4.5 Difficulties from the experiment
In relation to unfamiliarity with the use of technology tools, only 18.6% of participants
from the Soongmen District cited as a problem, while this problem was not mentioned
among those from the Muang District. The technology familiarity among these farmers
reiterated a rural development issue, that implementing ICT tools for enhancing livelihood
in rural areas still needed a certain level of technology competence skills (Sindir, 2005).
Additionally, inconvenience from reading text that was too small was pointed out by 12.9%
of all participants, which was divided into 8.6% from the Muang District and 4.3% from
the Soongmen District. Nevertheless, nobody mentioned that receiving information by
SMS was a cause of annoyance was not responded, and only 1.7% thought that some of the
information received was impractical.
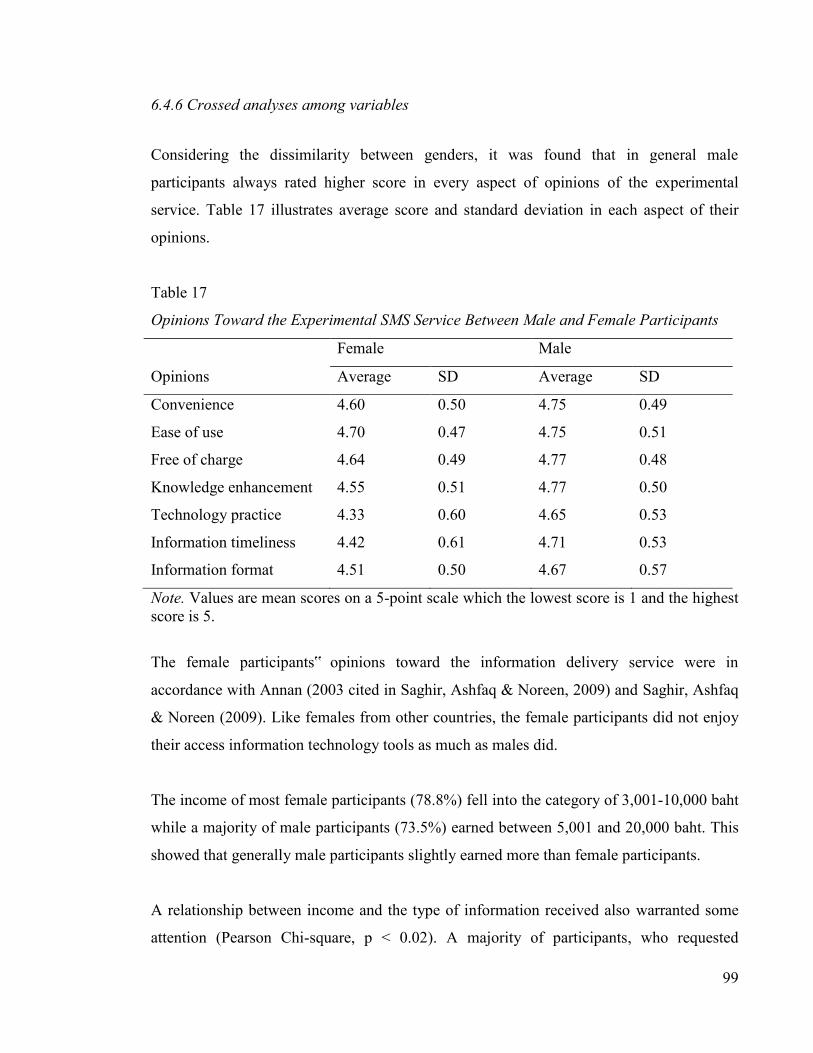
99
6.4.6 Crossed analyses among variables
Considering the dissimilarity between genders, it was found that in general male
participants always rated higher score in every aspect of opinions of the experimental
service. Table 17 illustrates average score and standard deviation in each aspect of their
opinions.
Table 17
Opinions Toward the Experimental SMS Service Between Male and Female Participants
Female Male
Opinions Average SD Average SD
Convenience 4.60 0.50 4.75 0.49
Ease of use 4.70 0.47 4.75 0.51
Free of charge 4.64 0.49 4.77 0.48
Knowledge enhancement 4.55 0.51 4.77 0.50
Technology practice 4.33 0.60 4.65 0.53
Information timeliness 4.42 0.61 4.71 0.53
Information format 4.51 0.50 4.67 0.57
Note. Values are mean scores on a 5-point scale which the lowest score is 1 and the highest score is 5.
The female participants‟ opinions toward the information delivery service were in
accordance with Annan (2003 cited in Saghir, Ashfaq & Noreen, 2009) and Saghir, Ashfaq
& Noreen (2009). Like females from other countries, the female participants did not enjoy
their access information technology tools as much as males did.
The income of most female participants (78.8%) fell into the category of 3,001-10,000 baht
while a majority of male participants (73.5%) earned between 5,001 and 20,000 baht. This
showed that generally male participants slightly earned more than female participants.
A relationship between income and the type of information received also warranted some
attention (Pearson Chi-square, p < 0.02). A majority of participants, who requested

100
information related to the use of fertilizer (76.7%) or organic farming (75.8%), earned
between 3,001 and 10,000 baht. However, 70.0% of participants who received the soil
improvement information were in the income category of 8,001 to 20,000 baht. In other
words, participants, who earned higher incomes, were more likely to require information
related to soil improvement.
Also the relationship between educational level of farmers and farmers‟ income showed a
trend. All farmers with degrees earned more 20,000 baht a month while only 1.1% of
farmers who had a basic primary school education earned the same amount. In the
meantime, all farmers who earned less than 3,000 baht finished only to the primary school
level. The higher educated farmers were more likely to earn more money than others who
had lower educational qualifications.
Moreover, income and the required frequency of the information received showed a
relationship. Participants who requested agricultural information daily earned at least 8,001
baht per month; most participants of this group (69.2%) made revenue between 10,001 and
20,000 baht a month. In contrast, 80% of the participants who received information
fortnightly earned between 3,001 and 10,000 baht monthly. In other words, richer
participants were more likely to request agricultural information more often than the poorer
participants. However, all participants who chose to receive the information once a month
were equally distributed in four income groups.
Opinions about the convenience of use also showed a relationship to participants in each
income group. Participants, who rated the convenience of service use with a score of four
out of five (76.7%), were mainly in groups of 3,001 to 10,000 baht income, whereas a
majority of participants who gave convenience a score of five out of five (73.7%), earned
income between 5,001 and 20,000 baht. In other words, higher income participants were
more likely to award higher scores for the convenience of technology tool usage.
In addition to the relationship between the convenience of ICT tool use and income group,
a similar relationship also showed in opinions of the free-of-charge service. Most of

101
participants, who stated they agreed with this issue (77.7%), earned between 3,001 and
10,000 baht while 73.5% of participants, who strongly agreed, were mostly in groups
earning 5,001 to 20,000 baht. In other words, the more income the participants earned the
more likely they were to rank this aspect highly.
Moreover, a relationship between income groups and opinions toward knowledge
enhancement was revealed. Similarly, 54.2% of participants, indicating that they strongly
agreed with the agricultural knowledge they gained, were in income groups of 5,001 to
10,000 baht. However, about a half of the participants (53.6%), who earned 5,000 baht or
less, rated four out of five score in this topic. Also in this matter, higher income participants
were more likely to allocate higher ranking for the knowledge enhancement which they
believed they gained from the experiment.
Additionally, a relationship between opinions toward technology practice and income was
also in an agreement with previously mentioned relationships. A majority of participants,
who had a strong agreement on the technology practice they obtained from the experiment
(89.9%), earned between 3,001 and 20,000 baht monthly while 90.7% of participants, who
only agreed, had 10,000 baht or less per month. In other words, richer participants were
more likely to allocate higher scores to an agreement about the technology practice.
Furthermore, among participants who indicated a strong agreement with the timeliness of
the service, the largest group (33.3%) earned about 8,001 to 10,000 baht a month. In
contrast, the largest group of participants who indicated just an agreement (33.3%) monthly
earned between 3,001 and 5,000 baht. It seems that the richer group was more likely to
enjoy the service than the poorer group.
The relationships between income and further information requirements were also present
for the topic of pest management as illustrated in Figure 23. In comparison among
participants who earned 8,000 baht a month or less, participants who required information
related to pest management were less than those who did not. Furthermore, the number of
participants in both groups was equal in the group of participants who earned 8,001 to

102
10,000 baht monthly. The number of participants who required the information was larger
than the other group if their income was 10,001 baht or more a month. It seems that the
higher the income they earned, the more likely they were to pay attention to obtaining pest
management information.
Figure 23. A percentage of participants who required and did not require pest management information in each income group.
Moreover, income related to a shortcoming of the service, like unfamiliarity with use of
technology tool, as shown in Figure 24. Comparison of each income group, between
participants who had this problem and those who did not, the higher income they earned,
the lower the percentage of participants finding it difficult to use ICT tools. Additionally,
all participants who found this to be an obstacle earned less than 8,000 baht a month.
The relationship between the types of agricultural information requested by the farmers and
frequency for receiving information also showed in the cross tabulation analysis (Pearson
Chi-square, p < 0.01). Among participants receiving information about the use of fertilizer,
34.9% preferred to obtain the information weekly, and 23.3% wanted to obtain it twice a
week. However, nearly a half of participants requesting information related to soil
improvement (45.0%) preferred to receive information daily, followed by weekly (37.5%).
37.5
8.3
24.0
50.0
70.0
100.0
0
20
40
60
80
100
120
< 3K 3K-5K 5K-8K 8K-10K 10K-20K > 20K
Th
e P
erc
en
tag
e o
f P
art
icip
an
ts (
%)
Income (Baht)
Required

103
Participants, who received information related to organic farming, were happy to receive
the information fortnightly (30.3%) whereas receiving the information twice a week,
weekly and monthly was requested equally (21.2%), as depicted in Figure 25.
Figure 24. Comparison between participants who found unfamiliar ICT tools to be a problem and those who did not.
Furthermore, more than 90% of participants receiving information regarding soil
improvement allocated the highest score for the benefit of convenience from the
experimental service. Nevertheless, other participant groups, who received information,
either about the use of fertilizer or organic farming, allocated the same score at 60.5% and
63.6%, respectively.
62.5
75.0
92.0
100.0 100.0 100.0
0
20
40
60
80
100
120
< 3K 3K-5K 5K-8K 8K-10K 10K-20K > 20K
Th
e P
erc
en
tag
e o
f P
art
icip
an
ts (
%)
Income (Baht)
Familiar

104
Figure 25. The percentage of participant preference to receive further information categorised by information type they previously obtained.
In addition to the topic of convenience, the ease of use was also highly mentioned by the
participants receiving information concerning soil improvement. 90% of these participants
allocated the five-out-of-five score for ease of use while only 60.5% and 78.8% of
participants receiving information regarding the use of fertilizer and organic farming,
respectively, allocated the same score.
Similarly, a majority of participants receiving the soil improvement information (92.5%)
allocated the highest score for the benefit of free service, whereas participants who received
information about the use of fertilizer or organic farming topics, allocated the same score at
67.4% and 63.6%, respectively.
The previous pattern also showed in the topic of the knowledge enhancement the
participants gained from the experiment. Most participants who received information about
soil improvement (92.5%) strongly agreed on this benefit; however a smaller number of
participants from the other two groups strongly agreed at that they had benefited. In detail,
0.0
14.0
23.3
34.9
11.6
16.3
5.0
45.0
5.0
37.5
5.0
2.5
0
6.1
21.2 21.2
30.3
21.2
0
5
10
15
20
25
30
35
40
45
50
twice-a-day daily twice-a-week weekly fortnightly monthly
Th
e P
erc
en
tag
e o
f P
art
icip
an
ts (
%)
Frequency of Information Receiving
use of fertilizer
soil development
organic farming
105
62.8% from the use of fertilizer group and 63.6% from their organic farming group
mentioned the strong agreement that their knowledge had been enhanced.
The benefit of technology practice was strongly supported by most participants who
received information related to soil improvement (80.0%). Additionally, about a half of the
participants receiving information about fertilizers (53.5%) used strongly agreed when
questioned about this issue. Furthermore, less than a half of farmers gaining information
concerning organic information (42.4%) allocated the same level of agreement.
Information timeliness and information format were other two aspects that a majority of
farmers, who received information in relation to soil improvement (87.5%), rated the
highest score for both aspects. In accordance with results from other aspects, the percentage
of participants obtaining information about the use of fertilizer and organic farming who
strongly agreed on these two aspects (58.1%) were much fewer than the soil improvement
group.
From the pattern of results, it may be assumed that farmers receiving the soil improvement
information were more satisfied with the experimental service than the other two groups.
However, it was previously found that the higher income participants were more likely to
allocate higher score in each aspect than the lower income groups. In addition, the
participants earning higher income were more likely to request soil improvement
information. It may be assumed that the results from participants receiving the soil
improvement information were similar to the rich participants because a majority were in
the higher income groups.
A relationship between each information group and a further information request for pest
management was also found in this survey (Pearson Chi-square, p < 0.01). Only one third
of farmers receiving the use of fertilizer information (32.6%) indicated that they might need
the pest management information while a majority of farmers in the soil improvement
group (67.5%) mentioned that they might need it. However, most participants who received
information about organic farming (81.8%) declined the offer of the pest management
information when a further experiment was discussed. It may be assumed that farmers in

106
the organic farming group believed they had already learned enough about pest
management in their own field; therefore, they would not need this kind of information to
any extent.
Moreover, information related to the use of insecticide was not greatly needed by any of the
farmer groups (Pearson Chi-square, p < 0.01). Even though one third of the participants
receiving information about soil improvement (32.5%) stated that they might need
information in relation to the use of insecticides, farmers obtaining information about the
use of fertilizer and organic farming hardly felt they needed the insecticide information, at
9.3% and 3.0%, respectively.
However, among participants who might cancel the information service because of
unfamiliarity with the technology, about two thirds of them (63.6%) were in the use of
fertilizer group and the rest (36.4%) were in the organic farming group. No one in the soil
improvement group mentioned that possibility. Additionally, it cannot be forgotten that a
majority of participants receiving the soil improvement information were in the high
income groups and these groups did not report any unfamiliarity with the tools used in the
experimental service.
Changes in the frequency of information delivery requested by participants also related to
the benefits of the experimental service. All participants who requested further information
twice a day rated the service at the highest score in every aspect; namely, convenience, ease
of use, free-of-charge service, knowledge enhancement, technology practice, information
timeliness and information format. Additionally, among farmers who indicated they
preferred to receive information daily, twice a week, weekly or fortnightly, a majority of
each group also rated the service highly with a score five out of five. However, the majority
of farmers who requested information monthly allocated the score four out of five for every
aspect. This result may reflect their satisfaction toward the service. This group of
participants preferred to receive information monthly which was the least often frequency
offered. Although they were not extremely satisfied with the service, they were not
dissatisfied.
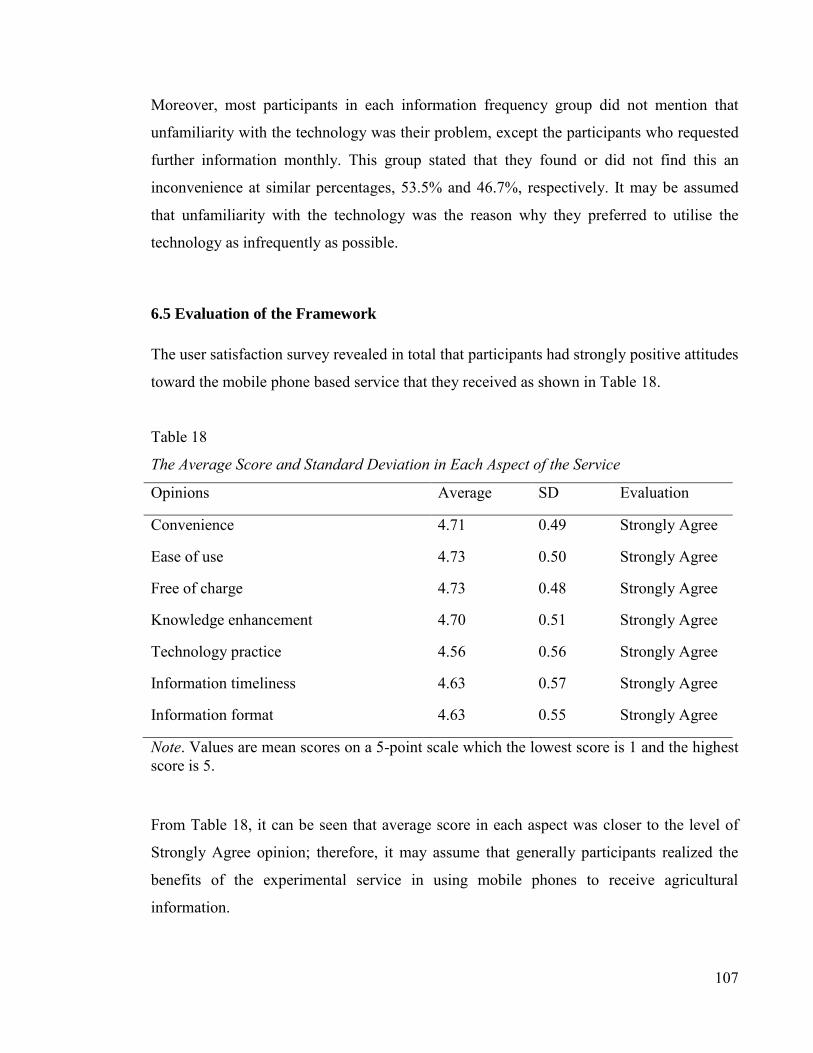
107
Moreover, most participants in each information frequency group did not mention that
unfamiliarity with the technology was their problem, except the participants who requested
further information monthly. This group stated that they found or did not find this an
inconvenience at similar percentages, 53.5% and 46.7%, respectively. It may be assumed
that unfamiliarity with the technology was the reason why they preferred to utilise the
technology as infrequently as possible.
6.5 Evaluation of the Framework
The user satisfaction survey revealed in total that participants had strongly positive attitudes
toward the mobile phone based service that they received as shown in Table 18.
Table 18
The Average Score and Standard Deviation in Each Aspect of the Service
Opinions Average SD Evaluation
Convenience 4.71 0.49 Strongly Agree
Ease of use 4.73 0.50 Strongly Agree
Free of charge 4.73 0.48 Strongly Agree
Knowledge enhancement 4.70 0.51 Strongly Agree
Technology practice 4.56 0.56 Strongly Agree
Information timeliness 4.63 0.57 Strongly Agree
Information format 4.63 0.55 Strongly Agree
Note. Values are mean scores on a 5-point scale which the lowest score is 1 and the highest score is 5.
From Table 18, it can be seen that average score in each aspect was closer to the level of
Strongly Agree opinion; therefore, it may assume that generally participants realized the
benefits of the experimental service in using mobile phones to receive agricultural
information.

108
In addition, after the experiment the participants were asked how often they preferred to
receive information in the next experiment. It was found that a majority of them (65.5%)
required the information delivery more often or as often as the current frequency they got in
the recently finished experiment. This may be another indicator that participants were
satisfied by the information dissemination service through SMS on mobile phones.
However, in terms of displeasure against the service only a small percentage of participants
expressed that they did not appreciate some issues of the service as shown in Table 19.
Table 19
The Total Percentage of Participants Against the Service Shortcomings
Shortcomings Mentioned Not mentioned
Unfamiliarity of the ICT tool used 9.5% 90.5%
Too small text size shown on mobile phone 12.9% 87.1%
Cause of annoyance 0.0% 100%
Unrelated or unpractical information 1.7% 98.3%
It can be seen from Table 19 that a majority of total participants did not encounter any
hindrance in using mobile phones to receive agricultural information; especially no
participants felt this service annoying.
The lack of experience in using SMS feature may be a cause of feeling unfamiliarity in
using this provided service. This experiment was the first time that these farmers directly
obtained agricultural information via their own mobile phones. Although the SMS is a
common kind of available feature on mobile phones, it is understandable that most farmers
only used mobile phones for calling service.
Particularly, all farmers who mentioned the information irrelevance were in the group of
fertilizer-related information receiver. Therefore, the dissatisfaction might depend on the
content itself, not on the service provided.

109
In summary, it can claim that generally the targeting participants were satisfied with this
experiment. Also in regard to agricultural knowledge enhancement, these participants rated
4.7 out of 5 which was very high. Therefore, it may conclude that this kind of service was
effective in the target participants‟ view.
6.6 Summary of the Implementation
During the experiment three types of agricultural information namely use of fertilizer,
organic farming and soil improvement were provided to the participants. Then after the
experiment these participants were asked in future if they would like to continue on this
service, what kinds of information they preferred. It appeared that information regarding
the produce market price (44.8%) was at the top rank closely followed by pest management
topic (40.5%). However, other alternatives such as financial management (22.4%), the use
of insecticide (15.5%) and weather forecast (5.2%) were still at the bottom.
In summary, it may conclude that use of fertilizer, organic farming and soil improvement
agricultural information topics were in the highest demand among Thai farmers in the study
areas. Beside these topics, market price and pest management information was also
desirable. However, the importance of information related to financial management, the use
of insecticide and weather forecast was not essentially perceived in the participants‟ point
of view.
However, the user satisfaction survey after the experiment in Section 6.4.6 revealed
relationships among variables as illustrated in Figure 26. It was found that income and
information topics affected many variables such as gender, further information request,
preferred frequency of information and opinions toward the service. In addition to the
preliminary results in Section 5.3.7, it is confirmed that participants‟ income related to their
education and technology familiarity.

110
Figure 26. Relationship diagram between variables in the user satisfaction survey.
However, due to the fact that a majority of some variables were also a majority of another
variable, some unreasonable relationships may be unable to be neglected. A relationship
between types of information received and technology familiarity was an example. It may
be illogical if this relationship was tried to get a reason to support why participants who
received a particular type of information were more familiar with the ICT tools used than
participants who received other types of information.
According to the user satisfaction results, a majority of high income participants chose the
option of the soil improvement information. Also, a majority of high income participants
had fewer difficulties in using the ICT tools to receive the agricultural information
provided. It may be concluded that in fact the relationship between the information topics
and the technology familiarity was a derivative outcome. In regard to the relationships
among income, information received and further information request, the relationship
between information received and further information request were more reasonable than
one between income and further information request. Accordingly, if these presumed
relationships are removed from the relationship diagram in Figure 26, the outcome will be
the diagram depicted in Figure 27.
income
Information topics
Further information
Technology familiarity frequency Opinions toward
the service
gender education

111
Figure 27. Presumed relationship diagram between variables in the user satisfaction survey.
6.7 Results of Group Interview
After the experimental information delivery service concluded, a user satisfaction survey
was conducted for all the participants. Then group interviews were separately held in both
villages in order to find out their further needs for ICT services to support their agricultural
practices. Their satisfaction with the finished information dissemination service was
evaluated and a few examples of ICT services in which they might be interested were
proposed and discussed.
Participants from the Muang District were asked to engage in a group interview at their
agricultural learning centre at an assigned time and date. However, only eight of them,
together with their village chairperson and an agricultural extension worker responsible for
their area, came to the centre and joined the interview; as a result ten interviewees took part
in this group interview. The interview took approximately one hour, and continued until
there were no new ideas or comments emerging.
income
Information topics
Further information
Technology familiarity frequency Opinions toward
the service
gender education

112
Then, a group interview with participants from the Soongmen District was arranged at their
village chairperson‟s place at an assigned time and date. Seven of these participants,
including the village chairperson himself, attended this group interview. The interview
went through a similar process to the previous interview with participants from the Muang
District. The interview took about one hour to accomplish, although there were fewer
interviewees than the previous interview. Comments critical of their extension worker were
added to the interview freely without any prompting from the interviewer. This was perhaps
another reason why interviews in both villages took a similar period of time, although
fewer Soongmen district residents attended.
In these interviews, four projects involving the use of mobile phones and the Internet were
proposed to the participants to obtain their opinions. Those four ICT projects were:
1) Using camera-built-in mobile phones to take pictures of plant diseases and
insects that damage their crops then send them to extension workers to find
solutions
2) Making free phone calls to a particular number to listen to recorded agricultural
information related to their interest
3) Registering their phone number in order to receive scheduled alerts via SMS to
do activities in their fields, such as spreading a specific fertilizer at a particular
time, spraying organic insecticide in a particular week and harvesting at
different times to avoid over-supplying the market
4) Using free internet access to search for additional agricultural information or to
find solutions for cropping problems
The interviews with participants from these two villages revealed similarities and
differences of farmers‟ opinions in many aspects.
6.7.1 Similar opinions between Muang and Soongmen district
Responses from participants in the Muang district were similar to those from the Soongmen
district in the projects related to free calls for information, and SMS alert service. In
113
addition, they agreed on the use of SMS for information delivery, the assistance from their
descendants, and the concern of using mobile phones as an expensive product.
Among mobile phone services, phone calls and SMS were the methods with which they
were the most familiar and most confident. Some participants agreed that sometimes they
might ask their children to help them to use mobile phone services, such as reading SMS
contents. Some participants were worried about losing their mobile phones or damaging the
phones when they went into their fields, therefore they would leave the phone at home; then
check missed calls after work. They were not worried about losing a connection during the
day because they usually used the land line phone to make a contact with their friends and
family. Additionally, there were not many calls they might get during the day. Moreover,
some households used mobile phones as landline phones. The phones belonged to
everyone in the house; therefore the housewife or any people at home were willing to
answer the phone. As a result, the participants felt comfortable leaving mobile phones at
home during field work.
Receiving agricultural activity alerts via SMS was not fully accepted by participants from
either village. Although they all agreed that this service might be a good method to assist
them to get higher and better yields; they were not sure that this service would be
successful. During rice production there might be many factors affecting their procedures,
such as drought, plant diseases and insects. Furthermore, they asked about insurance in case
their experimental yields were lower than the usual amount or less than their friend‟s
products which were grown according to a typical traditional procedure.
With one aspect of making free phone calls to obtain new knowledge, participants from
both villages expressed their agreement. They were not sure whether such a service would
always be free of charge. Their income was not high enough to afford something they did
not think was really necessary. One participant claimed that if their phone credit ran out
quickly, no matter what the cause, this service would be the first cause they thought about.
It would be safer for them not to use this service in the first place. Moreover, a few
participants added that this service was not an activity they were used to in their daily lives.
114
Therefore, it would be easy to neglect it after they made a few phone calls in the early
stages of the experiment.
However, participants in each village differently expressed their views in some aspects
such as the project of sending pictures of their problems via mobile phones to acquire the
advice from experts, and the project of free ICT tools practice.
6.7.2 Different opinions between Muang and Soongmen districts
In relation to taking pictures then sending them to extension workers to solve the problem,
the Muang district residents mentioned that this service would be of no use for them,
because their extension worker lived in the same area and they had a great relationship with
her. It would be much more convenient and quicker to call the extension worker to the field
or take samples of plant disease to her office to find the solution.
Conversely, the Soongmen district residents agreed that this concept was an interesting
idea, because their extension worker lived in another area and they did not have a good
relationship with her. A Soongmen district resident mentioned that he had not met the
current extension worker and he did not know that person. With this type of service, they
did not have to wait for the extension worker to visit their fields and they would not have to
care who the current extension worker was.
The interview results also reflected the preliminary survey findings that the Muang farmers
rated extension workers as agricultural information providers at the top rank which was
comparable to the findings in Opara (2008) and Ekoja (2004). In contrast, extension
workers occupied the third rank (46.2%) in the point of view of the Soongmen participants.
Additionally, this circumstance among the Soongmen farmers was in conformity with
Elizabeth and Zira‟s (2009) results in which their participants were aware of the existence
and usefulness of the extension worker but, due to the infrequent visits of extension

115
workers, the participants turned to rely on their neighbours for agricultural information
instead.
This contradiction may show that the relationship between farmers and extension workers
may affect aspiration to learn new technology tools and practice in some way. However, in
terms of the benefit farmers gained, strong relationships between farmers and extension
workers will establish more advantages in the long term.
Different opinions about training and using computers and the Internet to obtain new
agricultural knowledge were revealed by participants in each village. Muang participants
were glad if they might have access to the Internet because many agricultural support
projects, run by the government, were also announced on the Internet. If they could access
the Internet, they would be up to date with agricultural news and announcements.
Additionally, in some projects the farmers needed to register online. At present, they had to
visit a local government office to do this. This wasted a lot of time and if they did not
register in time, it meant they missed valuable opportunities. Having access to the Internet
would be a good chance for them to step up their agricultural business. As far as training
was concerned, they felt comfortable in encouraging their extension worker to undertake an
official training. Then, the extension worker would work everything out for them. It seemed
that their actual requirement was to have access to the Internet, so that it could be used
among them and their extension worker, as long as proper training for their extension
worker was included.
On the contrary, even though free Internet training was offered to prepare Soongmen
farmers for using the Internet for their own agricultural advantages, they were reluctant to
accept such an offer. Some participants gave reasons that they were too old to learn new
technology tools; computers and the Internet in their concept were complicated and
sophisticated. Some of them mentioned that even if they were given the training, they might
not use it in daily life.

116
In terms of enthusiasm about knowledge enhancement, the Muang district residents seemed
to be happier to obtain more information in other topics or continually receive the same
service. Nevertheless, the Soongmen district residents stated that it would be good to have
this service but they would not feel lost if they could not have it.
6.7.3 Recommendations from farmers Additionally, the famers in Muang district provided comments on the project of SMS alert
service and a way to improve the effectiveness of the use of ICT tools for agricultural
practices. The farmers preferred their extension worker to get technical and information
support then relay the communications to them face-to-face. They thought that this way
would be more effective than directly teaching them to use technology tools. This
suggestion was based on the fact that Muang farmers had a strong relationship with their
extension worker.
In relation to the scheduled alert service, they recommended that at first there would be an
experimental field to show that following the service recommendations would be more
successful. Then it would be more reliable for them to follow the service.
It can be seen from the interviews with the farmers in both villages that even they were
impoverished and low-educated; they were enthusiastic to learn new ICT practices to
improve their livelihood and agricultural practices. The farmers did not fully accept all
technologies offered even though they realized the advantages of the ICT tools and
practice. They considered the feasibility and the appropriateness of the technologies in
actual practices. Therefore, their requirements were necessary to be regularly fed into the
system to maintain the effectiveness. However, it was found that relationships between
agricultural extension workers and the farmers may affect the ways they learned new
technologies.

117
CHAPTER 7 NEW PROPOSED FRAMEWORK
7.1 A New Framework for a Wider Scale
According to the action research model, which is a continuous and iterative process in
conjunction with the system framework in the experiment, it is necessary for all the
feedback from end users, the farmers targeted in this case, should be incorporated in the
system in order to improve its effectiveness. Also feedback from participants, discussed in
section 6.4 and 6.7, revealed that the majority of participants would like this service to
continue. However, other types of information, including up-to-date agricultural news and
technology practice, should be provided to these farmers. The high competitiveness in
mobile phone markets, which will lead to better features but lower prices for mobile
phones, should be considered. The new information topics would usually be delivered
frequently during every cultivation period, while the period of technology change would be
more flexible and depend on users‟ requests and readiness. The consideration toward the
separate module between information update and application modification was made.
Figure 28 on page 118 shows how the previously implemented, could be adapted for a
longer-run system.
It can be seen that the proposed framework is a circulated flow, starting from the
information dissemination system containing an agricultural information repository which
delivers information in the user-requested formats, such as a typical SMS or short video
clips. Then user satisfaction should be periodically evaluated to improve the system. User
requests for information should be passed to the information administrator who is
responsible for managing all the content in the agricultural information repository,
including the dissemination schedules and lists. In the meantime, other farmer feedback
related to technical manipulation of the system should be forwarded to the applications
developer who deals with all system modifications. After all related components within the
system were updated, the changed system will continue to and a new phase begins.

118
Although mobile technology may change, this framework concept will remain valid as long
as the technology is based on mobile phone services.
Figure 28. A framework of information dissemination via mobile phone, proposed for wider scale operation.
This framework could be implemented and maintained under the supervision of
government agricultural bodies, such as the Department of Agricultural Extension or the
Ministry of Agriculture, or run by academic institutes, such as agricultural colleges or
departments of agriculture in universities, which are sources of accurate and credible
agricultural information.
However, in practice due to limited memory in low-end mobile phones, farmers may not
receive new incoming messages if their inbox is full. This difficulty could be avoided by
Information administrator
Farmer recipients
Hosting mobile phone
Information dissemination system
Agricultural information repository
Satisfaction evaluation
further requested information
Application developer
System update
content update
further requested features
feedback
Agricultural content
SMS/ video clip

119
providing the farmers a session of usage training. Also, in case the farmers accidentally
delete received messages, they may ask their extension workers for re-sending those
messages. This option is readily available due to the program and database design.
7.2 Comparisons with Other Frameworks
When compared to other agricultural information dissemination frameworks, this
framework shows both similarities and differences.
A well-known agricultural information dissemination system, AgrIDS, developed by
Krishna Reddy and Ankaiah (2005) mainly focused on bringing field situations to the
experts in order to solve problems more effectively. With help from the coordinators,
current field issues were sent through ICT tools and networks to agricultural experts, then,
with support from an agricultural information system, the expert sent suggestions back to
the farmers. It reduced both travelling costs and time for agricultural experts to visit each
farm to solve a variety of problems. This framework can be used to advise farmers with
direct answers suited to each circumstance; however, it is needed to resolve problems on a
case-by-case basis.
The proposed framework aims at providing agricultural information to farmers on a large
scale, which would lead to knowledge enhancement in the longer term. Also Thai farming
participants are familiar with the use of mobile phones, as can be seen from the high
percentage of mobile phone owners. As a result, coordinators to assist in sending and
receiving information would be unnecessary in this proposed framework.
In addition, another agricultural SMS system (Zhang et.al, 2007) essentially emphasized
techniques to deliver SMS effectively and efficiently by employing a real-time controller
polling module to handle requests and message traffic. However, this framework was not
designed to support the entire knowledge enhancement process. No provision for
continuous development was mentioned in this framework.

120
However, this study‟s proposed framework has been designed for further development by
taking feedback from real users to improve the quality of system to meet farmers‟
requirements. This improvement process will be able to operate continuously.
The Armstrong, Diepeveen and Tantisantisom‟s (2010) Farmer Knowledge Decision
Support Framework (FKDSF) described procedures which farmers actually used when they
required relevant information to solve their problems or to improve their products. This
framework drew a whole picture of problem solving methods used by farmers. It included
other ICT tools and techniques to provide farmers with information to further make
decisions.
Nevertheless, this newly proposed framework aimed at offering the necessary information
to aggregate farmers‟ agricultural knowledge, rather than solving all the problems farmers
might have encountered. Furthermore, the FKDSF was designed for an Australian farming
context. It can be assumed that farmers in a developed country had more opportunities and
were able to use computers and the Internet more often and more successfully than farmers
in developing countries such as Thailand. Therefore, employing other ICT methods such as
online searching, decision support systems and data mining may not be suitable for Thai
farmers at present.
An attempt to provide current market prices directly from various local markets to farmers
was employed in Kenya (Mukhebi et. al, 2007). The farm produce prices were collected
then disseminated to registered farmers. This project was successful; the success
determined from higher produce selling prices than traditional selling procedures.
Nonetheless, besides higher income which farmers earned and the ICT skills they gained
from the use of mobile phones to receive market information, other agricultural knowledge
was not included in this project.
On the other hand, the framework proposed in this study emphasizes improving farmers‟
agricultural knowledge, which will consequently upgrade farming products‟ quality and

121
quantity. This concept will not only benefit the whole agricultural system in the long term
but also support life-long learning activities.
An agricultural decision support system is another concept implemented to deliver
agricultural information and advice to farmers (Ahmad & Sarwar, 2008). Farmers‟ queries
through mobile phones were passed to the decision support system to create suggestions
based on an agricultural information system, then the suggestions were returned to the
farmers via the same channel. Nevertheless, according to Gandhi, Mittal and Tripathi
(2009), farmers in their study necessarily needed back-and-forth conversations in person
regarding personalized solutions.
Although the framework proposed in this study is not designed for personal interactions
between farmers and extension workers, farmers‟ opinions and requests including
feedbacks are gathered at the end of each system cycle. This concept is able to improve the
framework continuously to meet farmers‟ requirements.
122
CHAPTER 8 ASSESSMENT OF THE NEW FRAMEWORK
The new framework developed in the previous chapter also needed to be evaluated for
validity before it could be implemented in practice. Authorities working in real situations,
such as the agricultural extension workers responsible for the areas studied obviously were
the appropriate framework critics. Farmers, as end users, were not included in this
interview because they had formerly provided feedback in the user satisfaction survey,
which reported that most participants were strongly satisfied with the experiment. This
improved framework was a further development of the previous framework. It may be
assumed that the farmers would not offer immensely different opinions of the new
framework. Additionally, this evaluation emphasized the continuous implementation in a
wider scale, in actual circumstances.
The adjusted framework was proposed and explained to the agricultural extension workers
responsible for each village. Both agricultural extension workers also had been observers in
the SMS experiment mentioned in Chapter 6. Then they provided feedback and comments
toward the framework. The interviews were conducted separately and took approximately
30 minutes, for explaining the framework concept and receiving their feedback. The two
agricultural extension workers also expressed their opinions and concerns including
recommendations related to the practical implementation.
The interview results which were gathered from the two agricultural extension workers
revealed that some commonality occurred in their opinions of the proposed new
framework. Similarities and differences of interview results from both agricultural
extension workers were addressed as presented in Table 20 on page 123.

123
Table 20
Similarities and Differences Between Agricultural Extension Workers’ Opinions
Similarities Differences
Feasibility Role as the information administrator
Instant delivery channel Additional requests during the cycle
Multitude receivers
Repeated review
Separate task responsibilities
Outsourcing for the application program
Financial supports
Collaboration with mobile service providers
Collaboration with local councils
Mobile phone coverage
ICT adaptation due to poverty and illiteracy
In addition to similarities and differences of the agricultural extension workers, their
agreements on benefits and concerns were summarised in Table 21.
Table 21
Agreements on Benefits and Concerns Between Agricultural Extension Workers
Benefits Concerns
Instant delivery channel Financial supports
Multitude receivers Mobile phone coverage
Repeated review ICT adaptation due to poverty and illiteracy
In terms of feasibility, viability and appropriateness, both agricultural extension workers
agreed on workflow and information flow of the framework. For example, both believed
that this framework would be workable in a field situation. The Soongmen agricultural
extension worker affirmed the proposed framework would be a tool to deliver news and
agricultural information to farmers without the need for the extension worker to travel to
the village. Also, they suggested that it could be an alternative communication channel

124
which could deliver information to farmers who may need multiple reassurances about
novel agricultural technology information and practices. In addition, they suggested that it
would assure that every registered farmer will receive news and emergency
announcements, such locust outbreaks. Furthermore, this framework would be able to
disseminate a number of messages at the same time; therefore, there will not be a problem
of delayed information dissemination which may cause loss of opportunity those farmers.
The Muang agricultural extension worker also gave an example:
Once a farmer registration project launched by the government was announced, she had only a few weeks left to make sure that all farmers registered because she had to wait for all other information from the Ministry. In that case, it would be more effective and less stressful for her if she could immediately send information to farmers then confirmed with them afterward. At least, she would know that all farmers got the news. (The Muang agricultural extension worker, personal communication, December 16, 2010)
Additionally, with this proposed model farmers may have the chance to review the text
messages, or even video clips, several times to reinforce their understanding. Memory of
workshops or demonstrations by agricultural extension workers may fade out in the future.
The Soongmen agricultural extension worker said that:
This is a good approach because I do not have to repeatedly explain the same knowledge or information. Particularly, if information or announcements contain numbers, date and time, it can be sure that all farmers have the same information and can recheck the information by themselves. No need to keep asking the agricultural extension workers the same question. (The Soongmen agricultural extension worker, personal communication, December 20, 2010)
Moreover, the Muang agricultural extension worker also supported the concept that
information update and technological update were separated. Different job descriptions and
personnel were needed because, in her point of view, the agricultural extension workers are
experts in agricultural information but may be less able in technological matters.
Consequently, it is more acceptable that the agricultural extension workers play a role as
information administrators only and the technological matters are passed to an information
and technology, or computer department in the office. On the other hand, the agricultural
extension worker from Soongmen District stated that, in practice, at least two recruits

125
should be added to the current office to maintain the service system. One would be needed
for updating information and the other one for updating or resolving technological issues.
She disagreed with the idea of assigning the information administrator‟s tasks to current
agricultural extension workers, due to the fact that they are already overburdened.
However, both agricultural extension workers accepted that an option of outsourcing for
updating and modifying the technological implementation could be considered if this model
was actually implemented by the agricultural extension bodies.
One of the main concerns toward the actual implementation of the proposed framework is
related to the size of budget they receive from the government. The Muang agricultural
extension worker was concerned to learn if SMS would be the main channel used to
disseminate agricultural information, including news, to farmers. To employ this service,
not only the cost of computer servers would be required, but also the cost of SMS delivery
would have to be taken into account. It would cost a large amount of money to pay for this
service, especially if the messages were needed to be disseminated daily. In detail, as there
are 84,449 farmers living in Phrae and approximately 56.8% of Thai residents owned a
mobile phone, it may be calculated that 47,967 messages should be delivered to Phrae
farmers daily (ICG, Provincial Office, 2010; NSO, 2010a). Working in a government
agency, she could not be sure that the budget would be readily approved.
Moreover, this concern echoed by an issue regarding financial support from the
government body which was raised by the Soongmen agricultural extension worker. During
the conduct of the experiment, there was a special promotion for text messaging with 199
baht for 500 messages. The cost was approximately 3 Australian cents for a message, as at
the 6th of April, 2010. She pointed out that, if this promotion had finished and no equal or
better promotion was launched, the expense would be uncontrollable. The Soongmen
agricultural extension worker further explained that:
Each financial year, she had to propose projects and budget to work or continue on the next financial year. If the budget was underestimated, she would not have enough money to run the project throughout the year. On the other hand, if the budget was

126
overestimated, the project might not be approved or it would be her fault for miscalculation. (The Soongmen agricultural extension worker, personal communication, December 20, 2010)
Nevertheless, as employees of a government body, both agricultural extension workers
agreed that it might be possible to obtain collaboration with one of many mobile phone
service providers to support such a project.
In addition, the need to work in collaboration with village chairpersons or local councils to
acquire further requirements and feedback from farmers at the end of each cultivation cycle
was accepted by both agricultural extension workers. However, another issue that
concerned the Muang agricultural extension worker related to the cycle completion. Due to
her close relationship with the farmers, they might ask her for other types of agricultural
information or technology advice they needed at the middle of the cycle. A cultivation
period took approximately three months until harvesting. A month after the beginning of
the cultivation, the farmers might request agricultural information related to fertilizers or
pest management, as they currently faced those problems. She would supply the
information but she could not tell them to wait until the end of cycle to provide feedback
afterward. This possible disruption of the cycle was not mentioned by the Soongmen
agricultural extension worker.
Furthermore, mobile phone coverage was another concern from the extension workers. In
the experiment areas there was no problem regarding mobile phone signals, but Phrae
Province includes numerous hills and mountains. Therefore, farmers living in those areas
may not receive these messages at the time they were sent because of signal blind spots.
Additionally, the Soongmen agricultural extension worker suggested that the system should
report any transmission failure to the administrators to decide which action should be taken
or whether to keep sending failure messages until the transmission was completed.
Another issue was related to technology adoption among farmers. Both extension workers
noticed that a majority of farmers were elderly and lacked ICT skills and confidence in. An

127
attempt to apply this technology framework may take a significant period of time and effort
to achieve practical outcomes. The Muang agricultural extension worker stated that:
Most farmers are poor and afraid of damaging technology tools because they have a limitation in affordability. Therefore, encouraging them to use these tools will take a while. When they get used to the tools or see a benefit from using them from other people, it will be easier to encourage followers to do the same thing. (The Muang agricultural extension worker, personal communication, December 16, 2010)
Also they realized that most farmers were illiterate, consequently reading short messages
may not help them fully understand all the content. Although video clips may compensate
for this hindrance, it takes much effort, time and expense to create them. Additionally,
disseminating video clips may be possible only for the limited group whose mobile phones
support this feature.
In addition, the agricultural extension worker from the Soongmen District recommended
that in the future it would be a great benefit if the system was able to gather all delivered
messages and then convert them for conclusion in a knowledge repository which was ready
to be used for multiple purposes.
In summary, findings from the interviews with the agricultural extension workers from
Muang and Soongmen District revealed that they agreed on the possibility and usefulness
of this framework. In practice, however, it may need some contributions from third parties
in the form of time, knowledge and funds. These supports may come from village
chairpersons, local councils, mobile service providers, universities or academic sectors, and
the Department of Agricultural Extension itself.

128
CHAPTER 9 DISCUSSION
9.1 Introduction
Results from the initial requirements survey in Section 5.3, from the user satisfaction
survey in Section 6.4, together with results from farmer group interviews in Section 6.7 and
extension worker interviews in Chapter 8 were analysed to extract findings.
9.2 General Discussion
Overall results from previous chapters were compared in many aspects such as a
relationship between involvement and gender, age groups and income groups.
9.2.1 Participation between gender groups The gender of participants was one determining factor of willingness to participate in the
experiment. There were proportional representations of males and females who participated
in the requirement survey in both villages. In Section 5.3.1, the Muang District group
consisted of 54.8% of males and 45.2% of females; together with 57% of males and 43% of
females in the Soongmen District. A contrast was found in the user satisfaction results in
Section 6.4.1; participants from the Muang District who joined the experiment were
composed of 84.2% males and 15.8% females. 59.3% males and 40.7% females from the
Soongmen District joined the experiment. The results from the Muang District may support
a finding that females enjoyed less access ICT tools than males as reported by Saghir,
Ashfaq & Noreen (2009). On the other hand, the percentages of male and female
participants in the Soongmen District did not show significant differences. The reason for
this difference between the two villages should be further investigated.
Although gender may be a factor affecting the adaptation of ICT usage among these Thai
farmers, the proportion of males and females participating in the experiment was still
129
considered reasonable. The situations may be much more difficult in some countries where
females are not allowed to join community activities (IICD, 2006; Sheriff, 2009 for
example).
9.2.2 Participation among age groups
Also initial age was taken into account for the volunteers‟ involvement in the experiment.
The initial requirements survey, taking both villages together, revealed that participants
aged 41 years or above accounted for 85.9%, as indicated in Section 5.3.1. It additionally
showed that younger generations were more likely to use ICT tools as channels to receive
agricultural information than older generations. Results from the user satisfaction survey
showed a contrary outcome, that 98.3% of participants joining the experiment in using
mobile phones as a tool for receiving information were at least 41 years old, as mentioned
in Section 6.4.1. This finding regarding older participants indicated that they were more
likely to be self information providers for the family. It may be assumed that a number of
the older participants took part in this experiment because they saw another opportunity to
provide agricultural information to their own family, as they usually did.
9.2.3 Participation among levels of education
Educational levels of participants joining the experiment on the SMS service also
contradicted the results from the requirement survey in Section 5.3.1 that participants with
higher educational levels were more likely to use ICT tools. From the requirement survey,
67.6% of the participants finished primary school, together with another 22% who finished
secondary school. Compared to the results from the user satisfaction survey in Section
6.4.1, 76.7% of the participants had a primary school educational background, while
another 19.8% finished secondary school. It can be seen that in typical situations more
highly educated farmers were more likely to employ ICT tools to obtain agricultural
information than less educated farmers. This result was in accordance with Warren‟s (2004)
finding that levels of education among farmers were another factor relating to the adoption

130
of ICT tools. Contrary to set-up circumstances which freely provide opportunities to learn
ICT tools, it may be assumed that educational backgrounds of participants may not hinder
their willingness to learn how to use new technology tools for agricultural improvement
among Thai farmers.
9.2.4 Time preference to receive agricultural information
According to the time preference for receiving the information from the requirement results
in Section 5.3.4, it was found that most participants preferred to receive information
through mobile phones either in the early morning from 6 to 9 o‟clock (46.8%) or in the
evening from six to 10 o‟clock (22.7%). This result was in accordance with farmer group
interviews in Section 6.7 that they might leave the mobile phones at home when they were
working on fields. Even though they possessed mobile phones; some of them might use the
mobile phones as portable landline phones. Although the reasons were not directly
expressed, it may be assumed from their low income levels that they might have to share
mobile phones with the other family members and that lost or damaged mobile phones may
cause inconvenience for the whole family.
9.2.5 Satisfaction with the experiment between two districts
Also results from the experimental survey in Section 6.4.3 may conclude that the Muang
participants were more satisfied with the experimental service than the Soongmen
participants. It can be seen from the opinions of the service that on average the Muang
participants gave higher scores than the Soongmen participants for every aspect; namely,
convenience, ease of use, free of charge, knowledge enhancement, technology practice,
information timeliness and information format. In addition, about 80.8% of the Muang
participants requested information from the service more often than, or at least as much as
was delivered by the experiment, whereas only 50.8% of Soongmen participants did.

131
These results were in line with the farmer group interviews in Section 6.7; the Muang
interviewees seemed more enthusiastic about receiving agricultural information via
technology tools than the Soongmen interviewees did. In detail, the Muang participants
were pleased to continue with the service while the Soongmen interviewees did not feel that
they would lose benefits if it ceased. It can be assumed from these results that the Muang
participants were on average richer than the Soongmen participants, and the higher income
participants were more likely to be more satisfied with the experiment than those with
lower incomes.
9.2.6 Agricultural information requirements between two districts
In terms of further information requirements in Section 6.4.4, both villages showed diverse
requests for further agricultural information. Approximately 70.2% of participants from the
Muang District requested information related to pest management and 29.8% of the Muang
participants requested information on how to use insecticide. These two types of
information were significantly rarely requested by Soongmen participants. Only 11.9% of
the Soongmen participants requested for pest management information and 1.7%
mentioned the need for information regarding the use of insecticide. These dissimilarities
on the information requirements may indicate that agricultural fields in the Muang District
encountered more pest-related problems than in the Soongmen District.
In addition to few requests for pest-related information by the Soongmen district residents,
results from the user satisfaction survey in Section 6.4.4 indicated that nearly half of the
Soongmen participants (44%) received information for organic farming from the
experimental service. It may be assumed that the Soongmen participants already have a
broad range of information related to pest control, due to their own interests in organic
farming. This may be a reason why a majority of them did not request this kind of
information.

132
9.2.7 Participation among income groups
Participants‟ income also plays a role in the use of ICT tools, shown in both the
requirements survey in Section 5.3.1 and the user satisfaction survey in Section 6.4.1. A
majority of all the participants in the requirement survey (73.5%) earned less than 5,000
baht a month whereas 71.6% of participants who joined the experimental service earned
between 3,000 and 10,000 baht monthly. Particularly, the largest group in the requirements
survey (39.7%) fell into the 3,000 to 5,000 baht category, while the largest group in the
experiment survey (29.3%) earned between 8,000 and 10,000 baht. Thus it can be seen that
the participants who joined the experiment on using mobile phones for receiving
information did not represent the farmer participants in general. The participants engaging
in the experiment were predominantly in the high income groups. Also the requirements
survey indicated a relationship that the richer groups were more likely to utilize more ICT
tools for receiving agricultural information than the poorer groups. These results supported
the conclusion that richer farmers were more likely to adopt new ICT tools or services for
agricultural purposes.
Analysis of the relationships between variables in both surveys revealed that participants‟
income levels related to many variables such as technology familiarity, education level, the
variety of ICT tools used for receiving information, types of information sources and
positive opinions about the service. These findings may help to establish a strategy to
introduce ICT tools or services to farming groups in the future. Project leaders should
firstly aim at higher income groups in rural areas in order to achieve the objectives of the
first stage. Other groups are more likely to be involved in later steps, especially if the
success is verbally confirmed the first group. Nevertheless, income and social status based
on money are sensitive issues; therefore, to operate this strategy every relevant aspect
should be considered to avoid any social discriminations, which might cause negative
feelings among participants and lead to failure of the project.

133
9.2.8 Limitations in the experiment
Some limitations regarding to current technologies were encountered during the research
implementation. Firstly, a prototype implementation depending on 3G technology could not
be applied to this study due to uncertainty about concession contracts in Thailand
(Chantanusornsiri, 2011). During the first phase of 3G technology in Thailand, it will be
available mainly in the capital city, Bangkok and in significant provinces in other areas,
such as Phuket, Khon Kaen, Chiang Mai and Pattaya in Chonburi (Public Relations
Department, 2010). This plan may not include rural areas across the country for sometimes,
especially the fields studied.
Due to Thai character decoding of the SMS contents delivered, the length of a message is
limited to only 70 characters. This may restrict the understanding of farmers, who mostly
had an educational qualification at the primary school level and were considered as an
illiterate group. Additionally, the Thai writing script contains up to four levels of characters
in one line; therefore, a message in a local language needed more space on the mobile
phone screen than English characters. This was an obstacle to understanding the message,
but the text size problem was unavoidable. This was confirmed by the results of the after-
experiment survey; 12.9% of all the participants mentioned this problem as presented in
Section 6.4.5.
9.3 A comparison of the interviews of farmers and agricultural extension workers
According to the proposed framework, farmers were placed as end users of the system
while agricultural extension workers were able to play a role as either an end user or an
information administrator. Agreements and disagreements between participants in both
villages, and between farmers and agricultural extension workers were revealed.
Both sets of villagers agreed on their satisfaction with the use of mobile phones as an
agricultural information channel; some needing assistance from their children with reading
the SMS, and most being aware of problems of mobile phone loss or damage. They tended

134
to avoid any risks affecting their expenses or yields, such as the free call service or the
technology adoption according to the suggestions provided. They were more likely to use
the technology they were familiar with than adopt any other unfamiliar tools.
In contrast, the idea of taking pictures of plant disease then sending them to the agricultural
extension workers, caused very different reactions. The Muang participants stressed that
they found it easier to call the agricultural extension worker out to the fields, whereas the
Soongmen participants accepted this idea due to the distant relationship between
agricultural extension workers and themselves. Provision of the free use and training on the
computers and the Internet also saw the two sets of villagers in disagreement. The Muang
participants enjoyed having these services, even though they relied on the use of
agricultural extension workers. Conversely, the Soongmen participants showed negative
responses on these services at the first place because they felt the services were too
sophisticated and too complicated for themselves.
However, the interviews revealed that farmers and agricultural extension workers‟ opinions
were in agreements in terms of the purposes of using mobile phones as an information
channel and as a remedy for illiteracy levels coupled with low ICT skills among
participants in this study.
The Soongmen agricultural extension worker emphasized a benefit of the proposed model
that it could help the officers save travelling time if the officers did not have to meet every
single farmer to deliver news and information. Comparatively, neighbours appeared to be
the main source of information, although the Soongmen participants gave the highest
credibility to the agricultural extension worker according to Table 6. It may be concluded
that the Soongmen participants had a weak relationship with their extension worker. This
resulted in a willingness to adopt some kind of technology services which were simple and
suitable for the Soongmen farmers to solve their own agricultural difficulties. This echoes a
finding that weak relationships between information users and extension workers were
reported as a factor causing low agricultural yields in Kenya (Ministry of Agriculture,
Republic of Kenya, 1997 cited in Kiplang‟at & Ocholla, 2005).

135
Additionally, the Soongmen agricultural extension worker observed that most farmers were
old, illiterate and short of technology skills. This remark was in agreement with the
Soongmen farmers‟ interview comments that they might not attend the free computer and
Internet training because they were too old to learn these technologies. Furthermore,
participants from the Muang District supported their agricultural extension worker to learn
and practice these technologies on their behalf rather than doing it themselves. This may
show farmers‟ attitudes toward technology tools and that they still lack confidence in using
these unfamiliar tools. It was in line with Karnka‟s (2006) study that farmers had a belief
that the Internet was too complicated for them. This leads to another conclusion that
adopting technology tools or services through already familiar technology tools makes
farmers feel more confident and more acceptable toward the tools or services.
Also in the user satisfaction survey, it revealed that a majority of participants in this study
strongly satisfied with the use of mobile phones as an information channel. The
cancellation due to unfamiliarity with the use of SMS service on mobile phones was
reported at 12.9% of entire participants which can be considered as a small number of
overall. This outcome agreed with Elsey and Sirichoti (2003) that farmers may change their
attitudes or behaviours toward the use of ICT tool if they realized the advantages derived
from the usage.
As it was previously mentioned that most farmers were illiterate, only reading short
messages may not make them fully understand the contents. This may link to farmers‟
interview that many of farming participants still needed some help from their descendants
to read the received message. This behaviour may be caused from many reasons such as
age, illiteracy and technology unfamiliarity. This finding was in agreement with Warren
(2004) that farming family members who were more fluent in the ICT tools had a role in
passing information to other family members.
In comparison, the Muang agricultural extension worker showed more commitments on her
works than the other extension worker. This can be seen in the Muang agricultural
extension worker‟s interview that she willingly determined another responsibility to be an

136
information administrator to deliver information and news to farmers. Contrary to the
Soongmen agricultural extension worker, she required another two recruits to work on this
project as an information administrator and a program developer. Although she gave a
reason that agricultural extension worker‟s responsibility was now overloaded, it seemed
that she did not put an effort on this project. As a result, it is reasonable that the Soongmen
farmers were more likely to rely on themselves and neighbours. In accordance, the Muang
participants seemed to heavily rely on their agricultural extension worker in problem
solving and technology learning. These interview results also support the first survey
results regarding agricultural information providers that the Soongmen participants rated
their neighbours as the top information provider at 68.5% whereas 65.6% of the Muang
participants obtained agricultural information from agricultural extension worker.
In the long run, another concern may be considered that the Muang participants may face a
struggling situation if their current agricultural extension worker is assigned to work on
other areas and they do not get this kind of supports as they used to in the past.
In summary, the results found in this study revealed that the ICT adoption among farmers
may be affected from other variables such as gender, age, education, time preference and
income. Also, agricultural problems that farmers previously or currently encountered may
affect the requirements of particular types of information. In addition, the relationships
between farmers and agricultural extension workers responsible in the area also affected the
willingness and behaviours to adopt technology tools for the purpose of the information
dissemination.

137
CHAPTER 10 CONCLUSION AND FURTHER STUDIES
This chapter will summarise the results from previous chapters to answer the research
questions then further studies will be proposed for future development on the framework
proposed in Section 7.2.
10.1 Answers to research questions
This section will summarise all results to answer the research questions stated in Section
1.4. Five sub-questions will be answered in order then the main research question will be
answered at last.
10.1.1 Types of necessary agricultural information required by Thai famers
Providing the information that farmers did not truly demand may cause a failure of the ICT
services. Two surveys, which were the requirement survey and the user satisfaction survey,
were conducted to find out the information topics in needs for farmers. It was found that
information related to the use of fertilizers, organic farming and soil improvement was on
the highest demand. Information regarding pest management and produce market price was
requested by the majority of farmers. However, in both survey the use of insecticide,
financial management and weather forecasts were not on a great demand.
Notable is that information related to the use of insecticide and pest management was
mostly requested from the village in the Muang District. This may be because the village
had encountered pest problems in the past. Therefore it can be assumed that the type of
information currently sought has a relationship with previous problems encountered by
those farmers. Also, the requests of information at present may be implied to predict the
request of similar information types either in next cultivation seasons or at the same period
in next year.

138
10.1.2 Current agricultural information dissemination channels for Thai farmers
Document analysis from relevant government agencies‟ annual reports in conjunction with
the needs survey was conducted to answer how these farmers currently received
agricultural information. It revealed that the responsible government bodies attempt to
deliver agricultural information through community speakers, service call centre, television
broadcast, local radio channels, publications and web sites (DAE, 2010; Ministry of
Agriculture and Cooperatives, 2009). Furthermore, agricultural documentaries in forms of
VCD and e-books were created and available for farmers (DAE, 2010).
Agricultural information provided through the Internet channel seemed unpopular among
Thai farmers. Statistical reports and the needs survey indicated that only 1.9% of workforce
in the sectors had used ICT (NSO, 2010a). Together with the survey results, computers and
the Internet were the least used ICT tools to receive agricultural information among these
farmers.
10.1.3 Factors needed to be considered for information delivery to Thai farmers
It is interesting to note that within Thai farming families, each member had differently
impacting roles in conveying agricultural information. The participants themselves (62.9%)
provided agricultural information to other family members, followed by their spouse
(24.3%) and their children (6.4%). Although the results were different between these two
villages, both obtained agricultural information from local councils (57.2%), neighbours
(56.9%) and extension workers (56.5%). Other government officers and sales agents were
mentioned as a source among some villagers whereas web sites and private company
showed insignificant roles as information providers which were account for less than 10%.
The survey results and interviews with farmers and agricultural extension workers, some
factors needed to be considered in order to improve the agricultural information
dissemination.
139
The needs survey revealed that age, income and educational background of participants
related to the ICT tools used to receive agricultural information. Significantly, income level
of participants related to technology familiarity and attitudes toward the technology
services such as convenience, cost, knowledge enhancement, technology practices and
information timeliness. In addition, participants‟ educational level was also linked to the
knowledge enhancement perceived by the participants.
Furthermore, age of respondents also reflect the use of the Internet to receive agricultural
information. This finding corresponded to the fact that the Internet in Thailand became
commercialized in less than two decades. Therefore, it may be concluded that the
technology emergence also affected the tendency of technology usage for agricultural
purposes.
From the interview results it may be assumed that relationship between farmers and
agricultural extension workers responsible in that area affected how the information was
delivered to farmers. A good relationship between farmers and the agricultural extension
workers in the Muang District led to the reliance on the agricultural extension worker for
required information while the loose relationship in the Soongmen District may urge
farmers to make use of other available approaches including ICT tools and services.
10.1.4 Effectiveness of the implementation developed in this study
Then, a user satisfaction survey was conducted to evaluate the effectiveness of the service
after the experimental SMS service. It revealed that these farmers had strong agreements on
every measured aspect of the service; namely convenience, ease of use, free of charge,
knowledge enhancement, technology practice, information timeliness and information
format. Additionally, more than half of all participants requested more frequent information
deliver in the next phase. It may be assumed that these farmers realized the importance and
usefulness of information directly delivered on hand. Therefore, it may conclude that
farmers were strongly satisfied with the agricultural information dissemination in forms of
short messages on available mobile phones.

140
In addition, interviews with agricultural extension workers showed that they agreed on the
practical use of the proposed model even though financial supports and collaboration with
third parties may need to be taken into account if the model is actually implemented.
10.1.5 Framework improvement for a wider scale
Results from the experiment, surveys and interviews were used to create a framework for
implementing SMS service on a wider scale which was proposed as shown in Figure 28 in
Section 7.1.
In order to use this framework in a wider scale, such as an entire province, information
contents may be voluminous; consequently, information administrators should be
separately responsible for content update and maintenance. Other technological adjustment
or improvement for more efficient performance should be under application developers‟
responsibility.
In order to disseminate a large amount of information on a regular basis, collaboration
between related government bodies and academic sectors can be performed to ensure the
accuracy of the up-to-date information.
Additionally, targeting farmers‟ requirements and feedback should be periodically gathered
to improve and amend either content aspect or technology aspects. In this study, the
framework was conducted in particular areas; therefore, to obtain requirements and
feedback can be done by a few staffs. If this framework was applied for an entire province
or larger, a number of assistants should be employed. These assistants may work under the
supervision of either agricultural extension departments or local councils. Even chair
village people can be asked for collaboration.
Furthermore, sending SMS to a number of farmers in a wide scale required a large amount
of financial support from the government. Public-private participation may be an option to

141
extend the scope of SMS receivers and reduce the financial dependence. In terms of private
sector‟s benefit, they will gain not only long-term customers but also positive marketing
image and advertisement.
10.1.6 How ICT can be used to enhance agricultural information dissemination to selected groups of Thai farmers
A preliminary survey was planned and conducted to obtain requirements from selected Thai
farmers as shown in Section 5.3. In addition, documentary and statistical analyses were
employed to assess the current ICT situation in Thailand and the area studied as illustrated
in Section 5.1 and Section 5.2. It revealed that mobile phones were considered to be a
proper channel to deliver agricultural information to Thai farmers in this study.
Accordingly, a framework for agricultural information dissemination through SMS on
mobile phones was created followed by the prototype implementation as described in
Section 6.2 and Section 6.3.
The analysis of the implementation of the proposed framework in Section 6.4 showed that
using the SMS via mobile phones is an effective communication channel to disseminate
timely agricultural information directly to Thai farmers. Due to the growth rate of mobile
phone users in Thailand and the number of mobile phone possessions among Thai farmers,
information delivery through mobile phones will be continuously developed for a long
period of time. The analysis of the survey after the experiment in Section 6.4 revealed that
the majority of selected farmer groups were satisfied with the SMS and would like to
continue to receive agricultural information on other topics. An overall evaluation of the
framework in Section 6.6 found that this framework is successful at a competent level and
can be developed further to expand the service areas and other formats of agricultural
information to Thai farmers.
Additionally, the interviews with farmers in Section 6.7.2 showed that the use of ICT tool
for agricultural information dissemination is another option for solving the gap between
farmers and agricultural extension workers. Consequently, a number of farmers can receive

142
agricultural information without waiting for the agricultural extension worker visits. This
benefit will be more obviously seen in remote areas, where are very far from the
agricultural extension offices.
Comments from the agricultural extension worker working in Muang District supported the
advantages of using the ICT tool to provide the farmers instant announcements to a
multitude of farmers in broad areas. This will help farmers stay up-to-date with agricultural
news, outbreak warnings and supporting projects from governments. As mentioned by the
agricultural extension worker in Chapter 8 that the farmers can recheck the information
details at anytime they would like to because the provided messages remain in their phones.
Compared to TV or radio, if the farmers did not watch or listen to the programs at that time,
they would miss the information. In case they had a chance to do that, they might miss
some information such as date, time and conditions. Even publications or brochures free
provided to farmers included specific information details and could be rechecked several
times, the farmers might simply lose these materials. As mentioned in Section 6.7.1, the
situation will be different with contents in mobile phones because the farmers regarded the
mobile phones as valuable belongings; therefore, they will not carelessly neglect their
phones. Although the Internet contains a number of agricultural information, this study
found, in Section 5.3.2 and Section 6.7.2, that a majority of rural Thai farmers were not
ready to adopt this type of technology.
Current industry trends indicate that mobile phones tend to have more features while their
prices have decreased, as commonly expected in other technology tools. This offers a
chance for poor Thai farmers to possess a better mobile phone with acceptable
affordability. This study has shown that when Thai farmers are more familiar with other
features on mobile phones, other mobile phone services may be alternatives for Thai
farmers to receive or request agricultural information as needed.
In addition, it was found in the survey results in Section 5.4 and Section 6.6 that many
factors, such as income, education and gender, may affect the preference of using ICT tools
for agricultural purposes. Consequently, in order to actually employ this framework in

143
farming field these factors should be taken into account for selecting the primary target
groups then extending to other groups of farmers to ensure the achievement of the project.
10.2 Further Studies
In this study, a simple SMS was applied in order to directly disseminate required
agricultural information to farmers. However, in terms of further implementations to
improve the efficiency of agricultural information delivery, other techniques may be
utilised. This section will explain further research issues to be considered if the framework
will be adapted to other parts of Thailand or other countries as well as technology
advancements that can be employed to achieve higher outcomes.
10.2.1 Adaptation to other parts of Thailand or other countries
This study was conducted in a northern province of Thailand; in order to adapt this
framework to other areas some issues should be considered. For instance, in some southern
provinces of Thailand, not only Thai language but also other local languages are used in
daily life. In order to deliver text information through mobile phones, the most used
language in that area should be taken into account. It may affect the script coding in the
application and features for supporting language in the mobile phones. Another example,
many ethnic tribes living on high mountain areas do not have writing scripts in their own
language. Therefore, encouraging them to read information in an alien language may not
succeed.
Even the 3G network in Thailand does not presently cover all over the country; it will be
achieved in the near future. In accordance with the continuously reducing phone prices and
better features on mobile phones, short video clips presenting new agricultural practices or
technologies can be a possible option for rural Thai farmers. It will be able to compensate
for illiteracy among farmers.
144
10.2.2 Possible technology advancements employed
Instead of employing a stand-alone application and a particular registered mobile phone
linked through a Bluetooth connection, for example, the service may be applied to the use
of an SMS web service. A limitation in using the stand-alone application may occur in case
the content administrator is not in the country for a short period of time. The administrator
needs to manage all contents and schedule them in advance. However, the SMS web
service provides an Internet-based application which their subscribers are able to log into
the system from anywhere around the world via the Internet connection and then manage
the content delivery to receivers. Utilising this technique broadens working areas for the
sender.
Alternatively, rather than employing the push technology by disseminating information
straight to users, the pull technology which provides the information only on request may
be another practice to be considered as shown in Jensen and Thysen‟s (2003) study. With
this technique, farmers will receive the agricultural information only in the topic that they
would like to know and at the time they are convenient to consume. However, to properly
use this technique, having a certain level of SMS use skills are necessary to the farming
users. Consequently, a requirement on application training for farmers themselves or
responsible extension workers is essential. However, according to Islam and Gronlund‟s
(2010) study, it also encountered the situation that farmers did not send information
requests to the system in a significant amount as it was expected due to their lack of
confidence concerning the SMS expense issue. Therefore, to apply this technique
comprehensible communication is very necessary. In this case, the system framework is to
be adjusted as shown in Figure 29.
The added dashed arrows illustrate information request directions starting from SMS
requests on required agricultural information from farmers to the pre-defined mobile phone
number then these requests are forwarded to trigger the information disseminating system.

145
Nevertheless, in case the farming users are familiar with using their mobile phones to
request information in their interest or report field problems, all incoming messages are
able to be mapped in the geographic information system (GIS) for further analysis,
implementations and prediction. For example, after a certain number of requested
information related to a plant disease or a certain pest management in a particular area, it
may be assumed that the farming areas infected from the outspread disease or pests. Then
all connected farming areas should be given a warning. Another example, high requests for
a specific type of agricultural information from the same area may hint the extension
workers to educate those farmers with particular information for better understanding.
Figure 29. A further framework information dissemination via mobile phone.
Information administrator
Farmer recipients
Hosting mobile phone
Information dissemination system
Agricultural information repository
Satisfaction evaluation
further requested information
Application developer
System update
content update
further requested features
feedback
Agricultural content
SMS/ video clip SMS requests
Requested topics

146
Moreover, intelligent database, whose answers could be directly mined from, may be
implemented to handle the information requests from farmers. In case the farmers feel that
they are able to easily obtain the answers they really need, the system could be more
acceptable among farmers.
As another option according to Parikh (2009), pictures are able to alleviate inconvenience
regarding illiteracy among poor farmers and too small Thai characters on the mobile phone
display. The price of mobile phones has decreased and it also happens to the built-in-
camera phones. Farmers may take pictures concerning pest or disease then send them to a
particular official phone number. Subsequently, responsible government officers including
agricultural extension workers will analyse and make a suggestion to the sender.
Nevertheless, at the first place the camera-built-in mobile phones have to be provided
though its price is not as expensive as it was in conjunction with proper training for farming
users.
147
References
Agricultural Information Center, Office of Agricultural Economics [OAE]. (2010).
ตวชวดเศรษฐกจการเกษตรของประเทศไทย ป 2552 [Thai Agricultural Economics Indicators 2009]. Retrieved March 14, 2011 from http://www.oae.go.th/download/prcai/index 25520.pdf
Agricultural Information Center, Office of Agricultural Economics [OAE]. (2011).
ขอมลพนฐานเศรษฐกจการเกษตร ป 2553 [Fundamental Information of Agricultural Economics 2010]. Retrieved March 14, 2011 from http://www.oae.go.th/download /download_journal/fundamation-2553.pdf
Ahmad, Q., & Sarwar, I. (2008). An intelligent agri-information dissemination framework:
an e-government. Proceedings of the 12th IEEE International Multitopic Conference (INMIC) 2008, pp. 529 -535. Pakistan: Karachi.
Armstrong, L.J., Diepeveen, D.A., & Tantisantisom, K. (2010). An eAgriculture-based
decision support framework for information dissemination. International Journal of Human Capital and Information Technology Professionals, 1(4), 1 – 13.
Arunachalam, S. (2002). Reaching the unreached: how can we use information and
communication technologies to empower the rural poor in the developing world through enhanced access to relevant information? Journal of Information Science, 28(6), 513 – 522.
Balaji, V., Kumaran, S., & Rajasekarapandy, R. (2002). MSSRF: Village knowledge
centers. Gender, Technology and Development, 6(1), 147 – 152. Banmeke, T.O.A., & Ajayi, M.T. (2007). Agricultural information utilisation pattern
among women farmers in South-Western Nigeria. Journal of Agriculture and Social Research, 7(2), 58 – 65.
Castillo, A. (2000). Ecological Information System: Analyzing the Communication and
Utilization of Scientific Information in Mexico. Environmental Management 25(4), pp. 383–392.
Cambridge University Press. (2009). Cambridge Advanced Learner's Dictionary. Retrieved
November 9, 2009 from http://dictionary.cambridge.org/define.asp?key= 22599&dict=CALD
Chantanusornsiri, W. (2011, March 2). TOT delays inking 3G contract due to transparency investigation. Bangkok Post. Retrieved March 22, 2011, from http://www.bangkokpost.com/business/telecom/224234/tot-delays-inking-3g-contract-due-to-transparency-investigation

148
Chaudhary, A.G. (2004). Cyber communities in rural India – bridging the digital divide. Media Asia, 31(3), 150 – 156.
Cidro, D.A., & Radhakrishna, R.B. (2006). Usefulness of information sources in the
promotion of hybrid rice program in the Philippines. Proceedings of the 22nd Association for International Agricultural and Extension Education Annual Conferenc, pp. 134 - 142. Florida: Clearwater Beach.
Curtain, R. (2003). Information and communication technologies and development: help or
hindrance? Canberra: AusAID. Das, A.K., & Dutta, C. (2004). Strengthening rural information infrastructure through e-
choupals. Proceedings of the XXI Indian Association of Special Libraries and Information Centres National Seminar, pp. 1 – 6. India: Kolkata.
Davies, A.G. (2008). Map of Thailand showing provinces. Retrieved May 18, 2011 from
http://www.asiawaves.net/thailand/ thailand-map.htm Diekmann, F., & Batte, M.T. (2009). Examining information search strategies of Ohio
farmers. Journal of Extension, 47, 6, 1 – 14. Department of Agricultural Extension [DAE], the Ministry of Agriculture and
Cooperatives, Thailand. (2010). รายงานประจ าป 2552 [Annual report 2009]. Retrieved April 1, 2010 from http://www.doae.go.th/prompt/2554/110125/2552.pdf
Department of Agriculture, the Ministry of Agriculture and Cooperatives, Thailand. (2009).
ขาวเปนอาหารทส าคญทสดของคนไทย. [Rice is the most important food for Thai] Retrieved July 1, 2009 from http://www.moc.go.th/MocCMS/fileupload/ETC/ 25601.doc
Dictionary.com, LLC. (2009). Delivery. Retrieved November 9, 2009 from http://dictionary.reference.com/browse/delivery
Division of General Administration, Office of Local Administration, Department of
Provincial Administration, Thailand. (2009). การปกครองทองท [Local administration]. Retrieved November 8, 2009 from http://www.dopa.go.th/web_pages/m03100000/ mmenu1.html
Eagly, A.H. & Chaiken, S. (1993). The psychology of attitudes. Texas: Harcourt Brace
Jovanovich College Publishers. Economic and Social Development Department, Food and Agriculture Organization of the
United Nations [FAO] (2011). The state of food and agriculture 2010 – 2011. Retrieved July 7, 2011 from http://www.fao.org/docrep/013/i2050e/i2050e.pdf

149
Ekoja, I.I. (2004). Sensitising users for increased information use: the case of Nigerian farmers. African Journal of Library, Archives and Information Science, 14(2), 193-204.
Elizabeth, S., & Zira, D.Y. (2009). Awareness and effectiveness of vegetable technology
information packages by vegetable farmers in Adamawa State, Nigeria. African Journal of Agricultural Research, 4(2), 65 – 70.
Elsey, B., & Sirichoti, K. (2003). The theory and practice of workplace learning in the
adoption of integrated pest management by tropical fruit growers in Thailand. Journal of Workplace Learning, 15(2), 53-62.
Field, T.G., Lemenager, R.P., Long, B., Suttee, H., & Gardiner, H. (2007). The future of
information dissemination to the beef cattle industry. Proceedings of American Society of Animal Science, Western Section (pp. 176 – 182). The USA: Moscow.
Foreign Office, The Government Public Relations Department. (n.d.). Geography of
Thailand: Overview. Retrieved December 25, 2011 from http://thailand.prd.go.th/ebook /inbrief/page.php?cid=2
Gandhi, S., Mittal, S., & Tripathi, G. (2009). The impact of mobiles on agricultural
productivity. Moving the debate forward: the policy paper series, 9, 21 – 33. Gillham, B. (2000). Case study research methods. London: Cassell.
Hanneke, H.S. (2000). Interaction and the standardized survey interview: the living questionnaire. New York: Cambridge University Press.
Hassan, M.S., Hassan, M.A., Samah, B.A., Ismail, N., & Shaffril, H.A.M. (2008). Use of
information and communication technology (ICT) among agri-based entrepreneurs in Malaysia. Proceedings of the World Conference on Agricultural Information and IT (pp. 753 - 762). Japan: Atsugi.
Ian, B. (2008). Questionnaire Design: How to Plan, Structure and Write Survey Material
for Effective Market Research. London: Kogan Page. Information and Communication Group [ICG], Phrae Provincial Office. (2010).
บรรยายสรปจงหวด แพร ป 2553 [Summary of Phrae Province 2010]. Retrieved March 13, 2011 from http://www.phrae.go.th/file_data/2554.pdf
International Institute for Communication and Development [IICD]. (2006). ICTs for
agricultural livelihoods: Impact and lessons learned from IICD supported activities. The Hague: The Netherlands.
International Rice Research Institute - IRRI. (2009). USA – rice production to increase.
Retrieved June 2, 2009 from http://beta.irri.org/news/index.php/rice-news/usa-rice-production-to-increase.html

150
Internet Information Research [IIR], National Electronics and Computer Technology
Center. (2009). Internet user in Thailand. Retrieved May 6, 2011 from ผดพลาด! การอางองการเชอมโยงหลายมตไมถกตอง
Irivwieri, J.W. (2007). Information needs of illiterate female farmers in Ethiope East local
government area of Delta State. Library Hi Tech News, 9(10), 38-42. Islam M. S., & Gronlund, A. (2010). An agricultural market information service (AMIS) in
Bangladesh: evaluating a mobile phone based e-service in a rural context. Information Development, 26(4), 289 – 302.
Jensen, A.L., & Thysen, I. (2003). Agricultural information and decision support by SMS.
Proceedings of the EFITA 2003 Conference (pp. 286 – 292). Hungary: Debrecen.
Kalusopa, T. (2005). The challenges of utilizing information communication technologies (ICTs) for the small-scale farmers in Zambia. Library Hi Tech, 23(3), 414 – 424.
Kari, H.K. (2007). Availability and accessibility of ICT in the rural communities of
Nigeria. The Electronic Library, 25(3), 363 – 372. Karnka, S. (2006). ICTs‟ appropriate model for e-farmers group development in Thailand.
Proceedings of the 4th World Congress Conference: Computer in Agriculture and National Resources (pp. 140 - 145). Florida: Orlando.
Khalil, A.H.O., Ismail, M., Suandi, T., & Silong, A.D. (2008). Extension worker as a leader to farmers: influence of extension leadership competencies and organisational commitment on extension workers‟ performance in Yemen. The Journal of International Social Research, 1(4), 368 – 387.
Kiplang, J. (1999). An analysis of the opportunities for information technology in improving access, transfer and the use of agricultural information in the rural areas of Kenya. Library Management, 20(2), 115 – 128.
Kiplang‟at, J. & Ocholla, D.N. (2005). Diffusion of information and communication
technologies in communication of agricultural information among agricultural researchers and extension workers in Kenya. South African Journal of Libraries and Information Science, 71(3), 234 – 246.
Kizilaslan, N. (2007). Agricultural information systems: a national case study. Library
Review, 55(8), 497 – 507. Koshy, V. (2005). Action research for improving practice: a practical guide. London: Sage
Publications.
151
Krishna Reddy, P., & Ankaiah, R. (2005). A framework of information technology-based agriculture information dissemination system to improve crop productivity. Current Science, 88(12), 1905 – 1913.
Krishna Reddy, P., Ramaraju, G.V., & Reddy, G.S. (2007). eSagu: a data warehouse
enabled personalized agricultural advisory system. Proceedings of the Special Interest Group on Management of Data (SIGMOD) 2007 (pp. 910 - 914). China: Beijing.
Lin, Y., & Heffernan, C. (2010). Creating the livestock guru: ICTs to enhance livestock-
related knowledge among poor households in Orissa, India. Tropical Animal Health and Production, 42(7), 1353 – 1361.
Locke, S. (2005). Farmer adoption of ICT in New Zealand. The Business Review, Cambridge, 3(2), 191 – 197.
Lowe K. M. (2011). Knowledge transfer activity in the RDPE Northwest Livestock
Programme. Best-Practice Knowledge Transfer: Knowledge exchange between providers of KT to farmers. Scotland: British Society of Animal Science.
Malhan, I.V., & Rao, S. (2007a). Impact of globalization and emerging information
communication technologies on agricultural knowledge transfer to small farmers in India. Proceedings of the World Library and Information Congress: the 73rd IFLA General Conference and Council, (pp. 1 -20). South Africa: Durban.
Malhan, I. & Rao, S. (2007b). Agricultural knowledge transfer in India: a study of
prevailing communication channels. Library Philosophy and Practice. Retrieved March 11, 2011 from http://www.webpages.uidaho.edu/~mbolin/malhan-rao.htm
Mangstl, A. (2008). Emerging issues, priorities and commitments in e-Agriculture. Agriculture Information Worldwide, 1(1), 5 – 6.
Margono, T., & Sugimoto, S. (2011). The barriers of the Indonesian extension workers in
disseminate agricultural information to farmers. International Journal of Basic & Applied Sciences, 11(2), 98 – 105.
Mears, C.L. (2009). Interviewing for education and social science research. New York:
Palgrave Macmillan. Mertler, C.A. (2009). Action research: teachers as researchers in the classroom, 2nd ed.
The United States of America: SAGE Publications, Inc. Ministry of Information and Communication Technology [MICT]. (2009). รายงานประจ าป
2551 [Annual report 2008]. Retrieved April 1, 2010 from http://www.mict.go.th/ download/1-154edit.pdf

152
Ministry of Agriculture and Cooperatives. (2009). รายงานประจ าป 2551 [Annual report 2008]. Retrieved April 1, 2010 from http://www.oae.go.th/download/journal/ report_51.pdf
Mittal, S., Gandhi, S., & Tripathi, G. (2010). Socio-economic impact of mobile phones on
Indian agriculture. New Delhi, India: Indian Council for Research on International Economic Relations.
Mittal, S., & Tripathi, G. (2009). Role of mobile phone technology in improving small farm
productivity. Agricultural Economics Research Review, 22(2009), 451 – 459. Mukhebi, A.W., Kundu, J., Okolla, A., Wambua, M., Ochieng, W., & Fwamba, G. (2007).
Linking famers to markets through modern information and communication technologies in Kenya. Proceedings of the 2nd International Conference of African Association of Agricultural Economists, pp. 1 – 8. Ghana: Accra.
Munyua, H., Adera, E., & Jensen, M. (2008). Emerging ICTs and their potential in
revitalizing small scale agriculture in Africa. Proceedings of the World Conference on Agricultural Information and IT (pp. 707 - 718). Japan: Atsugi.
Narula, S.A., & Arora, S. (2010). Indentifying stakeholders‟ needs and constraints in
adoption of ICT services in rural areas: the case of India. Social Responsibility Journal, 6(2), 222 - 236.
National Statistical Office of Thailand [NSO]. (2007). ตวชวดการพฒนาเทคโนโลย สารสนเทศและการสอสารของประเทศไทย [Thai ICT indicators]. Retrieved July 13, 2009 from http://service. nso.go.th/nso/nsopublish/service/datadownload/IctIndicators.zip
National Statistical Office of Thailand [NSO]. (2009a). สรปผลทส าคญส ารวจการมการใช
การเทคโนโลยสารสนเทศและการสอสารในครวเรอน พ .ศ. 2551 [The significant survey results of information and communication technology in household, year 2008]. Retrieved July 13, 2010 from http://service.nso.go.th/nso/nsopublish/service/survey/IctHRep51.pdf
National Statistical Office of Thailand [NSO]. (2009b). จ านวนประชากร จ านวนตามชวงอาย เพศ
และหมบาน. [Population categorized by age, gender and village]. Retrieved September 3, 2010 available from http://service.nso.go.th/stat_tab2/index.jsp
National Statistical Office of Thailand [NSO]. (2010a). สรปผลทส าคญส ารวจการมการใช
การเทคโนโลยสารสนเทศและการสอสารในครวเรอน พ .ศ. 2552 [The significant survey results of information and communication technology in household, year 2009]. Retrieved March 14, 2011 from http://service.nso.go.th/nso/nsopublish/download/files/ ictHRep52.pdf

153
National Statistical Office of Thailand – NSO. (2010b). เครองชการพฒนาเทคโนโลยสารสนเทศ และการสอสารของประเทศไทย พ.ศ. 2552 [Indicators of Development in Thai Information and Communication Technology, year 2009]. Retrieved March 14, 2011 from http://service.nso.go.th/nso/nsopublish/download/files/IctIndicator52.pdf
O'Brien, R. (2001). Um exame da abordagem metodológica da pesquisa ação [An Overview of the Methodological Approach of Action Research]. In Roberto Richardson (Ed.), Teoria e Prática da Pesquisa Ação [Theory and Practice of Action Research]. João Pessoa, Brazil: Universidade Federal da Paraíba. (English version) Retrieved August 25, 2009 from http://www.web.ca/~robrien/papers/arfinal.html
Office of Agricultural Economics (OAE). (2009). The study of farmers’ poverty. Retrieved
July 31, 2009 from http://www.oae.go.th/ewt_news.php?nid=4431& filename=index
Office of Northern Science Park. (n.d.) ขอมลพนฐานจงหวดแพร [Fundamental information of Phrae Province]. Retrieved March 18, 2011 from http://nsp.mfu.ac.th/download/ project/basic_pr.pdf
Office of the National Economic and Social Development Board [ONESDB]. (2006). The
Tenth National Economic and Social Development Plan. Retrieved March 16, 2011 from http://www.nesdb.go.th/Portals/0/news/plan/eng/Plan10.zip
Office of the National Economic and Social Development Board [ONESDB]. (2010a).
รายไดประชาชาต ของประเทศไทย พ .ศ. 2552 [National Income of Thailand 2009]. Retrieved March 13, 2011 from http://www.nesdb.go.th/Portals/0/eco_datas/account/ni/ni_2009 /NI2009-detail_eng.pdf
Office of the National Economic and Social Development Board. (2010b). The Summary of
the Direction of the Eleventh National Economic and Social Development Plan. Retrieved March 16, 2011 from http://www.nesdb.go.th/Portals/0/news/annual_ meet /53/book/plan11_eng.zip
Office of the Permanent Secretary of Ministry of Information and Communication
Technology & Strategy Research and Industry Indicator Division of National Electronics and Computer Technology Center [OPS & NECTEC]. (2009). The Second Thailand Information and Communication Technology (ICT) master plan (2009 – 2013). Retrieved April 1, 2010 from http://www.nstda.or.th/nstda-doc-archives/doc_details /199-the-second-thailand-information-and-communication-technology-ict-master-plan-2009-2013
Ogunlade, I., Oladele, O.I. & Falaki, A.A. (2006). Information needs and seeking behaviour
among urban farmers in Kwara State, Nigeria. University of Dar es Salaam Librrary Journal, 8(12), 73 – 87.

154
Oladele, O.I. (2006). Multilinguality of farm broadcast and agricultural information access in Nigeria. Nordic Journal of African Studies, 15(2), 199 – 205.
Opara, U.N. (2008). Agricultural information sources used by farmers in Imo State,
Nigeria. Information Development, 24(4), 289 – 295. Oppenheim, A.N. (2001). Questionnaire, Design, Interview and Attitude measurement.
London: Continuum. Palasri, S., Huter, S., & Wenzel, Z. (1999). The history of the Internet in Thailand. Oregon:
University of Oregon Books. Parikh, T.S. (2009). Engineering rural development. Communications of the ACM, 52(1),
54 – 63. Pickernell, D.G., Christie, M.J., Rowe, P.A., Thomas, B.C., Putterill, L.G. & Griffiths, J.L.
(2004). Farmers‟ markets in Wales: making the Net work. British Food Journal, 106(3), 194 – 210.
Public Relation Department, National News Bureau of Thailand. (2011). TOT launches 3G
network in Pattaya. Retrieved March 28, 2010 from http://thainews.prd.go.th /en/news.php?id=255301060042
Rao, K.V., Ramamritham, K., & Sonar, R.M. (2010). Examing the viability of mixed
framework for evaluating mobile services impact in rural India. Proceedings of the International Conference on Information and Communication Technologies and Development, - . United Kingdom: London.
Rao, N.H. (2007). A framework for implementing information and communication
technologies in agricultural development in India. Technological Forecasting & Social Change, 74(4), 491 – 518.
Rao, S.S. (2004). Role of ICTs in India‟s rural community information systems. Info, 6(4),
261 – 269. Ratnam, B.V., Krishna Reddy, P., & Reddy, G.S. (2005). eSagu: an IT based personalized
agricultural extension system prototype – analysis of 51 farmers‟ case studies. International Journal of Education and Development using Information and Communication Technology, 2(1), 79-94.
Saghir, A., Ashfaq, M., & Noreen, A. (2009). Gender and information and communication technologies (ICTs). The Journal of Animal & Plant Sciences, 19(2), 94 – 97.
Schmuck, R.A. (2006). Practical action research for change (2nd edition). California:
Corwin Press, Inc.

155
Sheriff, F.R. (2009). Village Information Centers in Tamil Nadu, TANIVAS, Chennai, India: e-Empowering resource poor farmers. Retrieved July 3, 2009 from http://www.i4donline.net/articles/current-article.asp?Title=Village-information-centres-in-Tamil-Nadu,TANUVAS,Chennai,India&articleid=2241&typ=Features
Shiblaq, F. & Fielden, K. (2008). ICT provision in a rural community: a New Zealand case
study. Proceedings of the IADIS International Conference ICT, Society and Human Beings. The Netherlands: Amsterdam.
Sindir, K.O. (2005). Information and communication technologies in Turkish agriculture.
Outlook on Agriculture, 34(1), 49-53.
Singh S. (2006). Selected Success Stories on Agricultural Information Systems. Asia-Pacific Association of Agricultural Research Institutions. Thailand: Bangkok.
Sivakami, S., & Karthikeyan, C. (2009). Evaluating the effectiveness of expert system for performing agricultural extension services in India. Expert Systems with Applications, 36(6), 9634 – 9636.
Sood, A. D. (2001). How to wire rural India: the problems and possibilities of digital
development. Economic and Political Weekly, 36(43), 4134-4141 . Subramanian, R. & Arivanandan, M. (2009). Rural development through village knowledge
centers in India. Communications of the International Information Management Association (IIMA), 9(2), 101 – 120.
Sulaiman, R.V., Kalaivani, N.J., Mittal, N., & Ramasundaram, P. (2011). ICTs and
empowerment of India rural women – what can we learn from on-going initiatives? (Working paper). India: Centre for Research on Innovation and Science Policy (CRISP).
Sujhi, G., Anandaraja, N., Gayathri, G., Ramasubramanian, M., & Rathakrishnan, T.
(2009). Technology enabled farm women – Interactive multimedia compact disc (IMCD). Retrieved July 3, 2009 from http://www.i4donline.net/sept07/1434.pdf
Tarnoczi, T.J. & Berkes, F. (2010). Sources of information for farmers‟ adaptation practices in Canada‟s Prairie agro-ecosystem. Climatic Change, 98(1-2), 299 – 305. Retrieved April 16, 2010 from http://www.springerlink.com/content/ u80103060g501771
Tiwari, S.P. (2008). Information and communication technology initiatives for knowledge
sharing in agriculture. Indian Journal of Agricultural Sciences, 78(9), 737 – 747. Tomal, D.R. (2003). Action research for educators. Maryland: Scarecrow Press.

156
Tortermvasana, K. (2011, January 26). ZTE petitions court to block 3G auction. Bangkok Post. Retrieved March 22, 2011 from http://www.bangkokpost.com/business/ telecom/218201/zte-petitions-court-to-block-3g-auction
United States Department of Agriculture (USDA). (2009). USDA Rice Baseline, 2004-13.
Retrieved August 20, 2009 from http://www.ers.usda.gov/Briefing/rice/ 2004baseline.htm
Upton, D.M., & Fuller, V.A. (2004). The ITC eChoupal initiative. Harvard Business School
Case N 9-604-016. Retrieved November 6, 2009 from http://unpan1.un.org /intradoc/groups/public/documents/un/unpan033117.pdf
U.S. Census Bureau, Population Division. (2009). World population: 1950 – 2050.
Retrieved November 8, 2009 from http://www.census.gov/ipc/www/idb/ worldpopgraph.php
Velandia, M., Lambert, D.M., Mendieta, M.P., Roberts, R.K., Larson, J.A., English, B.C.,
Rejesus, R. M., & Mishra, A.K. (2011). Factor influencing cotton farmers‟ perceptions about the importance of information sources in precision farming decisions. Proceedings of the Agricultural & Applied Economics Association’s 2011 AAEA & NAREA Joint Annual Meeting, -. Pennsylvania: Pittsburgh.
Warren, M. (2004). Farmers online: drivers and impediments in adoption of Internet in UK
agricultural businesses. Journal of Small Business and Enterprise Development, 11(3), 371 – 381.
Waters-Adams, S. (2006). Action research in education. Retrieved December 25, 2011
from http://www.edu.plymouth.ac.uk/resined/actionresearch/arhome.htm Woodside, A.G. (2010). Case study research: theory-methods-practice. United Kingdom:
Emerald Group Publishing Limited.
World Bank Group. (2004). Glossary. Retrieved November 6, 2009 from http://www.worldbank.org/depweb/english/beyond/global/glossary.html
World Bank Group. (2009). Country classification. Retrieved November 6, 2009 from
http://web.worldbank.org/WBSITE/EXTERNAL/DATASTATISTICS/0,,contentMDK:20420458~menuPK:64133156~pagePK:64133150~piPK:64133175~theSitePK:239419,00.html
World Bank Group. (2011). Agricultural land (% of land area). Retrieved March 11, 2011
from http://data.worldbank.org/indicator/AG.LND.AGRI.ZS Yin, R.K. (2009). Case study research: design and methods 4th ed. California: Sage
Publications.
157
Zhang, G., Gao, W., Wang, X., Jiang, X., Ping, Y. & Yang, H. (2007). Study and design of an agricultural SMS system based on a GSM modem. New Zealand Journal of Agricultural Research, 50(5), 1089 – 1092.
Zhu, N., & Luo, X. (2010). The impact of migration on rural poverty and inequality: a case
study in China. Agricultural Economics, 41 (2), 191–204.

158
Appendix A: The questionnaire for the needs analysis
QUESTIONNAIRE
Please mark in the in front of the choice you have made Part A Demographic Data
1. Gender male female 2. Age range (excluding months) below 15 years old 16 – 20 years old 21 – 25 years old 26 – 30 years old 31 – 35 years old 36 – 40 years old 41 – 45 years old 46 – 50 years old 51 – 55 years old 56 – 60 years old over 61 years old
3. Highest education level primary school junior high school high school certificate undergraduate diploma bachelor degree master degree or higher
4. Marital status single married divorced separated
5. The number of family members 1 person 2 people 3 people 4 people 5 people more than 5 people
6. Average income (per month) less than 3000 baht 3001 – 5000 baht 5001 – 8000 baht
8001 – 10000 baht 10001 – 15000 baht 15001 – 25000 baht more than 25000 baht
7. Type of agricultural activities (you can make more than 1 choice) crop grower rice sugar cane cassava corn mung bean soy bean
others (please specify)………………………………………………….... livestock poultry pig cow/cattle
others (please specify)…………………………………………………....

159
8. Agricultural areas 4 acres or less 5 – 10 acres 11 – 20 acres 21 – 20 acres 21 – 30 acres 31 acres or more
9. Do you own the land you farm? yes no (rent) both own and rent
Part B Data related to the use of information and communication (ICT) tools in agricultural sector
10. What kind of ICT tools do you currently use in daily life? (can make more than 1 choice) TV radio CD/DVD player home phone mobile phone computer Internet community loud speakers
11. Which ICT tools would you like to use or learn in order to improve your
agricultural productivity? Please fill in the following table for each type of tool.
ICT tools strongly agree agree neutral disagree strongly
disagree TV Radio CD/DVD player home phone mobile phone Computer Internet community loud speakers
12. In your family, who plays the main role in conveying new agricultural information
to you? yourself your children your spouse brother(s) sister(s) father mother others (please specify)…………………………....
13. Other than your family, who or what are your main agricultural information providers? (can make more than 1 choice) neighbours local council extension workers private company sales agents government officers related web sites others (please specify)…………………………………………………………....

160
14. Do you believe the following sources give you accurate information? Please fill in the following table for each source of information.
information sources strongly believe believe neutral disbelieve strongly
disbelieve Neighbours local council extension workers private company sales agents government officers related web sites
15. What type of information would you like to acquire in order to improve your productivity? (can make more than 1 choice) pest management use of fertilizer soil improvement market price use of insecticide weather forecast financial management organic farming others (please specify)…………………………………………………………....
16. How often and how much time would like to spend acquiring new information?
Please tick one box
17. What time of the day would you like to get the new information? 6.00 – 10.00 10.01 – 13.00 13.01 – 16.00 16.01 – 18.00 18.01 – 21.00 21.01 – 24.00
18. Which positive outcomes have you resulted from the information you have received
from these providers? (Please tick any that apply.) increasing amount of productivity higher quality of productivity lower cost higher selling price others (please specify)…………………………………………………………....
Frequency 5 min 15 min 30 min 45 min 1 hour Daily Weekly Fortnightly Monthly

161
19. Which negative outcomes have you resulted from the information you have received from these providers? (Please tick any that apply.) failure of productivity higher cost but lower productivity low selling price complicated processes no follow-up process to stimulate the success others (please specify)…………………………………………………………....
20. What kinds of current agricultural support have you used or heard about? (can make
more than 1 choice) market prices via mobile phone services CD/DVD about agricultural productivity improvement agricultural forums/web board on the website of Department of Agriculture weather forecast for agricultural purpose on the website of The Thai Meteorological Department
21. What are your expectations towards agricultural information dissemination via ICT tools?
………………………………………………………………………………………… ………………………………………………………………………………………… ………………………………………………………………………………………… ………………………………………………………………………………………… …………………………………………………………………………………………

162
Appendix B: Consent Form
Information Letter to Participants (Thai farmers) Information Dissemination in Multiple Formats to Thai Farmers in Rural Area
Dear Research Participants,
As a candidate for a Doctor of Information Technology degree at Edith Cowan University
(ECU), Perth, Western Australia, I invite you to become a research participant to provide
data in order to improve information dissemination techniques for your occupational
developments.
The aim of this study is to improve agricultural processes and support agriculture-related
decision making in Thailand by introducing information and communication technology
tools in order to disseminate value information to Thai farmers in the forms of easily
understandable formats. As a result, Thai farmers will be aware of the usefulness of
information and communication technology and then adapt themselves to long-life learning
through information and communication technology tools. In the long term, it will be a
good opportunity to enhance the quality of livelihood for needy farmers.
To ensure confidentiality and anonymity, this research project has been approved by the
ECU Human Research Ethics Committee. In details, all provided data and information will
be used only in this research without identification of any person, organisation, time or
place. The original questionnaires will be held in a secure place at my home for at least five
years, as are all the data and information gathered. Any third parties outside of the
immediate university staff directly concerned with my research will not be able to access
any data or information sourced from these questionnaires.
You, as a participant, have the right to withdraw from this research process at any time.
Moreover, in case you would like to remove all contents that you have provided, this
requirement can be done under you own consideration.

163
If you require any further information concerning the research project, please contact:
Miss Khumphicha Tantisantisom
Email: [email protected]
Tel: +61 414 963 662
If you have any concerns or complaints about the research project and wish to talk to an
independent person, you may contact:
Research Ethics Officer
Edith Cowan University
100 Joondalup Drive
JOONDALUP WA 6027
Phone: (08) 6304 2170
Email: [email protected]
Or the following person if you prefer a contact in Thailand
Associate Professor Pornpen Chochai
Dean of Faculty of Science and Technology
Kamphaengphet Rajabhat University
Kamphaengphet, Thailand 62000
164
Informed Consent Document Information Dissemination in Multiple Formats to Thai Farmers in Rural Area
I (the participant) have read the information above and clearly understand the contents
provided. I also am informed that I have a full right to withdraw from this study at any
time.
I willingly agree to participate in this study.
………………………………………………………………………………………………
Participant Date
………………………………………………………………………………………………
Investigator Date
(The information letter, the informed consent document and the interview document will be
translated into Thai for clearly understanding between participants and the investigator.
Additionally, the translation will be approved by a lecturer from the Department of Foreign
Language, Faculty of Humanities, Kamphaengphet Rajabhat University, Kamphaengphet,
Thailand.)

165
Appendix C: Data from the needs survey
Table C1 Valid Percentages of Male and Female Participants in Each Village Gender Muang Soongmen Male 54.8 57.0 Female 45.2 43.0 Total 100 100 Table C2 Valid Percentages of Participants in Each Age Group in Each Village Age Muang Soongmen Below 15 years old 0.6 0 16 – 20 years old 0 1.3 21 – 25 years old 0 1.4 26 – 30 years old 0 2.7 31 – 35 years old 5.0 4.0 36 – 40 years old 6.7 6.7 41 – 45 years old 10.6 14.8 46 – 50 years old 21.2 22.1 51 – 55 years old 15.6 23.5 56 – 60 years old 16.8 12.1 Over 61 years old 23.5 11.4 Total 100 100 Table C3 Valid Percentages of Participants in Each Educational Level in Each Village Education Muang Soongmen Primary school 71.5 62.8 Junior high school 10.1 16.9 High school 8.9 8.8 Certificate 3.9 2.0 Undergraduate diploma 2.8 2.0 Bachelor degree 2.8 6.1 Master degree or higher 0 1.4 Total 100 100 Table C4 Valid Percentages of Participants in Each Type of Marital Status in Each Village Marital Status Muang Soongmen Single 12.3 12.8 Married 81.9 86.5 Divorced 5.2 0.7 Separated 0.6 0 Total 100 100

166
Table C5 Valid Percentages of Participants in Each Family Size in Each Village Family members Muang Soongmen 1 person 1.7 4.0 2 people 5.5 8.7 3 people 21.1 29.3 4 people 30.6 32.7 5 people 22.8 14.6 More than 5 people 18.3 10.7 Total 100 100 Table C6 Valid Percentages of Participants in Each Income Group in Each Village Income Muang Soongmen Less than 3000 baht 37.5 29.5 3001 – 5000 baht 40.9 38.3 5001 – 8000 baht 11.9 14.8 8001 – 10000 baht 5.2 6.0 10001 – 15000 baht 1.1 6.0 15001 – 25000 baht 2.3 4.1 More than 25000 baht 1.1 1.3 Total 100 100 Table C7 Valid Percentages of Participants Who Have Grown Rice in Each Village Rice growing Muang Soongmen Yes 80.0 92.0 No 20.0 8.0 Total 100 100 Table C8 Valid Percentages of Participants Who Have Grown Sugar Cane in Each Village Sugar cane growing Muang Soongmen Yes 0 0.7 No 100 99.3 Total 100 100 Table C9 Valid Percentages of Participants Who Have Grown Casava in Each Village Casava growing Muang Soongmen Yes 0 0.7 No 100 99.3 Total 100 100
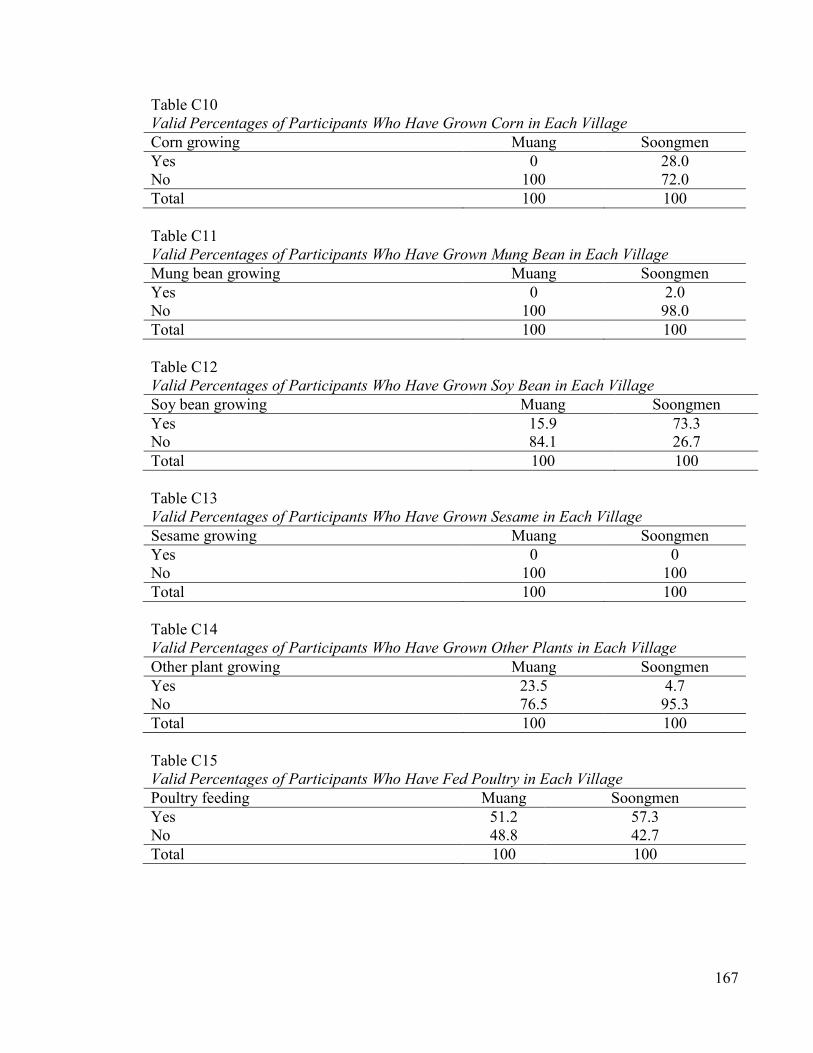
167
Table C10 Valid Percentages of Participants Who Have Grown Corn in Each Village Corn growing Muang Soongmen Yes 0 28.0 No 100 72.0 Total 100 100 Table C11 Valid Percentages of Participants Who Have Grown Mung Bean in Each Village Mung bean growing Muang Soongmen Yes 0 2.0 No 100 98.0 Total 100 100 Table C12 Valid Percentages of Participants Who Have Grown Soy Bean in Each Village Soy bean growing Muang Soongmen Yes 15.9 73.3 No 84.1 26.7 Total 100 100 Table C13 Valid Percentages of Participants Who Have Grown Sesame in Each Village Sesame growing Muang Soongmen Yes 0 0 No 100 100 Total 100 100 Table C14 Valid Percentages of Participants Who Have Grown Other Plants in Each Village Other plant growing Muang Soongmen Yes 23.5 4.7 No 76.5 95.3 Total 100 100 Table C15 Valid Percentages of Participants Who Have Fed Poultry in Each Village Poultry feeding Muang Soongmen Yes 51.2 57.3 No 48.8 42.7 Total 100 100

168
Table C16 Valid Percentages of Participants Who Have Fed Pigs in Each Village Pig feeding Muang Soongmen Yes 10.6 3.3 No 89.4 96.7 Total 100 100 Table C17 Valid Percentages of Participants Who Have Fed Cattles in Each Village Cattle feeding Muang Soongmen Yes 22.4 8.7 No 77.6 91.3 Total 100 100 Table C18 Valid Percentages of Participants Who Have Fed Other Animals in Each Village Other animal feeding Muang Soongmen Yes 5.9 4.7 No 94.1 95.3 Total 100 100 Table C19 Valid Percentages of Participants in Each the Agricultural Land Size in Each Village Agricultural area Muang Soongmen 4 acres or less 59.9 49.0 5 – 10 acres 33.1 39.3 11 – 20 acres 6.4 5.5 21 – 20 acres 0.6 2.8 21 – 30 acres 0 1.3 31 acres or more 0 2.1 Total 100 100 Table C20 Valid Percentages of Participants in Each Types of Land Use in Each Village Land own Muang Soongmen Own 42.5 41.4 Rent 41.1 41.5 Both own and rent 16.4 17.1 Total 100 100
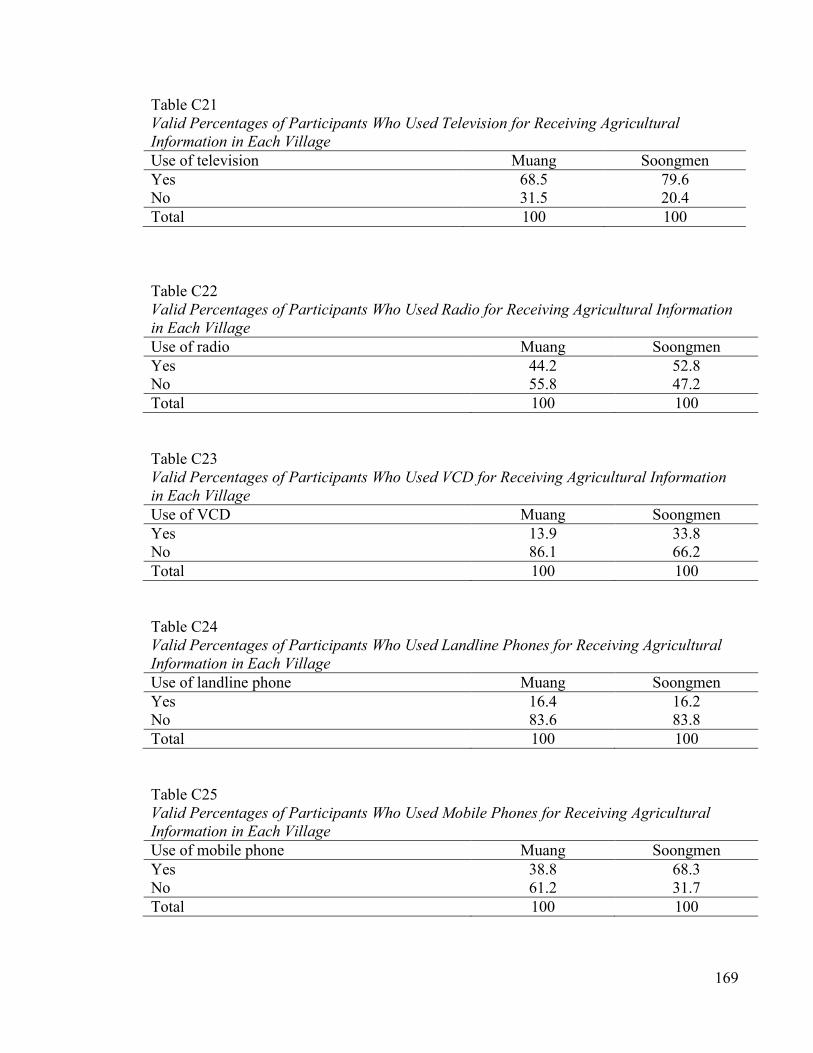
169
Table C21 Valid Percentages of Participants Who Used Television for Receiving Agricultural Information in Each Village Use of television Muang Soongmen Yes 68.5 79.6 No 31.5 20.4 Total 100 100 Table C22 Valid Percentages of Participants Who Used Radio for Receiving Agricultural Information in Each Village Use of radio Muang Soongmen Yes 44.2 52.8 No 55.8 47.2 Total 100 100 Table C23 Valid Percentages of Participants Who Used VCD for Receiving Agricultural Information in Each Village Use of VCD Muang Soongmen Yes 13.9 33.8 No 86.1 66.2 Total 100 100 Table C24 Valid Percentages of Participants Who Used Landline Phones for Receiving Agricultural Information in Each Village Use of landline phone Muang Soongmen Yes 16.4 16.2 No 83.6 83.8 Total 100 100 Table C25 Valid Percentages of Participants Who Used Mobile Phones for Receiving Agricultural Information in Each Village Use of mobile phone Muang Soongmen Yes 38.8 68.3 No 61.2 31.7 Total 100 100

170
Table C26 Valid Percentages of Participants Who Used Computers for Receiving Agricultural Information in Each Village Use of computer Muang Soongmen Yes 7.3 14.8 No 92.7 85.2 Total 100 100 Table C27 Valid Percentages of Participants Who Used the Internet for Receiving Agricultural Information in Each Village Use of the Internet Muang Soongmen Yes 6.1 13.4 No 93.9 86.6 Total 100 100 Table C28 Valid Percentages of Participants Who Used Community Speakers for Receiving Agricultural Information in Each Village Use of community speaker Muang Soongmen Yes 32.1 36.6 No 67.9 63.4 Total 100 100 Table C29 Valid Percentages of Participant Preference on Using Television for Receiving Agricultural Information in Each Village Preference on using television Muang Soongmen Strongly disagree 0 0 Disagree 0.7 0 Neutral 3.0 1.5 Agree 41.8 43.3 Strongly agree 54.5 55.2 Total 100 100 Table C30 Valid Percentages of Participant Preference on Using Radio for Receiving Agricultural Information in Each Village Preference on using radio Muang Soongmen Strongly disagree 0 0 Disagree 4.1 0.8 Neutral 3.3 10.1 Agree 59.5 44.1 Strongly agree 33.1 45.0 Total 100 100

171
Table C31 Valid Percentages of Participant Preference on Using VCD for Receiving Agricultural Information in Each Village Preference on using VCD Muang Soongmen Strongly disagree 3.0 0 Disagree 9.0 6.2 Neutral 33.0 23.0 Agree 34.0 48.7 Strongly agree 21.0 22.1 Total 100 100 Table C32 Valid Percentages of Participant Preference on Using Landline Phones for Receiving Agricultural Information in Each Village Preference on using landline phone Muang Soongmen Strongly disagree 0 0 Disagree 11.8 6.8 Neutral 43.0 28.2 Agree 35.5 37.6 Strongly agree 9.7 27.4 Total 100 100 Table C33 Valid Percentages of Participant Preference on Using Mobile Phones for Receiving Agricultural Information in Each Village Preference on using mobile phone Muang Soongmen Strongly disagree 1.0 0 Disagree 10.7 0 Neutral 31.0 14.0 Agree 36.9 44.9 Strongly agree 20.4 41.1 Total 100 100 Table C34 Valid Percentages of Participant Preference on Using Computers for Receiving Agricultural Information in Each Village Preference on using computer Muang Soongmen Strongly disagree 1.1 3.5 Disagree 7.6 6.1 Neutral 30.4 31.6 Agree 40.2 32.5 Strongly agree 20.7 26.3 Total 100 100

172
Table C35 Valid Percentages of Participant Preference on Using the Internet for Receiving Agricultural Information in Each Village Preference on using the Internet Muang Soongmen Strongly disagree 1.1 1.8 Disagree 8.0 6.2 Neutral 27.3 27.7 Agree 30.6 29.5 Strongly agree 33.0 34.8 Total 100 100 Table C36 Valid Percentages of Participant Preference on Using Community Speaker for Receiving Agricultural Information in Each Village Preference on using community speaker Muang Soongmen Strongly disagree 0.8 0.8 Disagree 2.5 1.7 Neutral 4.1 14.0 Agree 45.9 37.2 Strongly agree 46.7 46.3 Total 100 100 Table C37 Valid Percentages of Participants as a Role of an Information Provider for the Family in Each Village Information provider in family Muang Soongmen Yourself 63.3 62.6 Your children 8.4 4.1 Your spouse 24.1 24.5 Brother(s) 0 1.3 Sister(s) 1.2 0 Father 1.2 4.1 Mother 1.8 2.7 Others 0 0.7 Total 100 100 Table C38 Valid Percentages of Participants Who Received Agricultural Information from Neighbours Neighbours as an information source Muang Soongmen Yes 46.6 68.5 No 53.4 31.5 Total 100 100
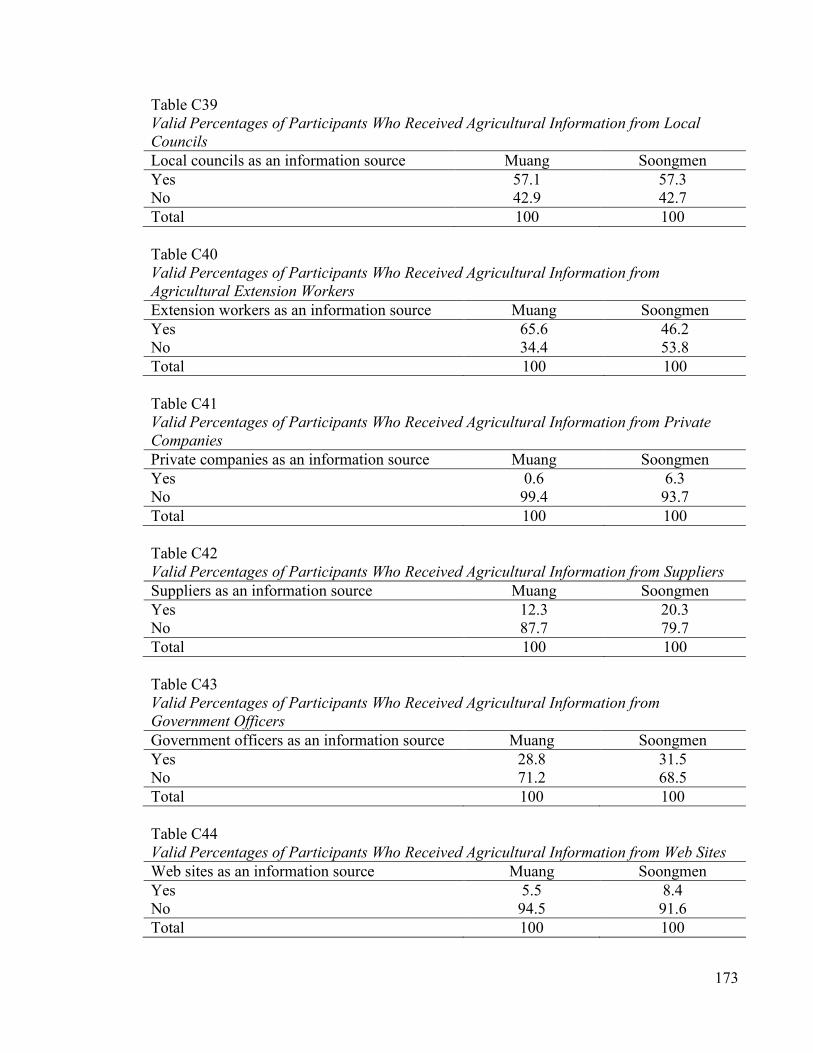
173
Table C39 Valid Percentages of Participants Who Received Agricultural Information from Local Councils Local councils as an information source Muang Soongmen Yes 57.1 57.3 No 42.9 42.7 Total 100 100 Table C40 Valid Percentages of Participants Who Received Agricultural Information from Agricultural Extension Workers Extension workers as an information source Muang Soongmen Yes 65.6 46.2 No 34.4 53.8 Total 100 100 Table C41 Valid Percentages of Participants Who Received Agricultural Information from Private Companies Private companies as an information source Muang Soongmen Yes 0.6 6.3 No 99.4 93.7 Total 100 100 Table C42 Valid Percentages of Participants Who Received Agricultural Information from Suppliers Suppliers as an information source Muang Soongmen Yes 12.3 20.3 No 87.7 79.7 Total 100 100 Table C43 Valid Percentages of Participants Who Received Agricultural Information from Government Officers Government officers as an information source Muang Soongmen Yes 28.8 31.5 No 71.2 68.5 Total 100 100 Table C44 Valid Percentages of Participants Who Received Agricultural Information from Web Sites Web sites as an information source Muang Soongmen Yes 5.5 8.4 No 94.5 91.6 Total 100 100

174
Table C45 Valid Percentages of Participants Who Received Agricultural Information from Other Sources Other sources as an information source Muang Soongmen Yes 2.5 1.4 No 97.5 98.6 Total 100 100 Table C46 Valid Percentages of Participant Preference on Receiving Agricultural Information from Neighbours Preference on neighbours Muang Soongmen Strongly disagree 0 0.7 Disagree 0.8 0.7 Neutral 22.1 8.5 Agree 58.2 75.9 Strongly agree 18.9 14.2 Total 100 100 Table C47 Valid Percentages of Participant Preference on Receiving Agricultural Information from Local Councils Preference on local councils Muang Soongmen Strongly disagree 0 0 Disagree 1.6 2.9 Neutral 7.7 15.7 Agree 55.8 45.7 Strongly agree 34.9 35.7 Total 100 100 Table C48 Valid Percentages of Participant Preference on Receiving Agricultural Information from Agricultural Extension Workers Preference on extension workers Muang Soongmen Strongly disagree 0 0 Disagree 1.4 2.1 Neutral 7.9 7.1 Agree 46.4 55.6 Strongly agree 44.3 35.2 Total 100 100

175
Table C49 Valid Percentages of Participant Preference on Receiving Agricultural Information from Private Companies Preference on private companies Muang Soongmen Strongly disagree 0 2.4 Disagree 14.8 7.8 Neutral 67.9 44.9 Agree 16.1 29.9 Strongly agree 1.2 15.0 Total 100 100 Table C50 Valid Percentages of Participant Preference on Receiving Agricultural Information from Suppliers Preference on suppliers Muang Soongmen Strongly disagree 1.1 1.6 Disagree 11.5 8.5 Neutral 46.0 38.7 Agree 38.0 38.0 Strongly agree 3.4 13.2 Total 100 100 Table C51 Valid Percentages of Participant Preference on Receiving Agricultural Information from Government Officers Preference on government officers Muang Soongmen Strongly disagree 0.9 0 Disagree 0.9 3.1 Neutral 14.7 16.6 Agree 53.2 50.4 Strongly agree 30.3 29.9 Total 100 100 Table C52 Valid Percentages of Participant Preference on Receiving Agricultural Information from Web Sites Preference on web sites Muang Soongmen Strongly disagree 1.2 3.2 Disagree 3.6 9.5 Neutral 42.2 27.0 Agree 44.6 40.5 Strongly agree 8.4 19.8 Total 100 100

176
Table C53 Valid Percentages of Participants Who Requested Pest Management Information Pest management information Muang Soongmen Required 56.6 65.3 Not required 43.4 34.7 Total 100 100 Table C54 Valid Percentages of Participants Who Requested Use of Fertilizer Information Use of fertilizer information Muang Soongmen Required 68.7 64.6 Not required 31.3 35.4 Total 100 100 Table C55 Valid Percentages of Participants Who Requested Soil Improvement Information Soil improvement information Muang Soongmen Required 62.0 59.7 Not required 38.0 40.3 Total 100 100 Table C56 Valid Percentages of Participants Who Requested Market Price Information Market price information Muang Soongmen Required 56.6 59.0 Not required 43.4 41.0 Total 100 100 Table C57 Valid Percentages of Participants Who Requested Use of Insecticide Information Use of insecticide information Muang Soongmen Required 32.5 36.1 Not required 67.5 63.9 Total 100 100 Table C58 Valid Percentages of Participants Who Requested Weather Forecast Information Weather forecast information Muang Soongmen Required 16.9 11.1 Not required 83.1 88.9 Total 100 100

177
Table C59 Valid Percentages of Participants Who Requested Financial Management Information Financial management information Muang Soongmen Required 28.9 34.7 Not required 71.1 65.3 Total 100 100 Table C60 Valid Percentages of Participants Who Requested Organic Farming Information Organic farming information Muang Soongmen Required 62.7 41.0 Not required 37.3 59.0 Total 100 100 Table C61 Valid Percentages of Participants Who Requested Other Information Other information Muang Soongmen Required 1.2 1.4 Not required 98.8 98.6 Total 100 100 Table C62 Valid Percentages of Participant Preference on Receiving Information Daily in Each Length of Information in Each Village Daily information delivery Muang Soongmen 5 minutes 42.1 49.2 15 minutes 31.6 32.8 30 minutes 15.8 16.4 45 minutes 0 1.6 1 hour 10.5 0 Total 100 100 Table C63 Valid Percentages of Participant Preference on Receiving Information Weekly in Each Length of Information in Each Village Weekly information delivery Muang Soongmen 5 minutes 8.7 12.5 15 minutes 42.0 45.3 30 minutes 26.1 32.8 45 minutes 7.3 4.7 1 hour 15.9 4.7 Total 100 100

178
Table C64 Valid Percentages of Participant Preference on Receiving Information Fortnightly in Each Length of Information in Each Village Fortnightly information delivery Muang Soongmen 5 minutes 8.0 2.4 15 minutes 28.0 36.6 30 minutes 28.0 46.3 45 minutes 24.0 4.9 1 hour 12.0 9.8 Total 100 100 Table C65 Valid Percentages of Participant Preference on Receiving Information Monthly in Each Length of Information in Each Village Monthly information delivery Muang Soongmen 5 minutes 4.9 3.0 15 minutes 16.5 7.6 30 minutes 21.3 40.9 45 minutes 5.8 16.7 1 hour 51.5 31.8 Total 100 100 Table C66 Valid Percentages of Participant Preference on the Time to Receive Agricultural Information Time to receive information Muang Soongmen 6.00 – 10.00 30.6 14.2 10.01 – 13.00 14.4 18.2 13.01 – 16.00 3.1 6.8 16.01 – 18.00 6.3 6.8 18.01 – 21.00 43.1 50.6 21.01 – 24.00 2.5 3.4 Total 100 100 Table C67 Valid Percentages of Participants Who Experienced from Increasing Amount of Productivity after Applying the Information Received Experience on increasing amount of productivity Muang Soongmen Experienced 64.1 72.1 Not experienced 35.9 27.9 Total 100 100
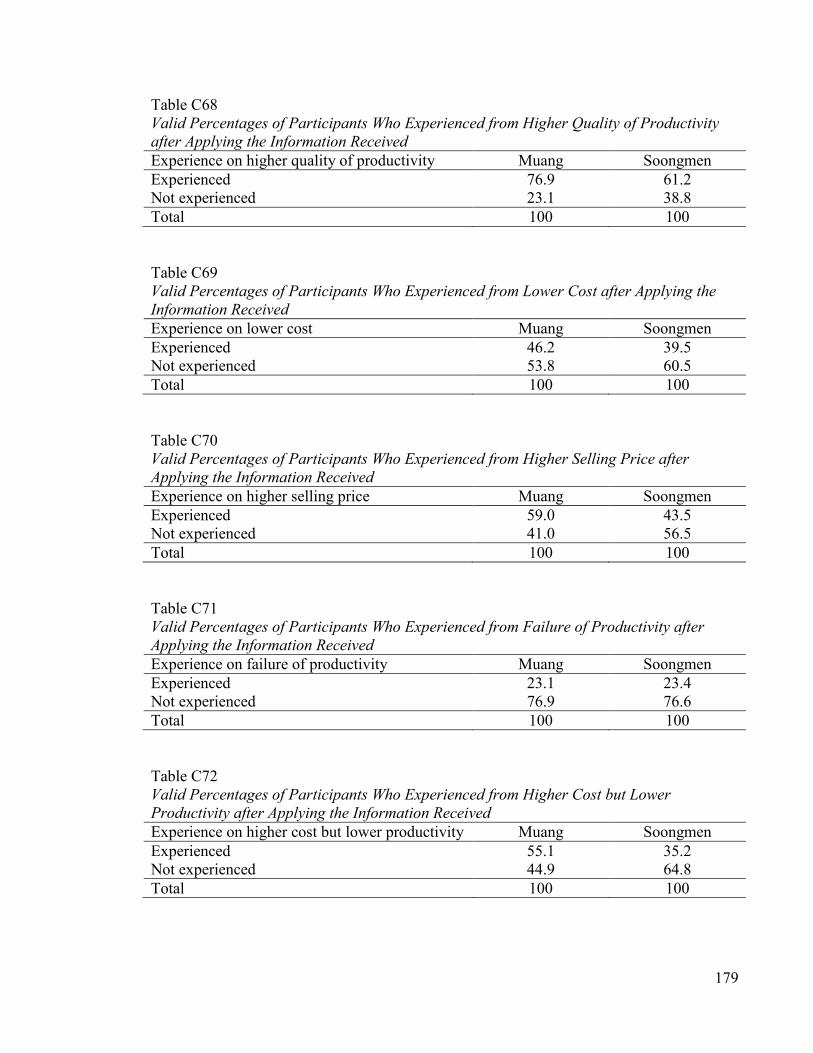
179
Table C68 Valid Percentages of Participants Who Experienced from Higher Quality of Productivity after Applying the Information Received Experience on higher quality of productivity Muang Soongmen Experienced 76.9 61.2 Not experienced 23.1 38.8 Total 100 100 Table C69 Valid Percentages of Participants Who Experienced from Lower Cost after Applying the Information Received Experience on lower cost Muang Soongmen Experienced 46.2 39.5 Not experienced 53.8 60.5 Total 100 100 Table C70 Valid Percentages of Participants Who Experienced from Higher Selling Price after Applying the Information Received Experience on higher selling price Muang Soongmen Experienced 59.0 43.5 Not experienced 41.0 56.5 Total 100 100 Table C71 Valid Percentages of Participants Who Experienced from Failure of Productivity after Applying the Information Received Experience on failure of productivity Muang Soongmen Experienced 23.1 23.4 Not experienced 76.9 76.6 Total 100 100 Table C72 Valid Percentages of Participants Who Experienced from Higher Cost but Lower Productivity after Applying the Information Received Experience on higher cost but lower productivity Muang Soongmen Experienced 55.1 35.2 Not experienced 44.9 64.8 Total 100 100

180
Table C73 Valid Percentages of Participants Who Experienced from Low Selling Price after Applying the Information Received Experience on low selling price Muang Soongmen Experienced 53.8 37.2 Not experienced 46.2 62.8 Total 100 100 Table C74 Valid Percentages of Participants Who Experienced from Complicated Processes after Applying the Information Received Experience on complicated processes Muang Soongmen Experienced 30.8 44.8 Not experienced 69.2 55.2 Total 100 100 Table C75 Valid Percentages of Participants Who Experienced from No Follow-up Process to Stimulate the Success after Applying the Information Received Experience on no follow-up process to stimulate the success
Muang Soongmen
Experienced 41.7 49.0 Not experienced 58.3 51.0 Total 100 100 Table C76 Valid Percentages of Participants Who Ever Received Market prices via mobile phone services Market prices via mobile phone service Muang Soongmen Ever 22.3 31.6 Never 77.7 68.4 Total 100 100 Table C77 Valid Percentages of Participants Who Ever Watched CD/DVD about Agricultural Productivity Improvement CD/DVD about agricultural productivity improvement
Muang Soongmen
Ever 62.8 41.2 Never 37.2 58.8 Total 100 100

181
Table C78 Valid Percentages of Participants Who Ever Used Agricultural Forums/Web Board on the Website Agricultural forums/web board on the website Muang Soongmen Ever 11.6 12.5 Never 88.4 87.5 Total 100 100 Table C79 Valid Percentages of Participants Who Ever Received Weather Forecast Information on the Website Weather forecast on the website Muang Soongmen Ever 10.7 17.6 Never 89.3 82.4 Total 100 100

182
Appendix D: The prototype user interface
The stand-alone prototype was developed using Visual Basic 6 tools. Bluetooth connection
was used to connect a mobile phone to the application gateway. The pre-paid mobile phone
registered to an SMS-lover promotion which was able to send out 500 messages within 199
baths (about 6.59 Australian Dollars on the 16th of March, 2011). After connecting the
mobile phone to the program, a message can be sent out to either a single or multiple
recipient numbers. However, this experiment was conducted in Thailand to send out
information in official language which is of Thai. Therefore, text code limited the length of
the sent message to 70 characters per a message. After launching the program, the
application window shows as in Figure D1.
Figure D1. A user interface window to send out a message instantly by filling out all input boxes which are a recipient phone number and a message.
An SMS News Member Connection History
Send an SMS
Agricultural Information
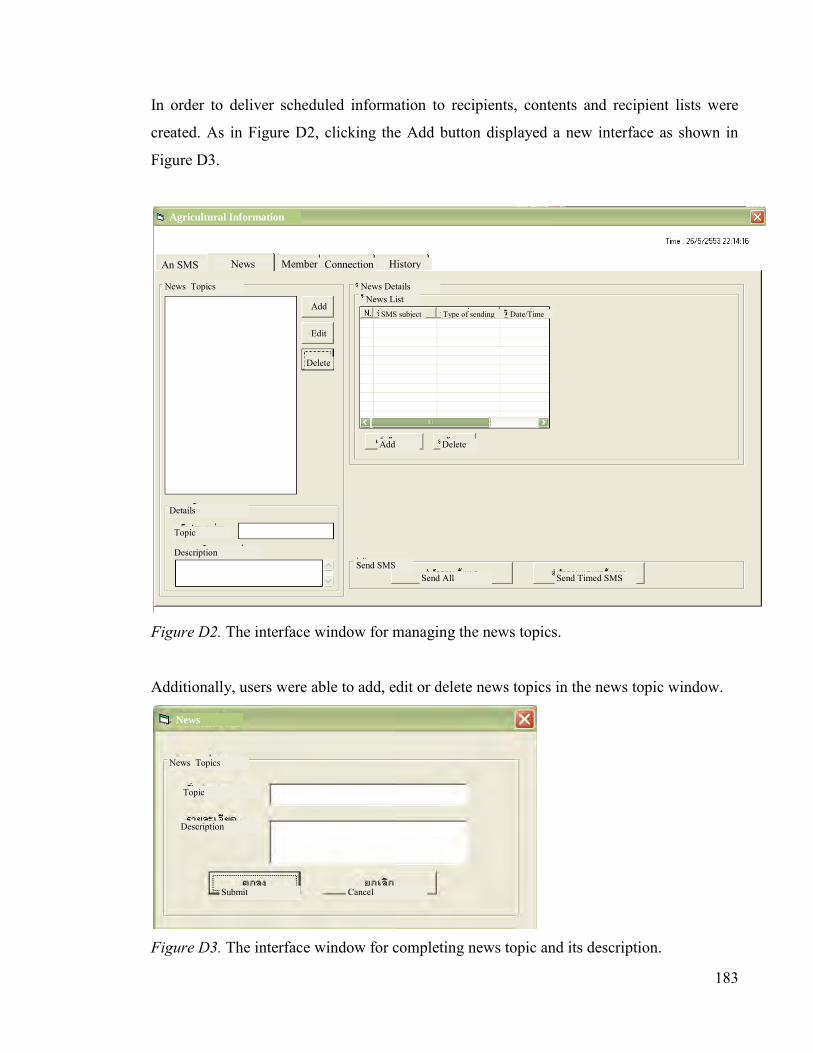
183
In order to deliver scheduled information to recipients, contents and recipient lists were
created. As in Figure D2, clicking the Add button displayed a new interface as shown in
Figure D3.
Figure D2. The interface window for managing the news topics.
Additionally, users were able to add, edit or delete news topics in the news topic window.
Figure D3. The interface window for completing news topic and its description.
News Details News Topics News List
Add
Edit
Delete
Add Delete
Details
Topic
Description Send SMS
Send All Send Timed SMS
SMS subject Type of sending Date/Time
News Topics
Topic
Description
Submit Cancel
Agricultural Information
An SMS News Member Connection History
News

184
After a new topic was created, clicking a topic in the News Topic box showed the Message
box to create a news sub-topic under the selected main topic including its contents as
shown in Figure D4.
Figure D4. A user interface for creating news contents under each sub-topic.
Before clicking the Submit button, user were able to choose either Now or Later options.
By selecting Now option, messages would be disseminated immediately after the Send All
button was clicked. On the other hand, selecting the Later option needed the specific time
and date to be delivered as shown in Figure D5. Time and date shown at the top right of
the window was the time and date of the computer system.
News Topics
Add
Edit
Delete
Add Delete
Details
Topic
Description Send SMS
Send All Send Timed SMS
Submit Cancel
now later
An SMS News Member Connection History
News Details News List
SMS subject Type of sending Date/Time message
topic
content
Agricultural Information

185
Figure D5. Setting time and date for the message to be disseminated.
Before sending news contents out to recipients, member details needed to be created as
shown in Figure D6.
An SMS News Member Connection History
now later
Send SMS Send All Send Timed SMS
Details
Topic
Description
News Topics
Add
Edit
Delete
Add Delete
message
topic
content
News Details News List
SMS subject Type of sending Date/Time
Agricultural Information

186
Figure D6. A user interface window for managing member or recipient details.
By clicking the Add button, necessary member details such as name and mobile phone
number need to complete as shown in Figure D7. Furtheremore, within this interface,
updating and deleting member were able to be accomplished.
Figure D7. A user interface window to add new member and details.
After having agricultural messages and member details to send to, creating a member list
could be done in the News tab as shown in Figure D8.
Member List Member Detail
Member Name
Mobile No
Member Type
Registered Date
Mobile No Member Name Member Type Registered Date
Add Edit Delete
An SMS News Member Connection History
Agricultural Information
Member Details
Member Name
Phone Number
Submit Cancel

187
Figure D8. A user interface window to assign recipient list to each message.
However, in order to connect the application to the specific mobile phone via bluetooth
connection a computer port needed to be configured as shown in Figure D9. In this
experiment, port COM 11 was used.
An SMS News Member Connection History
now later
Send SMS Send All Send Timed SMS
Details
Topic
Description
News Topics
Add
Edit
Delete
Add Delete
message
topic
content
News Details News List
SMS subject Type of sending Date/Time
Agricultural Information
Submit Cancel
On the list Member
Available member

188
Figure D9. A user interface window for setting the Bluetooth connection port to a specific
mobile phone.
An SMS News Member Connection History
Agricultural Information

189
Figure D10. The user interface while sending an example message to a receiver.
Figure D11. The receiver‟s mobile phone screen showing the message received.

190
Appendix E: The user satisfaction questionnaire
USER SATISFACTION QUESTIONNAIRE
Please mark in the in front of the choice you have made Part A Demographic Data
1. Gender male female 2. Age range (excluding months) below 20 years old 21 – 30 years old 31 – 40 years old 41 – 50 years old 51 – 60 years old over 61 years old
3. Highest education level primary school junior high school high school/certificate undergraduate diploma bachelor degree or higher
4. Marital status single married divorced/separated
5. The number of family members 1 - 2 people 3 -4 people 5 or more people
6. Average income (per month) less than 3000 baht 3001 – 5000 baht 5001 – 8000 baht 8001 – 10000 baht 10001 – 20000 baht more than 20000 baht
Part B Data related to the satisfaction toward receiving agricultural information through SMS services on mobile phones
7. What kind of information have you selected? the use of fertilizer soil improvement organic farming
8. How often have you received agricultural information during the experimental service? daily weekly fortnightly
9. How often would you like to receive the information? twice a day daily twice a week weekly fortnightly monthly others (please specify)……………………
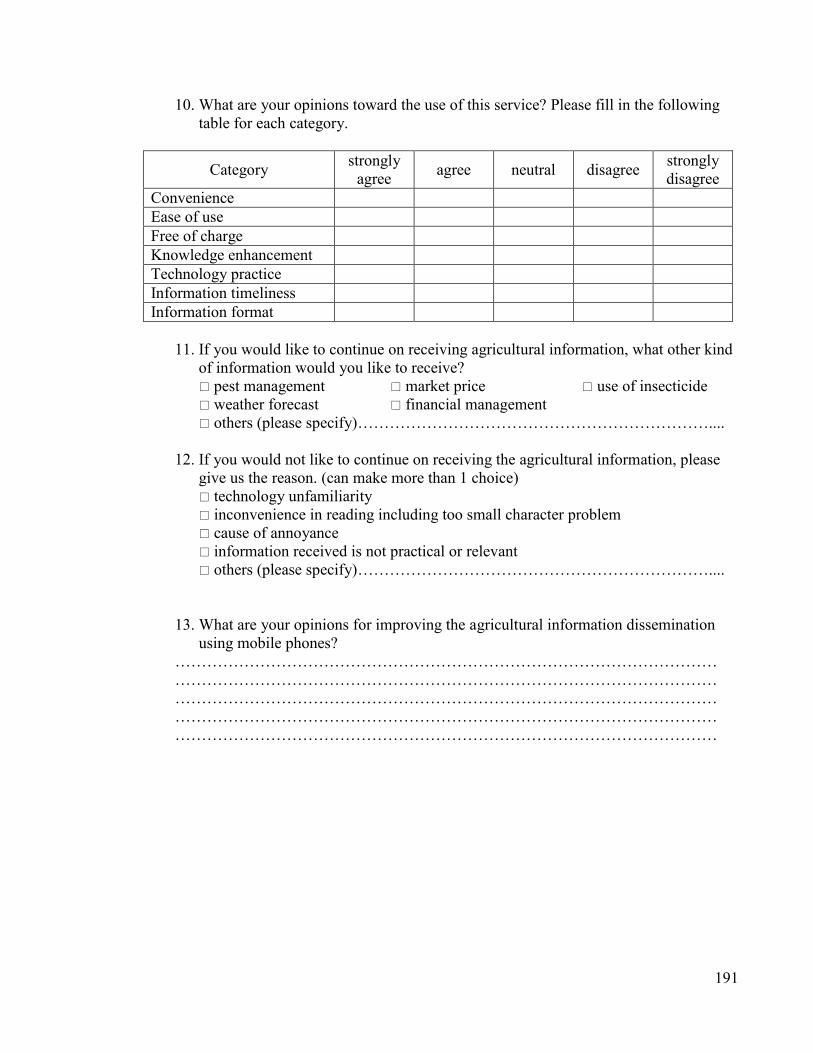
191
10. What are your opinions toward the use of this service? Please fill in the following table for each category.
Category strongly agree agree neutral disagree strongly
disagree Convenience Ease of use Free of charge Knowledge enhancement Technology practice Information timeliness Information format
11. If you would like to continue on receiving agricultural information, what other kind
of information would you like to receive? pest management market price use of insecticide weather forecast financial management others (please specify)…………………………………………………………....
12. If you would not like to continue on receiving the agricultural information, please give us the reason. (can make more than 1 choice) technology unfamiliarity inconvenience in reading including too small character problem cause of annoyance information received is not practical or relevant others (please specify)…………………………………………………………....
13. What are your opinions for improving the agricultural information dissemination
using mobile phones? ………………………………………………………………………………………… ………………………………………………………………………………………… ………………………………………………………………………………………… ………………………………………………………………………………………… …………………………………………………………………………………………

192
Appendix F: Data from the user satisfaction survey
Table F1 Valid percentages of male and female participants in each Village Gender Muang Soongmen Female 15.8 40.7 Male 84.2 59.3 Total 100 100 Table F2 Valid Percentages of Participants in Each Age Group in Each Village Age Muang Soongmen below 20 years old 0 0 21 – 30 years old 0 0 31 – 40 years old 1.8 1.7 41 – 50 years old 29.8 40.7 51 – 60 years old 54.4 39.0 over 61 years old 14.0 18.6 Total 100 100 Table F3 Valid Percentages of Participants in Each Educational Level in Each Village Education Muang Soongmen Primary school 66.7 86.4 Junior high school 17.5 8.5 High school/certificate 8.8 5.1 Undergraduate diploma 3.5 0 Bachelor degree or higher 3.5 0 Total 100 100 Table F4 Valid Percentages of Participants in Each Type of Marital Status in Each Village Marital Status Muang Soongmen Single 5.2 8.5 Married 93.0 89.8 Divorced /Separated 1.8 1.7 Total 100 100 Table F5 Valid Percentages of Participants in Each Family Size in Each Village Family members Muang Soongmen 1 - 2 people 14.0 6.8 3 - 4 people 77.2 71.2 5 or more people 8.8 22.0 Total 100 100

193
Table F6 Valid Percentages of Participants in Each Income Group in Each Village Income Muang Soongmen Less than 3000 baht 0 13.5 3001 – 5000 baht 0 40.7 5001 – 8000 baht 14.0 28.8 8001 – 10000 baht 43.9 15.3 10001 – 20000 baht 33.3 1.7 More than 20000 baht 8.8 0 Total 100 100 Table F7 Valid Percentages of Participants Requesting for Each Information Type in Each Village Information request Muang Soongmen The use of fertilizer 26.3 47.4 Soil improvement 61.4 8.5 Organic farming 12.3 44.1 Total 100 100 Table F8 Valid Percentages of Participant Preference for Information Delivery Frequency in Each Village before the Experiment Frequency Muang Soongmen Daily 22.8 0 Weekly 63.2 100 Fortnightly 14.0 0 Total 100 100 Table F9 Valid Percentages of Participant Preference for Information Delivery Frequency in Each Village after the Experiment Frequency Muang Soongmen Twice a day 3.5 0 Daily 43.9 1.8 Twice a week 7.0 25.4 Weekly 40.3 23.7 Fortnightly 5.3 23.7 Monthly 0 25.4 Total 100 100
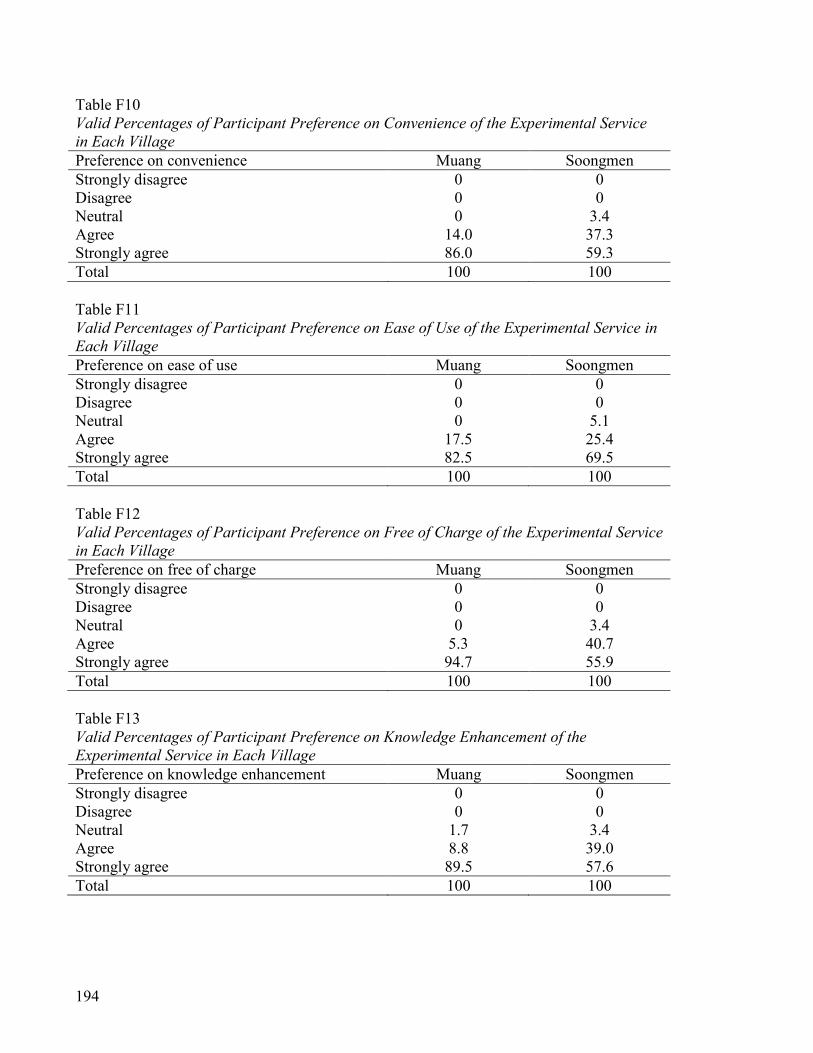
194
Table F10 Valid Percentages of Participant Preference on Convenience of the Experimental Service in Each Village Preference on convenience Muang Soongmen Strongly disagree 0 0 Disagree 0 0 Neutral 0 3.4 Agree 14.0 37.3 Strongly agree 86.0 59.3 Total 100 100 Table F11 Valid Percentages of Participant Preference on Ease of Use of the Experimental Service in Each Village Preference on ease of use Muang Soongmen Strongly disagree 0 0 Disagree 0 0 Neutral 0 5.1 Agree 17.5 25.4 Strongly agree 82.5 69.5 Total 100 100 Table F12 Valid Percentages of Participant Preference on Free of Charge of the Experimental Service in Each Village Preference on free of charge Muang Soongmen Strongly disagree 0 0 Disagree 0 0 Neutral 0 3.4 Agree 5.3 40.7 Strongly agree 94.7 55.9 Total 100 100 Table F13 Valid Percentages of Participant Preference on Knowledge Enhancement of the Experimental Service in Each Village Preference on knowledge enhancement Muang Soongmen Strongly disagree 0 0 Disagree 0 0 Neutral 1.7 3.4 Agree 8.8 39.0 Strongly agree 89.5 57.6 Total 100 100

195
Table F14 Valid Percentages of Participant Preference on Technology Practice of the Experimental Service in Each Village Preference on technology practice Muang Soongmen Strongly disagree 0 0 Disagree 0 0 Neutral 0 6.8 Agree 26.3 47.4 Strongly agree 73.7 45.8 Total 100 100 Table F15 Valid Percentages of Participant Preference on Information Timeliness of the Experimental Service in Each Village Preference on information timeliness Muang Soongmen Strongly disagree 0 0 Disagree 0 0 Neutral 0 8.5 Agree 14.0 42.4 Strongly agree 86.0 49.1 Total 100 100 Table F16 Valid Percentages of Participant Preference on Information Format of the Experimental Service in Each Village Preference on information format Muang Soongmen Strongly disagree 0 0 Disagree 0 0 Neutral 0 6.8 Agree 15.8 44.1 Strongly agree 84.2 49.1 Total 100 100 Table F17 Valid Percentages of Participants Who Further Requested Pest Management Information Pest management information Muang Soongmen Not required 29.8 88.1 Required 70.2 11.9 Total 100 100 Table F18 Valid Percentages of Participants Who Further Requested Use of Insecticide Information Use of insecticide information Muang Soongmen Not required 70.2 98.3 Required 29.8 1.7 Total 100 100

196
Table F19 Valid Percentages of Participants Who Further Requested Weather Forecast Information Weather forecast information Muang Soongmen Not required 100 89.8 Required 0 10.2 Total 100 100 Table F20 Valid Percentages of Participants Who Further Requested Market Price Information Market price information Muang Soongmen Not required 68.4 42.4 Required 31.6 57.6 Total 100 100 Table F21 Valid Percentages of Participants Who Further Requested Financial Management Information Financial management information Muang Soongmen Not required 78.9 76.3 Required 21.1 23.7 Total 100 100 Table F22 Valid Percentages of Participants Who Found Difficulty in Technology Unfamiliarity in Each Village Technology unfamiliarity Muang Soongmen No 100 81.4 Yes 0 18.6 Total 100 100 Table F23 Valid Percentages of Participants Who Found Difficulty in Too Small Text Size in Each Village Too small text size Muang Soongmen No 82.5 91.5 Yes 17.5 8.5 Total 100 100 Table F24 Valid Percentages of Participants Who Found Difficulty in Annoyance in Each Village Annoyance Muang Soongmen No 100 100 Yes 0 0 Total 100 100

197
Table F25 Valid Percentages of Participants Who Found Difficulty in Unpractical Information in Each Village Unpractical information Muang Soongmen No 100 96.6 Yes 0 3.4 Total 100 100