
Information asymmetry, the cost of debt, and credit events ... · Information asymmetry, ......
17
Information asymmetry, the cost of debt, and credit events: Evidence from quasi-random analyst disappearances ☆ François Derrien a , Ambrus Kecskés b, ⁎, Sattar A. Mansi c a HEC Paris, France b Schulich School of Business, York University, Canada c Virginia Polytechnic Institute and State University, United States article info abstract Article history: Received 7 December 2015 Received in revised form 3 May 2016 Accepted 4 May 2016 Available online 7 May 2016 We hypothesize that greater information asymmetry causes greater losses to debtholders. To test this, we identify exogenous increases in information asymmetry using the loss of an analyst that results from broker closures and broker mergers. We find that the loss of an analyst causes the cost of debt to increase by 25 basis points for treatment firms compared to control firms, and the rate of credit events (e.g., defaults) is roughly 100–150% higher. These results are driven by firms that are more sensitive to changes in information (e.g., less analyst coverage). The evidence is broadly consistent with both financing and monitoring channels, although only a financing channel explains the impact of the loss of an analyst on firms' cost of debt. © 2016 Elsevier B.V. All rights reserved. JEL classification: D80 G12 G24 G33 Keywords: Information asymmetry Cost of debt Default Bankruptcy Natural experiment Matching estimators Difference-in-differences Equity research analysts Creditors 1. Introduction Financial markets require value relevant information to efficiently allocate capital from the investors who have it to the firms that need it. It is therefore not surprising that the effect of information asymmetry on returns to investors has been thoroughly explored in theoretical work. 1 It is well established that there is a well-defined ordering of corporate securities based on their sen- sitivity to value relevant information: firms use internal financing first, then debt, and finally equity (Myers and Majluf, 1984). Importantly, the same theoretical work shows that the cost of even riskless debt is higher than the cost of internal financing be- cause of information asymmetry, and the effect of information asymmetry on the cost of external financing grows as the securities become more risky. Journal of Corporate Finance 39 (2016) 295–311 ☆ We greatly appreciate the comments of Thomas Bourveau, Gilles Hilary, and seminar participants at INSEAD. ⁎ Corresponding author. E-mail address: [email protected] (A. Kecskés). 1 e.g., see Leland and Pyle (1977); Stiglitz and Weiss (1981); Diamond (1985); Merton (1987), and Duffie and Lando (2001). http://dx.doi.org/10.1016/j.jcorpfin.2016.05.002 0929-1199/© 2016 Elsevier B.V. All rights reserved. Contents lists available at ScienceDirect Journal of Corporate Finance journal homepage: www.elsevier.com/locate/jcorpfin
Transcript of Information asymmetry, the cost of debt, and credit events ... · Information asymmetry, ......

Journal of Corporate Finance 39 (2016) 295–311
Contents lists available at ScienceDirect
Journal of Corporate Finance
j ourna l homepage: www.e lsev ie r .com/ locate / jcorpf in
Information asymmetry, the cost of debt, and credit events:Evidence from quasi-random analyst disappearances☆
François Derrien a, Ambrus Kecskés b,⁎, Sattar A. Mansi c
a HEC Paris, Franceb Schulich School of Business, York University, Canadac Virginia Polytechnic Institute and State University, United States
a r t i c l e i n f o
☆ We greatly appreciate the comments of Thomas Bo⁎ Corresponding author.
E-mail address: [email protected] (A. Kecs1 e.g., see Leland and Pyle (1977); Stiglitz and Weiss
http://dx.doi.org/10.1016/j.jcorpfin.2016.05.0020929-1199/© 2016 Elsevier B.V. All rights reserved.
a b s t r a c t
Article history:Received 7 December 2015Received in revised form 3 May 2016Accepted 4 May 2016Available online 7 May 2016
Wehypothesize that greater information asymmetry causes greater losses to debtholders. To testthis, we identify exogenous increases in information asymmetry using the loss of an analyst thatresults from broker closures and broker mergers. We find that the loss of an analyst causes thecost of debt to increase by 25 basis points for treatment firms compared to control firms, andthe rate of credit events (e.g., defaults) is roughly 100–150% higher. These results are driven byfirms that are more sensitive to changes in information (e.g., less analyst coverage). The evidenceis broadly consistent with both financing and monitoring channels, although only a financingchannel explains the impact of the loss of an analyst on firms' cost of debt.
© 2016 Elsevier B.V. All rights reserved.
JEL classification:D80G12G24G33
Keywords:Information asymmetryCost of debtDefaultBankruptcyNatural experimentMatching estimatorsDifference-in-differencesEquity research analystsCreditors
1. Introduction
Financial markets require value relevant information to efficiently allocate capital from the investors who have it to the firmsthat need it. It is therefore not surprising that the effect of information asymmetry on returns to investors has been thoroughlyexplored in theoretical work.1 It is well established that there is a well-defined ordering of corporate securities based on their sen-sitivity to value relevant information: firms use internal financing first, then debt, and finally equity (Myers and Majluf, 1984).Importantly, the same theoretical work shows that the cost of even riskless debt is higher than the cost of internal financing be-cause of information asymmetry, and the effect of information asymmetry on the cost of external financing grows as the securitiesbecome more risky.
urveau, Gilles Hilary, and seminar participants at INSEAD.
kés).(1981); Diamond (1985); Merton (1987), and Duffie and Lando (2001).

296 F. Derrien et al. / Journal of Corporate Finance 39 (2016) 295–311
There is also an abundance of empirical work that examines the determinants of returns to debtholders and especially the de-terminants of credit events (Altman, 1968; Ohlson, 1980, etc.). In this empirical work, information asymmetry is typically cap-tured by proxies such as firm size, asset tangibility, institutional ownership, and market microstructure measures. Moreover,there is growing empirical evidence that information asymmetry affects the structure of the firm's debt, for instance, its seniority,maturity, security, etc. (Rauh and Sufi, 2010; Colla et al., 2013).
In this paper, we take a different approach from using proxies for information asymmetry. Instead, we use the coverage of an-alysts – important information producers – to capture information asymmetry and two natural experiments to generate exoge-nous variation in analyst coverage. We are thereby able to ensure that we cleanly identify the causal effect of informationasymmetry on expected and actual losses to debtholders. This is important because analyst coverage can certainly impact returnsto investors, but it is also possible that analysts choose to cover firms based on the returns that they generate for their investors.By convincingly demonstrating causality, our results contribute to improving financial, corporate, and regulatory decision making.
As our starting point, our main hypothesis is that an increase in information asymmetry causes an increase in both expectedand actual losses to debtholders. To be more precise, by expected losses to debtholders, we mean the cost of debt, and by actuallosses to debtholders, we mean credit events (such as defaults). In perfect capital markets, expected losses to debtholders shouldaccurately predict actual losses. However, this relationship may be weakened in the presence of market imperfections. Addition-ally, firms may respond to an increase in information asymmetry by increasing their corporate disclosure (Balakrishnan et al.,2014). We therefore look at the effect of information asymmetry on both the short run (using the cost of debt) and the longrun (using the rate of credit events).
To study information asymmetry, we focus on the coverage of firms by equity research analysts. These analysts are importantinformation intermediaries that affect financial and real outcomes.2 Some firms are even willing to explicitly pay for analyst cov-erage (Kirk, 2011). The information that analysts generate affects debtholders directly – through information flowing from thestock market to the bond market (e.g., see Downing et al., 2009) – and indirectly — through the price of equity, itself an importantdeterminant of the price of debt (see Merton, 1974). Although debt analysts are certainly an important source of information fordebtholders, we focus on equity analysts because they provide value relevant information for debtholders while covering a muchbroader sample of firms, both in the cross-section and the time-series.3
We are mindful that analyst coverage is also generally endogenous to our outcomes of interest (McNichols and O'Brien, 1997).To study the causal effect of information asymmetry, we require exogenous variation in analyst coverage. We therefore use twonatural experiments: broker closures and broker mergers. As a result of both of these natural experiments, analysts are terminatedand thus the firms that they hitherto covered lose an analyst. The literature provides compelling evidence that our broker closuresand brokers mergers are motivated by business strategy factors of the broker and not by such factors as the stock performance oroperating performance of the firm clients of the broker (see Hong and Kacperczyk, 2010; Kelly and Ljungqvist, 2012; Derrien andKecskés, 2013). Additionally, we provide in sample evidence that they are plausibly exogenous to the cost of debt and creditevents.
We study the effect of this exogenous increase in information asymmetry on the cost of debt and credit events. In our empir-ical tests, we use a sample of 824 firms that lose an analyst as a result of 43 broker closures and broker mergers between 1994and 2008. We use a difference-in-differences approach to remove cross-sectional and time-series effects from our results. Tothis end, we compare treatment firms to control firms matched by industry, time, total assets, profitability, leverage, credit rat-ing, and analyst coverage. The two groups of firms are similar before the loss of an analyst in terms of our matching character-istics, the cost of debt, as well as analysts' expectations. This is consistent with the loss of an analyst being exogenous to the costof debt and credit events.
We find that the loss of an analyst causes an increase in the cost of debt of 25 basis points (from three months before to threemonths after) for our treatment firms compared to our control firms. This increase in the cost of debt is economically significantand plausible: the increase in the cost of debt translates into an increase in annual interest expense of $7 million for the typicalfirm in our sample. Moreover, for reasons that we explain in the next section, the loss of an analyst – and the attendant increasein information asymmetry – should be more costly for certain kinds of firms: firms with less analyst coverage, firms that havehigher leverage, firms with a lower credit rating, and firms with shorter debt maturity. Such firms can be viewed as financiallyconstrained or distressed. We find that the increase in the cost of debt is driven by the small minority of firms for which theloss of an analyst is most costly. For the large majority of firms, there is no effect. We also find that the increase in the cost ofdebt is driven by firms with the biggest increase in information asymmetry.
Our finding that the cost of debt increases as a result of an increase in information asymmetry suggests that expected losses todebtholders increase. We also examine whether actual losses to debtholders increase using the rate of various credit events dur-ing the years after the loss of an analyst. We find that the rate of defaults, delistings, and bankruptcies is significantly higher: allthree rates are roughly 100–150% higher for treatment firms than for control firms within the three years after the loss of an
2 This literature is vast. For prominent examples of the impact of analysts on stock prices, seeWomack (1996) and Lang et al. (2004); for liquidity, see Irvine (2001);for capital structure, see Chang et al. (2006); for corporate financing activities, see Dechow et al. (2000); and for earnings management, see Yu (2008).
3 During the past several decades, equity analysts cover approximately half of publicly traded firms, including those with little debt, roughly an order of magnitudemore firms than debt analysts. Moreover, debt analysts tend to cover firms with risky debt (Johnston et al., 2009). For such firms, debt responds similarly to new infor-mation as equity (Merton, 1974), particularly if the interests of bondholders and shareholders are aligned (De Franco et al., 2014).

297F. Derrien et al. / Journal of Corporate Finance 39 (2016) 295–311
analyst. Like for the cost of debt, we find that the higher rate of credit events is driven by firms for which the loss of an analyst ismost costly and firms with the biggest increase in information asymmetry. Moreover, we find that the rate of credit events is sig-nificantly higher when there is a bigger increase in the cost of debt. Overall, these results suggest that more information asym-metry causes more credit events and that bond spreads predict these credit events.
Additionally, we explore themechanisms through which analysts can affect market prices and the real economy. We identifytwo possible channels: the financing channel (analyst disappearances cause an increase in information asymmetry, which leadsto an increase in financing costs, as in Derrien and Kecskés, 2013), and the monitoring channel (analyst disappearances cause adecrease in external monitoring, as in Yu, 2008). These channels should affect firms differently depending on how financiallyconstrained they are. We examine the effect of the loss of an analyst conditional upon whether the firm is able to finance its in-vestment internally. We find that analyst disappearances affect firms at both ends of the spectrum of financial constraints. Spe-cifically, unconstrained firms increase their investment, and the decrease in their profitability suggests that they overinvest.However, this overinvestment does not affect their cost of debt or credit events because they are sound even to the point ofbeing able to issue more debt. By contrast, constrained firms are forced to issue less debt, and thus decrease their investment.The attendant increase in their profitability suggests that they underinvest. Finally, we find that financially constrained firmsexperience an increase in their cost of debt and credit events. In summary, the evidence is generally consistent with both chan-nels, but only the financing channel explains the increase in the cost of debt that we observe.
We contribute first to the literature on information asymmetry and the cost of debt as well as credit events. Our main result isthat greater information asymmetry causes higher expected and actual loss to debtholders. This supports the aforementioned clas-sics of the theoretical literature. Our result for the cost of debt also complements the empirical evidence of Tang (2009), thoughwe study a change in the quantity of information whereas he studies a refinement of a credit rating agency's interpretation of itsexisting information.
Our paper also argues and provides empirical evidence that information asymmetry causes higher actual losses to debtholders.We thus contribute to the literature on the prediction of credit events. Most papers in this literature predict credit events using avariety of accounting variables and stock market variables (especially market capitalization, returns, volatility, and market-to-book) (e.g., Shumway, 2001; Chava and Jarrow, 2004; Campbell et al., 2008). Our paper complements this burgeoning literaturewith causal evidence that information asymmetry also predicts credit events.
Similarly, our paper shows that changes in analyst coverage cause changes in the cost of debt and credit events. Separatingcause and effect is important because the information environment is endogenous to investor and firm behavior, but it is difficultto do and thus the subject of much debate. Although the connection between analyst coverage and the cost of debt and creditevents is conceptually clear, there is limited empirical evidence on bond market outcomes caused by debt or equity research an-alysts.4 Moreover, it is the three main credit rating agencies (Standard & Poor's, Moody's, and Fitch) and bond investors them-selves (almost exclusively institutional investors) that are generally held to be the main producers of external and internalresearch on bonds, respectively. Our results suggest that equity analysts working for brokers also produce research that is relevantto investors and firms through its impact on the bond market. Our results also shed new light on how information flows acrossfinancial markets (e.g., Ederington and Goh, 1998; Hotchkiss and Ronen, 2002; Acharya and Johnson, 2007; Cheng andSubramanyam, 2008; Downing et al., 2009).
Finally, our paper complements several recent papers that use the same type of shock to study the causal effects of informationasymmetry. Hong and Kacperczyk (2010) and Fong et al. (2014) study the bias in the output of equity research analysts and cred-it rating agencies, respectively. Kelly and Ljungqvist (2012) study stock prices, and Balakrishnan et al. (2014) study voluntary cor-porate disclosures. Irani and Oesch (2013, 2014) study financial and real earnings management, respectively. Finally, Derrien andKecskés (2013) study corporate policies. To their evidence, we add our own on the cost of debt and credit events. Moreover, wedistinguish between the main channels – financing and monitoring – that drive the results in this literature.
The rest of this paper is organized as follows. Section 2 presents the hypotheses. Section 3 presents the sample and data.Section 4 presents the main results for the cost of debt. Section 5 presents the main results for the rate of credit events.Section 6 examines the financing and monitoring channels. Section 7 concludes.
2. Hypotheses
Our starting point is classical theoretical work on the effect of information asymmetry on the cost of capital (Leland and Pyle,1977; Stiglitz and Weiss, 1981; Diamond, 1985, etc.). Further work establishes the increasing sensitivity of corporate securities toinformation about firm value, advancing from internal financing to debt and then to equity (Myers and Majluf, 1984). Importantly,while equity is more sensitive to information than debt, the various types of debt are also sensitive to information, if to a lesserextent than equity. Accordingly, we hypothesize that an increase in information asymmetry causes an increase in expected losses
4 We knowof only three other papers that study research analysts and the bondmarket. De Franco et al. (2009) and Johnston et al. (2009) study the characteristics ofthe recommendations of debt research analysts and the characteristics of the firms that they cover. Mansi et al. (2011) study analysts' earnings estimate accuracy, dis-persion, and revision volatility. These papers do not study analyst coverage and expected or actual losses to debtholders, and it is difficult for these studies to separatecause and effect.

298 F. Derrien et al. / Journal of Corporate Finance 39 (2016) 295–311
to debtholders. We capture an increase in information asymmetry as the loss of an analyst and expected losses to debtholders asthe cost of debt. Our first hypothesis therefore is:
H1. The loss of an analyst leads to an increase in the cost of debt.
In certain circumstances, a given increase in information asymmetry should be more costly than in others. Firms in such cir-cumstances can be viewed as being financially constrained or distressed. One particular circumstance in which the loss of an an-alyst should be more costly is for firms with less analyst coverage. This is because the loss of an analyst increases informationasymmetry more for firms with few other remaining analysts who decrease information asymmetry than for firms with manyother remaining analysts.
The loss of an analyst should also depend upon leverage, credit rating, and debt maturity. The loss of an analyst should bemore costly for firms that have higher leverage. It is well known that the payoff of a bond is equivalent to the payoff of the assetsof the firm plus a short position in a call option on the assets of the firm (Black and Scholes, 1973; Merton, 1973). This impliesthat the value of debt is more sensitive to changes in firm value for firms for which the market value of assets is closer to thebook value of debt, i.e., firms with higher leverage.
Similarly, the increase in the cost of debt caused by the loss of an analyst should be bigger for firms with bonds rated non-investment grade (closer to default) than for firms with bonds rated investment grade (further from default) because theyhave relatively less equity compared to debt in their capital structure. Finally, the loss of an analyst should be more costly forfirms with shorter debt maturity because they must refinance their existing debt sooner and thus incur higher interest expensesooner (Almeida et al., 2011).
Moreover, if the increase in information asymmetry caused by the disappearance of an analyst explains the increase in the costof debt, then the increase in the cost of debt should be bigger for firms for which the disappearance of the analyst has a biggereffect on information asymmetry. To summarize, then, our second hypothesis is:
H2. The loss of an analyst leads to a greater increase in the cost of debt for firms that have less analyst coverage, higher leverage, alower credit rating, shorter debt maturity, and a bigger increase in information asymmetry.
Furthermore, since information asymmetry affects corporate policies (Tang, 2009; Derrien and Kecskés, 2013, etc.), we wouldexpect it to increase the probability of default or bankruptcy. These credit events can result from a higher cost of debt if the firmlacks sufficient internal financing for its investments, so external financing is required but is now prohibitively expensive, and thefirm is rendered illiquid as a consequence. These credit events can also arise from the firm's investments becoming outright un-profitable at the newly higher cost of debt, thus leaving the firm insolvent. For these reasons, we hypothesize that an increase ininformation asymmetry causes an increase in actual losses to debtholders. We capture an increase in actual losses to debtholdersas credit events, specifically, defaults, delistings, and bankruptcies. Therefore, our third hypothesis is:
H3. The loss of an analyst leads to a higher rate of credit events.
Once again, a given increase in information asymmetry should naturally be more costly in certain circumstances than others.These circumstances can again be viewed as financial constraints or distress. The reasoning above for the cost of debt applied tocredit events generates our fourth hypothesis:
H4. The loss of an analyst leads to a higher rate of credit events for firms that have less analyst coverage, higher leverage, a lower creditrating, shorter debt maturity, and a bigger increase in information asymmetry.
Finally, we explore the mechanisms through which analysts affect market prices and the real economy. There is a large liter-ature that shows that analysts affect the firms that they follow. Broadly speaking, these studies can be divided into two categoriesaccording to the economic mechanism they postulate. In the first category (Kelly and Ljungqvist, 2012; Derrien and Kecskés,2013), the loss of an analyst leads to an increase in information asymmetry for the firm. This increases the cost of financing,which in turn forces firms to underinvest. We call this channel the “financing channel”.
In the second category (Yu, 2008; Irani and Oesch, 2013; Chen et al., 2015), the loss of an analyst leads to a decrease in mon-itoring of the firm. In this context, “monitoring” refers to analysts producing information that is used by investors and other eco-nomic agents to exert influence on the firm's managers so that they maximize shareholder value. In this manner, the loss of ananalyst increases agency problems and thus firms are able to overinvest. We call this channel the “monitoring channel”. Bothchannels are consistent with a decrease in firm value, through a higher cost of debt (and equity), but the mechanisms thatlead to these outcomes are very different.
Our goal is to understand how the loss of an analyst affects the cost of debt. The two channels should affect firms differentlydepending on whether firms need external financing to invest. According to the financing channel, the increase in the cost of ex-ternal financing should predominantly affect firms that are financially constrained, which should raise less financing and conse-quently underinvest. Holding fixed the cash flows of the firm's projects, underinvestment leads to an increase in profitability asthe firm funds only its most profitable projects and abandons the less profitable ones because it cannot afford to fund them.By contrast, firms that are not financially constrained should be largely unaffected by the increase in the cost of external financing.
Turning to the monitoring channel, the increase in agency problems should predominantly affect firms that are not financiallyconstrained. Such firms have sufficient internal financing to fund not just profitable projects but also unprofitable ones that

299F. Derrien et al. / Journal of Corporate Finance 39 (2016) 295–311
benefit managers at the expense of investors. As a result, they overinvest and their profitability decreases. By contrast, in firmsthat are financially constrained, managers have little opportunity to overinvest, so they should be largely unaffected by the de-crease in monitoring.
Under both channels, the loss of an analyst increases the firm's cost of debt. However, the financing channel predicts that thiseffect is stronger for financially constrained firms whereas the monitoring channel predicts that it mainly affects financially un-constrained firms. Our final hypothesis, then, is:
H5. The loss of an analyst leads to lower investment and higher profitability for firms that are financially constrained (the financingchannel), and higher investment and lower profitability for firms that are financially unconstrained (the monitoring channel).
3. Sample and data
To construct our sample, we first identify firms that lose an analyst because of broker closures and broker mergers. We thenmatch these treatment firms to similar control firms. Our objective is to estimate the effect of the loss of an analyst (the shock) onthe cost of debt and credit events (the response). We do so by comparing the differential response of our treatment firms andcontrol firms to the shock.
Our sample construction follows that of Derrien and Kecskés (2013), so we only summarize it here. The main difference is thatwe also require that firms have publicly traded bonds. We use I/B/E/S to identify brokers that disappear, as a result of closures ormergers, between 1994 and 2008. Since it is not always possible to reconcile broker disappearance dates with broker disappear-ance dates in I/B/E/S, we measure analyst coverage “before the broker disappearance date” at three months before the broker dis-appearance date and “after the broker disappearance date” at three months thereafter.5 While we do know the announcementdates of broker closures as well as the effective dates of broker mergers, these dates do not always match the broker disappear-ance dates from I/B/E/S.6 In order to capture the main effect of the broker disappearance, we use an event window of six months.Our list of broker disappearances includes all of Hong and Kacperczyk (2010)'s broker mergers that are during our sample periodand all of Kelly and Ljungqvist (2012)'s broker closures.
Next, we construct a list of firms covered by brokers during the year before their disappearance dates as well as the analystsworking for the brokers. Our assumption is that if an analyst has at least one earnings estimate in I/B/E/S for a firm during theyear before the broker disappearance date, he covers that firm. Similarly, our assumption is that if an analyst has no earnings es-timate in I/B/E/S for any firm during the year after the broker disappearance date, he disappears. We only retain firms for whichthe estimate is not “stopped” in I/B/E/S before the broker disappearance date. For broker closures, we retain firms for which theanalyst disappears from I/B/E/S during the year after the broker disappearance date. For broker mergers, we retain firms coveredby both the target broker and the acquirer broker before the merger and for which one of their analysts disappears. Our objectiveis to retain firms that lose an analyst exogenously.
Since we use both treatment firms and control firms in our empirical analysis, we impose the same restrictions on both groups offirms. We retain publicly traded U.S. operating firms that have been traded for at least one year. We require that candidate controlfirms have the same two-digit SIC code as our treatment firms. Industry matters because many determinants of the cost of debtand credit events are correlated across firms in the same industry. Next, wematch by credit rating and analyst coverage.Wemeasurecredit ratings on a 22-point scale corresponding to Standard & Poor's and/orMoody's ratings (22= AAA/Aaa, 21=AA+/Aa1,…, 4=CCC−/Caa3, 3 = CC/Ca, 2 = C/Ca, 1 = D/C). We require the credit rating of treatment firms and candidate control firms to differ bythree points or less on this scale.7We then require that the analyst coverage of treatment firms and candidate control firms differs byfive analysts or less. We retain candidate control firms that have the smallest difference in number of analysts to the correspondingtreatment firms. Finally, wematch based on total assets, profitability, and leverage.8 To this end, we compute the difference betweentreatment firms and controls firms for each of these three variables. We then compute the rank of the difference for each variable aswell as the total rank across all three variables. We retain candidate control firms that have the lowest total rank.
As a result, our treatment firms and control firms are matched by industry, time, total assets, profitability, leverage, credit rating, andanalyst coverage. Our matching is similar in spirit to that of the aforementioned papers using broker closures and broker mergers. How-ever, we design our matching to ensure that our treatment firms and control firms are similar in terms of the standard determinants ofthe cost of debt and credit events thatwe study. Our sample comprises 824 treatmentfirms and the same number of control firms. In oursample, we have 43 broker disappearances of which 17 are the result of broker closures and 26 are the result of broker mergers.
Analyst data are from I/B/E/S. Stock trading data are from CRSP and accounting data are from Compustat. Debt issuance data arefrom SDC. Bondmarket data are from the Lehman Brothers Fixed Income Database until 2006 and from TRACE thereafter, and bank-ruptcy filings data are from SDC. Both the Lehman Brothers database and the TRACE database contain bond-level data, but the former
5 We also refer to these points in time as “before the loss of an analyst” and “after the loss of an analyst”, respectively.6 Strictly speaking, I/B/E/S does not contain data on broker disappearance dates, but we can infer when brokers disappear based on when their earnings estimates
data stop. These broker disappearance dates can differ frombroker closure announcement dates or brokermerger effective dates by severalmonths. Nevertheless, thesedifferences in dates are not errors because analysts can be terminated shortly before or shortly after broker closure dates or broker merger dates and they are not nec-essarily terminated exactly on these dates.
7 For example, a treatment firmwith a BB+ rating, the highest possible non-investment grade rating, must bematched to a candidate control firmwith a BBB+ rat-ing or lower or a B+ rating or higher.
8 We use the standard definitions of profitability and leverage. Specifically, we define profitability as EBITDA divided by total assets, and we define leverage as long-term debt divided by total assets.

300 F. Derrien et al. / Journal of Corporate Finance 39 (2016) 295–311
containsmonthly frequency data whereas the latter contains trade frequency data.We collapse the TRACE data from trade frequencyto monthly frequency in order to extend our bond market data beyond 2006 when the Lehman Brothers data end. From both data-bases, we obtain bond-level data on yields, credit ratings, amounts outstanding, and durations.Wewinsorize all continuous variablesat the 2.5th and 97.5th percentiles. Our choice is motivated by the fact that our sample size is small (824 observations), thuswinsorizing at the usual 1st and 99th percentiles only mitigates the potential influence of 2 × 8 = 16 extreme observations.
The yield of afirm from the secondary bondmarket is clearly a goodmeasure of the cost of debt. First and foremost, these yields areavailable for a large sample of firms, and they change regularly as the expectations of investors change. This is not the case for the costof debtmeasured as the yield on public or private debt at issuance or on bank loans at origination. Suchmeasures are only observablewhen the firm borrows and if it borrows. Credit default swap spreads are not a good solution to this problem either because they areonly available in recent years and for a small sample of firms. Second, it is impractical to study how the cost of debt changes using suchmeasures sincemost firms do not borrow on a monthly or even quarterly basis, so the cost of debt is not available with sufficient fre-quency. Third andfinally,with these important caveats inmind,we compare bondyieldsmeasured using debt offerings to thosemea-sured using the secondary bond market. We find that they are highly correlated.9
Our broker disappearances should result in firms losing an analyst. To test whether this is the case in our sample, we computethe change in analyst coverage for our treatment firms compared to our control firms during the six months centered on the endof the month of the broker disappearance date. We find that analyst coverage of our treatment firms decreases by 0.89 analystsmore than our control firms (with a t-statistic of −5.87). Thus our broker disappearances are associated with the loss of roughlyone analyst, which is what we expect given our sample construction.10
Since we use a difference-in-differences approach, it is important that our treatment firms be similar to our control firms. Thisis why we match treatment firms to control firms. If we are successful, then our difference-in-differences approach implementedwith our two natural experiments ensures that the variation in our independent variable (analyst coverage) and the variation inour dependent variables (the cost of debt and credit events) are not caused by variation in some third group of variables that arecommon to the first two groups. Consequently, we do not also have to control for cross-sectional and time-series effects that af-fect both of our first two groups of variables. At the same time, we require our sample firms to have publicly traded bonds be-cause the associated data are necessary for our analysis of the cost of debt. As a result, while our sample firms arerepresentative of firms with publicly traded bonds, they tend to be bigger and have higher leverage, more analyst coverage,and lower risk than publicly traded firms in general.
To examine the success of our matching, we test the equality of the medians as well as the distributions (using the Kolmogo-rov–Smirnov test) of various variables for our treatment firms and control firms. The first group of variables is our matching var-iables: total assets, profitability, leverage, credit rating, and analyst coverage. Since our control firms have the same two-digit SICcode as our treatment firms by construction, we do not examine industry as a matching variable. The second group of variables isbond market variables: the yield and duration of a firm's bonds as well as the amount of its long-term debt. The third group ofvariables is other standard variables: market capitalization, market-to-book, and volatility. We measure all variables before theloss of an analyst. Note that we cannot examine the rate of credit events before the loss of an analyst: once a firm has a default,delisting, or bankruptcy event, it disappears for practical purposes.
Table 1 presents the results. For all of our variables (matching, bond market, and other standard variables), our treatmentfirms are very similar to our control firms before the loss of an analyst. None of the differences are economically or statisticallysignificant. The median yield for our treatment firms is 711 basis points, and their median credit rating is 15 (equivalently,BBB+/Baa1). Their median leverage is roughly 29%, and the median firm has long-term debt of $2.9 billion. Overall, our treatmentfirms appear to be well matched to our control firms.
Similarly, we examinewhether our treatment firms are similar to our control firms in terms of information asymmetry before theloss of an analyst. We use and compute the same five proxies for information asymmetry as Kelly and Ljungqvist (2012): the bid-askspread, the Amihud liquidity measure, the ratio of zero and missing returns days to total days, the magnitude of earnings announce-ment surprises, and the volatility of the market reaction to earnings announcements. Table 1 shows that, before our treatment firmslose an analyst, the information asymmetry proxies for our treatment firms are similar to those for our control firms.
We also examine whether changes in the cost of debt and in credit events are anticipated before the loss of an analyst. Table 1shows that our treatment and control firms are similar based on the past, but they may be different based on expectations of thefuture. To examine this possibility, we compare analysts' expectations for our treatment firms and control firms. We use four mea-sures of analysts' expectations: earnings estimates for the next fiscal year, investment recommendations, long-term earningsgrowth rate estimates, and price targets. We compute all analysts' expectations variables as the mean expectations of all analystscovering the firm, and we measure them before the loss of an analyst. As Table 1 shows, our treatment firms are also similar toour control firms in terms of analysts' expectations. This further suggests that the disappearance of brokers and analysts is exog-enous to changes in the cost of debt and credit events.
Finally, we examine whether our brokers and analysts produce relevant research. If this is not the case, then they should notaffect the cost of debt or credit events. (For expositional simplicity, we do not tabulate these results.) First, we find that a broker
9 For a sample of all publicly traded firms that are comparable to our treatmentfirms and controlfirms, less than 5% of those that have secondary bondmarket data ona monthly basis also have debt offering data. For these firms, the simple correlation between bond yields is almost 0.5.10 We also examine the evolution of analyst coverage during the years before the loss of an analyst (not tabulated). Themean difference between treatmentfirms andcontrolfirms in analyst coverage is roughly horizontal during this period and is not statistically significant. Our decreases in analyst coverage are clearly not part of long-term trends in analyst coverage but instead are one-time decreases.

Table 1Descriptive statistics.This table presents descriptive statistics that compare treatment firms and control firms. The sample comprises 824 treatment firms that lose an analyst between 1994and 2008 because of broker closures and broker mergers and the same number of control firms matched by industry, time, total assets, profitability, leverage, creditrating, and analyst coverage. Both groups of firms are publicly traded U.S. operating firms that have been traded for at least one year. Credit ratings are measured ona 22-point scale corresponding to Standard & Poor's and/or Moody's ratings (22 = AAA/Aaa, 21 = AA+/Aa1,…, 4 = CCC−/Caa3, 3 = CC/Ca, 2 = C/Ca, 1 = D/C).Profitability is EBITDA divided by total assets. Leverage is long-term debt divided by total assets. Volatility is the annualized standard deviation of daily stock returns.The bid-ask spread is computed as the mean during the year of the daily ask price minus the bid price all divided by the mean of the ask price and the bid price. TheAmihud liquidity measure is computed as the mean during the year of the daily absolute value of the stock return divided by the dollar value of trading volume. Theratio of zero and missing returns days to total days is computed as the number of trading days with zero or missing returns during the year divided by the numberof trading days during the year. The earnings announcement surprise is computed as themean during the year of the quarterly absolute value of the difference betweenactual earnings and expected earnings divided by the stock price. The earnings announcements volatility is computed as themean during the year of the quarterly vol-atility of the three-daymarket reaction to earnings announcements. Analysts' expectations variables are computed as themean expectations of all analysts covering thefirm, and they comprise the following: earnings estimates for the next fiscal yearmeasured as a percent of the stock price; investment recommendationsmeasured on afive-point scale (a higher value of whichmeansmore a favorable recommendation); long-term earnings growth rate estimates for the next five years; and price targetsfor the next year measured as a percent of the stock price. All variables are measured before the loss of an analyst.
25th percentile Median 75th percentile p-value of testof equalityof medians
p-value of testof equality ofdistributions
Treatmentfirms
Controlfirms
Treatmentfirms
Controlfirms
Treatmentfirms
Controlfirms
Matching variablesTotal assets ($M) 4705 3953 11,985 11,012 33,428 30,573 0.127 0.322Profitability 6.4% 7.1% 12.0% 12.2% 16.6% 17.8% 0.522 0.174Leverage 19.2% 20.0% 28.6% 28.8% 39.6% 38.8% 0.588 0.422Credit rating (22-point scale) 13.0 13.0 15.0 15.0 17.0 17.0 0.767 0.827Number of analysts 16.0 16.0 21.0 21.0 27.0 26.5 0.183 0.539
Bond market variablesYield (bps) 573 566 711 709 790 791 0.921 0.507Duration (years) 4.9 5.0 6.5 6.3 8.5 8.5 0.460 0.498Long-term debt ($M) 1270 1118 2891 2653 8043 6370 0.168 0.322
Other standard variablesMarket capitalization ($M) 3305 3061 8670 8065 22,761 21,772 0.522 0.538Market-to-book 1.35 1.46 2.07 2.06 3.28 3.21 0.960 0.425Volatility 26.1% 25.0% 34.4% 33.9% 44.6% 44.2% 0.218 0.387
Information asymmetry variablesBid-ask spread 0.15% 0.15% 0.72% 0.76% 1.14% 1.13% 0.531 0.665Amihud liquidity measure 0.01% 0.01% 0.04% 0.05% 0.13% 0.13% 0.301 0.580Returns ratio 0.8% 0.8% 2.4% 2.4% 5.1% 4.8% 0.961 0.789Earnings announcement surprise 0.05% 0.05% 0.12% 0.10% 0.30% 0.26% 0.384 0.363Earnings announcement volatility 28.5% 28.4% 39.1% 39.0% 55.0% 54.4% 0.749 0.921
Analysts' expectations variablesEarnings estimates 4.3% 4.5% 6.2% 6.3% 8.3% 8.2% 0.825 0.322Investment recommendations 3.5 3.5 3.8 3.8 4.1 4.1 0.622 0.621Long-term earnings growth rate estimates 9.8% 9.4% 12.1% 12.4% 15.1% 15.7% 0.568 0.524Price targets 11.5% 10.8% 23.4% 21.6% 45.6% 44.7% 0.404 0.485
301F. Derrien et al. / Journal of Corporate Finance 39 (2016) 295–311
that closes, or at least one of the brokers that merge, is a leader in research according to Institutional Investor magazine, for 67% ofour sample firms.11 In other words, our brokers are typically research powerhouses. Second, we examine the earnings estimateaccuracy of our brokers and analysts using relative earnings estimate accuracy, a standard measure of research quality (e.g., seeMikhail et al. (1999) and Hong and Kubik (2003)). We find that the accuracy of both our brokers and analysts is slightlyabove average. Moreover, very few (4%) of our analysts fall into the very low accuracy group (the bottom quartile) that the lit-erature finds drives analysts' career outcomes. Lastly, we find that the expectations of analysts who cover treatment firms anddisappear, and the mean expectations of all other analysts who cover treatment firms, are similar.
4. Main results for the cost of debt
4.1. The increase in the cost of debt
We now examine whether the loss of an analyst leads to an increase in the cost of debt (H1). We begin our analysis by com-puting the mean change in the cost of debt from three months before the loss of an analyst to three months thereafter for our
11 Institutional Investormagazine publishes an annual survey of money managers. Investors vote for the best research analysts, and the winners are declared “star”analysts. The brokers with the greatest number of star analysts, around 15 each year, are declared “leading” brokers.

302 F. Derrien et al. / Journal of Corporate Finance 39 (2016) 295–311
treatment firms (the treatment difference), our control firms (the control difference), and the difference between ourtreatment firms and control firms (the difference-in-differences). Throughout the paper, we focus on the mean difference-in-differences.
We measure the cost of debt of a firm as follows. Broadly, our objective is to adjust raw yields for two systematic risk factors:maturity and default (see Fama and French, 1993). First, to adjust for systematic maturity risk, we compute the yield spread of abond issue as the difference between the yield to maturity of the bond issue and the yield to maturity of a duration matched Trea-sury bond. If there is no Treasury bond with the same duration, we interpolate a Treasury bond yield to maturity. We then com-pute the yield spread of a firm as the weighted average yield spread of its bond issues using as weights the amount outstanding ofthe bond issue divided by the total amount outstanding of all bond issues of the firm.
Second, to adjust for systematic default risk, we compute excess spreads of a firm as the spread of the firm minus the spread ofa portfolio of firms matched by credit rating. We compute the spread of a portfolio of firms as the weighted average spread of itsfirms using as weights the amount outstanding of the firm's bonds divided by the total amount outstanding of all bonds of allfirms in the portfolio. We use two portfolios: one investment grade and one non-investment grade. Hereafter, we use these excessspreads as our measure of the cost of debt.12
Table 2 presents the results in Panel A. The cost of debt increases by 25 basis points after the loss of an analyst. The magnitudeof the increase in the cost of debt is economically significant. Using median long-term debt of $2.9 billion from Table 1, we com-pute the increase in the cost of debt caused by the loss of an analyst. It translates into an increase in annual interest expense of $7million for the typical firm in our sample. By way of comparison, we consider related research on exogenous credit rating refine-ments, which decrease information asymmetry, on the cost of debt. Kliger and Sarig (2000) find that the cost of debt increases by41–64 basis points (depending on the event window) for firms with higher credit ratings after refinement compared to firms withlower credit ratings after refinement. The corresponding figure from Tang (2009) is 20 basis points (both papers study the sameevent but their sample of firms differs). Therefore, the loss of an analyst has an effect on a firm's cost of debt of similar magnitudeas other events that affect the firm's information asymmetry.13
We perform several robustness tests of our results. For expositional simplicity, we summarize the results rather than tabulat-ing them. First, we use propensity score matching rather than characteristics matching. Using all firms between 1994 and 2008,we run a probit regression to estimate propensity scores. We regress a dummy variable that equals one for treatment firms andzero for control firms on total assets, profitability, leverage, credit rating, analyst coverage, two-digit SIC code dummy variables,and calendar year dummy variables. We match each treatment firm to a control firm in the same industry and same year withthe nearest predicted propensity score. Using this methodology, we find similar results to characteristics matching. As an alterna-tive, we run regressions in which we control for our matching variables, and we find similar results to our difference-in-differences approach.
Additionally, we examine the change in the cost of debt separately for the small number of broker disappearances each ofwhich causes a large number of firms to lose an analyst. To this end, we collapse our observations by broker to avoid givingmore weight to broker disappearances that cause a large number of firms to lose an analyst. For each broker, we use the meanchange in the cost of debt. We find that the results for the top 10, 15, and 20 brokers (ranked by the number of firms thatlose an analyst) are smaller but still economically and statistically significant. Finally, we examine whether our results can be ex-plained by the financials and utilities that we retain in our sample. When we exclude such firms, we find that our results aresimilar.
Returning to our main analysis, we also examine whether the loss of an analyst leads to a greater increase in the cost of debtwhen the loss of an analyst is more costly. Specifically, the loss of an analyst should be more costly for firms that have less analystcoverage, have higher leverage, have a lower credit rating, and have shorter debt maturity (H2).
We first examine graphically whether the increase in the cost of debt is significant for a given level of our conditioning variables.For each conditioning variable, we sort firms into quartiles and examine the mean difference-in-differences in the cost of debt (as inPanel A of Table 2) in each quartile. For credit rating, we sort firms into the following categories, which are more natural than quar-tiles: BB+ or lower (21% of our observations), BBB- to BBB+ (31%), A- to A+ (37%), and AA- or higher (11%). Wemeasure all of ourconditioning variables using only treatment firms, and we measure them before the loss of an analyst.
Fig. 1 presents the results. For analyst coverage, the increase in the cost of debt is 70 basis points in the bottom quartile and isboth economically and statistically significant. By contrast, the change in the cost of debt for firms that have more analyst cover-age (in the top three quartiles) is much smaller and is not statistically significant. Similarly, the increase in the cost of debt is 68basis points in the top quartile of leverage, 128 basis points for firms with non-investment grade credit ratings (BB+ or lower),and 70 basis points for firms in the bottom quartile of debt maturity. In all three cases, the increase in the cost of debt is botheconomically and statistically significant. By contrast, the increase in the cost of debt is economically much smaller and is not sta-tistically significant for firms in the bottom three quartiles of leverage, for firms with investment grade credit ratings (BBB- orhigher), and for firms in the top three quartiles of debt maturity.
12 Strictly speaking, we are being conservative in using adjusted yields rather than raw yields because our treatment firms arematched to our control firms by indus-try, total assets, profitability, leverage, credit rating, and analyst coverage. Our results are similar if we use raw yields instead of adjusted yields.13 We also examine the evolution of the cost of debt during the years before the loss of an analyst (not tabulated). Themean difference between treatment firms andcontrol firms in the cost of debt is roughly horizontal during this period and is not statistically significant. The increase in the cost of debt is clearly not part of long-termtrends in the cost of debt but instead is a one-time increase. This result provides supportive evidence for the parallel trends assumption underlying our difference-in-differences approach.

Table 2The effect of the loss of an analyst on the cost of debt unconditionally and conditional upon analyst coverage, leverage, credit rating, and debt maturity.This table presents the change in the cost of debt caused by the loss of an analyst unconditionally and conditional upon analyst coverage, leverage, credit rating, anddebtmaturity. The sample comprises 824 treatment firms that lose an analyst between 1994 and 2008 because of broker closures and brokermergers and the same numberof control firmsmatched by industry, time, total assets, profitability, leverage, credit rating, and analyst coverage. Both groups of firms are publicly traded U.S. operatingfirms that have been traded for at least one year. In Panel A, themean change in the cost of debt between after the loss of an analyst to before is computed for treatmentfirms (the treatment difference), control firms (the control difference), and the difference between treatment firms and control firms (the difference-in-differences). InPanel B, themean difference-in-differences in the cost of debt (as in Panel A) is computed for firms covered by few analysts, for firms covered bymany analysts, and forthe difference between the two differences-in-differences. In Panel C through Panel E, the same approach is followed for firmswith high leverage and low leverage, forfirmswith a non-investment grade credit rating andwith an investment grade credit rating, and forfirmswith short debtmaturity and long debtmaturity, respectively.The cost of debt ismeasured in basis points. An investment grade rating is a rating of BBB−/Baa3 or higher. All conditioning variables aremeasured using only treatmentfirms, and they aremeasured before the loss of an analyst. ***, **, and * indicate statistical significance at the 1%, 5%, and 10% levels, respectively. Statistical significance isonly tabulated in Panel A for the mean of the difference-in-differences and in Panel B through Panel E for the mean of the triple differences.
Panel A: Unconditionally
Mean treatment difference(month +3 versus month −3)
Mean control difference(month +3 versus month −3)
Mean of difference-in-differences(treatments versus controls)
t-statistic fordifference-in-differences
43.3 18.6 24.7** 2.58
Panel B: difference-in-differences conditional upon analyst coverage at month −3
Mean for quartile 1 (few)(N = 209)
Mean for quartiles 2–4 (many)(N = 615)
Mean for few versus many t-statistic for few versusmany
70.1 9.0 61.1*** 3.00
Panel C: difference-in-differences conditional upon leverage at month −3
Mean for quartile 4 (high)(N = 206)
Mean for quartiles 1–3 (low)(N = 618)
Mean for high versus low t-statistic for high versuslow
68.3 9.9 58.4*** 2.81
Panel D: difference-in-differences conditional upon credit rating at month −3
Mean for non-investment grade rating(low) (N = 171)
Mean for investment grade rating(high) (N = 653)
Mean for low versus high t-statistic for low versushigh
128.5 −2.7 131.2*** 5.51
Panel E: difference-in-differences conditional upon debt maturity at month −3.
Mean for quartile 1 (short)(N = 206)
Mean for quartiles 2–4 (long)(N = 618)
Mean for short versus long t-statistic for short versuslong
70.3 9.3 61.0*** 2.95
303F. Derrien et al. / Journal of Corporate Finance 39 (2016) 295–311
In summary, the panels in the figure show that the effect on the cost of debt of the loss of an analyst is concentrated in firmswith low analyst coverage, high leverage, non-investment grade credit ratings, and short debt maturity, as predicted (H2). Morestrongly, our results are driven by firms with the least analyst coverage, the highest leverage, non-investment grade credit ratings,and the shortest debt maturity. While the loss of an analyst should not matter much for the average firm, it might significantlyaffect the aforementioned types of firms. Indeed, our findings indicate that except for this small minority of firms, the loss ofan analyst has no effect on the cost of debt.
To test this formally, we use a triple difference approach. For each conditioning variable, we sort firms into two groups basedon the values of the conditioning variable. For each group, we calculate the mean difference-in-differences in the cost of debt,i.e., the mean change in the cost of debt around analyst disappearances (as in Panel A of Table 2 and Fig. 1). Then we obtain atriple difference estimate by computing the difference between the differences-in-differences of each group. For analyst coverage,we compare firms in the bottom quartile to firms in the top three quartiles because Fig. 1 clearly shows that the effect of the lossof an analyst is concentrated in the bottom quartile. Based on the same reasoning, we compare firms in the top quartile of lever-age to firms in the bottom three quartiles. For credit ratings, we compare firms with non-investment grade credit ratings to firmswith investment grade credit ratings. Finally, for debt maturity, we compare firms in the bottom quartile to firms in the top threequartiles.
Table 2 presents the results in Panel B through Panel E. The increase in the cost of debt is 61 basis points bigger for the firmswith the least analyst coverage compared to other firms. Similarly, the increase in the cost of debt is 58 basis points bigger forfirms with high leverage compared to firms with low leverage and 131 basis points bigger for firms with non-investmentgrade credit ratings compared to firms with investment grade credit ratings. Finally, for debt maturity, the cost of debt increasesby 61 basis points more for firms with short debt maturity than for firms with long debt maturity. In all four cases, the triple dif-ference is both economically and statistically significant.
The results are consistent with (H2): the increase in the cost of debt is driven by firms for which the loss of an analyst is morecostly, i.e., firms that have less analyst coverage, have higher leverage, have a lower credit rating, and have shorter debt maturity.

Fig. 1. The increase in the cost of debt conditional upon analyst coverage, leverage, credit rating, and debt maturity. This figure presents the mean change in thecost of debt caused by the loss of an analyst conditional upon analyst coverage, leverage, credit rating, and debt maturity. The sample comprises 824 treatmentfirms that lose an analyst between 1994 and 2008 because of broker closures and broker mergers and the same number of control firms matched by industry,time, total assets, profitability, leverage, credit rating, and analyst coverage. Both groups of firms are publicly traded U.S. operating firms that have been tradedfor at least one year. The change in the cost of debt is computed as the mean difference-in-differences in the cost of debt: the difference between after the lossof an analyst and before, and the difference between treatment firms and control firms. All conditioning variables are measured using only treatment firms,and they are measured before the loss of an analyst. The figure presents means (columns) as well as 5% and 95% confidence bounds (vertical lines).
304 F. Derrien et al. / Journal of Corporate Finance 39 (2016) 295–311
Alternatively, our results can be interpreted as supporting the notion that the loss of an analyst is concentrated in firms that arefinancially constrained or distressed.
4.2. The increase in the cost of debt conditional upon the increase in information asymmetry
Our hypothesis is that information asymmetry increases for firms that lose an analyst, which leads to an increase in their costof debt. Furthermore, the greater is the information asymmetry shock, the greater should be the increase in the cost of debt (H2).We cannot test this hypothesis directly because all of our treatment firms lose exactly one analyst, so there is no cross-sectionalvariation in the magnitude of the information asymmetry shock. Instead, we provide an indirect test of this hypothesis.
For each firm in our sample, we compute the change in information asymmetry caused by the loss of an analyst using thesame five proxies for information asymmetry as before. In particular, for each proxy, we compute the difference between afterthe loss of an analyst and before, and the difference between treatment firms and control firms.14 This allows us to identifyfirms for which the loss of an analyst has a big versus small impact on information asymmetry, and thus to test whether thereis a greater increase in cost of debt when the increase in information asymmetry itself is greater. For each information asymmetryproxy, we sort firms into quartiles. We classify firms in the top quartile as having a big change in information asymmetry, and weclassify firms in the bottom three quartiles as having a small change.
Fig. 2 presents the results. For all five proxies for information asymmetry, the bigger is the increase in information asymmetryfollowing the disappearance of an analyst, the bigger is the increase in the cost of debt. Moreover, the increase in the cost of debtis only statistically significant for firms with the biggest increase in information asymmetry. For firms in the top quartile of thechange in information asymmetry, the increase in the cost of debt ranges from 61 to 137 basis points and is always statisticallysignificant. For firms in the bottom three quartiles, the change in the cost of debt is small and generally not statistically significant.
14 Consistent with Kelly and Ljungqvist (2012), we find that information asymmetry increases on average for firms that lose an analyst (not tabulated).
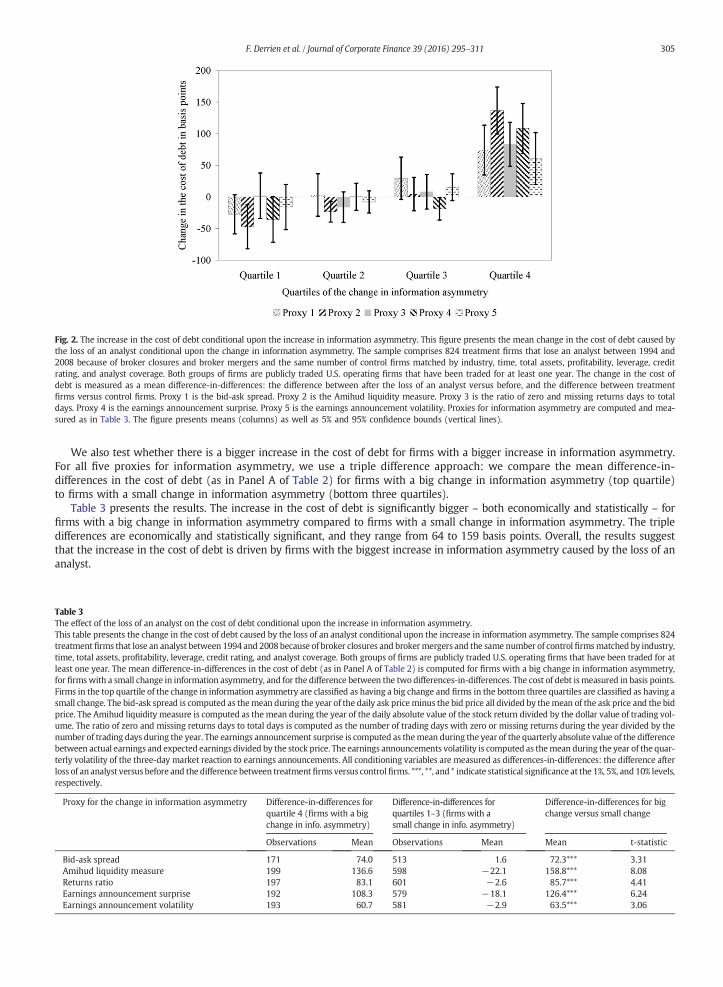
Fig. 2. The increase in the cost of debt conditional upon the increase in information asymmetry. This figure presents the mean change in the cost of debt caused bythe loss of an analyst conditional upon the change in information asymmetry. The sample comprises 824 treatment firms that lose an analyst between 1994 and2008 because of broker closures and broker mergers and the same number of control firms matched by industry, time, total assets, profitability, leverage, creditrating, and analyst coverage. Both groups of firms are publicly traded U.S. operating firms that have been traded for at least one year. The change in the cost ofdebt is measured as a mean difference-in-differences: the difference between after the loss of an analyst versus before, and the difference between treatmentfirms versus control firms. Proxy 1 is the bid-ask spread. Proxy 2 is the Amihud liquidity measure. Proxy 3 is the ratio of zero and missing returns days to totaldays. Proxy 4 is the earnings announcement surprise. Proxy 5 is the earnings announcement volatility. Proxies for information asymmetry are computed and mea-sured as in Table 3. The figure presents means (columns) as well as 5% and 95% confidence bounds (vertical lines).
305F. Derrien et al. / Journal of Corporate Finance 39 (2016) 295–311
We also test whether there is a bigger increase in the cost of debt for firms with a bigger increase in information asymmetry.For all five proxies for information asymmetry, we use a triple difference approach: we compare the mean difference-in-differences in the cost of debt (as in Panel A of Table 2) for firms with a big change in information asymmetry (top quartile)to firms with a small change in information asymmetry (bottom three quartiles).
Table 3 presents the results. The increase in the cost of debt is significantly bigger – both economically and statistically – forfirms with a big change in information asymmetry compared to firms with a small change in information asymmetry. The tripledifferences are economically and statistically significant, and they range from 64 to 159 basis points. Overall, the results suggestthat the increase in the cost of debt is driven by firms with the biggest increase in information asymmetry caused by the loss of ananalyst.
Table 3The effect of the loss of an analyst on the cost of debt conditional upon the increase in information asymmetry.This table presents the change in the cost of debt caused by the loss of an analyst conditional upon the increase in information asymmetry. The sample comprises 824treatment firms that lose an analyst between 1994 and 2008 because of broker closures and brokermergers and the same number of control firmsmatched by industry,time, total assets, profitability, leverage, credit rating, and analyst coverage. Both groups of firms are publicly traded U.S. operating firms that have been traded for atleast one year. The mean difference-in-differences in the cost of debt (as in Panel A of Table 2) is computed for firms with a big change in information asymmetry,for firmswith a small change in information asymmetry, and for the difference between the two differences-in-differences. The cost of debt ismeasured in basis points.Firms in the top quartile of the change in information asymmetry are classified as having a big change and firms in the bottom three quartiles are classified as having asmall change. The bid-ask spread is computed as themean during the year of the daily ask price minus the bid price all divided by themean of the ask price and the bidprice. The Amihud liquidity measure is computed as the mean during the year of the daily absolute value of the stock return divided by the dollar value of trading vol-ume. The ratio of zero and missing returns days to total days is computed as the number of trading days with zero or missing returns during the year divided by thenumber of trading days during the year. The earnings announcement surprise is computed as themean during the year of the quarterly absolute value of the differencebetween actual earnings and expected earnings divided by the stock price. The earnings announcements volatility is computed as themean during the year of the quar-terly volatility of the three-day market reaction to earnings announcements. All conditioning variables are measured as differences-in-differences: the difference afterloss of an analyst versus before and the difference between treatment firms versus controlfirms. ***, **, and * indicate statistical significance at the 1%, 5%, and 10% levels,respectively.
Proxy for the change in information asymmetry Difference-in-differences forquartile 4 (firms with a bigchange in info. asymmetry)
Difference-in-differences forquartiles 1–3 (firms with asmall change in info. asymmetry)
Difference-in-differences for bigchange versus small change
Observations Mean Observations Mean Mean t-statistic
Bid-ask spread 171 74.0 513 1.6 72.3*** 3.31Amihud liquidity measure 199 136.6 598 −22.1 158.8*** 8.08Returns ratio 197 83.1 601 −2.6 85.7*** 4.41Earnings announcement surprise 192 108.3 579 −18.1 126.4*** 6.24Earnings announcement volatility 193 60.7 581 −2.9 63.5*** 3.06

306 F. Derrien et al. / Journal of Corporate Finance 39 (2016) 295–311
5. Main results for the rate of credit events
5.1. The increase in the rate of credit events
The increase in the cost of debt suggests that expected losses to debtholders increase as a result of the increase in informationasymmetry. We now examine whether the loss of an analyst also leads to a higher rate of credit events (H3).
To test this, we use the rate of various credit events during the years after the loss of an analyst. The credit events that weexamine include defaults (from Compustat). We also examine bankruptcy related stock delistings (from CRSP), namely, thosethat are classified as “liquidations” or “drops”; we refer to these as “delistings”. Finally, we examine bankruptcy filings (fromSDC) to which we refer simply as “bankruptcies”. We examine these credit events over horizons of within one year, withintwo years, and within three years after the loss of an analyst. For each credit event, for each horizon, we compute the meanrate of the credit event for treatment firms, control firms, and the difference between treatment firms and control firms.
Table 4 presents the results. The rate of all three credit events over all three horizons is significantly higher, both economicallyand statistically, for treatment firms than for control firms. For example, within one year, the rates of defaults, delistings, andbankruptcies are higher by roughly 1.1, 1.0, and 1.1 percentage points, respectively. By comparison, the corresponding ratesrange from 0.5 to 0.7 percentage points for control firms. In other words, the rate of credit events is roughly 150% higher for treat-ment firms than for control firms within one year. Within two years and three years, the rate of credit events is still roughly 100%higher for treatment firms than for control firms (roughly 3.0 percentage points compared to roughly 1.5 percentage points).15
Our results are similar in economic magnitude to those in the literature (e.g., Campbell et al. (2008)). The results suggest that ac-tual losses to debtholders increase as a result of the increase in information asymmetry caused by the loss of an analyst.
Like in Table 2, in which we examine whether the increase in the cost of debt is bigger when the loss of an analyst is morecostly, we now examine whether the rate of credit events is higher. Once again, the loss of an analyst should be more costlyfor firms that have less analyst coverage, higher leverage, a lower credit rating, and shorter debt maturity (H4). Table 5 presentsthe results. For all three credit events and all three horizons, the rate of credit events is always significantly higher both econom-ically and statistically. Overall, the results suggest that the increase in actual losses to debtholders is driven by firms for which theloss of an analyst is most costly. As an alternative interpretation, our results support the notion that the loss of an analyst is con-centrated in firms that are financially constrained or distressed.
5.2. The increase in the rate of credit events conditional upon the increase in information asymmetry
We examine whether the increase in actual losses to debtholders is driven by the increase in information asymmetry causedby the loss of an analyst. If this is the case, then the increase in actual losses should be bigger when the increase in informationasymmetry caused by the disappearance of an analyst is bigger (H4). We examine whether this is the case. For each credit event,for each horizon, we compare the mean difference between treatment firms and control firms in the rate of the credit event (as inTable 4) for firms with a big change in information asymmetry to firms with a small change in information asymmetry. We usethe same five proxies for information asymmetry as in Table 3. We also measure the change in information asymmetry asdifferences-in-differences as before. Finally, we once again classify firms in the top quartile of the change in information asymme-try as having a big change and firms in the bottom three quartiles as having a small change.
Table 6 presents the results. For all three credit events, for all three horizons, the rate of credit events is significantly higher forfirms with a big change in information asymmetry than for firms with a small change in information asymmetry. Most of thedifferences-in-differences (34 of 45) are statistically significant for our five proxies for information asymmetry. They are also high-ly economically significant: they range from 0.9 to 9.6 percentage points with a mean and median of 3.5 and 3.1 percentagepoints, respectively. By comparison, Table 4 shows that the rate of credit events for control firms is roughly 0.5 percentage pointswithin one year after the loss of an analyst, and it is roughly 1.5 percentage points within both two years and three years. Overall,the results suggest that the increase in actual losses to debtholders is driven by firms with the biggest increase in informationasymmetry caused by the loss of an analyst.
5.3. The increase in the rate of credit events conditional upon the increase in the cost of debt
Finally, if more information asymmetry causes both a higher cost of debt and more credit events, then there should be a higherrate of credit events when there is a bigger increase in the cost of debt. In other words, bond spreads should predict credit events.As a consistency check between our two main outcomes of interest, we examine whether this is the case. For each credit event,for each horizon, we compare the mean difference between treatment firms and control firms in the rate of the credit event (as inTable 4) for firms with a big change in the cost of debt to firms with a small change in the cost of debt. We measure the change inthe cost of debt as a difference-in-differences (as in Panel A of Table 2). We classify firms in the top half of the change in the costof debt as having a big change and firms in the bottom half as having a small change.
Table 7 presents the results. For all three credit events, for all three horizons, the rate of credit events is significantly higher forfirms with a big change in the cost of debt than for firms with a small change in the cost of debt. All of the differences-in-
15 The delisting rates for our control firms are similar to the corresponding rates for a sample of all comparable publicly traded firms.

Table 4The effect of the loss of an analyst on the rate of credit events.This table presents the rate of credit events caused by the loss of an analyst. The sample comprises 824 treatment firms that lose an analyst between 1994 and 2008because of broker closures and broker mergers and the same number of control firms matched by industry, time, total assets, profitability, leverage, credit rating,and analyst coverage. Both groups of firms are publicly traded U.S. operating firms that have been traded for at least one year. For each credit event (default, delisting,and bankruptcy), for each horizon (within one year, within two years, and within three years after the loss of an analyst), three mean rates are computed: the rate fortreatment firms, for control firms, and for the difference between treatment firms and control firms. ***, **, and * indicate statistical significance at the 1%, 5%, and 10%levels, respectively. Statistical significance is only tabulated for the mean of the differences.
Credit event Mean treatmentrate of credit event
Mean control rateof credit event
Mean of treatmentrate minus control rate
t-statistic for treatmentrate minus control rate
DefaultWithin one year 1.83% 0.73% 1.10%** 2.07Within two years 3.05% 1.71% 1.47%** 2.13Within three years 3.13% 1.77% 1.50%** 1.98
DelistingWithin one year 1.58% 0.61% 0.97%** 2.00Within two years 2.91% 1.58% 1.33%* 1.86Within three years 3.12% 1.76% 1.36%* 1.67
BankruptcyWithin one year 1.58% 0.49% 1.09%** 2.33Within two years 2.91% 1.46% 1.46%** 2.06Within three years 3.12% 1.36% 1.76%** 2.27
307F. Derrien et al. / Journal of Corporate Finance 39 (2016) 295–311
differences are highly statistically significant. They are also highly economically significant: they range from 2.2 to 4.8 percentagepoints. Once again, by comparison, Table 4 shows that the rate of credit events for control firms is roughly 0.5, 1.5, and 1.5 per-centage points within one year, two years, and three years, respectively, after the loss of an analyst. Thus, perhaps unsurprisingly,short-term market reactions (changes in the cost of debt) following analyst disappearances are highly correlated with long-termeffects (changes in the rate of credit events).
6. The financing channel versus the monitoring channel
Our final goal is to understand the mechanisms through which analysts affect firms. The literature suggests two different,though not mutually exclusive, ways in which this can occur: the financing channel (analyst disappearances cause an increasein information asymmetry, which leads to an increase in financing costs), and the monitoring channel (analyst disappearances
Table 5The effect of the loss of an analyst on the rate of credit events conditional upon analyst coverage, leverage, credit rating, and debt maturity.This table presents the rate of credit events caused by the loss of an analyst conditional upon analyst coverage, leverage, credit rating, and debt maturity. The samplecomprises 824 treatment firms that lose an analyst between 1994 and 2008 because of broker closures and broker mergers and the same number of control firmsmatched by industry, time, total assets, profitability, leverage, credit rating, and analyst coverage. Both groups of firms are publicly traded U.S. operating firms that havebeen traded for at least one year. For each credit event (default, delisting, and bankruptcy), for each horizon (within one year, within two years, andwithin three years),a mean difference-in-differences is computed: the difference between treatment firms and control firms (as in Table 4) and the difference between small firms and bigfirms (as in Table 2). The same approach is followed forfirms covered by few analysts andmany analysts, for firmswith high leverage and low leverage, forfirmswith anon-investment grade credit rating andwith an investment grade credit rating, and forfirmswith short debtmaturity and long debtmaturity. All conditioning variablesare measured using only treatment firms, and they are measured before the loss of an analyst. ***, **, and * indicate statistical significance at the 1%, 5%, and 10% levels,respectively.
Credit event Quartile 1 of analystcoverage (few) (N = 209)versus quartiles 2–4(many) (N = 615)
Quartile 4 of leverage(high) (N = 206) versusquartiles 1–3 (low)(N = 618)
Non-investment graderating (N = 171) versusinvestment grade(N = 653)
Quartile 1 of debt maturity(short) (N = 206) versusquartiles 2–4 (long)(N = 618)
Mean t-statistic Mean t-statistic Mean t-statistic Mean t-statistic
DefaultWithin one year 3.05%** 2.54 2.44%* 1.87 5.39%*** 3.56 4.41%*** 3.68Within two years 3.86%** 2.48 4.55%*** 2.79 7.94%*** 4.19 7.19%*** 4.75Within three years 3.85%** 2.18 4.55%*** 2.63 7.80%*** 3.72 6.47%*** 3.89
DelistingWithin one year 3.19%*** 2.80 3.24%** 2.54 4.68%*** 3.29 3.88%*** 3.51Within two years 3.98%** 2.52 5.34%*** 3.19 5.69%*** 2.86 7.28%*** 4.73Within three years 4.74%** 2.57 4.71%** 2.56 6.04%*** 2.67 7.29%*** 4.31
BankruptcyWithin one year 2.38%** 2.34 2.43%** 2.08 4.53%*** 3.40 3.07%*** 2.91Within two years 4.46%*** 2.90 4.53%*** 2.84 6.28%*** 3.22 8.41%*** 5.37Within three years 4.92%*** 2.87 4.17%** 2.47 7.25%*** 3.37 8.14%*** 4.82
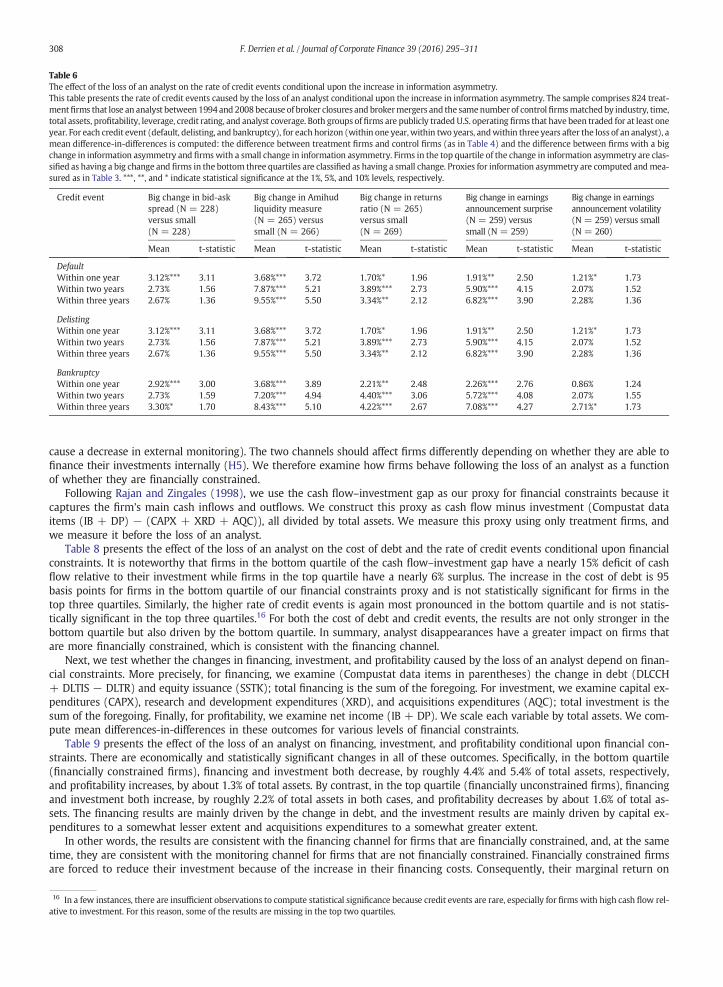
Table 6The effect of the loss of an analyst on the rate of credit events conditional upon the increase in information asymmetry.This table presents the rate of credit events caused by the loss of an analyst conditional upon the increase in information asymmetry. The sample comprises 824 treat-mentfirms that lose an analyst between 1994 and 2008because of broker closures and brokermergers and the samenumber of controlfirmsmatchedby industry, time,total assets, profitability, leverage, credit rating, and analyst coverage. Both groups offirms are publicly traded U.S. operating firms that have been traded for at least oneyear. For each credit event (default, delisting, and bankruptcy), for each horizon (within one year,within two years, andwithin three years after the loss of an analyst), amean difference-in-differences is computed: the difference between treatment firms and control firms (as in Table 4) and the difference between firms with a bigchange in information asymmetry and firms with a small change in information asymmetry. Firms in the top quartile of the change in information asymmetry are clas-sified as having a big change and firms in the bottom three quartiles are classified as having a small change. Proxies for information asymmetry are computed andmea-sured as in Table 3. ***, **, and * indicate statistical significance at the 1%, 5%, and 10% levels, respectively.
Credit event Big change in bid-askspread (N = 228)versus small(N = 228)
Big change in Amihudliquidity measure(N = 265) versussmall (N = 266)
Big change in returnsratio (N = 265)versus small(N = 269)
Big change in earningsannouncement surprise(N = 259) versussmall (N = 259)
Big change in earningsannouncement volatility(N = 259) versus small(N = 260)
Mean t-statistic Mean t-statistic Mean t-statistic Mean t-statistic Mean t-statistic
DefaultWithin one year 3.12%*** 3.11 3.68%*** 3.72 1.70%* 1.96 1.91%** 2.50 1.21%* 1.73Within two years 2.73% 1.56 7.87%*** 5.21 3.89%*** 2.73 5.90%*** 4.15 2.07% 1.52Within three years 2.67% 1.36 9.55%*** 5.50 3.34%** 2.12 6.82%*** 3.90 2.28% 1.36
DelistingWithin one year 3.12%*** 3.11 3.68%*** 3.72 1.70%* 1.96 1.91%** 2.50 1.21%* 1.73Within two years 2.73% 1.56 7.87%*** 5.21 3.89%*** 2.73 5.90%*** 4.15 2.07% 1.52Within three years 2.67% 1.36 9.55%*** 5.50 3.34%** 2.12 6.82%*** 3.90 2.28% 1.36
BankruptcyWithin one year 2.92%*** 3.00 3.68%*** 3.89 2.21%** 2.48 2.26%*** 2.76 0.86% 1.24Within two years 2.73% 1.59 7.20%*** 4.94 4.40%*** 3.06 5.72%*** 4.08 2.07% 1.55Within three years 3.30%* 1.70 8.43%*** 5.10 4.22%*** 2.67 7.08%*** 4.27 2.71%* 1.73
308 F. Derrien et al. / Journal of Corporate Finance 39 (2016) 295–311
cause a decrease in external monitoring). The two channels should affect firms differently depending on whether they are able tofinance their investments internally (H5). We therefore examine how firms behave following the loss of an analyst as a functionof whether they are financially constrained.
Following Rajan and Zingales (1998), we use the cash flow–investment gap as our proxy for financial constraints because itcaptures the firm's main cash inflows and outflows. We construct this proxy as cash flow minus investment (Compustat dataitems (IB + DP) − (CAPX + XRD + AQC)), all divided by total assets. We measure this proxy using only treatment firms, andwe measure it before the loss of an analyst.
Table 8 presents the effect of the loss of an analyst on the cost of debt and the rate of credit events conditional upon financialconstraints. It is noteworthy that firms in the bottom quartile of the cash flow–investment gap have a nearly 15% deficit of cashflow relative to their investment while firms in the top quartile have a nearly 6% surplus. The increase in the cost of debt is 95basis points for firms in the bottom quartile of our financial constraints proxy and is not statistically significant for firms in thetop three quartiles. Similarly, the higher rate of credit events is again most pronounced in the bottom quartile and is not statis-tically significant in the top three quartiles.16 For both the cost of debt and credit events, the results are not only stronger in thebottom quartile but also driven by the bottom quartile. In summary, analyst disappearances have a greater impact on firms thatare more financially constrained, which is consistent with the financing channel.
Next, we test whether the changes in financing, investment, and profitability caused by the loss of an analyst depend on finan-cial constraints. More precisely, for financing, we examine (Compustat data items in parentheses) the change in debt (DLCCH+ DLTIS − DLTR) and equity issuance (SSTK); total financing is the sum of the foregoing. For investment, we examine capital ex-penditures (CAPX), research and development expenditures (XRD), and acquisitions expenditures (AQC); total investment is thesum of the foregoing. Finally, for profitability, we examine net income (IB + DP). We scale each variable by total assets. We com-pute mean differences-in-differences in these outcomes for various levels of financial constraints.
Table 9 presents the effect of the loss of an analyst on financing, investment, and profitability conditional upon financial con-straints. There are economically and statistically significant changes in all of these outcomes. Specifically, in the bottom quartile(financially constrained firms), financing and investment both decrease, by roughly 4.4% and 5.4% of total assets, respectively,and profitability increases, by about 1.3% of total assets. By contrast, in the top quartile (financially unconstrained firms), financingand investment both increase, by roughly 2.2% of total assets in both cases, and profitability decreases by about 1.6% of total as-sets. The financing results are mainly driven by the change in debt, and the investment results are mainly driven by capital ex-penditures to a somewhat lesser extent and acquisitions expenditures to a somewhat greater extent.
In other words, the results are consistent with the financing channel for firms that are financially constrained, and, at the sametime, they are consistent with the monitoring channel for firms that are not financially constrained. Financially constrained firmsare forced to reduce their investment because of the increase in their financing costs. Consequently, their marginal return on
16 In a few instances, there are insufficient observations to compute statistical significance because credit events are rare, especially for firms with high cash flow rel-ative to investment. For this reason, some of the results are missing in the top two quartiles.

Table 7The effect of the loss of an analyst on the rate of credit events conditional upon the increase in the cost of debt.This table presents the rate of credit events caused by the loss of an analyst conditional upon the increase in the cost of debt. The sample comprises 824 treatment firmsthat lose an analyst between 1994 and 2008 because of broker closures and broker mergers and the same number of control firms matched by industry, time, total as-sets, profitability, leverage, credit rating, and analyst coverage. Both groups of firms are publicly traded U.S. operating firms that have been traded for at least one year.For each credit event (default, delisting, and bankruptcy), for each horizon (within one year, within two years, andwithin three years after the loss of an analyst), threemean differences between treatment firms and control firms in the rate of credit events (as in Table 4) are computed: the difference for firms with a big change in thecost of debt, for firmswith a small change in the cost of debt, and for the difference between the two differences. Firms in the tophalf of the change in the cost of debt areclassified as having a big change and firms in the bottom half are classified as having a small change. The change in the cost of debt is measured as a difference-in-dif-ferences (as in Panel A of Table 2). ***, **, and * indicate statistical significance at the 1%, 5%, and 10% levels, respectively. Statistical significance is only tabulated for themean of the difference-in-differences.
Credit event Mean of difference for a bigchange in the cost of debt
Mean of difference for a smallchange in the cost of debt
Mean of difference for a bigchange versus a small change
t-statistic for difference for a bigchange versus a small change
DefaultWithin one year 2.49% −0.24% 2.73%** 2.56Within two years 3.49% −0.48% 3.97%*** 2.88Within three years 3.44% −0.26% 3.70%** 2.44
DelistingWithin one year 2.23% −0.24% 2.47%** 2.54Within two years 3.47% −0.71% 4.18%*** 2.92Within three years 3.42% −0.52% 3.94%** 2.43
BankruptcyWithin one year 2.23% 0.00% 2.23%** 2.37Within two years 3.71% −0.71% 4.43%*** 3.14Within three years 4.27% −0.52% 4.79%*** 3.09
309F. Derrien et al. / Journal of Corporate Finance 39 (2016) 295–311
investment rises, and so does their average profitability as a result. By contrast, financially unconstrained firms invest more be-cause of the decreasing in external monitoring. Since the return on their new investments is lower than that of their existing as-sets, their average profitability also falls in consequence.
We further examine the change in debt since the results indicate that the change in debt drives financing. Firms can choosebetween issuing public debt and private debt, and sell side analysts may affect investors in both public and private debt. Both pri-vate and public debtholders are affected by information asymmetry. However, private debtholders usually have a larger stake inthe firm's debt and better access to its management, so they are better incentivized and informed for the purpose of monitoringthe firm to which they lend than public debtholders. Therefore, the information produced by analysts may well have an impact inthe private debt market, but it is more likely to impact the public debt market. Table 9 shows that this is indeed the case. Thechange in debt is driven by public debt issuance, and private debt issuance is mostly unchanged.17
Taken together, the results are generally consistent with both the financing and monitoring channels. They show that analystlosses affect both cash-rich firms, which tend to overinvest when they lose an analyst, and cash-poor firms, which are forced tounderinvest. However, our results show that only the latter group of firms suffers from an increase in the cost of debt and the rateof credit events in the long run, likely because the former group has sufficient financial resources to absorb the consequences ofthe loss of an analyst.
7. Conclusion
In this paper, we study the causal effect of information asymmetry on the cost of debt and credit events. We hypothesize thatan increase in information asymmetry causes an increase in both expected and actual losses to debtholders. We identify exoge-nous increases in information asymmetry using the loss of an analyst that results from broker closures and broker mergers.
We find that the loss of an analyst causes a significant increase in the cost of debt and a significantly higher rate of creditevents such as defaults. The results are driven by firms that have less analyst coverage, higher leverage, a lower credit rating,shorter debt maturity, and a bigger increase in information asymmetry. In other words, both expected and actual losses todebtholders increase and especially so when the loss of an analyst is more costly and when it causes a bigger increase in infor-mation asymmetry. Additionally, we find that the rate of credit events is significantly higher when there is a bigger increase in thecost of debt. Finally, we find evidence that is broadly consistent with both the financing and monitoring channels.
In closing, our paper informs public policy about the importance of research analysts to financial market and real economyoutcomes. Our findings indicate that the multitude of research analysts in the equity market provide incremental value relevantinformation to investors in the $10 trillion bond market above and beyond the input of the credit rating agencies. The
17 In our data, public plus private debt issuance does not equal the change in debt. This is because our public and private debt issuance data are from SDC, and theycapture only debt issued to the general public or private placements. By contrast, our data for the change in debt are from firms' financial statements via Compustat,and thus they capture the net effect of all manner of debt issuances and repurchases for all possible investors involved (e.g., syndicated loans, long-term debt furnishedby the firm's suppliers, etc.).

Table 8The effect of the loss of an analyst on the cost of debt and the rate of credit events conditional upon the cash flow–investment gap.This table presents the same results as Panel A of Table 2 (the change in the cost of debt) and Table 4 (the rate of credit events) but conditional upon the cash flow–investment gap. The outcomes of interest are computedwithin each quartile of the cash flow–investment gap and between the top and bottom quartiles. The cash-flowinvestment gap is cash flow minus investment, all divided by total assets. It is measured using only treatment firms and before the loss of an analyst.
Quartile 1 Quartile 2 Quartile 3 Quartile 4 Q4 minus Q1
Cash flow–investment gap Mean −14.50% −1.20% 1.82% 6.21% 20.71%Cost of debt Mean 95.4*** 17.1 5.7 −19.9 −115.3***
t-stat (3.48) (0.93) (0.54) (−1.28) (−3.66)
DefaultWithin one year Mean 3.47%* 1.00% 0.49% −0.49% −3.96%**
t-stat (1.95) (1.00) (1.00) (−1.00) (−2.16)Within two years Mean 4.46%** 1.00% 0.49% 0.00% −4.46%**
t-stat (2.20) (0.58) (1.00) (0.00) (−2.09)Within three years Mean 3.78%* 1.08% 1.10% 0.00% −3.78%
t-stat (1.71) (0.63) (1.42) (0.00) (−1.59)
DelistingWithin one year Mean 2.44% 1.47% – – −2.44%
t-stat (1.51) (1.34) – – (−1.51)Within two years Mean 2.44% 1.96% 0.49% 0.49% −1.95%
t-stat (1.15) (1.07) (1.00) (1.00) (−0.89)Within three years Mean 1.60% 2.66% 1.10% 0.00% −1.60%
t-stat (0.69) (1.39) (1.42) (0.00) (−0.64)
BankruptcyWithin one year Mean 3.41%** 0.49% 0.49% – −3.41%**
t-stat (2.13) (0.58) (1.00) – (−2.13)Within two years Mean 3.41% 1.47% 0.49% 0.49% −2.92%
t-stat (1.61) (0.83) (1.00) (1.00) (−1.34)Within three years Mean 3.19% 2.13% 1.10% 0.57% −2.62%
t-stat (1.42) (1.16) (1.42) (1.00) (−1.11)
Table 9The effect of the loss of an analyst on financing, investment, and profitability conditional upon the cash flow–investment gap.This table presents the change in financing, investment, and profitability caused by the loss of an analyst and conditional upon the cash flow–investment gap. For eachfinancing, investment, and profitability variable, a mean difference-in-differences is computed: the difference between the treatment difference and the control differ-ence, where the treatment difference and the control are both measured from the year before the loss of an analyst to the year after. Each variable is scaled by totalassets. The outcomes of interest are computed within each quartile of the cash flow–investment gap and between the top and bottom quartiles. The cash-flow invest-ment gap is cash flow minus investment, all divided by total assets. It is measured using only treatment firms and before the loss of an analyst.
Quartile 1 Quartile 2 Quartile 3 Quartile 4 Q4 minus Q1
FinancingChange in debt Mean −3.78%*** 0.12% 0.13% 2.15%** 5.93%***
t-stat (−3.50) (0.15) (0.19) (2.59) (4.37)Equity issuance Mean −0.37% 0.35%** −0.08% −0.15% 0.21%
t-stat (−1.18) (2.24) (−0.52) (−0.96) (0.62)Total financing Mean −4.38%*** 0.98% 0.02% 2.20%*** 6.58%***
t-stat (−3.85) (1.11) (0.04) (2.63) (4.67)
Public versus private debt issuancePublic debt issuance Mean −3.07%*** 0.48% 0.12% 0.12% 3.19%**
t-stat (−3.26) (0.56) (0.16) (0.14) (2.52)Private debt issuance Mean −0.41% 0.53% 0.43% 0.03% 0.44%
t-stat (−0.67) (1.13) (1.56) (0.12) (0.66)
InvestmentCapital expenditures Mean −1.77%*** −0.17% 0.06% 0.39% 2.16%***
t-stat (−3.84) (−0.55) (0.29) (1.54) (4.12)Research and development expenditures Mean −0.15%* −0.01% 0.10%** 0.00% 0.15%
t-stat (−1.91) (−0.14) (1.99) (−0.05) (1.42)Acquisitions expenditures Mean −2.79%*** 1.10%** 0.30% 1.81%*** 4.60%***
t-stat (−3.82) (2.34) (0.70) (3.50) (5.15)Total investment Mean −5.36%*** 1.03%* 0.50% 2.15%*** 7.52%***
t-stat (−6.32) (1.81) (0.94) (3.57) (7.24)
ProfitabilityReturn on assets Mean 1.32%** −0.25% −0.51% −1.55%*** −2.88%***
t-stat (2.11) (−0.46) (−1.23) (−3.20) (−3.64)
310 F. Derrien et al. / Journal of Corporate Finance 39 (2016) 295–311

311F. Derrien et al. / Journal of Corporate Finance 39 (2016) 295–311
information produced by equity analysts improves the pricing of corporate debt, which is five times larger than equity as asource of financing. Through their immediate impact on financing costs, these analysts ultimately affect the survival of thefirms that they cover.
References
Acharya, V.V., Johnson, T.C., 2007. Insider trading in credit derivatives. J. Financ. Econ. 84, 110–141.Almeida, H., Campello, M., Laranjeira, B., Weisbenner, S., 2011. Corporate debt maturity and the real effects of the 2007 credit crisis. Crit. Financ. Rev. 1, 3–58.Altman, E.I., 1968. Financial ratios, discriminant analysis and the prediction of corporate bankruptcy. J. Financ. 23, 589–609.Balakrishnan, K., Billings, M., Kelly, B., Ljungqvist, A., 2014. Shaping liquidity: on the causal effects of voluntary disclosure. J. Financ. 69, 2237–2278.Black, F., Scholes, M., 1973. The pricing of options and corporate liabilities. J. Polit. Econ. 81, 637–654.Campbell, J.Y., Hilscher, J., Szilagyi, J., 2008. In search of distress risk. J. Financ. 63, 2899–2939.Chang, X., Dasgupta, S., Hilary, G., 2006. Analyst coverage and financing decisions. J. Financ. 61, 3009–3048.Chava, S., Jarrow, R.A., 2004. Bankruptcy prediction with industry effects. Eur. Finan. Rev. 8, 537–569.Chen, T., Harford, J., Lin, C., 2015. Do analysts matter for governance? Evidence from natural experiments. J. Financ. Econ. 115, 383–410.Cheng, M., Subramanyam, K.R., 2008. Analyst following and credit ratings. Contemp. Account. Res. 25, 1007–1043.Colla, P., Ippolito, F., Li, K., 2013. Debt specialization. J. Financ. 68, 2117–2141.Dechow, P.M., Hutton, A.P., Sloan, R.G., 2000. The relation between analysts' forecasts of long-term earnings growth and stock price performance following equity of-
ferings. Contemp. Account. Res. 17, 1–32.Derrien, F., Kecskés, A., 2013. The real effects of financial shocks: evidence from exogenous changes in analyst coverage. J. Financ. 68, 1383–1416.Diamond, D.W., 1985. Optimal release of information by firms. J. Financ. 40, 1071–1094.Downing, C., Underwood, S., Xing, Y., 2009. The relative informational efficiency of stocks and bonds: an intraday analysis. J. Financ. Quant. Anal. 44, 1081–1102.Duffie, D., Lando, D., 2001. Term structure of credit spreads with incomplete accounting information. Econometrica 69, 633–664.Ederington, L.H., Goh, J.C., 1998. Bond rating agencies and stock analysts: who knows what when? J. Financ. Quant. Anal. 33, 569–585.Fama, E.F., French, K.R., 1993. Common risk factors in the returns on stocks and bonds. J. Financ. Econ. 33, 3–56.Fong, K., Hong, H., Kacperczyk, M., Kubik, J.D., 2014. Do security Analysts Discipline Credit Rating Agencies?, Working Paper.De Franco, G., Vasvari, F.P., Wittenberg-Moerman, R., 2009. The informational role of bond analysts. J. Account. Res. 47, 1201–1248.De Franco, G., Vasvari, F.P., Vyas, D., Wittenberg-Moerman, R., 2014. Debt analysts' view of debt-equity conflicts of interest. Account. Rev. 89, 571–604.Hong, H., Kacperczyk, M., 2010. Competition and bias. Q. J. Econ. 125, 1683–1725.Hong, H., Kubik, J.D., 2003. Analyzing the analysts: career concerns and biased earnings forecasts. J. Financ. 58, 313–351.Hotchkiss, E.S., Ronen, T., 2002. The informational efficiency of the corporate bond market: an intraday analysis. Rev. Financ. Stud. 15, 1326–1354.Irani, R.M., Oesch, D., 2013. Monitoring and corporate disclosure: evidence from a natural experiment. J. Financ. Econ. 109, 398–418.Irani, R.M., Oesch, D., 2014. Analyst coverage and real earnings management: quasi-experimental evidence. Journal of Financial and Quantitative Analysis
(forthcoming).Irvine, P.J.A., 2001. Do analysts generate trade for their firms? Evidence from the Toronto Stock Exchange. J. Account. Econ. 30, 209–226.Johnston, R., Markov, S., Ramnath, S., 2009. Sell-side debt analysts. J. Account. Econ. 47, 91–107.Kelly, B., Ljungqvist, A., 2012. Testing asymmetric-information asset pricing models. Rev. Financ. Stud. 25, 1366–1413.Kirk, M., 2011. Research for sale: determinants and consequences of paid-for analyst research. J. Financ. Econ. 100, 182–200.Kliger, D., Sarig, O., 2000. The information value of bond ratings. J. Financ. 55, 2879–2902.Lang, M.H., Lins, K.V., Miller, D.P., 2004. Concentrated control, analyst following, and valuation: do analyst matter most when investors are protected least? J. Account.
Res. 42, 589–623.Leland, H.E., Pyle, D.H., 1977. Information asymmetries, financial structure, and financial intermediation. J. Financ. 32, 371–387.Mansi, S.A., Maxwell, W.F., Miller, D.P., 2011. Analyst forecast characteristics and the cost of debt. Rev. Acc. Stud. 16, 116–142.McNichols, M., O'Brien, P.C., 1997. Self-selection and analyst coverage. J. Account. Res. 35, 167–199.Merton, R.C., 1973. The theory of rational option pricing. Bell J. Econ. Manag. Sci. 4, 141–183.Merton, R.C., 1974. On the pricing of corporate debt: the risk structure of interest rates. J. Financ. 29, 449–470.Merton, R.C., 1987. A simple model of capital market equilibrium with incomplete information. J. Financ. 42, 483–510.Mikhail, M.B., Walther, B.R., Willis, R.H., 1999. Does forecast accuracy matter to security analysts? Account. Rev. 74, 185–200.Myers, S.C., Majluf, N.S., 1984. Corporate financing and investment decisions when firms have information that investors do not. J. Financ. Econ. 13, 187–221.Ohlson, J.A., 1980. Financial ratios and the probabilistic prediction of bankruptcy. J. Account. Res. 18, 109–131.Rajan, R.G., Zingales, L., 1998. Financial dependence and growth. Am. Econ. Rev. 88, 559–586.Rauh, J.D., Sufi, A., 2010. Capital structure and debt structure. Rev. Financ. Stud. 23, 4242–4280.Shumway, T., 2001. Forecasting bankruptcy more accurately: a simple hazard model. J. Bus. 74, 101–124.Stiglitz, J.E., Weiss, A., 1981. Credit rationing in markets with imperfect information. Am. Econ. Rev. 71, 393–410.Tang, T.T., 2009. Information asymmetry and firms' credit market access: evidence from Moody's credit rating format refinement. J. Financ. Econ. 93, 325–351.Womack, K.L., 1996. Do brokerage analysts' recommendations have investment value? J. Financ. 51, 137–167.Yu, F., 2008. Analyst coverage and earnings management. J. Financ. Econ. 88, 245–271.