Information Asymmetry and Financing Arrangements: Evidence ...
52
Information Asymmetry and Financing Arrangements: Evidence from Syndicated Loans (forthcoming, Journal of Finance) AMIR SUFI* ABSTRACT I empirically explore the syndicated loan market, with an emphasis on how information asymmetry between lenders and borrowers influences syndicate structure and on which lenders become syndicate members. Consistent with moral hazard in monitoring, the lead bank retains a larger share of the loan and forms a more concentrated syndicate when the borrower requires more intense monitoring and due diligence. When information asymmetry between the borrower and lenders is potentially severe, participant lenders are closer to the borrower, both geographically and in terms of previous lending relationships. Lead bank and borrower reputation mitigates, but does not eliminate, information asymmetry problems. *Graduate School of Business, University of Chicago. I thank James Poterba, Antoinette Schoar, and Philip Strahan for their continuous support and help with this project. I also thank Dan Bergstresser, Mark Carey, Benjamin Esty, Robert Gibbons, Michael Greenstone, Bengt Holmstrom, Dirk Jenter, Asim Khwaja, Randall Kroszner, David Matsa, Donald Mullineaux, Stewart Myers, Joshua Rauh, David Scharfstein, Edward Sellers, David Smith, Lucy White, and Peter Wysocki for helpful comments and discussions. This work benefited greatly from seminar participants at MIT (Sloan), NYU (Stern), Chicago GSB, Columbia GSB, Northwestern (Kellogg), Harvard Business School, Yale School of Management, Dartmouth (Tuck), Penn (Wharton), Princeton, the Midwest Finance Association conference, the Eastern Finance Association conference, and the Western Finance Association conference. I also thank the editor, an associate editor, and an anonymous referee for suggestions that greatly improved the paper.
Transcript of Information Asymmetry and Financing Arrangements: Evidence ...

Information Asymmetry and Financing Arrangements: Evidence from Syndicated Loans
(forthcoming, Journal of Finance)
AMIR SUFI*
ABSTRACT
I empirically explore the syndicated loan market, with an emphasis on how information asymmetry
between lenders and borrowers influences syndicate structure and on which lenders become syndicate
members. Consistent with moral hazard in monitoring, the lead bank retains a larger share of the loan and
forms a more concentrated syndicate when the borrower requires more intense monitoring and due
diligence. When information asymmetry between the borrower and lenders is potentially severe,
participant lenders are closer to the borrower, both geographically and in terms of previous lending
relationships. Lead bank and borrower reputation mitigates, but does not eliminate, information
asymmetry problems.
*Graduate School of Business, University of Chicago. I thank James Poterba, Antoinette Schoar, and Philip Strahan for their continuous support and help with this project. I also thank Dan Bergstresser, Mark Carey, Benjamin Esty, Robert Gibbons, Michael Greenstone, Bengt Holmstrom, Dirk Jenter, Asim Khwaja, Randall Kroszner, David Matsa, Donald Mullineaux, Stewart Myers, Joshua Rauh, David Scharfstein, Edward Sellers, David Smith, Lucy White, and Peter Wysocki for helpful comments and discussions. This work benefited greatly from seminar participants at MIT (Sloan), NYU (Stern), Chicago GSB, Columbia GSB, Northwestern (Kellogg), Harvard Business School, Yale School of Management, Dartmouth (Tuck), Penn (Wharton), Princeton, the Midwest Finance Association conference, the Eastern Finance Association conference, and the Western Finance Association conference. I also thank the editor, an associate editor, and an anonymous referee for suggestions that greatly improved the paper.

1
Syndicated loans are a large and increasingly important source of corporate finance. Nonfinancial U.S.
businesses obtain almost $1 trillion in new syndicated loans each year, which represents approximately
15% of their aggregate debt outstanding, and of the largest 500 nonfinancial firms in the Compustat
universe in 2002, almost 90% obtained a syndicated loan between 1994 and 2002. Indeed, according to
the American Banker, syndicated lending represents 51% of U.S. corporate finance originated, and
generates more underwriting revenue for the financial sector than both equity and debt underwriting
(Weidner (2000)). The market for syndicated loans has also experienced strong growth, going from $137
million in 1987 to over $1 trillion today. However, despite the importance of syndicated loans, research
on their role in U.S. corporate finance is limited.
A syndicated loan is a loan whereby at least two lenders jointly offer funds to a borrowing firm.
The “lead arranger” establishes a relationship with the firm, negotiates terms of the contract, and
guarantees an amount for a price range. The lead arranger then turns to “participant” lenders that fund
part of the loan. Using a sample of 12,672 syndicated loan deals to 4,687 U.S. nonfinancial firms from
1992 to 2003, I explore both how information asymmetry affects financing arrangements, and what
financial institutions can do to reduce problems associated with information asymmetry. Syndicated
loans are especially promising as an empirical laboratory for studying information asymmetry because,
unlike most financial products, firms from all points of the credit spectrum (privately held, unrated, high
yield, and investment grade) utilize this form of finance. I find evidence that information asymmetry
affects the structure of syndicated loans and the composition of syndicate members in a manner consistent
with moral hazard; borrowing firm and lead bank reputation can reduce, but not eliminate, the effects of
information asymmetry.
To motivate the empirical analysis, I employ a theoretical framework based on prominent models
of agency and moral hazard (Holmstrom (1979), Holmstrom and Tirole (1997)). A basic assumption in
these models is that firms with limited public information require due diligence and monitoring by an
“informed” lender before “uninformed” lenders invest in the firm. In this framework, there exists a moral
hazard problem for the informed lender because the informed lender’s monitoring and due diligence effort

2
is unobservable. In order to ensure diligence, a lender with monitoring and due diligence responsibilities
must retain a large financial stake in the borrowing firm, as only a bank with a stake in the firm’s
performance exerts the necessary effort in due diligence and monitoring. In other words, given that an
informed lender’s effort is unobservable, the informed lender is forced to retain a larger share of the loan
when the borrower requires more intense due diligence and monitoring effort relative to when the
borrower does not require intense due diligence and monitoring effort.
The empirical analysis finds evidence that supports this theoretical framework. When borrowing
firms require more intense due diligence and monitoring (by a variety of measures), the lead arranger
(informed lender) retains a larger share of the loan and forms a more concentrated syndicate. For
example, after controlling for both the size of the loan and the size of the firm, I find that syndicated loans
to firms without publicly available SEC filings are 11% more concentrated (based on a Herfindahl index),
with the lead arranger holding 10% more of the loan. I also find evidence that information asymmetry
shapes syndicate structure among firms with publicly available SEC filings. Using measures of
information asymmetry from the extant literature (the use of positive accruals and the amount of R&D
investment), I find similar results: Lead arrangers on loans to public firms that require more monitoring
and due diligence retain a larger share of the loan and form a more concentrated syndicate.
These results can also be viewed in the context of Diamond’s (1991) model of reputation
acquisition. In his model, borrowers “graduate” from bank loans to public debt by establishing a solid
credit reputation. Monitoring becomes unnecessary as the borrower establishes a reputation, and thus the
borrower no longer relies on a commercial bank for funds. Diamond’s model describes two extremes of
the financing arrangement spectrum. The extant literature suggests that syndicated loans are positioned
between the two extremes, having characteristics of both sole-lender bank loans and public debt (Dennis
and Mullineaux (2000)). My results show that borrowers with little or no credit reputation obtain
syndicated loans that are similar to sole-lender bank loans; the lead arranger retains a larger share of the
loan and there are fewer participant lenders on the syndicate. Reputable borrowers obtain syndicated

3
loans that are similar to public debt--the syndicate is dispersed and the lead arranger retains a smaller
share of the loan.
The central result of the first half of this paper is that problems of information asymmetry force
the lead arranger to take a larger stake in the loan and form a more concentrated syndicate. Given that the
formation of the syndicate takes place in a world of repeated interactions, a key question is whether
borrower or lead bank reputation mitigates these problems. I find evidence that both borrower and lead
bank reputation can reduce, but not eliminate, problems of information asymmetry. Lead arrangers retain
the largest share of the loan the first time an opaque borrower accesses the syndicated loan market, and
retain lower amounts as the borrower subsequently accesses the market. This result is only true for firms
that require intense monitoring and due diligence, and suggests that problems of information asymmetry
are reduced when the borrower becomes more “known” in the syndicated loan market. I also find
evidence that lead bank reputation can partially reduce problems of information asymmetry. Lead
arrangers retain a larger share of the loan when the borrower requires more intense investigation and
monitoring, but this effect is weaker when the lead arranger has a more established reputation, based on
its previous year’s market share. While lead arrangers with larger market share are able to retain smaller
portions of the loan, only the top 1% most reputable lead arrangers are able to completely offset the effect
of information asymmetry.
Even with repeated interactions, information asymmetry influences the syndicated loan market in
a manner consistent with previous theoretical research. My findings underscore the importance of
“informed” capital in the financial health of firms that require more investigation and monitoring by a
financial institution. The evidence presented in this paper supports the foundation of models that predict
that small, informationally opaque companies are disproportionately affected by shocks to balance sheets
of commercial banks (Holmstrom and Tirole (1997), Kashyap, Stein, and Wilcox (1993)). In the
syndicated loan market, firms that require investigation and monitoring obtain financing from third parties
only after an informed lender takes a large financial stake in the firm.

4
The second half of the paper further documents the importance of information asymmetry in
syndicate formation by analyzing which participants become syndicate members. When the borrowing
firm has no publicly available SEC filings or no publicly available credit rating, participant lenders on
syndicates are “closer” to the borrowing firm, both geographically and in terms of previous relationships.
In other words, when there is limited information about a borrower, lead arrangers attempt to reduce the
need for information gathering by choosing participants that are more likely to “know” the firm.
I also analyze whether relationships among syndicate members are important in determining
which lenders end up participating as syndicate members. I find that a previous relationship between the
lead arranger and a potential participant lender increases the probability that the potential participant
becomes a syndicate member. However, previous lead arranger-participant relationships are much less
important (both in magnitude and statistical significance) than previous relationships between the
borrowing firm and the participant lender. In addition, while it is true that relationships between the
borrowing firm and participants are stronger when the borrower is opaque, relationships between lead
arrangers and participants do not vary systematically across the credit reputation spectrum. The results
suggest that, when problems of information asymmetry are severe, the lead arranger selects participants
based on the participant’s familiarity with the borrowing firm, not based on the participant’s familiarity
with the lead arranger itself. This last result contrasts with results in the IPO literature (Corwin and
Schultz (2005)), and suggests that persistent relationships between lead arrangers and participant lenders
alone cannot overcome information asymmetry problems.
The rest of the paper is developed as follows. Section I describes the syndicated loan market and
existing research related to this paper. Section II presents the data and summary statistics. Section III
details the theoretical framework that I use to motivate the empirical analysis and Section IV explores
how information asymmetry affects syndicate structure. Section V focuses on which banks become
participant lenders. Finally, Section VI concludes.
I. The Syndicated Loan Market: Background and Existing Research
A. Background1

5
A syndicated loan is a loan issued to a firm jointly by more than one financial institution. As
Hitchings (1994) notes, “… it is fundamental to syndicated lending that the terms and conditions of the
loan are similar for each of the lenders (32).” Members of the syndicate fall into one of two groups,
namely, lead arrangers and participant lenders. The distinction is important, and the two groups vary on
three major dimensions. First, participant lenders rarely directly negotiate with the borrowing firm,
having an “arm’s-length” relationship with the borrowing firm through the lead arranger. Lead arrangers
establish and maintain a relationship with the borrower, and take on the primary information collection
and monitoring responsibilities. The lead arranger drafts an information memorandum for the participant
lenders, which contains detailed and confidential information. Second, the lead arranger typically holds a
larger share of the loan than any of the participants. Third, in terms of renegotiation rights, unanimity of
all syndicate members is always required to change terms related to principal, interest, maturity, or
collateral. Renegotiation of minor terms, such as a technical default of a financial covenant, often
requires less than unanimity (1/2 or 2/3) of the syndicate. It is important to note that default rates in the
syndicated loan market are quite low; as the Shared National Credit Program of the Federal Reserve
shows, the amount of “classified” loans has not risen above 10% of outstanding commitments since 1989;
on average, classified loans are 4% of outstanding commitments.
The syndication process works as follows. The lead arranger signs a preliminary loan agreement
(“mandate”) with the borrowing firm that specifies covenants, fees, and collateral. The preliminary loan
agreement also specifies a loan amount and a range for the interest rate. Once the preliminary loan
agreement is signed, the lead arranger then turns to potential participant lenders to fund part of the loan.
The lead arranger provides potential participants with an information memorandum on the borrowing
firm. Once the participants agree to fund part of the loan, the loan agreement is signed by all parties.
Each participant is responsible for a share of the loan and the terms of the loan are identical for all
syndicate members. In addition to interest and commitment fee income, the lead arranger receives a fee
for arranging and managing the syndicated loan, which is paid by the borrowing firm. This fee is an up-
front payment from the borrower to the lead arranger that can be shared by the lead arranger with the

6
other syndicate members, and it varies between 25 and 175 basis points of the total loan amount. During
the life of the loan, the lead arranger typically also acts as the “agent” bank that monitors the firm,
governs the terms of the loan, administers the drawdown of funds, calculates interest payments, and
enforces financial covenants.
Three additional facts about the market are important. First, borrowing firms can hire more than
one lead arranger, with different assigned functions. Work by Francois and Missonier-Piera (2004), for
example, suggests that multiple lead arrangers are the result of competitive advantages in various duties.
Second, there is an “agency” section of the loan agreement that gives conditions for the removal of the
lead arranging bank. As Dennis and Mullineaux (2000) note, the agreement usually exculpates the lead
arranger from liability except when it results from gross negligence or willful misconduct. Third, a
borrower defaults on a loan if it misses any required interest payment or if it violates any of the financial
or nonfinancial covenants listed in the agreement. 2 Anecdotal evidence suggests that participant banks
are particularly concerned with problematic loans because of the Shared National Credit (SNC) review of
the Federal Reserve. The SNC review is important because “examiners can downgrade a loan below a
bank’s own rating and force the lender to either boost reserves or even write the loan off” (Davenport
(2003)).
While the loan sales market is an important parallel to syndicated loans, there are a few key
distinctions. First, the contracting behavior for a syndicated loan is distinct. As Gorton and Pennachi
(1995) note, a loan sale leaves the existing contract between the firm and the original lender unaltered. A
new secondary participation contract gives the loan buyer access to cash flows, and the terms of the new
loan agreement can be altered significantly from the original contract. While the theory of loan sales
presented in Gorton and Pennachi (1995) applies to syndicated loans, the problems of moral hazard are
less severe in a syndicated loan setting because lenders are mutually tied to one contract and the lead
arranger holds part of the loan. Second, as Dahiya, Puri, and Saunders (2003) demonstrate, the market for
loan sales has developed into a market for mostly distressed debt. Over half of the firms in their sample
of loan sales file for bankruptcy within three years of the initial sale of one of their loans. In contrast, the

7
majority of the syndicated loan market consists of firms outside financial distress. While loan sales in the
syndicated loan market are increasingly important, the secondary market is small relative to the total
volume. In 2001, the secondary market was approximately $120 billion whereas aggregate syndicated
loans outstanding were over $2 trillion. The limited size of the secondary market is partially due to
explicit contractual restrictions on the ability of syndicate members to sell loans.
B. Existing Research
Previous research on syndicated loans is limited when compared to research on public equity and
debt underwriting markets or venture capital. Most relevant to the analysis are four papers that evaluate
syndicate structure. Simons (1993) examines the incentives to syndicate and finds evidence that
diversification is the main reason behind syndication. She also finds that lead arrangers syndicate a larger
portion of “quality” loans, where quality comes from ex post examiner ratings. Dennis and Mullineaux
(2000) find that lead arrangers are more likely to syndicate loans when the loan is large, the borrowing
firm is public, and the lead arranger has a strong reputation. They also find that, conditional on a loan
being syndicated, a larger percentage of the loan is syndicated when there is public information on the
borrowing firm and when the lead arranging bank has a strong reputation. Lee and Mullineaux (2004)
find that syndicates are more concentrated when the quality of information on borrowing firms is worse.
They also find that syndicate structure is more concentrated with fewer lenders when firms have a higher
default probability. Jones, Lang, and Nigro (2005) find that information asymmetry, loan credit quality,
capital constraints, and maturity affect the amount of the loan retained by the agent bank.
The work presented here extends the existing research on syndicated loans in several new
directions. First, to my knowledge, this paper is the first to explicitly address how participant lender
characteristics might mitigate or exacerbate information asymmetries between lenders and borrowers, and
it is the first to explore how relationships among syndicate members evolve. The participant choice
analysis conducted in this paper helps enrich the understanding of how information asymmetry affects
relationships. Second, this paper explores how information asymmetry affects syndicate structure among
public firms. Confirming the basic findings of information asymmetry in a sample of public firms is

8
important, given that differences in size may explain key differences in syndicate structure between
public and private firms. Third, I explore the dynamic effects of information asymmetry on syndicate
structure for a given borrower. I find evidence that problems of information asymmetry affect syndicate
structure less when borrowers repeatedly access the market. Fourth, there is an implicit assumption in the
previous literature that adverse selection is the key result of information asymmetry; little attention is
given to moral hazard. I attempt to distinguish between adverse selection and moral hazard predictions,
and I find qualified evidence that moral hazard appears to be the more prominent feature of this market.
The primary focus of this paper is how information asymmetry affects syndicate structure and the
composition of the syndicate. Information asymmetry may also affect the existence of covenants and
restrictions on loan sales in the syndicated loan market. Bradley and Roberts (2003) use Loan Pricing
Corporation’s Dealscan and find that smaller firms, firms with higher growth opportunities, and highly
levered firms are more likely to have loans with covenants. Mullineaux and Pyles (2004) analyze
restrictions on loan sales. They find that smaller firms are more likely to have restrictions on loan sales,
which they interpret as evidence of banks fostering relationships.
In addition to these papers on syndicate structure in the U.S. market, there are other lines of
research on syndicated loans. Preece and Mullineaux (1996) and Megginson, Poulsen, and Sinkey (1995)
conduct event studies using the market value of the firm and syndicated loan announcements. Esty and
Megginson (2003) evaluate syndicate structure on project finance syndicated loans to firms in 61 different
countries. They find that loans in countries with weaker creditor protection have more syndicate
members, which they interpret as a mechanism to prevent strategic default by borrowers. Esty (2004) and
Qian and Strahan (2004) examine syndicated loans to firms in different countries with a focus on how
legal and financial systems affect syndicated loan composition. There is also a literature on the pricing of
syndicated loans and default risk (Thomas and Wang (2004), Altman and Suggitt (2000), and Angbazo,
Mei, and Saunders (1998)). This paper is related to research that explores the role of multiple bank
relationships (Detragiache, Garella, and Guiso (2000), Houston and James (1996)).

9
Research on syndicated loans fits into a wider literature that examines the importance of
syndicate structure in venture capital and securities underwriting markets. Corwin and Schultz (2005)
examine IPO syndicates and find evidence that co-managers serve an important information production
role, and they find that previous relationships among syndicate members are strong determinants of future
syndicate relationships. Narayanan, Rangan, and Rangan (2004) examine SEO syndicates and find
evidence that commercial banks with lending relationships with the borrower tend to co-manage with
reputable investment banks. Aghion, Bolton, and Tirole (2004) derive a model to describe the incentives
of general partners in venture capital syndicates, and Lerner (1994) and Amit, Brander, and Antweiler
(2002) empirically evaluate venture capital syndicates. This paper is the first, to my knowledge, to
explore how syndicate relationships are formed and how they persist in the syndicated loan market.
II. Data and Summary Statistics
A. Data
I obtain my primary sample of syndicated loans from Loan Pricing Corporation’s Dealscan,
which contains detailed information on syndicated loan contract terms, lead arrangers, and participant
lenders. The primary sources of data for Dealscan are attachments on SEC filings, reports from loan
originators, and the financial press. The sample I employ includes 12,672 syndicated loan deals to 4,687
U.S. nonfinancial firms from 1992 through the first half of 2003. The full Dealscan database includes
19,359 unsponsored, confirmed syndicated loan deals to firms for these years. I exclude syndicated loans
without data on industry (1,379), firm sales information (3,265), or firm state (141). Of the remaining
14,574 loans deals, I exclude any loan to a firm that has a ticker available, but for which I could not link
the firm to Compustat (901). The remaining sample contains 13,673 loans. The final data restriction
involves lead arrangers. I drop any loan that has a lead arranger that is not one of the top 100 lead
arrangers for the full sample period (1,001). This restriction makes data collection manageable (as
discussed below); however, all core results in this paper are robust to the inclusion of these 1,001 loans.
The final sample contains the remaining 12,672 loans. Firms in the sample with ticker and/or credit

10
rating data available are subsequently matched to Compustat to generate a richer set of financial variables.
This matching process yields detailed financial data for 9,681 of the loans in the sample.
The analysis presented here evaluates syndicated loan deals. A syndicated loan deal may contain
more than one loan tranche. In my sample, 75% of the loan deals contain only one tranche, 20% of the
loan deals have two tranches, and there are a total of 17,117 loan tranches for the 12,672 loan deals. A
deal-level analysis, as opposed to a tranche-level analysis, is appropriate for two reasons. First, the actual
syndicated loan contract is drafted at the deal level, and covenants and all lenders are listed together on
this contract, even if a lender loans only on one tranche. While the maturity and pricing of the loan
tranches can vary within a syndicated loan deal, there is one contract, and all lenders are chosen on the
tranches collectively, not independently. Second, because multiple tranches on the same syndicated loan
deal cannot be treated as independent observations, such an analysis produces standard errors that are
improperly small. All results presented here are robust to a tranche-level analysis; the results are very
similar quantitatively and significance levels are actually stronger in the tranche-level analysis. For this
analysis, the number of lenders and the amount held by each lender are calculated at the deal level.3
Part of the analysis below focuses on which participant lenders are chosen as syndicate members.
For this analysis, I collect data on the characteristics of the lenders. For the sample of loans, 689 financial
institutions serve at some point as lead arrangers and 2,341 serve as participants.4 To make data
collection manageable, I collect data on the top 100 lead arrangers and top 125 participants, by number of
loans.5 These “top lenders” represent 96% of the total number of lead arrangers and 85% of the total
number of participants. Data on lenders come from (1) the Federal Reserve Y9C filings for U.S.
regulated commercial banks, (2) the Compustat Industrial Annual dataset for other U.S. financial firms,
and (3) the Compustat Global Financial Services dataset for non-U.S. financial firms. From these
sources, I extract data on location, total assets, and equity to asset ratios for participants in my sample.
All financial institutions are aggregated to their parent company and inherit the characteristics of
the parent company (geographic location, total assets, etc.). I control for mergers among my sample, and
acquired firms are aggregated to their acquirers at the effective date of the merger. In addition, acquiring

11
financial firms inherit both previous lead arranger-participant relationships and previous borrowing firm
relationships of the acquired firm. Using the entire sample of syndicated and sole-lender loans from 1990
to 2003, I calculate measures of previous relationships for any firm that has a previous loan in the
Dealscan sample.
B. Summary Statistics
[TABLE I]
Table I presents summary statistics. Summary statistics for firms are calculated by examining
averages across all loans by a given firm. Borrowing firms have $1.8 billion in sales on average, and the
median is $367 million. Borrowers have an average of 1.12 previous quarters in which they accessed the
syndicated loan market, and about 31% of firms have an S&P senior unsecured debt rating. I also include
summary statistics for firms linked to Compustat and display data on assets (data6), leverage
((data9+data34)/data6), and earnings to assets ((data14+data18)/data6)). In terms of loan
characteristics, the average loan is $364 million with a maturity of 1,103 days. About 22% of deals
include a term loan tranche. The interest rate spread on drawn funds is available for only 10,898 loans;
the average interest rate spread on drawn funds is 159 basis points above LIBOR.
The average loan has 8.1 lenders, 1.7 lead arrangers, and 6.4 participant lenders. For a sub-
sample of 4,414 loans, I have the share held by each lender in the syndicate. I use this data to construct a
variety of measures, including the percentage of the loan kept by the lead arranger, the total amount kept
by the lead arranger, and the total exposure of the lead arranger, which is calculated as the amount of the
loan divided by the total assets of the lead arranger, all multiplied by 100. The average percent kept by
the lead arranger is 28.5%. I also construct a Herfindahl index as a measure of the concentration of
holdings within a syndicate. The Herfindahl is calculated using each syndicate member’s share in the
loan; it is the sum of the squared individual shares in the loan, and varies from zero to 10,000, with
10,000 being the Herfindahl when a lender holds 100% of the loan. The reason given for most loans is
general corporate purposes or working capital (42%). Refinancing and acquisition are the second and
third most common purposes, respectively.

12
[TABLE II]
Table II lists the top five lead arrangers (by volume) and top five participants (by number of
deals) for syndicated loan deals to private and public firms from 2001 to 2003. With the exception of
Fleet and Deutsche Bank, the top five lead arrangers are the same on loans to public and private firms.
The third column of Table II lists the most common syndicate participant for each of the top six lead
arrangers, and the percentage of the lead arrangers’ arranged loans on which the participant was a
syndicate member. For example, Bank of America chose Fleet more than any other lender and Fleet was
on 20% of its arranged loans. The third column presents the upper bound on persistence in relationships
between lead arrangers and participant lenders. While persistence is high between Citigroup and
JPMorganChase, the overall measures of persistence are low when compared to other markets that rely on
syndication. On average, a given participant for a lead arranger has been on 13% of the arranged loans
for the lead arranger in the past year. Corwin and Schultz (2005) examine IPO syndicates in the 1990s
and find higher average persistence in relationships between syndicate members (see their Table IX).
III. Information Asymmetry: Theoretical Framework and Empirical Implementation
Information asymmetry between firms and their investors and the resulting agency problems are
key aspects of models that explain macroeconomic fluctuations (Bernanke and Gertler (1989), Holmstrom
and Tirole (1997)), external financing constraints (Bernanke, Gertler, and Gilchrist (1996)), and the
fragility of the small business sector (Rajan (1992), Kashyap, Stein, and Wilcox (1993)). Models of
information asymmetry in corporate finance, such as Diamond (1991) and Boot and Thakor (2000), have
been used empirically to explore the differences between relationship-driven bank loans (where an
informed lender retains the entire loan), and public debt issues (where an informed lender/underwriter
sells the entire loan). Syndicated loans are positioned between these two extremes, having characteristics
of both private sole-lender loans and public debt issues underwritten by a financial institution. In
addition, firms from the entire credit spectrum use syndicated loans. These two facts make empirical
analysis of how information asymmetry affects financing arrangements promising in this market.

13
Information asymmetry and the need for monitoring are key assumptions in early theories of
banking (Leland and Pyle (1977), Diamond (1984)). Some of Diamond’s (1984) insights on joint
monitoring apply directly to the syndicated loan market. First, monitoring of debt agreements by multiple
creditors leads to superfluous costs and inefficient free-riding. Creditors therefore want to “delegate”
monitoring to one financial intermediary. At the same time, delegation of monitoring leads to “delegation
costs:” the delegated monitor faces incentive problems given that it no longer invests only its own money.
The analysis applies directly to the syndicated loan market, where the lead arranger is the delegated
monitor. The lead arranger is charged with monitoring the firm, but there are incentive problems given
that the lead arranger retains only a share of the loan. In Diamond (1984), creditors without monitoring
duties are depositors; in the context of syndicated loans, participant lenders are the creditors without
monitoring duties.
While Diamond (1984) provides background to motivate the empirical analysis, I use similar
models by Holmstrom (1979), Holmstrom and Tirole (1997), and Gorton and Pennachi (1995) that apply
even more directly to this market. In this framework, the lead arranger is an “informed lender” who is
able to monitor and learn about the firm through unobservable and costly effort. Potential participant
lenders are “uninformed lenders” who rely on the information and monitoring provided by the informed
lender to make profitable investments in firms. There exists a moral hazard problem at the lead arranger
level, given that informed lender effort is unobservable. The informed lender’s potential loss is
increasing in the portion of the loan it holds, and so the amount of effort exerted by the lead arranger in
due diligence and monitoring is declining in the portion of the loan it syndicates out to participants. At
the extreme, only long-run reputation considerations govern due diligence by the lead arranger if the lead
arranger holds none of the loan (as in a debt underwriting, for example). In this framework, a lead
arranger exerts less effort than it would if its actions were fully observable. Participant lenders correctly
predict such “shirking” by the lead arranger, and they choose to hold less of the loan. Holmstrom and
Tirole (1997) succinctly describe this aspect of their model by noting that “[uninformed lenders] invest

14
directly in the firm, but only after the monitor has taken a large enough financial interest in the firm that
the investors can be assured that the firm will behave diligently” (674).
The key assumption in the model is that lead arrangers cannot credibly commit to doing the
proper due diligence because their effort is unobservable. If lead arranger effort were perfectly
observable, participant lenders (or the borrower) would compensate the lead arranger for its monitoring
and due diligence effort. The amount held by the lead arranger would be irrelevant, and one could
imagine a situation in which the monitor of the loan held none of the loan at all. Therefore, in broader
terms, the Holmstrom and Tirole (1997) framework describes why a lender with monitoring duties must
retain a stake in the loan. The null hypothesis in the empirical framework is that lead arrangers do not
have to take a larger stake in the loan when the borrower requires more intense due diligence and
monitoring effort. Absent problems of unobservability, the share of the loan held by syndicate members
should be driven primarily by diversification needs.
In order to empirically implement this framework, I classify borrowing firms based on the degree
to which they require monitoring and due diligence; I refer to firms that need more monitoring and due
diligence as “opaque.” When borrowers are relatively transparent, the moral hazard problem for the lead
arranger is less severe. With transparent firms, traditional diversification incentives likely determine the
syndicate structure, and the lead arranger does not need to hold a relatively large share of the loan.6 As
the borrowing firm becomes more difficult to investigate and monitor (more “opaque”), lead arrangers
cannot credibly commit to the proper effort, and so they must hold a larger share of the loan.
A critical component of the empirical strategy is the measure of opacity. The primary measure of
opacity I use is shaped by existing research and practitioner interviews. Practitioner interviews indicate
that two main factors drive participation on syndicates, specifically, the quality of the firm, and how well
the participant bank “knows” the firm. The measure of information asymmetry I construct therefore
attempts to capture how well participating banks know the firm absent any information relayed by the
lead arranger. The practitioner evidence is similar to the results presented in Faulkender and Petersen

15
(2006) with respect to public bond issues: “We were told that the less banks had to introduce and explain
a new issuer to the market, the more likely a public bond issue … would be.”
With these facts in mind, I construct a measure of information asymmetry based on the
availability of SEC filings and third-party credit ratings. More specifically, following Dennis and
Mullineaux (2000) and Lee and Mullineaux (2004), I rank firms into three categories. First, “private”
firms are firms with no ticker and no S&P senior unsecured credit rating, that is, firms that lack publicly
available SEC filings. Although audited accounting information may be available for private firms, the
identifying assumption is that participant lenders are more dependent on the lead arranger for both its
monitoring skills and its ability to collect detailed information when the borrowing firm is not registered
with the SEC. In addition, the penalties for falsifying accounting information are less severe when a
borrower is not SEC-supervised, which makes monitoring by a lead arranger more important. The second
group consists of “unrated” firms, that is, public borrowers with publicly available accounting data that
lack an S&P senior unsecured debt rating. Finally, “transparent” firms are public firms with S&P senior
unsecured debt ratings; these firms have publicly available accounting information with credit quality
measured by an independent third party.7 Information asymmetry between lenders and borrowers is least
severe on loans to transparent firms.
There are two main drawbacks to the use of this measure, both of which I address in detail in the
robustness tests at the end of Section IV. First, the existence of publicly available SEC filings and a
credit rating is strongly correlated with the size of the firm, which ultimately may impact the structure of
syndicates. Second, there are a number of endogeneity concerns associated with analyzing the effect of a
credit rating on a corporation’s financing decisions (Faulkender and Petersen (2006)). Robustness tests in
Section IV show that neither concern affects the core results of the paper.
The theoretical framework above applies most directly to the portion of the loan retained by the
lead arranger; the lead arranger should hold a larger portion of the loan if the borrower requires more
intense due diligence and monitoring effort. In the empirical implementation, I use the percentage of the
loan retained by the lead arranger, the dollar amount retained by the lead arranger, and the “exposure”

16
retained by the lead arranger (which is the amount divided by the total assets of the lead arranger). I also
use a Herfindahl index measure of concentration to capture any effects of “joint” monitoring. For
example, suppose a lead arranger and one participant lender both retain 40% of the loan, and two other
participant lenders retain 10%. The Herfindahl index captures this “concentration” among the two
principal lenders more accurately than the percentage held by the lead arranger.
[TABLE III]
Table III presents means and standard errors for private, unrated, and transparent borrowing
firms. Transparent firms are larger and obtain larger loans. In terms of syndicate structure, transparent
firms have a larger number of lenders, lead arrangers, and participant lenders. On average, the lead
arranger holds almost twice the share of the loan when the borrowing firm is private (38%) or unrated
(35%) compared to transparent (20%), and the syndicate is more concentrated (Herfindahls of 3,300 and
3,000 compared to 1,600). The unconditional means suggest that lead arrangers retain a larger share of
the loan and form a more concentrated syndicate when borrowers are opaque.
The bottom half of Table III addresses the concern that the opacity measure simply proxies for
the size of the firm. For both the percentage held by the lead arranger and the Herfindahl concentration, I
show that these trends are evident among the smallest, middle, and largest one-third of firms in the
sample, by sales. The lead arranger holds more of the loan and forms a more concentrated syndicate on
loans to transparent firms, and these trends are true among subsamples based on size. Thus, size does not
appear to drive the trend, which I confirm in regressions in the next section.
IV. Information Asymmetry and Syndicate Structure
A. Syndicate Structure Regressions
In this section, I examine how variation in the opacity of the borrowing firm affects syndicate
structure, and whether the effect is consistent with the information asymmetry hypotheses outlined above.
The general specification I test is
iiit
ti OpaqueXYeardumSynd εγβα ++++= ∑=
12
1. (1)

17
The left-hand-side variables are measures of the syndicate, such as the number of lead arrangers, the
number of participants, and the percentage retained by the lead arranger. The key right-hand-side
variable of interest is Opaque, which represents measures, described above, of the degree to which a
financial institution must investigate and monitor the borrower. The key coefficient of interest is γ , or
how increased “opacity” affects syndicate structure. In other words, γ measures whether lead arrangers
hold more of the loan, form a more concentrated syndicate, or select fewer participants when the
borrowing firm is more difficult to investigate or monitor.
The control variables (X) include year and industry indicator variables, the natural log of firm
sales, and a variety of controls for loan characteristics. As Table III demonstrates, there are important
differences in the size of firms and loan amounts across private, unrated, and transparent firms. In light of
these differences, I employ a set of controls on loan amount that includes three splines. For each year, I
split the sample into three groups based on the amount of the loan. I then allow the intercept and the
natural log of the amount of the loan to vary by each group.8 In untabulated results, I add up to five
splines on loan amount and firm sales and obtain results very similar to those reported here. I also control
for the natural log of maturity of the loan in days, an indicator variable for whether the loan has more than
one tranche, and an indicator variable for whether a loan deal contains a term loan. There is also
important variation in the purpose of syndicated loans. In all specifications, I include indicator variables
for the purpose of the loan.9 Finally, all standard errors are heteroskedasticity robust, and clustered at the
borrowing firm.10
[TABLE IV]
Table IV presents the estimates using transparent borrowing firms as the omitted group. The top
two rows show that loans to private and unrated firms have fewer participant lenders, a more concentrated
syndicate, and the lead arranger holds more of the loan (whether measured by the percent of the loan,
amount of the loan, or exposure). Columns (1) and (2) report the results on the full sample. Column (2)
shows that private firms have almost 25% fewer participant lenders than transparent firms at the mean,

18
after controlling for the size of the loan and the size of the firm. Columns (3) through (7) isolate the
sample to loans for which the amount held by each syndicate member is available. In the subsample, the
percentage held by the lead arranger is 10% higher for private firms at the mean (2.94/28.5), and the
syndicate structure is 11% more concentrated using the Herfindahl index (259/2,382). Both of these
coefficient estimates are statistically distinct from zero at the 1% level.
The results in Table IV are consistent with the theoretical framework of agency and moral hazard
outlined above. Firms that lack SEC filings are more difficult to investigate and monitor, which
exacerbates the moral hazard problem of the lead arranger. When borrowing firms lack publicly available
SEC filings, participant lenders are more reliant on the lead arranger for detailed information on the
borrower. Also, the absence of SEC oversight reduces the penalties for borrowing firms from
manipulating or overstating financial health or earnings. Thus, firms that lack SEC filings also require
additional monitoring. Unrated firms have public SEC filings, but lack a publicly available third party
debt evaluation. The point estimates in Table IV present an ordering consistent with moral hazard in a
setting of information asymmetry. Lead arrangers retain the largest share of the loan and form the most
concentrated syndicates with the fewest participants when borrowing firms are private. The same pattern
is observed, to a weaker degree, when borrowing firms are public but unrated. The ordering of the
estimated coefficients in column (2) for private and unrated firms is significant at the 5% level.
B. Borrowing Firm Reputation
[TABLE V]
Table IV provides evidence in support of the theoretical framework described above. When the
borrower requires more investigation and monitoring effort, the lead arranger retains a larger stake in the
loan and forms a more concentrated syndicate. In this section, I take into account the fact that the
syndicated loan market is one of repeated interactions. Given this fact, borrowers should become more
known to potential participants as they repeatedly access the market, and thus the theory predicts that lead
arrangers should hold less of the loan. Table V confirms this prediction. I group both private and unrated
firms into one category (“opaque”) and I analyze how the syndicate structure changes as firms repeatedly

19
access the market. Column (1) shows that lead arrangers hold more of the credit when the borrowing firm
is opaque. Column (2) shows that the lead arranger holds less of the credit when the borrower has more
previous syndicated loans. Column (3) examines the interaction of opacity with previous syndicated
loans. The coefficient on the opaque indicator variable implies that the lead arranger retains 3.55% more
of the loan when the borrower is opaque and has never accessed the syndicated loan market (relative to a
transparent firm that has never accessed the market). The effect of previous syndicated loans on the
percentage retained by the lead arranger is statistically insignificant for transparent firms (the omitted
group), but is negative and statistically significant for opaque firms (the interaction term). In terms of
magnitudes, the results in column (3) imply that the lead arranger holds 3.6% more of the loan (or 13% at
the mean of 28.5) when the borrower is opaque and has never accessed the syndicated loan market, and
2.3% more of the loan when the opaque borrower has accessed the market once in the past. The results in
columns (4) through (6) examine the Herfindahl index and find similar results.
Table V supports the theoretical framework outlined above. Lead arrangers retain a larger share
of the loan when the borrower requires more due diligence and monitoring, and this is especially true
when the borrower is new to the syndicated loan market. As the borrower repeatedly accesses the market,
the result is diminished and the lead arranger is able to syndicate out more of the loan. This result is
similar to the result in Faulkender and Petersen (2006), who find that firms with publicly available credit
ratings are able to raise more debt. My results imply that there are important frictions to obtaining the
initial syndicated loan, and these frictions are less severe as the borrower repeatedly accesses the market.
In addition, the results in Table V confirm that the lack of publicly available SEC filings or third-party
credit rating proxies well for opacity. Lead arrangers only reduce their stake in the loan as a private or
unrated borrower repeatedly accesses the market. This effect disappears among public firms with third-
party credit ratings, which suggests that these firms are already known even when they first access the
syndicated loan market.
C. Lead Bank Reputation

20
When the borrowing firm requires more intense investigation and monitoring, the lead arranger
retains a larger portion of the loan to commit to exerting costly effort. Another possible solution to the
moral hazard problem at the level of the lead arranger is lead arranger reputation. The syndicated loan
market is one of repeated interactions, and the most reputable lead arrangers may be able to overcome
moral hazard concerns without retaining a larger share of the loan.
[TABLE VI]
Table VI measures lead arranger reputation using the market share, by amount, of the lead
arranger in the year prior to the loan in question. Column (1) shows that more reputable lead arrangers
retain less of the loan. The interaction term in column (2) shows that the effect of reputation on the
percentage of the loan retained by the lead arranger is more pronounced on loans to opaque firms. In
other words, I cannot reject the hypothesis that a lead arranger retains the same amount of the loan when
the borrower is transparent, irrespective of its reputation. But if the borrower is opaque, more reputable
lead arrangers are able to syndicate out a larger portion of the loan. In terms of magnitudes, the results in
column (2) imply that a lead arranger with no market share in the previous year retains 4.25% more of the
loan when the borrower is opaque. A lead arranger with median reputation (market share of 0.05) retains
[4.25 – 13.36*0.05 =] 3.6% more of the loan when the borrower is opaque. Only reputable borrowers
with market shares of over 0.32 (in the 99th percentile) are able to retain no more of the loan when the
borrower is opaque. In other words, only lead arrangers with reputation in the extreme right tail of the
distribution can completely offset the effect of information asymmetry. Columns (3) and (4) present
similar results for the concentration of the syndicate. However, in column (4), the effect of lead bank
reputation appears to reduce the share retained by the lead arranger for all firms; the point estimate on the
interaction term implies that the result is even stronger for opaque firms, although this coefficient estimate
is statistically distinct from zero at only the 20% confidence level. Overall, these results imply that
reputation can mitigate, but not completely eliminate, problems of information asymmetry.
D. Moral Hazard versus Adverse Selection

21
I interpret the above results as evidence of moral hazard with respect to lead arranger effort in
monitoring and due diligence. An alternative explanation is a signaling model based on adverse selection.
If a lead arranger has private information on a borrower unavailable to participant lenders, it may be
tempted to syndicate out more of a loan when private information is negative. Participant lenders
correctly predict such behavior, and the lead arranger holds more of the loan to “signal” that the loan is of
high quality: The lead arranger retains a larger share of the loan and forms a more concentrated syndicate
when information asymmetry is severe. Can these two hypotheses be empirically distinguished? The key
distinction in the adverse selection and moral hazard hypotheses is the assumption of where information
asymmetry lies. In the adverse selection hypothesis, the lead arranger has private information on the firm
that is unknown to participant lenders. In the moral hazard hypothesis, all lenders are unfamiliar with the
borrower and the moral hazard problem is most severe when the lead arranger must learn about the firm.
[TABLE VII]
To distinguish these two hypotheses, I use previous lending relationships between the borrower
and the lead arranger as a measure of the information advantage of the lead arranger with respect to
participant lenders. If the adverse selection hypothesis is true, then a lead arranger with a previous
relationship with the borrower should be forced to retain more of the loan and form a more concentrated
syndicate. The prediction is the opposite under the moral hazard hypothesis; a lead arranger with a
previous lending relationship with the borrower has already put in the effort required to learn about the
firm, and so should be able to retain less of the loan and form a more diffuse syndicate.
Table VII tests these alternative hypotheses. In all specifications, I control for the number of
previous loans by the borrower in the sample, which should approximate for the information on the
borrower held by potential participant banks. Column (1) shows that that the lead arranger retains more
of the loan when the borrower is opaque, but less of the loan when there is a previous relationship
between the borrower and lead arranger. This result supports the moral hazard interpretation of results. If
a previous lending relationship between the borrower and lead arranger proxies well for the information
advantage the lead arranger has over participants, then the adverse selection hypothesis implies that the

22
lead arranger would be forced to retain a larger fraction of the loan when a previous lending relationship
is present. Column (1) shows the opposite result. The point estimate on the interaction term in column
(2) implies that this result is differentially weaker when the borrower is opaque, but this result is not
statistically distinct from zero at a meaningful level. The results using the Herfindahl index measure of
concentration are similar.
The relevant measure for adverse selection is the information advantage of the lead arranger over
potential participant lenders. In untabulated results, I also use the percentage of the participants in the
syndicate that have a previous relationship with the borrowing firm as a control variable that measures
how familiar the syndicate members are with the borrower. Using this alternative measure, I find similar
results. The lead arranger retains less of loan when there is a higher percentage of participants that know
the firm, but still retains less of the loan if the lead arranger itself has a former lending relationship with
the borrower.
Table VII presents qualified evidence that moral hazard is the key problem associated with
information asymmetry; moral hazard, and not adverse selection, forces the lead arranger to retain a larger
share of the loan and form a more concentrated syndicate. There is one important caveat. It is difficult to
disentangle borrower reputation from having a previous lending relationship with the lead arranger.
Firms with many previous loans are more likely to have a previous lending relationship with the lead
arranger, and the former, rather than the latter, may explain why the lead arranger is able to syndicate out
more of the loan.
E. Information Asymmetry: Secured versus Unsecured Loans
The results above imply that borrower and lead bank reputation can improve the ability of lead
arrangers to overcome information asymmetry and syndicate out larger portions of loans. In this section,
I explore whether the existence of collateral can also mitigate problems of information asymmetry. On the
one hand, the theoretical framework suggests that participant lenders force the lead arranger to hold more
of the loan to reduce shirking. If loans are secured, then the expected monetary loss for the participant
lenders resulting from shirking by the lead arranger should be lower. The resulting agency problems

23
should therefore be less severe in the sample of secured loans. On the other hand, if a loan is secured,
then the lead arranger must monitor the value of the collateral and enforce asset sales restrictions
covenants.11 The lead arranger must have the proper incentives to engage in diligent monitoring of the
collateral, and agency problems might therefore be more severe on secured loans.
To test the competing hypotheses, I use data on the existence of collateral in Dealscan. One
drawback of Dealscan is the large number of loans for which collateral data are missing. In my sample,
data on the existence of collateral are missing for more than 50% of the loans (6,558 of 12,672 loans).
For this analysis, I limit the sample to only loans for which data exist describing whether the loan is
secured or unsecured and for which the percentage held by the lead arranger is available. In this sub-
sample, 59% of the loans are secured.
[TABLE VIII]
In Table VIII, I split the sample into secured and unsecured loans, and the coefficient estimates
show that the core results are stronger in magnitude and statistical significance among unsecured loans.
More specifically, the lead arranger retains a larger share of the loan and forms a more concentrated
syndicate when the borrower is opaque and the loan is unsecured. While the coefficient estimates are
larger, there is evidence that syndicates are more concentrated for opaque borrowers even among secured
loans (column (3)). Information asymmetry also influences syndicate concentration among secured loans,
albeit to a lesser degree. Overall, the evidence is suggestive, but not conclusive, that problems of
information asymmetry are more severe among unsecured loans.
F. Robustness Checks
There are two potential drawbacks from the primary measure of opacity used in this section.
First, the existence of publicly available SEC filings and a credit rating are positively correlated with the
size of the firm and the size of the loan, both of which may affect syndicate structure. In all regressions
reported above, I include three splines of control variables for the amount of the loan and the natural log
of firm sales; however, there may still be residual concern that the private and unrated indicator variables
only proxy for size and not information asymmetry. If the private and unrated indicator variables proxy

24
for size and there are other reasons that large firms may loan from more banks, then the results may
provide no evidence of the effect of information asymmetry on syndicate structure.
The results above help to allay this concern. First, Table III shows that lead arrangers retain a
larger share of the loan when the borrower lacks SEC filings and a credit rating, and this is true among the
smallest, middle, and largest thirds of the sample. Second, the results on borrower and lead bank
reputation suggest that reputation uniquely reduces problems of information asymmetry among firms
without publicly available SEC filings or a credit rating. There is no obvious reason why borrower or
lead bank reputation would reduce the amount held by the lead arranger for loans to small firms.
[TABLE IX]
Table IX provides evidence that further addresses this concern. In columns (1) and (2), I limit the
sample to all private and unrated firms and only transparent firms with sales that are below the median
sales, by year, for all transparent firms. Transparent firms in the subsample used in columns (1) and (2)
are smaller, on average, than the private and unrated firms ($795M versus $867M), and the point
estimates are almost identical to those reported in Table IV. These results suggest that the control
variables in Table IV adequately control for the size effect, and the coefficient estimates on the private
and unrated indicator variables are not proxies for size.
In columns (3) through (6), I limit the sample to public firms with Compustat data available and
examine alternative measures of information asymmetry that are less correlated with size. Columns (3)
and (4) examine the ratio of positive accruals to total assets. 12 Teoh, Welch, and Wong (1988) and Sloan
(1996) show that the use of positive accruals is associated with earnings inflation and opacity of cash
flows. Firms that report positive accruals require more rigorous monitoring by a financial institution,
which exacerbates the moral hazard problem. The coefficient estimates on the effect of the accruals to
assets ratio in columns (3) and (4) are positive and statistically distinct from zero at the 5% level of
confidence, indicating that lead arrangers retain a larger share of the loan and form a more concentrated
syndicate when the borrower more heavily uses positive accruals. Columns (5) and (6) examine the
R&D to assets ratio (data46/data6) as a measure of information asymmetry. Firms with high R&D

25
investment have earnings that depend on the realization of future investment opportunities (Lorek, Stone,
and Willinger (1999)); the evaluation of such future earnings realizations is difficult and requires
additional effort by the lead arranger. Columns (5) and (6) show similar results, with the coefficient
estimate in column (5) statistically distinct from zero at the 10% level of confidence. The results in Table
IX suggest that public firms that require more intense monitoring have a higher percentage of the loan
retained by the lead arranger, and a more concentrated syndicate. These results also suggest that
information asymmetry, not the size of the firm, drives the results in Table IV.
The second drawback is the potential endogeneity of the existence of a credit rating. Although it
is unlikely that a borrower’s decision to obtain a credit rating is a direct function of the structure of its
syndicated loan, there may be important indirect effects. For example, the amount of the loan retained by
the lead arranger may be determined by the maximum loan amount available to the firm, which in turn
may determine whether the firm issues public debt and hence has a credit rating. In an unreported
robustness check, I replicate the Faulkender and Petersen (2006) instrumental variables (IV) approach on
the sample of syndicated loans to public firms. The first stage regressions relate the probability of being
unrated to a set of instruments. I use the same four measures as instruments that Faulkender and Petersen
(2006) use: Whether a firm is in the S&P 500, whether the firm is listed on the New York Stock
Exchange, whether the firm is in a three-digit SIC industry that other firms with credit ratings are also in,
and whether the firm is more than four years old. Consistent with their estimates, I find a strong negative
relationship between the instruments and the probability of being unrated in the first stage. In the second-
stage specifications, I regress the percentage held by the lead arranger and the concentration of the
syndicate on the instrumented probability of being unrated. The coefficient estimates on being unrated
are larger in magnitude in the IV specifications, and remain statistically distinct from zero at the 5% level.
Overall, the results suggest that if an endogeneity bias exists in the ordinary least squares estimates, it
likely biases the results toward zero.
V. Information Asymmetry and Participant Choice
A. Characteristics of Participant Lenders

26
This section explores how information asymmetry between lenders and borrowers in the
syndicated loan market affects which participant lenders end up as syndicate members. I examine
whether lead arrangers select potential participants that are more familiar with the borrowing firm when
information asymmetry problems are potentially severe.13 For example, are lead arrangers more likely to
choose a bank that is in the same state as the borrower when the borrower is opaque?
The analysis in this section focuses only on lenders in the top 125 participants or top 100 lead
arrangers in the full sample, by number of deals. These top lenders account for 68,156 of the 80,871
participants in the sample, or about 85%. The inclusion ratio is similar across all types of firms: 81% for
opaque firms, 84% for unrated firms, and 86% for transparent firms. There is one important limitation in
the Dealscan data with regard to lead arranger-participant relationships. When more than one lead
arranger is present, I cannot distinguish which lead arranger brought a given participant to the syndicate.
For example, if Bank 1 and Bank 2 are lead arrangers and Bank 3 is a participant, I cannot infer whether
Bank 1 or Bank 2 brought Bank 3 to the deal. This presents a problem in tracking previous relationships
between lead arrangers and participants, and in analyzing how the relationship affects the current deal.
Thus, when I analyze lead arranger-participant relationships, I limit the sample to loans for which there is
exactly one lead arranger. This limitation reduces the sample to 8,711 loans and 43,769 participants. I
limit the sample to deals with exactly one lead arranger only when evaluating relationships between lead
arrangers and participants. For the rest of the analysis, I use the entire sample.
[TABLE X]
Table X presents the characteristics of chosen participants by the credit reputation of the
borrower. Participants on loans to private borrowers are smaller and better capitalized. The participants
are more likely to be foreign when the borrowing firm is transparent. Relative to when borrowers have
public credit ratings, chosen participant lenders are 8% more likely to be in the same region or census
division, and 4% more likely to be in the same state as the borrowing firm when the borrowing firm is
private or unrated. In other words, participant lenders for rated companies are more likely to be foreign
banks, and more likely to be further away from the borrowing firm even conditional on being a domestic

27
bank. Compared to rated firms, the lead arranger chooses participants that are geographically closer to
the borrowing firm when the borrowing firm has no public financial information.
In terms of previous direct lending relationships, chosen participant lenders are more likely to
have been a former lead or former participant for the borrowing firm when the borrowing firm is
transparent. A total of 18% of participants on transparent deals are previous leads for the borrowing firm,
and 65% are previous participants. The numbers are 10% and 50% when the borrowing firm is private.
This last result, however, should be viewed with caution. Transparent firms have more previous loans in
the sample, and more lead arrangers and participants per previous loan. Transparent firms therefore
mechanically have a higher probability of having a previous relationship with a given participant. Using
the fraction of previous firm loans on which a participant lender was a previous lead or participant is one
way to adjust for this problem; the results show no statistical difference between transparent, unrated, and
private firms. However, even this statistic is problematic because transparent firms have more leads and
participants per previous loan, so again there is a mechanical relationship. As I demonstrate below, a
better way to understand how previous relationships impact the choice of participants is to ask the
converse question: How do previous relationships with a firm affect the probability of being chosen as a
participant?
The bottom section of Table X displays the basic differences in lead arranger-participant
relationships for the subsample of loans with exactly one lead arranger. The overall percentage of
participants that are in the same region, census division, or state as the lead arranger is relatively small
compared to the percentage in the same region as the borrowing firm.14 In terms of the fraction of
previous deals led by the lead arranger, participants are on a lower fraction when the borrowing firm is
private or unrated. This last result suggests that lead arranger-participant relationships are more persistent
on transparent loans.
B. Participant Choice Probit Analysis
The second part of the participant analysis asks the following question: What factors influence the
probability of a lender being chosen as a participant on a given deal? To answer this question, I employ a

28
maximum likelihood probit choice model similar to the model used in Corwin and Schultz (2005) to
describe the choice of IPO syndicate members. I define the “potential” participant choice set as all
financial institutions that represent at least 0.5% of all participants for syndicated loans for the year of the
loan in question. The lead arranger on the loan is eliminated from the participant choice set. The probit
analysis seeks to explain what factors influence the probability of a financial institution being chosen.
More specifically, I estimate a probit of the form
)**()Pr( ijjiij BankLoanfBanktParticipan εγβα +++== . (2)
I am interested in how the characteristics of loan i and the characteristics of bank j influence the
probability that bank j is chosen as a participant on loan i. The critical parameter of interest is γ, and I am
particularly interested in how γ varies with the opacity of the borrowing firm. For example, how does the
existence of a previous relationship between a lender and a borrowing firm influence the probability of
being chosen as a participant, and how does this vary by the opacity of the borrowing firm?
This analysis is not a standard multinomial choice model as in McFadden’s (1974) multinomial
logit framework, in which there are x potential outcomes and one is chosen. Instead, here there are x
potential outcomes and any number of them can be chosen. Amemiya (1974) addresses maximum
likelihood probit estimation in a setting in which multiple outcomes can be simultaneously chosen. His
analysis implies that the proper maximum likelihood technique in this setting is a probit estimation in
which one analyzes the probability that any given potential lender is chosen as a participant. One critical
component of the analysis is the correlation structure of the error terms within a choice set. For example,
the fact that bank j is chosen on deal i affects whether or not bank k is chosen on deal i. Instead of
imposing any specific structure on the joint distribution of error terms for potential participants on the
same loan, I allow the correlation to vary through clustering. My approach is slightly different than that
proposed by Amemiya (1974): In particular, I allow the errors to be freely correlated across all potential
syndicate members on any loan by a given firm. Some firms have more than one loan, and I allow errors
to be correlated for all potential participants on any of the loans.

29
[TABLE XI]
Table XI presents the estimates. Transparent firms are the omitted group. Coefficients in Table
XI are marginal changes in probability, and coefficients and standard errors are multiplied by 100. In
addition to the variables reported, the estimation includes all deal-level variables included in the syndicate
structure analysis in Table IV, the size and capital positions of the potential participant lenders, and the
intercept is allowed to vary by credit reputation. Columns (1) and (2) ignore previous lending
relationships between the borrowing firm and potential participants in order to examine the entire sample
that includes first-time borrowers. The results in column (1) demonstrate that being in the same region as
the borrowing firm increases the probability of being chosen as a participant by 6.7% (on a mean of
8.6%), and being a foreign or unregulated domestic financial institution is negatively related to being
chosen as a participant. Column (2) examines how these effects vary as firms require more intense due
diligence and monitoring effort. The results in column (2) show that being in the same region as the
borrowing firm increases the probability that a lender is chosen by 5.5% for transparent firms; the
interaction terms show that this effect becomes 6.9% and 7.4% (or 26% and 35% stronger) for private and
unrated firms, respectively. When problems of information asymmetry are potentially severe, lead
arrangers are more likely to choose participant lenders that are geographically closer to the firm. I
therefore conclude that distance matters in the syndicated loan market: These findings are similar to the
evidence on sole-lender loans presented in Petersen and Rajan (2002) and Mian (2005).
Columns (3) and (4) limit the sample to borrowing firms that have at least one previous loan in
the entire Dealscan data set of loans from 1990 to 2003. One result is immediately apparent: There is a
large amount of persistence in borrowing firm-participant relationships. Column (3) shows that a former
participant for a borrowing firm is 27.3% more likely to be chosen as participant on the current deal.
When I interact previous relationships with the credit reputation of the borrowing firm (column (4)), I
find that former relationships are relatively more important when the borrowing firm is private or unrated.
For example, a lender that is a former lead arranger for a borrowing firm is 6.2% more likely to be chosen
as a participant, but the effect is more than 50% stronger when the borrowing firm is private. A lender

30
that is a former participant for a firm is 25.5% more likely to be chosen as a participant, but the effect is
10% stronger if the borrowing firm is private or unrated.
The results in Tables X and XI provide further evidence to support the moral hazard
interpretation of earlier results. If the lead arranger cannot commit to exert costly and unobservable effort
in its monitoring and investigation of the firm, one strategy is to choose participants that are closer to the
borrowing firm (both in terms of geographical location and previous relationships). The results in Tables
X and XI show that lead arrangers pursue this strategy, and do so more strongly when public information
on the borrowing firm is limited.
[TABLE XII]
How do lead arranger-participant relationships affect participant choice? Table XII presents a
probit analysis identical to Table XI, but on the subsample of loans with exactly one lead arranger and
with the inclusion of lead arranger-participant relationship measures. The results in columns (1) and (3)
imply that being in the same region as the lead arranger and having been on a recent syndicate with the
lead arranger both positively affect the probability of being chosen as a participant. However, the effects
are rather small, especially when compared with the effects of being a former lead or participant for the
borrowing firm. Column (3) shows that a lender that served on a syndicate with the lead arranger in the
previous quarter is 2.4% more likely to be chosen as a participant. A lender that served as a participant
for the borrowing firm is 27.5% more likely to be chosen as a participant. Moreover, the effect of lead
arranger-participant relationships does not vary by borrowing firm opacity. Neither the effect of being in
the same region as the lead arranger nor the effect of being on a recent syndicate with the lead arranger
differs when the firm is private or unrated. The overall results in Table XII suggest that previous lead
arranger-participant relationships are relatively less important than previous borrowing firm-participant
relationships, and that lead arranger-participant relationships are no more persistent on loans to private or
unrated firms. The findings suggest that, when information asymmetry is severe, a lead arranger selects
participants based on the participant’s familiarity with the borrowing firm, not based on the participant’s
familiarity with the lead arranger itself.

31
VI. Conclusion & Future Research
Syndicated lending represents an important source of corporate finance. Privately held, high
yield, and investment grade firms all utilize this financial product, and almost $1 trillion in new
syndicated loans are signed every year. The Federal Reserve Shared National Credit program reports
over $2 trillion in outstanding syndicated loan commitments to U.S. businesses in 2001.
This paper explores how information asymmetry between borrowers and lenders influences
financing arrangements in the syndicated loan market. I find evidence that information asymmetry affects
syndicate structure and the composition of syndicates in a manner consistent with prominent theories of
moral hazard. When borrowers require intense investigation and monitoring, the lead arranger attempts to
guarantee diligence in investigation and monitoring by increasing their risk exposure to the loan. Lead
arrangers retain a larger portion of the loan when borrowers are opaque, and they form a more
concentrated syndicate. I also find that lead arrangers choose participant lenders that are closer to the
borrower, both in terms of geographic proximity and previous lending relationships, when the borrower is
informationally opaque. Lead arrangers form relationships with certain participants, but these
relationships are far less important in determining who becomes a syndicate member than relationships
between borrowing firms and participants. I also examine the degree to which borrower and lead arranger
reputation can reduce the effects of information asymmetry on syndicate structure. Lead arrangers are
able to syndicate out a larger share of the loan when borrowers repeatedly access the syndicated loan
market, and if the lead arranger itself has a strong reputation.
The results viewed solely in the context of the syndicated loan market help us to understand a
large and important source of corporate finance. I believe these results can be viewed more broadly, and
can help us to understand the importance of banks in the economy. My results provide empirical support
to the idea that an institution that is assigned due diligence and monitoring duties must also hold a portion
of the loan when the borrower is informationally opaque. This is one of the fundamental roles of a
commercial bank. The fact that a monitoring financial institution must also hold a financial stake in the
firm it monitors is the foundation of important models of macroeconomic fluctuations (Holmstrom and

32
Tirole, (1997)). My results also help explain why bank capital is critical in the economy: Borrowers in
the syndicated loan market obtain financing from third parties only when the lead arranger takes a
financial stake in the loan. Overall, the results in the syndicated loan market help to explain why
informationally opaque firms are reliant on “informed” capital, and are most adversely affected during a
credit crunch in the banking sector.
The findings of this paper point to new avenues for future research, three of which I outline here.
First, I do not explore in this paper how information asymmetry might affect prices in the syndicated loan
market. While data on interest rate spreads are available in Dealscan, data on arrangement fees paid by
borrowers to the lead arranger and syndicate members are not available, which makes calculation of the
true price paid by borrowers difficult. Moreover, regressions using prices involve a host of simultaneity
and endogeneity problems that require extensive use of instruments. Such an analysis is beyond the scope
of this paper. In preliminary results, I use an instrumental variables approach in which opacity of the
borrower is used as an instrument for the share held by the lead arranger. In the second stage, I find
evidence that interest rate spreads are only marginally higher when the lead arranger retains a larger share
of the loan.
Second, I do not explore what explains the rapid growth of the syndicated loan market in the last
two decades, nor do I focus on whether the growth of the syndicated loan market has resulted in a lower
cost of capital or improved liquidity management for borrowing firms.
Third, syndicated loans are a promising empirical laboratory for studying the importance of
renegotiation in corporate finance. Renegotiation is an important element in incomplete contract theory,
and there is an established literature on how renegotiation affects the optimal number of creditors in debt
financing (Bolton and Scharfstein (1996), Bris and Welch (2005)). In the syndicated loan market, the
number of creditors is a choice variable and renegotiation is extremely common. Unlike the model of
Bolton and Scharfstein (1996), the number of creditors is chosen by the lead arranger as opposed to the
borrowing firm, which means an investigation could lead to potentially interesting theoretical innovations.

33
References
Aghion, Philippe, Patrick Bolton, and Jean Tirole, 2004, Exit options in corporate finance:
Liquidity versus incentives, Review of Finance 8, 327-353.
Altman, Edward I., and Heather J. Suggitt, 2000, Default rates in the syndicated bank loan market: A
mortality analysis, Journal of Banking and Finance 24, 229-253.
Amemiya, Takeshi, 1974, Bivariate probit analysis: Minimum chi-square methods, Journal of the
American Statistical Association 69, 940-944.
Amit, Raphael, J. Brander, and W. Antweiler, 2002, Venture capital syndication: improved venture
selection versus the value added hypothesis, Journal of Economics and Management Strategy
11, 423-452.
Angbazo, Lazrus, Jianping Mei, and Anthony Saunders, 1998, Credit spreads in the market for highly
leveraged transaction loans, Journal of Banking and Finance 22, 1249-1282.
Beatty, Anne, and Joseph Weber, 2000, Performance pricing in debt contracts, Working paper, Ohio
State University.
Bernanke, Ben, and Mark Gertler, 1989, Agency costs, net worth and business fluctuations,
American Economic Review 79, 14-31.
Bernanke, Ben, Mark Gertler, and Simon Gilchrist, 1996, The financial accelerator and the flight to
quality, Review of Economics and Statistics 78, 1-15.
Bolton, Patrick, and David Scharfstein, 1996, Optimal debt structure and the number of creditors,
Journal of Political Economy 104, 1-25.
Boot, Arnoud, and Anjan Thakor, 2000, Can relationship banking survive competition? Journal of
Finance 54, 679-713.
Bradley, Michael, and Michael Roberts, 2003, The structure and pricing of corporate debt covenants,
Working paper, Duke University.
Brealey, Richard, and Stewart Myers, 2003, Principles of Corporate Finance, International Edition,
34
(McGraw-Hill, New York).
Bris, Arturo, and Ivo Welch, 2005, The optimal concentration of creditors, Journal of Finance 60,
2193-2212.
Corwin, Shane A., and Paul Schultz, 2005, The role of IPO underwriting syndicates: Pricing,
information production, and underwriter competition, Journal of Finance 60, 443-486.
Dahiya, Sandeep, Manju Puri, and Anthony Saunders, 2003, Bank borrowers and loan sales: New
evidence on the uniqueness of bank loans, Journal of Business 76, 563-582.
Davenport, Todd, 2003, As SNC exam wraps up, no news is good news, The American Banker, July
14.
Dennis, Steven A., and Donald J. Mullineaux, 2000, Syndicated loans, Journal of Financial
Intermediation 9, 404-426.
Detragiache, Enrica, Paola Garella, and Luigi Guiso, 2000, Multiple versus single banking
relationships: Theory and evidence, Journal of Finance 55, 1133-1161.
Diamond, Douglas, 1984, Financial intermediation and delegated monitoring, Review of Economic
Studies 51, 393-414.
Diamond, Douglas, 1991, Monitoring and reputation: The choice between bank loans and privately
placed debt, Journal of Political Economy 99, 689-721.
Esty, Benjamin, and William Megginson, 2003, Creditor Rights, enforcement, and debt ownership
structure: Evidence from the global syndicated loan market, Journal of Financial and
Quantitative Analysis 38, 37-59.
Esty, Benjamin, 2001, Structuring loan syndicates: A case study of the Hong Kong Disneyland
project loan, Journal of Applied Corporate Finance 13, 3-23.
Esty, Benjamin, 2004, When do foreign banks finance domestic projects? New evidence on the
importance of legal and financial systems, Harvard Business School mimeo, September.
Faulkender, Michael, and Mitchell Petersen, 2006, Does the source of capital affect capital

35
structure? Review of Financial Studies 19, 45-79.
Francois, Pascal, and Franck Missonier-Piera, 2004, The agency structure of loan syndicates,
Working paper, HEC Montreal.
Gorton, Gary B., and George G. Pennachi, 1995, Banks and loan sales: Marketing nonmarketable
assets, Journal of Monetary Economics 35, 389-411.
Hitchings, Robert, 1994, Syndicated loans, Banking World, July.
Holmstrom, Bengt, 1979, Moral hazard and observability, Bell Journal of Economics 10, 74-91.
Holmstrom, Bengt, and Jean Tirole, 1997, Financial intermediation, loanable funds, and the real
sector, Quarterly Journal of Economics 112, 663-691.
Houston, Joel, and Christopher James, 1996, Bank information monopolies and the mix of private
and public debt claims, Journal of Finance 51, 1863-1889.
Jones, Jonathan, William Lang, and Peter Nigro, 2005, Recent trends in bank loan syndications:
Evidence for 1996-2000, Journal of Financial Research, forthcoming.
Kashyap, Anil K., Jeremy C. Stein, and David W. Wilcox, 1993, Monetary policy and credit
conditions: Evidence from the composition of external finance, American Economic Review
83, 78-98.
Lee, Sang Whi, and Donald J. Mullineaux, 2004, Monitoring, financial distress, and the structure of
commercial lending syndicates, Financial Management 33, 107-130.
Leland, H., amd D. Pyle, 1977, Informational asymmetries, financial structure, and financial
intermediation, Journal of Finance 32, 371-387.
Lerner, Joshua, 1994, The syndication of venture capital investments, Financial Management 23, 16-
27.
Lorek, Kenneth S., Mary S. Stone, and G. Lee Willinger, 1999, The differential predictive ability of
opaque and transparent firms’ earnings numbers, Quarterly Journal of Business and
Economics 38, 3-19.

36
McFadden, Daniel, 1974, The measurement of urban travel demand, Journal of Public Economics 3,
303-328.
Megginson, William, Annette Poulsen, and Joseph Sinkey, 1995, Syndicated loan announcements
and the market value of the firm, Journal of Money, Credit, and Banking 27, 457-475.
Mian, Atif, 2005, Distance constraints: The limits of foreign lending in poor economies, Journal
of Finance, forthcoming.
Mullineaux, Donald, and Mark Pyles, 2004, Constraints on loan sales and the price of liquidity,
Working paper, University of Kentucky.
Narayanan, Rajesh, Kasturi Rangan, and Nanda Rangan, 2004, The role of syndicate structure in
bank underwriting, Journal of Financial Economics 72, 555-580.
Petersen, Mitchell, and Raghuram Rajan, 2002, Does distance still matter? The information
revolution in small business lending, Journal of Finance 57, 2533-2570.
Preece, Dianna, and Donald J. Mullineaux, 1996, Monitoring, loan renegotiability, and firm value:
The role of lending syndicates, Journal of Banking and Finance 20, 577-593.
Qian, Jun, and Philip Strahan, 2004, How laws and institutions shape financial contracts: The case of
bank loans, Working paper, Boston College.
Rajan, Raghuram, 1992, Insiders and outsiders: The choice between informed and arm’s length debt,
Journal of Finance 47, 1367-1400.
Simons, Katerina, 1993, Why do banks syndicate loans? New England Economic Review of the
Federal Reserve Bank of Boston, 45-52.
Sloan, Richard G., 1996, Do stock prices fully reflect information in accruals and cash flows?,
Accounting Review Spring, 289-316.
Teoh, Siew Hong, Ivo Welch, and T.J. Wong, 1998, Earnings management and the
underperformance of seasoned equity offerings, Journal of Financial Economics 50, 63-99.

37
Thomas, Hugh, and Zhiqiang Wang, 2004, The integration of bank syndicated loan and
junk bond markets, Journal of Banking and Finance 28, 299-329.
Weidner, David, 2000, Syndicated lending closes out ‘90s on a tear, The American Banker, January
10th.
Wienke, Robert O., 1994, Loan syndications and participations: Trends and tactics, Commercial
Lending Review 9, Issue 2, 4-10.

38
1 The information in this section comes from practitioners working in financial institutions and lawyers who
specialize in syndicated loan contracts. In addition, Wienke (1994), Hitchings (1994), and Esty (2001) provide
excellent descriptions of syndicated loan arrangements.
2 The increasing use of securitization and credit default swaps may decrease the pecuniary effects on a bank’s loan
portfolio from a loan default. Anecdotal evidence suggests that nonpecuniary reputation effects or loan officer
career concerns can provide high costs of default even if loans are perfectly hedged. In addition, securitization and
credit default swaps have provisions that help maintain the bank’s incentive to monitor. An example is the practice
of making the bank’s claim on the firm junior to other parties in a securitization.
3 For example, if a bank holds $20 million of a $100 million term loan tranche and none of a $100 million line of
credit tranche, the bank holds 10% of the syndicated loan deal.
4 I use two variables to classify lenders as either lead arrangers or participants. Both are available using the custom
report feature in Dealscan’s web-based LoanConnector. One variable is labeled “Lenders-Lead Arranger” and the
other is “Lenders-All Lenders.” If the variable “Lenders-Lead Arranger” is available, I classify the lender listed in
this field as the lead arranger, and all other lenders are considered participants. If this field is unavailable, any
lender listed as having a “Lead Role” in the “Lenders-All Lenders” is a lead arranger.
5 A full list of all lenders and all mergers is included in a data appendix that is available upon request.
6 When borrowing firms are perfectly transparent, one prediction is that the due diligence duties are completely
independent of holding a portion of the loan. This is precisely the case in a debt underwriting, when the underwriter
holds none of the debt issue.
7 Beatty and Weber (2000) show that syndicated loans often have pricing that is explicitly contingent on the
borrower’s third-party credit rating. Anecdotal evidence from practitioner interviews suggests that the existence of a
third-party credit rating makes obtaining loan approvals easier for banks.
8 The controls employed here on loan amount and firm size likely bias the true coefficient on “opacity” downward
for two reasons. First, it is likely that more opaque firms obtain smaller loans because of problems of information
asymmetry. Second, firm size is also a measure of information asymmetry; I treat it as a control variable, but it also
likely proxies for opacity. The estimates on opacity should be viewed, therefore, as a lower bound.

39
9 In untabulated results, I estimate columns (5) and (6) of Table IV in subsamples based on the purpose of the loan.
The core results presented here are robust when looking at all sub-samples except for loans given for the purpose of
acquisition. In this last category, increased opacity has no statistically significant effect on the portion of the loan
retained by the lead arranger.
10 Between and random effects estimation yields almost identical results as the clustering on firm approach. I also
cluster on year instead of borrowing firm and obtain very similar results. Fixed effects estimates are robust on the
full sample, where the number of participants is available.
11 Fraud with regard to collateral on a bank loan is a real threat that requires monitoring by the bank. See the
Brealey and Myers (2003) textbook for two examples concerning Allied Crude Vegetable Oil Refining Corporation
and the National Safety Council of Australia’s Victoria Division (pages 869-870). In both examples, banks
experienced large losses due to an improper investigation of the actual value of collateral.
12 I follow Sloan (1996) in defining accruals as: [(ΔData4 - ΔData1) -(ΔData5 - Δ Data34- ΔData71) – Data14].
13 I use the language that the lead arranger “chooses” the participant lenders. This is the most common direction of
“choice” in the market, but it is a simplification. All theoretical predictions are identical if participants “choose”
deals on which to serve. I am interested more in the efficiency of syndicate membership than how that efficiency is
reached.
14 Foreign participants are considered in the same state and census division if they are in the same country as the
lead arranger, and the same region if they are from the same continent.

Table I Summary Statistics for Syndicated Loan Deals
This table presents summary statistics for the sample of 12,672 syndicated loan deals representing 4,687 firms from 1992 through 2003. Summary statistics of firm characteristics are calculated at the firm level, and summary statistics for deal characteristics are calculated at the deal level. Distribution # firms Mean SD 10th 50th 90th Firm characteristics Total sales ($M) 4,687 1,797 6,925 48 367 3,490 Number of previous syndicated loans 4,687 1.12 1 0 1 3 S&P debt rating indicator variable 4,687 0.31 0.43 Computat data available Total assets (book value, $M) 2,968 3,320 12,174 105 600 7,063 Leverage (book debt/book assets) 2,968 0.34 0.20 0.10 0.32 0.6 Earnings to assets 2,968 0.07 0.07 0.00 0.08 0.15 Lead arranger characteristics Total assets (book value, $B)* 12,672 333 232 70 262 694 Market share, previous year* 12,672 0.09 0.10 0.00 0.05 0.27 Syndicated loan characteristics Size of deal ($M) 12,672 364 696 40 150 8,50 Maturity (days) 12,672 1,103 755 364 1,095 2,008 >1 loan tranche indicator variable 12,672 0.26 0.44 Deal includes term loan indicator 12,672 0.22 0.42 Spread on drawn funds 10,898 159 123 31 125 325 Syndicate structure Total number of lenders 12,672 8.1 7.7 2 5 18 Total number of lead arrangers 12,672 1.7 2.1 1 1 3 Total number of participant lenders 12,672 6.4 7.3 1 4 16 % kept by lead arranger* 4,414 28.5 19.3 8.0 23.5 55.6 Amount kept by lead arranger ($M)* 4,414 48.4 70.4 13.0 31.9 91.3 Exposure of lead (basis points)* 4,414 0.03 0.04 0.00 0.02 0.08 Concentration of syndicate (Herfindahl) 4,414 2,383 1,759 590 1,844 5,001 Purpose of loan indicator Working capital/corporate purposes 12,672 0.42 0.49 Refinancing 12,672 0.27 0.44 Acquisitions 12,672 0.14 0.35 Backup line 12,672 0.11 0.31 Other 12,672 0.07 0.25 *Represents average of lead arrangers when there is more than one lead on the loan (31% of loans)

Table II Top Lead Arrangers and Participant Banks, by Market
This table lists the top five lead arrangers (by deal amount) and top five participants (by total number of deals) for syndicated loans in the sample from 2001-2003. Market share figures for lead arrangers split the amount of a given syndicated loan equally over all lead arrangers when there are multiple leads. Firms are considered “private” if they have no publicly available SEC filings. The third column reports the most common participants for the top lead arrangers (and the fraction of all deals in which they participate with the lead arranger) on deals with exactly one lead arranger.
(1) (2) (3) Loans to private firms Loans to public firms Most common participant
Lead arrangers
Mkt. share Mkt share % lead deals Bank of America 0.23 JPMorganChase 0.34 Bank of America JPMorganChase 0.18 Citigroup 0.19 Fleet 20 Citigroup 0.10 Bank of America 0.16 Bank One 0.05 Bank One 0.06 JPMorganChase Fleet 0.05 Deutsche Bank 0.02 Bank of America 36 Total amount ($B) 157 Total amount ($B) 1,373 Citigroup Market herfindahl 1,077 Market herfindahl 1,872 JPMorganChase 49 Participants Bank One
# deals # deals US Bancorp 27 U.S. Bancorp 148 Fleet 772 ABN-AMRO 134 Bank of Tokyo-Mitsubishi 769 Fleet Fleet 133 Bank One 707 Wachovia 24 National City 118 Wachovia 707 Bank One 115 Bank of America 706 Deutsche Bank Fleet 35 Total number of participants 3,448 Total number of participants 22,922

Table III
Cell Means, by Measure of Information Asymmetry This table presents cell means and standard errors, by group, for the sample of 12,672 syndicated loan deals representing 4,687 firms from 1992 through 2003. A “private” firm is a firm with no publicly available SEC filings. An “unrated” firm is a firm with publicly available SEC filings and no S&P senior unsecured debt rating. A “transparent” firm is a firm with publicly available SEC filings and an S&P senior unsecured debt rating. Private Unrated Transparent Percentage of sample loans 0.21 0.32 0.47 Total sales ($M)
822 (74)
1090 (81)
5858 (171)
Size of deal ($M ) 156
(7)
174 (5)
590 (12)
Maturity (days) 1,070
(16)
1,177 (11)
1,067 (10)
>1 tranche indicator variable 0.30
(0.01)
0.26 (0.01)
0.25 (0.01)
Deal includes term loan 0.31
(0.01) 0.23
(0.01) 0.18
(0.01) Syndicate Structure Characteristics Total number of lenders 4.77
(0.09)
6.09 (0.08)
11.05 (0.12)
Total number of lead arrangers 1.42
(0.03)
1.51 (0.02)
2.05 (0.03)
Total number of participant banks 3.35
(0.08)
4.58 (0.08)
9.01 (0.11)
% of loan kept by each lead (avg) 38.3
(0.8) 35.3 (0.4)
19.6 (0.4)
Smallest 1/3 firms, by sales 43.5 (1.1)
41.8 (0.6)
29.3 (1.1)
Middle 1/3 firms, by sales 35.2 (1.4)
31.8 (0.6)
23.5 (0.6)
Largest 1/3 firms, by sales 21.8 (2.0)
20.2 (1.0)
15.2 (0.4)
Conc. of syndicate (herfindahl) 3,274
(75) 2,990 (40)
1,580 (32)
Smallest 1/3 firms, by sales 3,742 (96)
3,587 (54)
2,415 (102)
Middle 1/3 firms, by sales 2,991 (124)
2,640 (59)
1,928 (60)
Largest 1/3 firms, by sales 1,763 (163)
1,729 (95)
1,199 (36)

Table IV
Information Asymmetry Syndicate Structure Regressions This table reports coefficient estimates from regressions relating syndicate structure to information asymmetry of the borrower. A “private” firm is a firm with no publicly available SEC filings, an “unrated” firm is a firm with publicly available SEC filings and no S&P senior unsecured credit rating, and a “transparent” firm is a firm with publicly available SEC filings and a credit rating. To control for loan size, the sample is split into thirds based on size, and the intercept (not reported) and natural log of loan size (reported) varies for each group. All regressions include year and industry dummies, and standard errors are heteroskedasticity robust, clustered at the borrowing firm. “Transparent” firms are the omitted group; “Corporate purposes” is the omitted loan purpose group. Full Sample Loans for which the amount held by each syndicate member is available
(1) (2) (3) (4) (5) (6) (7) (8) Dependent Variable: # Leads # Parts # Leads # Parts Herfindahl % held by
lead Amount held by lead ($M)
Lead exposure
Private firm 0.09 (0.09)
-1.52**,+ (0.17)
-0.09 (0.08)
-0.71* (0.29)
259** (84)
2.94** (0.93)
6.30** (2.26)
0.0093** (0.0028)
Unrated firm -0.02 (0.05)
-0.82**,+ (0.15)
-0.04 (0.06)
-0.61** (0.20)
211** (57)
2.14** (0.62)
4.32* (1.77)
0.0078** (0.0017)
Ln[firm sales] -0.01
(0.02) 0.15** (0.05)
0.01 (0.03)
0.56** (0.10)
-102** (23)
-1.32** (0.25)
-3.45** (0.97)
-0.0027** (0.0007)
Ln[loan amount] 0.22** (0.04)
0.91** (0.16)
0.23** (0.05)
0.78* (0.31)
-808** (83)
-7.69** (0.90)
11.14** (1.07)
0.0110** (0.0014)
Ln[loan amount]*middle 0.48** (0.09)
1.49** (0.25)
0.52** (0.09)
2.73** (0.37)
-144 (109)
-2.51* (1.22)
4.46* (1.94)
-0.0031 (0.0028)
Ln[loan amount]*large
0.80** (0.15)
2.86** (0.34)
0.78** (0.17)
4.47** (0.45)
665** (81)
6.19** (0.89)
72.66** (9.33)
0.0104** (0.0025)
Ln[maturity, in days]
0.00 (0.01)
0.43** (0.03)
0.07 (0.03)
0.36** (0.08)
-131** (24)
-1.12** (0.30)
-4.06** (1.01)
-0.0006 (0.0006)
> 1 tranche indicator 0.03 (0.08)
0.33 (0.19)
0.00 (0.09)
-0.05 (0.24)
74 (60)
0.79 (0.62)
-5.18 (2.79)
0.0024 (0.0018)
Term tranche indicator -0.04 (0.06)
0.56** (0.21)
-0.04 (0.09)
0.73** (0.27)
211** (79)
1.43 (0.85)
2.95 (2.51)
-0.0030 (0.0019)
Purpose: refinancing
0.05 (0.06)
0.86** (0.14)
0.14 (0.07)
0.25 (0.18)
0 (53)
-0.27 (0.57)
0.86 (1.34)
-0.0021 (0.0019)
Purpose: acquisition
0.22** (0.08)
0.60** (0.22)
0.41** (0.13)
-0.28 (0.32)
68 (73)
0.19 (0.82)
7.94* (3.65)
0.0043 (0.0025)
Purpose: backup
-0.39** (0.07)
0.94** (0.25)
-0.63** (0.12)
1.24** (0.36)
-203** (62)
-2.05** (0.68)
-11.20* (4.46)
-0.0067** (0.0022)
Purpose: other
0.15* (0.06)
0.53* (0.22)
0.19 (0.16)
0.33 (0.39)
256* (131)
1.46 (1.39)
10.37 (7.34)
0.0008 (0.0029)
N 12,672 12,672 4,414 4,414 4,414 4,414 4,414 4,414 R2 0.22 0.37 0.19 0.55 0.48 0.48 0.31 0.14 **Significant at the 1% level, *Significant at the 5% level, + coefficients distinct from each other at the 5% level

Table V
Repeat Borrowers Reduce Problems of Information Asymmetry This table reports coefficient estimates from regressions relating syndicate structure to information asymmetry of the borrower. “Opaque” firms include both private and unrated firms. Transparent firms are the omitted group. In addition to variables reported, all regressions include year, industry, loan amount, and loan purpose dummies. Standard errors are heteroskedasticity robust, clustered at the firm level. (1) (2) (3) (4) (5) (6) Dependent Variable:
% held by lead
% held by lead
% held by lead
Herfindahl
Herfindahl
Herfindahl
Opaque firm
2.30** (0.60)
2.01** (0.62)
3.55** (0.85)
220** (55)
202** (56)
324** (77)
Ln[1+ # previous loans by firm]
-1.46** (0.41)
-0.60 (0.48)
-93* (38)
-24 (46)
Opaque firm * Ln[1 + # previous loans by firm]
-1.85* (0.76)
-148* (73)
Ln[firm sales] -1.34**
(0.25) -1.22** (0.25)
-1.21** (0.25)
-103** (23)
-95** (23)
-94** (23)
Ln[loan amount] -7.69** (0.90)
-7.65** (0.90)
-7.51** (0.90)
-809** (83)
-806** (83)
-795** (83)
Ln[loan amount]*middle -2.50* (1.22)
-2.42* (1.22)
-2.49* (1.21)
-143 (109)
-138 (109)
-143 (108)
Ln[loan amount]*large 6.21** (0.89)
6.24** (0.88)
5.95** (0.89)
667** (81)
668** (81)
645** (82)
Ln[maturity, in days] -1.13** (0.30)
-1.20** (0.30)
-1.19** (0.30)
-132** (24)
-136** (24)
-135** (24)
> 1 tranche indicator 0.77 (0.62)
0.63 (0.62)
0.59 (0.62)
73 (60)
64 (60)
61 (60)
Term tranche indicator 1.47 (0.86)
1.66 (0.85)
1.68* (0.85)
213** (79)
225** (79)
227** (79)
N 4,414 4,414 4,414 4,414 4,414 4,414 R2 0.51 0.52 0.52 0.51 0.51 0.52 **Significant at the 1% level, *Significant at the 5% level

Table VI
Lead Bank Reputation Reduces Problems of Information Asymmetry This table reports coefficient estimates from regressions relating syndicate structure to information asymmetry of the borrower. An “opaque” firm is a private firm or a firm with publicly available SEC filings and no S&P senior unsecured credit rating. A “transparent” firm is a firm with publicly available SEC filings and a credit rating. In all specifications, “transparent” firms are the omitted group. In addition to variables reported, all regressions include year, industry, loan amount, and loan purpose dummies. Standard errors are heteroskedasticity robust, clustered at the firm level. (1) (2) (3) (4) Dependent Variable: % held by
lead % held by
lead Herfindahl Herfindahl
Opaque firm
3.51** (0.85)
4.25** (0.92)
320** (77)
355** (85)
Market share of lead arranger in prior year -10.33**
(2.99)
-3.88 (3.67)
-1071** (274)
-766* (320)
Opaque * Market share of lead arranger
-13.36* (5.48)
-631 (493)
Ln[1+ # previous loans by firm]
-0.57 (0.48)
-0.69 (0.48)
-22 (45)
-27 (45)
Opaque * Ln[1 + # previous loans by firm]
-1.84* (0.76)
-1.58* (0.77)
-147* (73)
-134 (74)
Ln[firm sales] -1.18** (0.25)
-1.16** (0.25)
-91** (23)
-90** (23)
Ln[loan amount] -7.57** (0.90)
-7.54** (0.90)
-801** (83)
-799** (83)
Ln[loan amount]*middle -2.36 (1.21)
-2.43* (1.21)
-130 (109)
-134 (109)
Ln[loan amount]*large 6.19** (0.90)
6.00** (0.91)
671** (82)
662** (83)
Ln[maturity, in days] -1.19** (0.30)
-1.18** (0.30)
-135** (24)
-135** (24)
> 1 tranche indicator
0.59 (0.61)
0.54 (0.61)
62 (60)
59 (60)
Term tranche indicator
1.66* (0.84)
1.65 (0.84)
224** (79)
224** (79)
N 4,414 4,414 4,414 4,414 R2 0.52 0.52 0.52 0.52 **Significant at the 1% level, *Significant at the 5% level

Table VII
Moral Hazard versus Adverse Selection This table reports coefficient estimates from regressions relating syndicate structure to information asymmetry of the borrower. An “opaque” firm is a private firm or a firm with publicly available SEC filings and no S&P senior unsecured credit rating. A “transparent” firm is a firm with publicly available SEC filings and a credit rating. In all specifications, “transparent” firms are the omitted group. In addition to the variables reported, all regressions include year, industry, loan amount, and loan purpose dummies. Standard errors are heteroskedasticity robust, clustered at the firm level. (1) (2) (3) (4) Dependent Variable: % held by
lead % held by
lead Herfindahl Herfindahl
Opaque firm
3.98** (0.93)
3.18** (1.07)
326** (86)
281** (97)
Lead is former lead for borrower
-2.03** (0.71)
-3.40** (1.11)
-215** (65)
-293** (103)
Opaque * Lead is former lead for borrower
2.12
(1.43) 121
(131) Market share of lead arranger in prior year -3.53
(3.65) -3.32 (3.65)
-729* (319)
-717* (318)
Opaque * Market share of lead arranger -13.07* (5.47)
-13.36* (5.47)
-600 (491)
-617 (492)
Ln[1+ # previous loans by firm]
-0.01 (0.53)
0.47 (0.62)
45 (51)
73 (61)
Opaque * Ln[1 + # previous loans by firm]
-1.29 (0.77)
-2.12* (1.01)
-103 (73)
-151 (96)
Ln[firm sales] -1.18** (0.25)
-1.19** (0.25)
-92** (23)
-93** (23)
Ln[loan amount] -7.52** (0.89)
-7.52** (0.89)
-797** (82)
-797** (82)
Ln[loan amount]*middle -2.49* (1.21)
-2.48* (1.20)
-139 (108)
-139 (108)
Ln[loan amount]*large 5.89** (0.90)
5.84** (0.90)
650** (83)
647** (83)
Ln[maturity, in days] -1.17** (0.30)
-1.17** (0.30)
-134** (24)
-134** (24)
> 1 tranche indicator
0.55 (0.61)
0.55 (0.61)
60 (60)
60 (60)
Term tranche indicator
1.57 (0.84)
1.54 (0.84)
216** (78)
214** (78)
N 4,414 4,414 4,414 4,414 R2 0.52 0.52 0.52 0.52 **Significant at the 1% level, *Significant at the 5% level
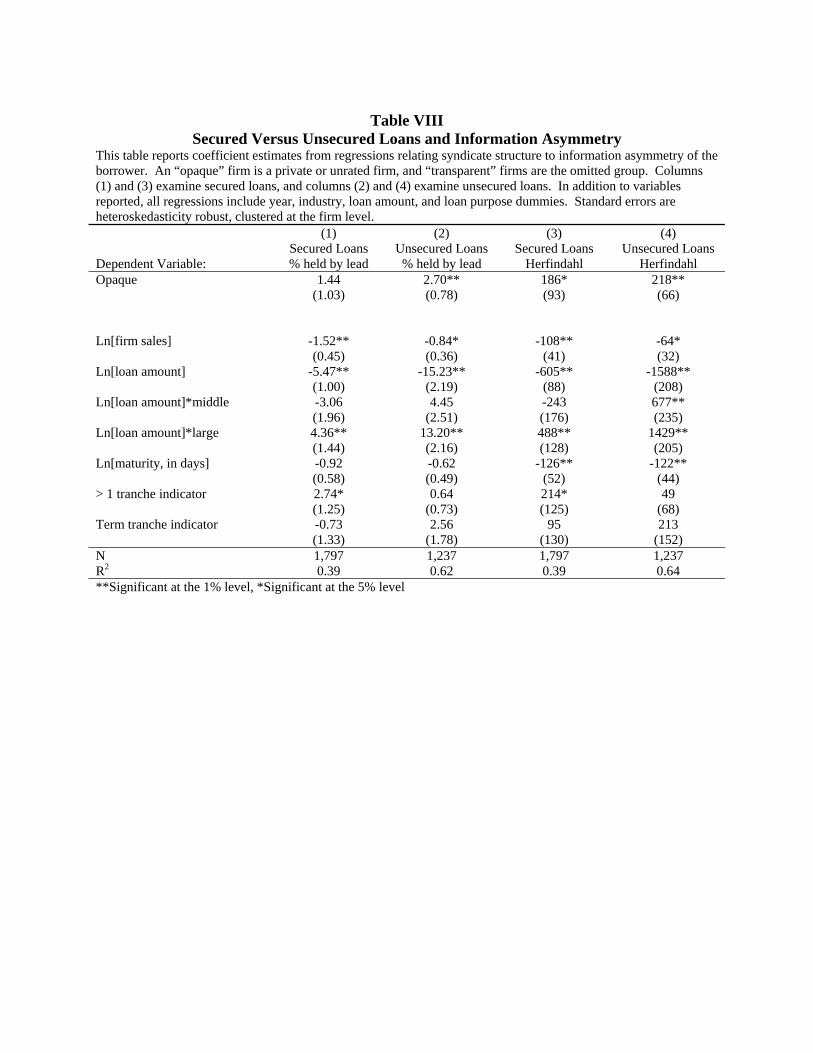
Table VIII
Secured Versus Unsecured Loans and Information Asymmetry This table reports coefficient estimates from regressions relating syndicate structure to information asymmetry of the borrower. An “opaque” firm is a private or unrated firm, and “transparent” firms are the omitted group. Columns (1) and (3) examine secured loans, and columns (2) and (4) examine unsecured loans. In addition to variables reported, all regressions include year, industry, loan amount, and loan purpose dummies. Standard errors are heteroskedasticity robust, clustered at the firm level. (1) (2) (3) (4) Secured Loans Unsecured Loans Secured Loans Unsecured Loans Dependent Variable: % held by lead % held by lead Herfindahl Herfindahl Opaque 1.44
(1.03) 2.70** (0.78)
186* (93)
218** (66)
Ln[firm sales]
-1.52** (0.45)
-0.84* (0.36)
-108** (41)
-64* (32)
Ln[loan amount]
-5.47** (1.00)
-15.23** (2.19)
-605** (88)
-1588** (208)
Ln[loan amount]*middle
-3.06 (1.96)
4.45 (2.51)
-243 (176)
677** (235)
Ln[loan amount]*large
4.36** (1.44)
13.20** (2.16)
488** (128)
1429** (205)
Ln[maturity, in days]
-0.92 (0.58)
-0.62 (0.49)
-126** (52)
-122** (44)
> 1 tranche indicator
2.74* (1.25)
0.64 (0.73)
214* (125)
49 (68)
Term tranche indicator
-0.73 (1.33)
2.56 (1.78)
95 (130)
213 (152)
N 1,797 1,237 1,797 1,237 R2 0.39 0.62 0.39 0.64 **Significant at the 1% level, *Significant at the 5% level

Table IX Information Asymmetry Versus Size of Firm
This table reports coefficient estimates from regressions relating syndicate structure to information asymmetry of the borrower. Columns (1) and (2) examine all private and unrated borrowers (“opaque”) and only transparent borrowers with total sales less than the median. Columns (3) through (6) examine only public firms using alternative measures of opacity. In addition to variables reported, all regressions include year, industry, loan amount, and loan purpose dummies. Standard errors are heteroskedasticity robust, clustered at the borrowing firm.
All opaque + smallest ½
transparent, by total sales
Public firms with
accrual data available
Public firms with R&D
data available
(1) (2) (3) (4) (5) (6) Dependent Variable: % held by
lead Herfindahl % held by
lead Herfindahl % held by
lead Herfindahl
Private firm 3.00** (0.96)
274** (87)
Unrated firm 2.24** (0.67)
226** (61)
Accruals to assets
8.42* (3.39)
658* (299)
R&D to assets
16.32 (9.83)
2315* (919)
Income to assets
-3.51 (4.52)
-648 (419)
-5.69 (5.71)
-687 (516)
Leverage ratio
-1.32 (1.54)
-17 (142)
2.76 (2.17)
334 (198)
Ln[firm sales] -1.82** (0.30)
-152** (27)
-1.39** (0.29)
-106** (26)
-1.39** (0.40)
-105** (35)
Ln[loan amount] -7.00** (0.91)
-750** (82)
-9.26** (1.01)
-982** (88)
-9.91** (1.47)
-1023** (133)
Ln[loan amount]*middle -2.65* (1.29)
-183 (114)
0.08 (1.35)
94 (118)
0.51 (1.90)
207 (168)
Ln[loan amount]*large 5.49** (1.06)
586** (94)
7.33** (1.01)
798** (89)
8.00** (1.45)
849** (132)
Ln[maturity, in days] -1.34** (0.31)
-134** (27)
-0.80* (0.36)
-107** (29)
-1.15** (0.39)
-120** (39)
> 1 tranche indicator 1.73* (0.84)
175* (82)
0.75 (0.66)
84 (64)
1.16 (0.87)
157 (84)
Term tranche indicator 0.43 (1.00)
101 (92)
1.41 (0.96)
212* (89)
-0.05 (1.22)
-32 (114)
N 3,443 3,443 3,369 3,369 1,640 1,640 R2 0.42 0.43 0.53 0.53 0.59 0.59 **Significant at 1% level, *Significant at 5% level

Table X
Characteristics of Participants, by Borrowing Firm Credit Reputation This table examines the characteristics of 67,553 participants on 12,672 syndicated loan deals. There are 6,788 participants for private firms, 15,515 participants for unrated firms, and 45,250 for transparent firms. Lead arranger-participant relationships are calculated on a subsample of 43,769 participants on 8,711 deals for which there is exactly one lead arranger. Private Unrated Transparent General Characteristics Total assets ($B) 243* 235* 295 Equity to total assets ratio 0.067* 0.066* 0.062 Unregulated, domestic (Finance company/I-Bank) 0.069 0.045* 0.064 Foreign 0.40* 0.41* 0.51 Borrowing Firm-Participant Variables Conditional on being in U.S.: In same region as borrowing firm 0.44* 0.43* 0.36 In same census division as borrowing firm 0.32* 0.30* 0.23 In same state as borrowing firm 0.14* 0.13* 0.10 Conditional on firm having previous loan: Former lead for firm indicator variable 0.10* 0.11* 0.18 Fraction of previous firm loans lead on 0.05 0.05* 0.06 Conditional on firm having previous syndicated loan: Former participant for firm indicator variable 0.50* 0.52* 0.65 Fraction of previous firm syndicated loans participant on 0.34 0.34 0.35 Lead Arranger-Participant Variables Calculated on sample with only one lead arranger: In same region as lead arranger 0.23* 0.23* 0.20 In same census division as lead arranger 0.16 0.16* 0.14 In same state as lead arranger 0.09 0.09* 0.10 On a deal with lead arranger in previous quarter 0.66* 0.67* 0.77 On a deal with lead arranger in previous year 0.85* 0.85* 0.90 Fraction of syndicated loans with L.A. in previous quarter 0.12* 0.13* 0.15 Fraction of syndicated loans with L.A. in previous year 0.12* 0.13* 0.14 *Significantly different from transparent firms at the 5% level (errors clustered at the firm level)

Table XI
Participant Choice Probit Estimation This table presents coefficient estimates for a probit specification estimating how bank characteristics affect the probability of being chosen as a participant. All coefficients represent the effect on probability when indicator goes from zero to one, and coefficients and standard errors are multiplied by 100. The choice set includes all banks with at least 0.5% market share in the year of the loan. Estimations include deal level controls described in Table IV and year and industry dummies, and the constant is allowed to vary by group. In addition, the natural log of the total assets and the leverage ratio of the potential participant are included in all specifications and are allowed to vary by group for columns (2) and (4). Columns (2) and (4) have transparent firms as the omitted group. Standard errors are allowed to be correlated for all potential participants for all of a given firm’s loans in the sample.
Without Relationships
With Relationships (1) (2) (3) (4) Dependent variable mean:
8.56 8.56 9.75
9.75
Former lead for borrowing firm indicator
6.40* (0.69)
6.18* (0.67)
Private
3.10* (1.32)
Unrated
-0.31 (0.60)
Former participant for borrowing firm indicator
27.30* (0.69)
25.51* (0.71)
Private
2.54* (1.13)
Unrated
2.10* (0.53)
Same region as borrowing firm indicator
6.68** (0.22)
5.48* (0.28)
3.96* (0.19)
3.23* (0.22)
Private
1.46* (0.41)
1.29* (0.45)
Unrated
1.94* (0.35)
1.31* (0.33)
Foreign indicator
-4.67* (0.16)
-4.91* (0.23)
-2.98* (0.13)
-2.96* (0.17)
Private
1.00 (0.43)
0.34 (0.42)
Unrated
0.30 (0.32)
-0.18 (0.29)
Unregulated domestic indicator
-5.43* (0.10)
-5.58* (0.12)
-3.14* (0.15)
-3.07 (0.18)
Private
3.49* (0.95)
0.66 (0.76)
Unrated
0.58 (0.80)
-0.66 (0.56)
N 722,589 722,589 512,618 512,618 Number of Loans 12,672 12,672 9,037 9,037 Pseudo R2 0.11 0.11 0.26 0.26 * Significant at the 1% level

Table XII
Participant Choice Probits, on Subsample of Deals with One Lead Arranger This table presents coefficient estimates for a probit specification estimating how bank characteristics affect the probability of being chosen as participant. The sample is limited to those loans for which there is only one lead arranger. Estimations include deal level controls described in Table IV, and year and industry dummies, and the constant is allowed to vary by group. In addition, the natural log of the total assets, the leverage ratio, a foreign indicator variable, and an unregulated domestic indicator for the potential participant are included in all specifications and are allowed to vary by group for columns (2) and (4). Columns (2) and (4) have transparent firms as the omitted group. Standard errors are allowed to be correlated for all potential participants for all of a given firm’s loans in the sample.
Without Relationships
With Relationships (1) (2) (3) (4) Dependent variable mean:
7.98 7.98 9.23
9.23
Former lead for borrowing firm indicator
7.11* (0.67)
6.77* (0.67)
Private
3.28* (1.32)
Unrated
-0.18 (0.61)
Former participant for borrowing firm indicator
27.48* (0.72)
24.81* (0.77)
Private
2.51 (1.53)
Unrated
2.82* (0.61)
Same region as borrowing firm indicator
6.29* (0.22)
5.36* (0.31)
3.77* (0.20)
3.19* (0.24)
Private
1.02* (0.41)
0.93 (0.44)
Unrated
1.18* (0.34)
0.71 (0.32)
Same region as lead arranger
1.16* (0.15)
1.11* (0.21)
0.72* (0.14)
0.59* (0.17)
Private
0.07 (0.37)
0.32 (0.45)
Unrated 0.01 (0.29)
0.24 (0.30)
On syndicate with lead arranger in last quarter
3.64* (0.12)
3.69* (0.16)
2.40* (0.13)
2.31* (0.17)
Private -0.67 (0.27)
-0.24 (0.45)
Unrated 0.15 (0.25)
0.23 (0.29)
N 505,357 505,357 347,746 347,746 Number of Loans 8,711 8,711 6,012 6,012 Pseudo R2 0.14 0.14 0.30 0.30 * Significant at the 1% level