inform-live.s3.amazonaws.cominform-live.s3.amazonaws.com/files/LGA Benchmarking Q2 16_17... · Web...
23
LGA Definitions for Local Benchmarking Q2 (2016/17) LGA Definitions for Local Benchmarking Q2 (2016/17)..........1 Introduction............................................... 3 Definitions................................................ 4 Period type...............................................4 Metric type...............................................4 Metric 1: Percentage of household waste sent for reuse, recycling and composting – quarterly.......................5 Description...............................................5 Reason for local collection...............................5 Period type...............................................5 Metric type...............................................5 Upload instructions.......................................5 Metric 2: Kg of residual waste per household – quarterly. . .7 Description...............................................7 Reason for local collection...............................7 Period type...............................................7 Metric type...............................................7 Upload instructions.......................................7 Metric 3: Average number of working days lost due to sickness absence per FTE (full–time equivalent) employee (including schools) – quarterly.......................................9 Description...............................................9 Reason for local collection..............................10 Period type..............................................10 Metric type..............................................10 Upload instructions......................................10 Metric 4: Average number of working days lost due to sickness absence per FTE employee (excluding schools) – quarterly. .12 Description..............................................12 Reason for local collection..............................13 Period type..............................................13 Metric type..............................................13 Upload instructions......................................13 Metric 5: Number of formal complaints received – quarterly 14 Description..............................................14 Reason for local collection..............................14 Period type..............................................14 Metric type..............................................14 1
-
Upload
vuongduong -
Category
Documents
-
view
213 -
download
0
Transcript of inform-live.s3.amazonaws.cominform-live.s3.amazonaws.com/files/LGA Benchmarking Q2 16_17... · Web...
LGA Definitions for Local Benchmarking Q2 (2016/17)
LGA Definitions for Local Benchmarking Q2 (2016/17)..............................................1Introduction..............................................................................................................3Definitions................................................................................................................4
Period type...........................................................................................................4Metric type...........................................................................................................4
Metric 1: Percentage of household waste sent for reuse, recycling and composting – quarterly................................................................................................................5
Description...........................................................................................................5Reason for local collection...................................................................................5Period type...........................................................................................................5Metric type...........................................................................................................5Upload instructions..............................................................................................5
Metric 2: Kg of residual waste per household – quarterly........................................7Description...........................................................................................................7Reason for local collection...................................................................................7Period type...........................................................................................................7Metric type...........................................................................................................7Upload instructions..............................................................................................7
Metric 3: Average number of working days lost due to sickness absence per FTE (full–time equivalent) employee (including schools) – quarterly..............................9
Description...........................................................................................................9Reason for local collection.................................................................................10Period type.........................................................................................................10Metric type.........................................................................................................10Upload instructions............................................................................................10
Metric 4: Average number of working days lost due to sickness absence per FTE employee (excluding schools) – quarterly.............................................................12
Description.........................................................................................................12Reason for local collection.................................................................................13Period type.........................................................................................................13Metric type.........................................................................................................13Upload instructions............................................................................................13
Metric 5: Number of formal complaints received – quarterly..................................14Description.........................................................................................................14Reason for local collection.................................................................................14Period type.........................................................................................................14Metric type.........................................................................................................14Upload instructions............................................................................................15
Metric 6: Number of fly tipping incidents – quarterly..............................................16Description.........................................................................................................16Reason for local collection.................................................................................16Period type.........................................................................................................16Metric type.........................................................................................................16Upload instructions............................................................................................16
Metric 7: Number of fly tipping enforcement actions – quarterly............................18Description.........................................................................................................18Reason for local collection.................................................................................18Period type.........................................................................................................18
1
Metric type.........................................................................................................18Upload instructions............................................................................................18
Metric 8: Number of unique website visitors (excluding authorities own staff) – quarterly.................................................................................................................20
Description.........................................................................................................20Reason for local collection.................................................................................20Period type.........................................................................................................20Metric type.........................................................................................................20Upload instructions............................................................................................20
2
Introduction
In addition to the thousands of published metrics we source from government websites, LG Inform was built to provide the sector with its own free benchmarking tool. This is a strictly voluntary process and the ambition is to, where appropriate, start to reduce the sector’s reliance on nationally published data either through collecting new data items or providing more timely access to existing data on a provisional basis by collecting data in-year, for example on a quarterly basis.
The upload process is designed to be very quick and easy, and involves simply entering your authority’s figure into an online form. You don’t have to submit data for all metrics to participate, just those that are of interest locally. The definitions for the current basket of metrics are outlined below.
3
Definitions
It is important that each authority follows the definitions exactly to ensure meaningful benchmarking. This section explains the terminology used in the definitions.
Period type
Currently, all metrics that are being collected as part of this exercise are quarterly. The definition specifies whether this refers to calendar or financial quarters, and also lays out the exact dates being requested.
There are three ways that quarterly data is commonly collected, and for each metric this is specified within the definition. The possibilities are:
Freestanding quarters: i.e. data for that three month period only.
Year to date: i.e. data from the start of the year to the end of the quarter in question.
Rolling annual: i.e. a full year’s worth of data, running from Q1 to Q1 or Q2 to Q2 etc.
Metric type Provisional: i.e. a pre-existing collection which has a significant time lag
between submission and publication and users would like to see it in LG Inform as provisional data prior to official publication.
Local: this could include new metric types, for which there is currently no existing collection facility but the sector has agreed a definition and committed to submitting data against it, or an in-year collection of a pre-existing metric type that users would like to collect on a more frequent basis i.e. quarterly instead of annually.
4
Metric 1: Percentage of household waste sent for reuse, recycling and composting – quarterly
Description
The percentage of household waste arisings which have been sent by the authority for reuse, recycling, composting or anaerobic digestion. This was previously collected as BVPI 82a and 82b in 2007/08.
The numerator is the total tonnage of household waste collected which is sent for reuse, recycling, composting or anaerobic digestion during the quarter.
The denominator is the total tonnage of household waste collected during the quarter. ‘Household waste’ means those types of waste which are to be treated as household waste for the purposes of Part II of the Environmental Protection Act 1990 by reason of the provisions of the Controlled Waste Regulations 1992. This was previously reported as NI 192.
Reason for local collection
This metric is available on a quarterly basis from Defra with an 8 month time lag after the end of the period. Local authorities can access this data earlier (approximately 3 months after the end of the period) through restricted access to Waste Data Flows. Local authorities felt that this was a large time lag and were keen to access provisional comparison data at an earlier point for benchmarking and planning purposes.
The data submitted to LG Inform at this point is likely to be provisional and subject to change, and is presented as such in LG Inform. You will have the opportunity to provide updated data if necessary at a later date, or else LG Inform will replace this with the published data from Defra once it becomes publically available.
Period type Freestanding financial quarter. Please note that this is data for a three
month period only, not a year to date figure. Financial Quarter 2: 1 Jul 2016 to 30 Sept 2016
Metric type Provisional – the data will be replaced by the published data once this
becomes available.
Upload instructions
5
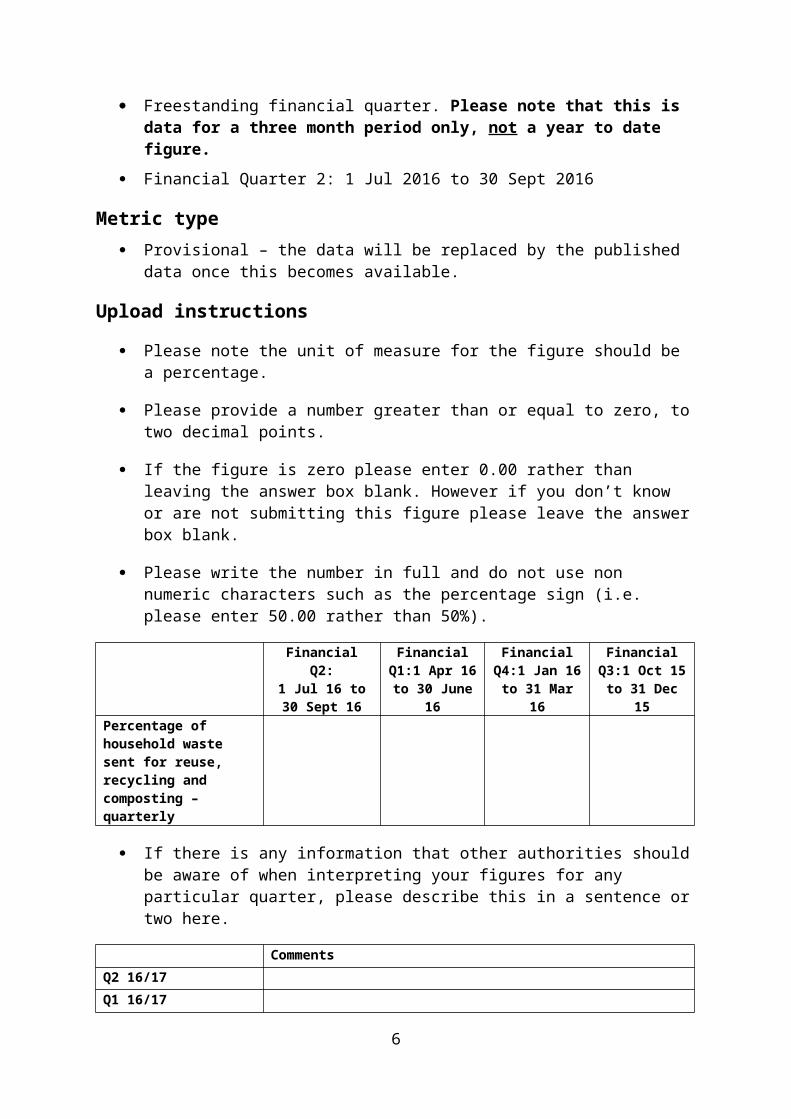
Please note the unit of measure for the figure should be a percentage.
Please provide a number greater than or equal to zero, to two decimal points.
If the figure is zero please enter 0.00 rather than leaving the answer box blank. However if you don’t know or are not submitting this figure please leave the answer box blank.
Please write the number in full and do not use non numeric characters such as the percentage sign (i.e. please enter 50.00 rather than 50%).
Financial Q2:1 Jul 16 to 30
Sept 16
Financial Q1:1 Apr 16
to 30 June 16
Financial Q4:1 Jan 16 to 31 Mar 16
Financial Q3:1 Oct 15 to
31 Dec 15Percentage of household waste sent for reuse, recycling and composting – quarterly
If there is any information that other authorities should be aware of when interpreting your figures for any particular quarter, please describe this in a sentence or two here.
CommentsQ2 16/17Q1 16/17 Q4 15/16Q3 15/16
6

Metric 2: Kg of residual waste per household – quarterly
Description
This is the number of kilograms of residual household waste collected per household during the quarter. Residual waste is any collected household waste that is not sent for reuse, recycling or composting. This was previously reported as NI 191. For further information on the definition of this indicator please visit: http://www.wastedataflow.org/htm/datasets.aspx#NI
Reason for local collection
This metric is available on a quarterly basis from Defra with an 8 month time lag after the end of the period. Local authorities can access this data earlier (approximately 3 months after the end of the period) through restricted access to Waste Data Flows. Local authorities felt that this was a large time lag and were keen to access provisional comparison data at an earlier point for benchmarking and planning purposes.
The data submitted to LG Inform at this point is likely to be provisional and subject to change, and is presented as such in LG Inform. You will have the opportunity to provide updated data if necessary at a later date, or else LG Inform will replace this with the published data from Defra once it becomes publically available.
Period type
Freestanding financial quarter. Please note that this is data for a three month period only, not a year to date figure.
Financial Quarter 2: 1 Jul 2016 to 30 Sept 2016
Metric type
Provisional – the data will be replaced by the published data once this becomes available.
Upload instructions
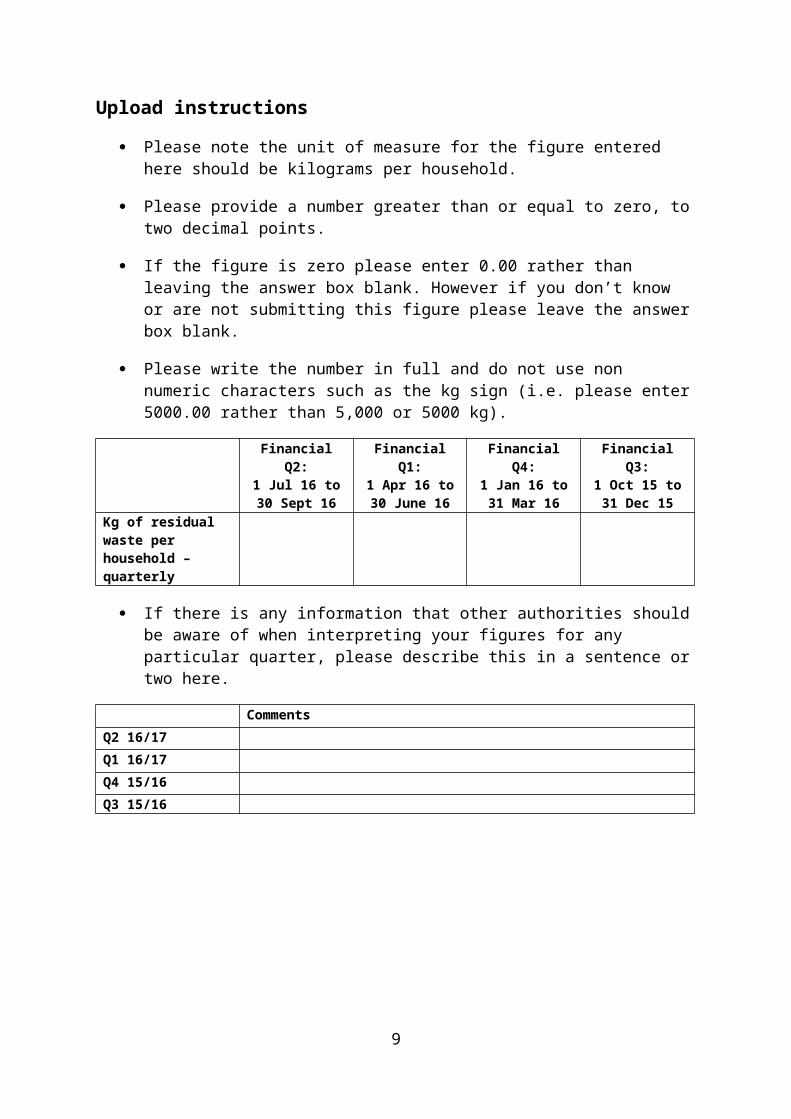
Please note the unit of measure for the figure entered here should be kilograms per household.
Please provide a number greater than or equal to zero, to two decimal points.
7
If the figure is zero please enter 0.00 rather than leaving the answer box blank. However if you don’t know or are not submitting this figure please leave the answer box blank.
Please write the number in full and do not use non numeric characters such as the kg sign (i.e. please enter 5000.00 rather than 5,000 or 5000 kg).
Financial Q2:1 Jul 16 to 30
Sept 16
Financial Q1:1 Apr 16 to 30
June 16
Financial Q4:1 Jan 16 to 31
Mar 16
Financial Q3:1 Oct 15 to 31
Dec 15Kg of residual waste per household – quarterly
If there is any information that other authorities should be aware of when interpreting your figures for any particular quarter, please describe this in a sentence or two here.
CommentsQ2 16/17Q1 16/17Q4 15/16Q3 15/16
8
Metric 3: Average number of working days lost due to sickness absence per FTE (full–time equivalent) employee (including schools) – quarterly
This metric is consistent with the definition of the old BVPI 12 indicator however it has been split into two measures. Part A (this part) includes teachers and other school based staff, and Part B (collected separately on the next page) excludes teachers and other school-based staff.
This metric is not applicable to district councils.
Description
This indicator measures the average number of working days/shifts lost due to sickness absence per FTE (full–time equivalent) employee.
Districts do not need to provide a figure for this indicator.
It is calculated by taking the total number of days’ absence over the reporting period (i.e. the quarter) and dividing it by the average number of FTE employees over the same period.
Sickness absence is defined as the total number of working days lost due to sickness absence, including industrial injury, irrespective of whether this is self–certificated, certified by a GP or long–term.
Average number of FTE is calculated with reference to the beginning and end of the reporting period i.e. (number of FTE employees on the first day of the reporting period) + (number of FTE employees on the last day of the reporting period) divided by 2.
For part–time staff the authority should calculate the FTE for both the numerator and denominator on a consistent basis.
The sickness absence calculation should include all permanent local authority employees, including teachers, staff employed in schools and staff employed in direct labour organisations (DLOs) and direct service organisations DSOs. Exclude agency staff and staff on maternity or paternity leave. However, temporary staff and staff on fixed term contracts who have been employed by the authority for over a year should be considered permanent. Where a county fire authority is reporting, fire–fighter data should be excluded.
“Number of working days/shifts” means days/shifts scheduled for work, after holidays/leave days have been excluded. In the instance of an employee reporting sick part way through a working day/shift, authorities should record the information to the nearest half day/shift.
Include days lost through sickness due to disability or long–term sickness even if the staff are not being paid.
9
When comparing sickness absence data across authorities’ users should bear in mind that sickness absence varies between part–time and full–time employees and across service areas so comparison should wherever possible be made with similar authorities.
Reason for local collection
This data is not collected quarterly elsewhere.
Period type
Freestanding financial quarter. Please note that this is data for a three month period only, not a year to date figure.
Financial Quarter 1: 1 Jul 2016 to 30 Sept 2016
Metric type
Local – this data is not collected quarterly elsewhere.
Upload instructions
Please note the unit of measure for the figure entered here should be days per FTE employee.
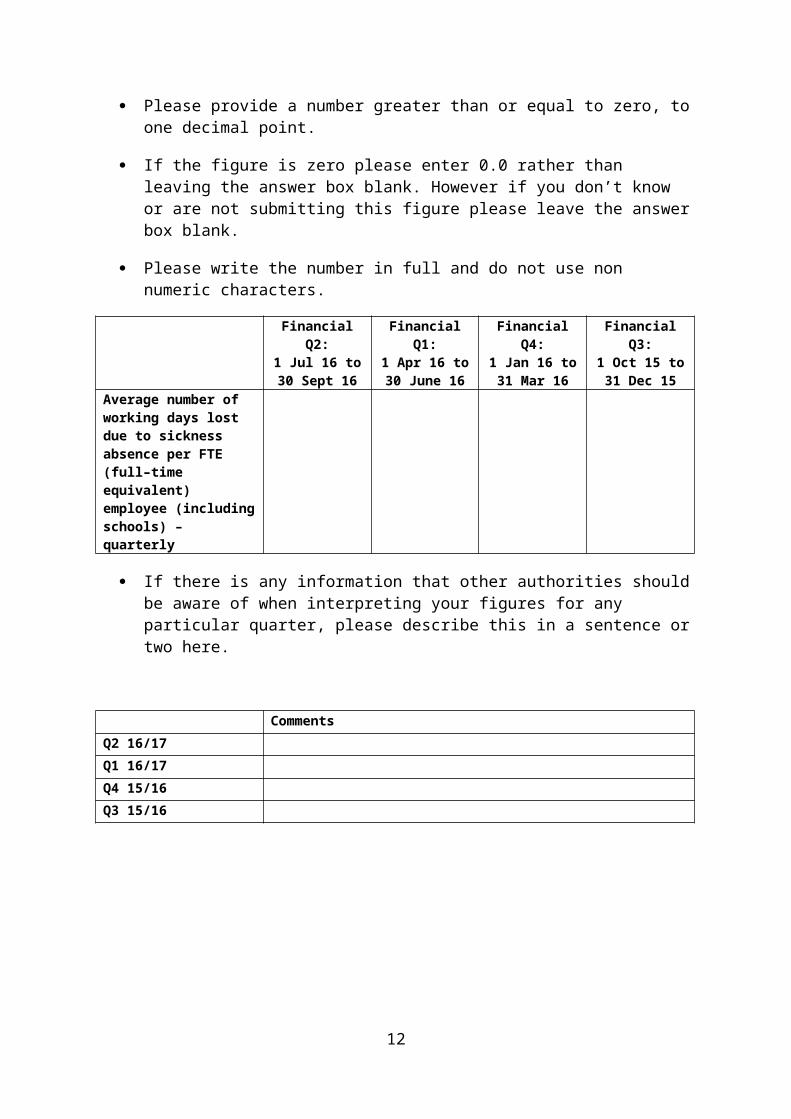
Please provide a number greater than or equal to zero, to one decimal point.
If the figure is zero please enter 0.0 rather than leaving the answer box blank. However if you don’t know or are not submitting this figure please leave the answer box blank.
Please write the number in full and do not use non numeric characters.
Financial Q2:1 Jul 16 to 30
Sept 16
Financial Q1:1 Apr 16 to 30
June 16
Financial Q4:1 Jan 16 to 31
Mar 16
Financial Q3:1 Oct 15 to 31
Dec 15Average number of working days lost due to sickness absence per FTE (full–time equivalent) employee (including schools) – quarterly
If there is any information that other authorities should be aware of when interpreting your figures for any particular quarter, please describe this in a sentence or two here.
10
CommentsQ2 16/17Q1 16/17Q4 15/16Q3 15/16
11
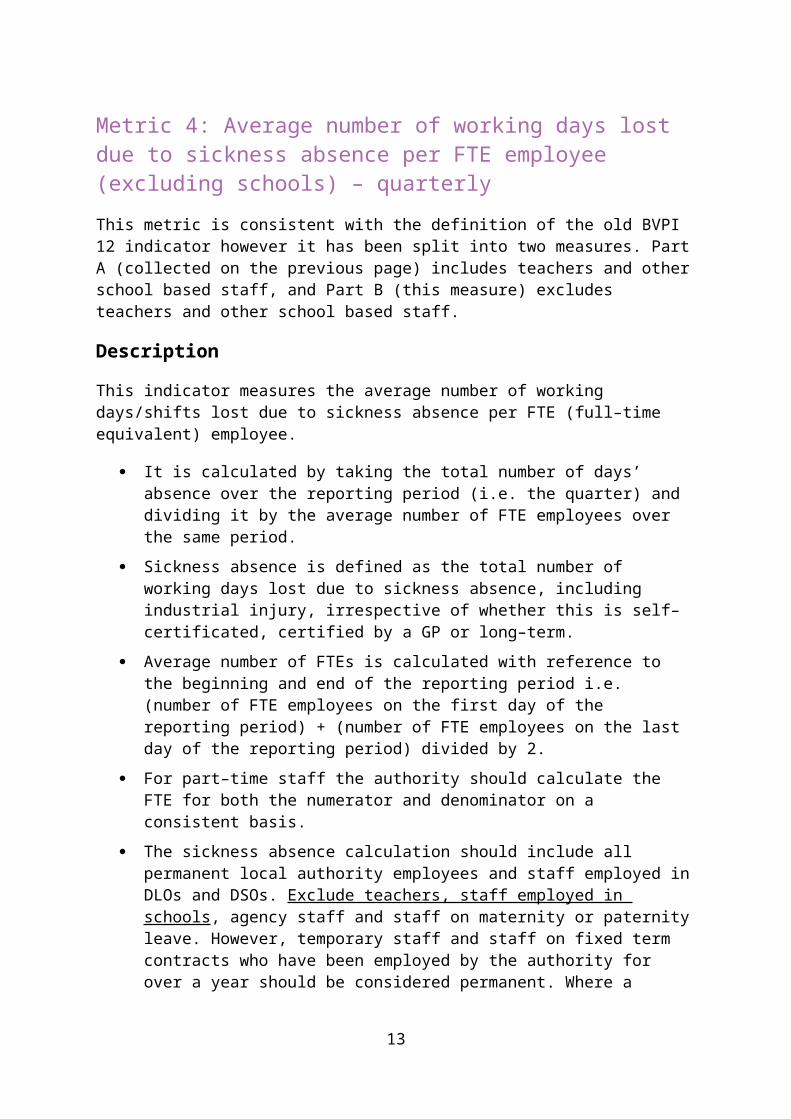
Metric 4: Average number of working days lost due to sickness absence per FTE employee (excluding schools) – quarterly
This metric is consistent with the definition of the old BVPI 12 indicator however it has been split into two measures. Part A (collected on the previous page) includes teachers and other school based staff, and Part B (this measure) excludes teachers and other school based staff.
Description
This indicator measures the average number of working days/shifts lost due to sickness absence per FTE (full–time equivalent) employee.
It is calculated by taking the total number of days’ absence over the reporting period (i.e. the quarter) and dividing it by the average number of FTE employees over the same period.
Sickness absence is defined as the total number of working days lost due to sickness absence, including industrial injury, irrespective of whether this is self–certificated, certified by a GP or long–term.
Average number of FTEs is calculated with reference to the beginning and end of the reporting period i.e. (number of FTE employees on the first day of the reporting period) + (number of FTE employees on the last day of the reporting period) divided by 2.
For part–time staff the authority should calculate the FTE for both the numerator and denominator on a consistent basis.
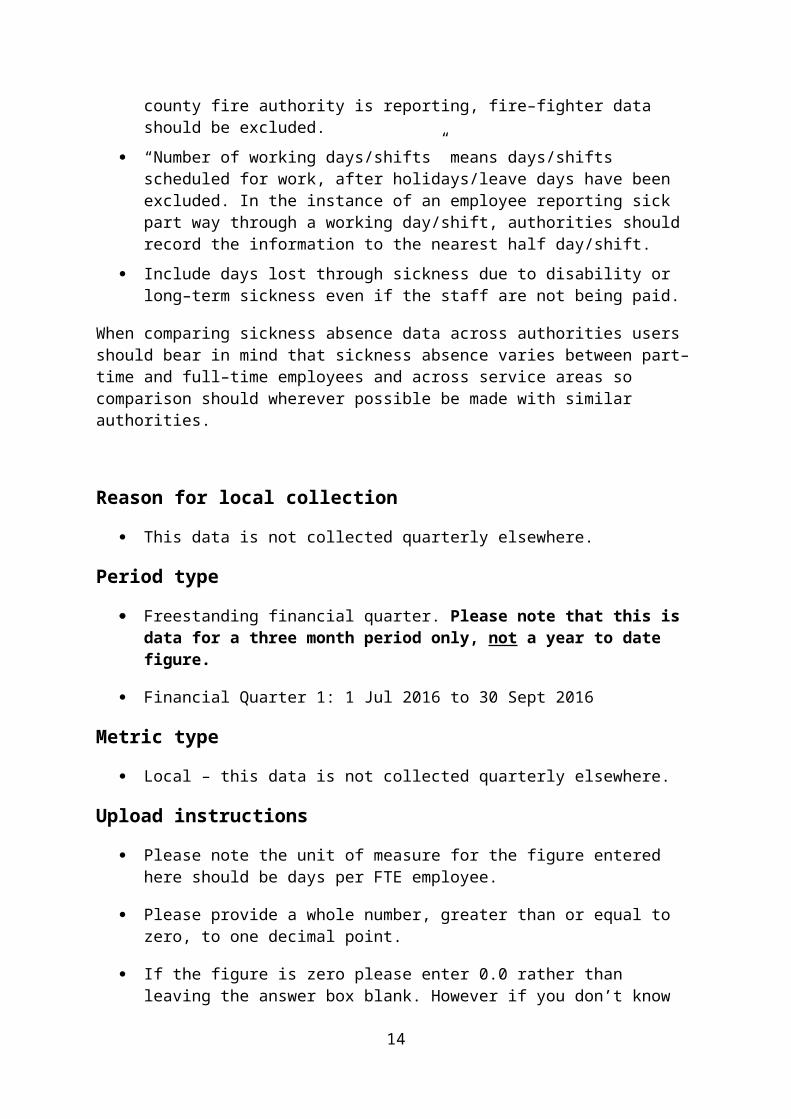
The sickness absence calculation should include all permanent local authority employees and staff employed in DLOs and DSOs. Exclude teachers, staff employed in schools, agency staff and staff on maternity or paternity leave. However, temporary staff and staff on fixed term contracts who have been employed by the authority for over a year should be considered permanent. Where a county fire authority is reporting, fire–fighter data should be excluded.
“Number of working days/shifts” means days/shifts scheduled for work, after holidays/leave days have been excluded. In the instance of an employee reporting sick part way through a working day/shift, authorities should record the information to the nearest half day/shift.
Include days lost through sickness due to disability or long–term sickness even if the staff are not being paid.
When comparing sickness absence data across authorities users should bear in mind that sickness absence varies between part–time and full–time employees and across service areas so comparison should wherever possible be made with similar authorities.
12
Reason for local collection
This data is not collected quarterly elsewhere.
Period type
Freestanding financial quarter. Please note that this is data for a three month period only, not a year to date figure.
Financial Quarter 1: 1 Jul 2016 to 30 Sept 2016
Metric type
Local – this data is not collected quarterly elsewhere.
Upload instructions
Please note the unit of measure for the figure entered here should be days per FTE employee.
Please provide a whole number, greater than or equal to zero, to one decimal point.
If the figure is zero please enter 0.0 rather than leaving the answer box blank. However if you don’t know or are not submitting this figure please leave the answer box blank.
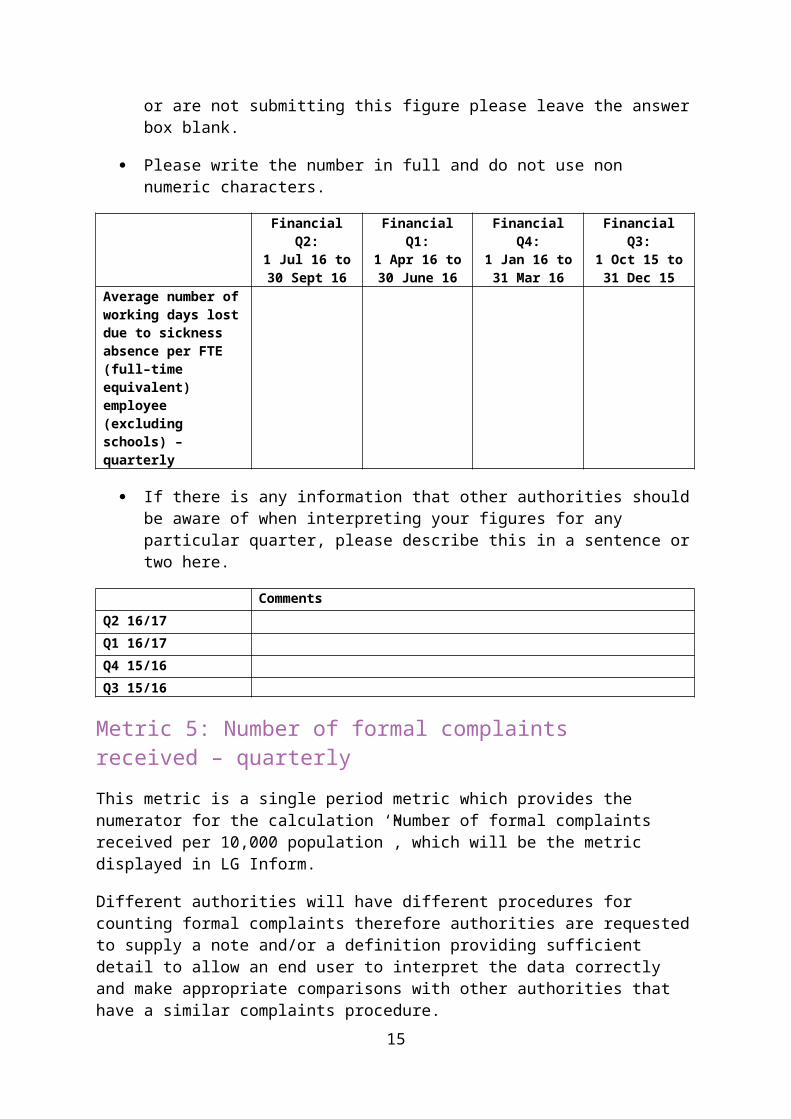
Please write the number in full and do not use non numeric characters.
Financial Q2:1 Jul 16 to 30
Sept 16
Financial Q1:1 Apr 16 to 30
June 16
Financial Q4:1 Jan 16 to 31
Mar 16
Financial Q3:1 Oct 15 to 31
Dec 15Average number of working days lost due to sickness absence per FTE (full–time equivalent) employee (excluding schools) – quarterly
If there is any information that other authorities should be aware of when interpreting your figures for any particular quarter, please describe this in a sentence or two here.
CommentsQ2 16/17Q1 16/17Q4 15/16Q3 15/16
13
Metric 5: Number of formal complaints received – quarterly
This metric is a single period metric which provides the numerator for the calculation ‘Number of formal complaints received per 10,000 population”, which will be the metric displayed in LG Inform.
Different authorities will have different procedures for counting formal complaints therefore authorities are requested to supply a note and/or a definition providing sufficient detail to allow an end user to interpret the data correctly and make appropriate comparisons with other authorities that have a similar complaints procedure.
Description
This metric is the number of complaints received by the authority in the reporting period.
A complaint is defined as when dissatisfaction is expressed about a service (whether that service is provided directly by the council or by a contractor or partner) that requires a response.
A complaint can be received in person, via the telephone, email or in writing.
Authorities may have different procedures for recording complaints therefore this should be kept in mind when comparing figures from different councils and users should refer to any accompanying notes provided by the authority.
Reason for local collection
This data is not collected quarterly elsewhere.
Period type
Freestanding financial quarter. Please note that this is data for a three month period only, not a year to date figure.
Financial Quarter 1: 1 Jul 2016 to 30 Sept 2016
Metric type
Local – this data is not collected quarterly elsewhere.
14
Upload instructions
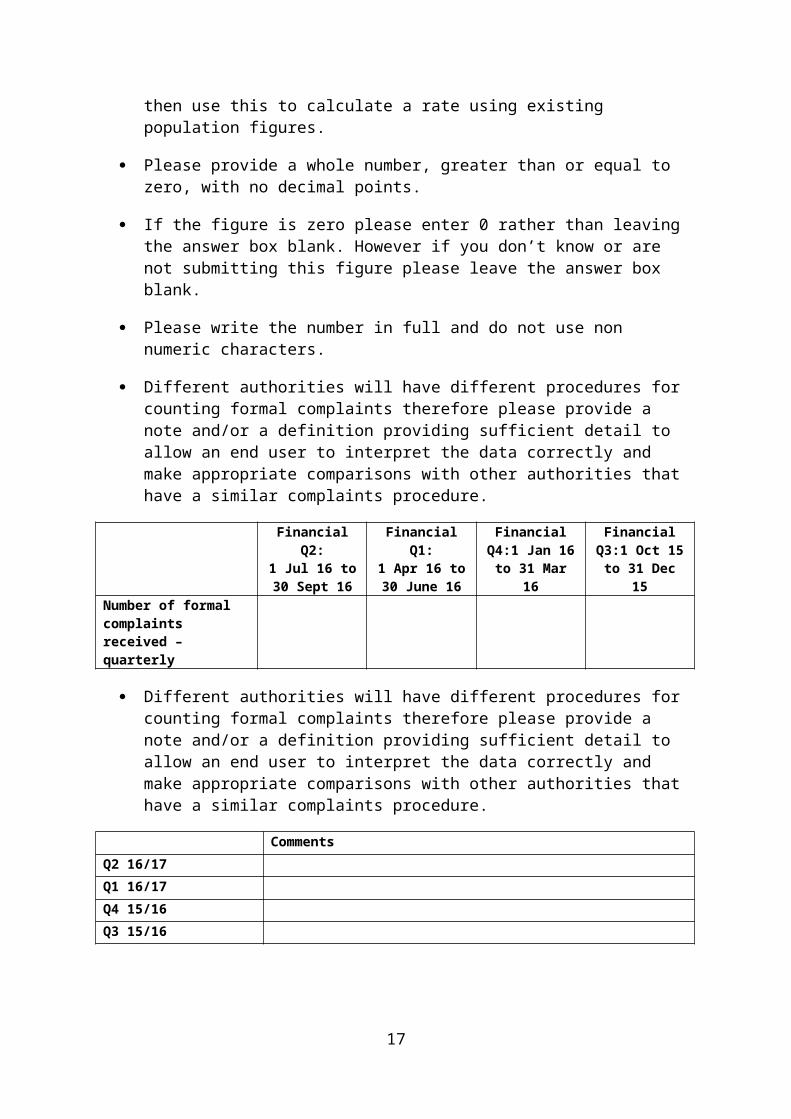
Please note the unit of measure for the figure entered here should be the number of complaints. LG Inform will then use this to calculate a rate using existing population figures.
Please provide a whole number, greater than or equal to zero, with no decimal points.
If the figure is zero please enter 0 rather than leaving the answer box blank. However if you don’t know or are not submitting this figure please leave the answer box blank.
Please write the number in full and do not use non numeric characters.
Different authorities will have different procedures for counting formal complaints therefore please provide a note and/or a definition providing sufficient detail to allow an end user to interpret the data correctly and make appropriate comparisons with other authorities that have a similar complaints procedure.
Financial Q2:1 Jul 16 to 30
Sept 16
Financial Q1:1 Apr 16 to 30
June 16
Financial Q4:1 Jan 16 to 31
Mar 16
Financial Q3:1 Oct 15 to 31
Dec 15Number of formal complaints received – quarterly
Different authorities will have different procedures for counting formal complaints therefore please provide a note and/or a definition providing sufficient detail to allow an end user to interpret the data correctly and make appropriate comparisons with other authorities that have a similar complaints procedure.
CommentsQ2 16/17Q1 16/17Q4 15/16Q3 15/16
15
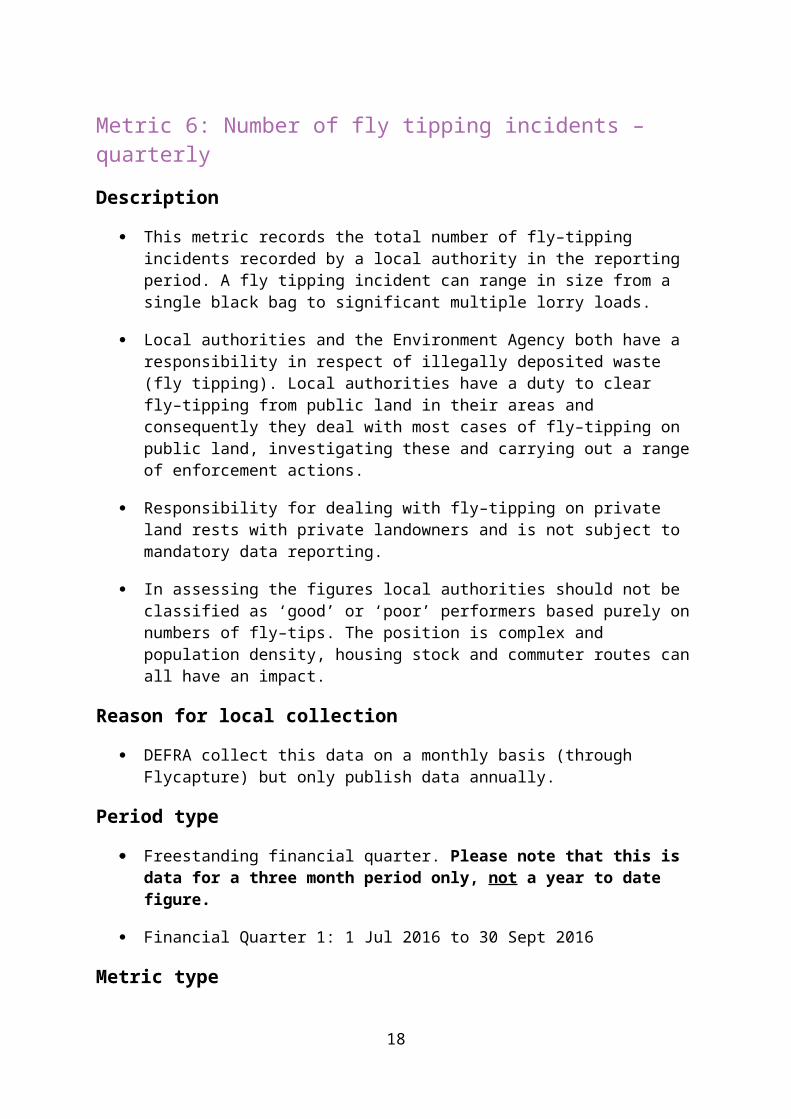
Metric 6: Number of fly tipping incidents – quarterly
Description
This metric records the total number of fly–tipping incidents recorded by a local authority in the reporting period. A fly tipping incident can range in size from a single black bag to significant multiple lorry loads.
Local authorities and the Environment Agency both have a responsibility in respect of illegally deposited waste (fly tipping). Local authorities have a duty to clear fly–tipping from public land in their areas and consequently they deal with most cases of fly–tipping on public land, investigating these and carrying out a range of enforcement actions.
Responsibility for dealing with fly–tipping on private land rests with private landowners and is not subject to mandatory data reporting.
In assessing the figures local authorities should not be classified as ‘good’ or ‘poor’ performers based purely on numbers of fly–tips. The position is complex and population density, housing stock and commuter routes can all have an impact.
Reason for local collection
DEFRA collect this data on a monthly basis (through Flycapture) but only publish data annually.
Period type
Freestanding financial quarter. Please note that this is data for a three month period only, not a year to date figure.
Financial Quarter 1: 1 Jul 2016 to 30 Sept 2016
Metric type
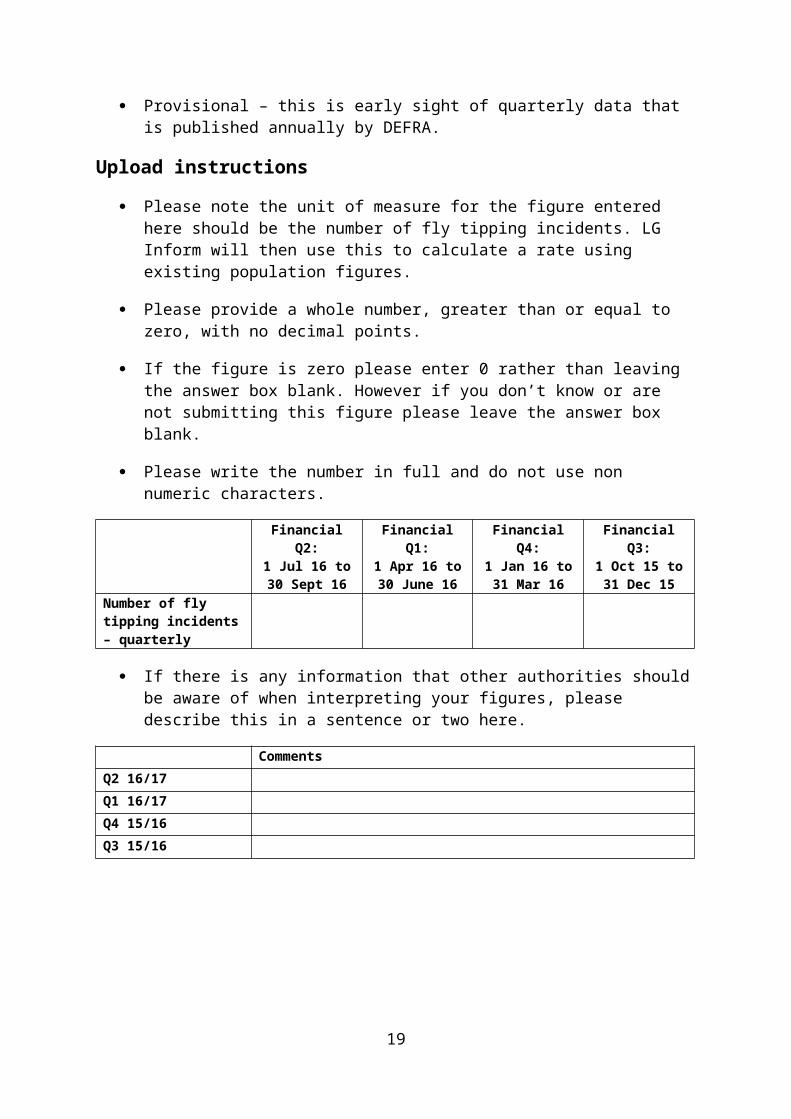
Provisional – this is early sight of quarterly data that is published annually by DEFRA.
Upload instructions
Please note the unit of measure for the figure entered here should be the number of fly tipping incidents. LG Inform will then use this to calculate a rate using existing population figures.
16
Please provide a whole number, greater than or equal to zero, with no decimal points.
If the figure is zero please enter 0 rather than leaving the answer box blank. However if you don’t know or are not submitting this figure please leave the answer box blank.
Please write the number in full and do not use non numeric characters.
Financial Q2:1 Jul 16 to 30
Sept 16
Financial Q1:1 Apr 16 to 30
June 16
Financial Q4:1 Jan 16 to 31
Mar 16
Financial Q3:1 Oct 15 to 31
Dec 15Number of fly tipping incidents – quarterly
If there is any information that other authorities should be aware of when interpreting your figures, please describe this in a sentence or two here.
CommentsQ2 16/17Q1 16/17Q4 15/16Q3 15/16
17
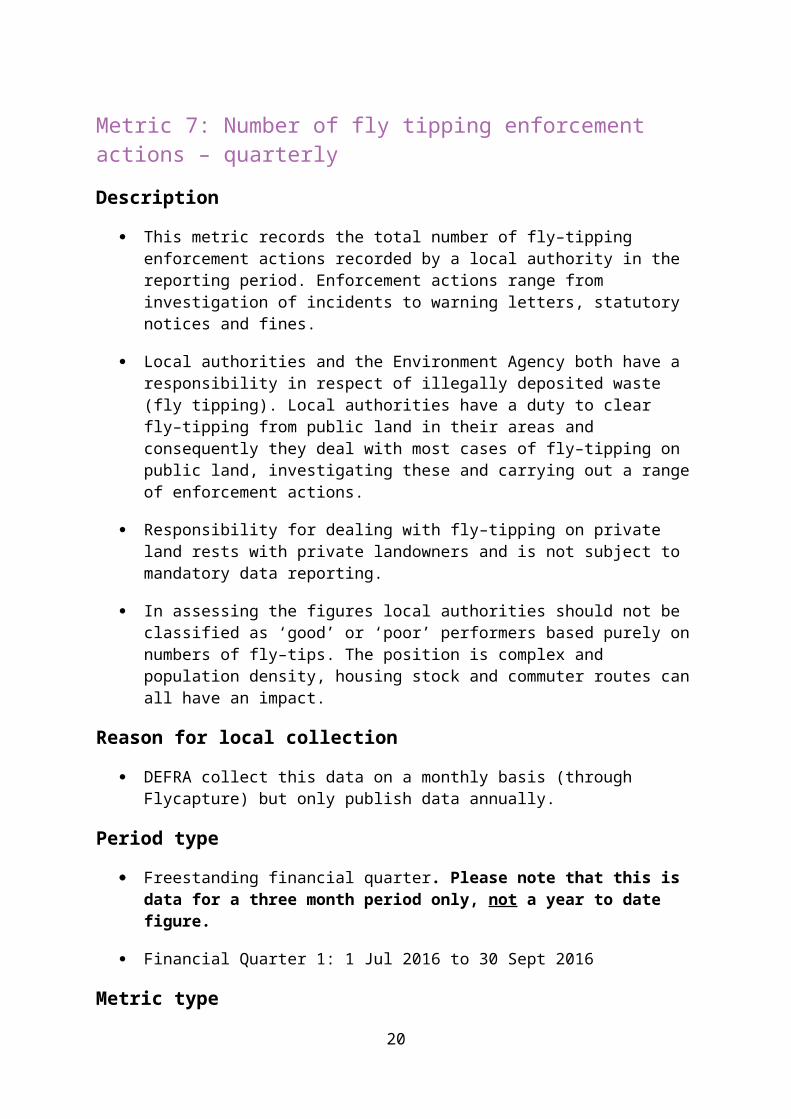
Metric 7: Number of fly tipping enforcement actions – quarterly
Description
This metric records the total number of fly–tipping enforcement actions recorded by a local authority in the reporting period. Enforcement actions range from investigation of incidents to warning letters, statutory notices and fines.
Local authorities and the Environment Agency both have a responsibility in respect of illegally deposited waste (fly tipping). Local authorities have a duty to clear fly–tipping from public land in their areas and consequently they deal with most cases of fly–tipping on public land, investigating these and carrying out a range of enforcement actions.
Responsibility for dealing with fly–tipping on private land rests with private landowners and is not subject to mandatory data reporting.
In assessing the figures local authorities should not be classified as ‘good’ or ‘poor’ performers based purely on numbers of fly–tips. The position is complex and population density, housing stock and commuter routes can all have an impact.
Reason for local collection
DEFRA collect this data on a monthly basis (through Flycapture) but only publish data annually.
Period type
Freestanding financial quarter. Please note that this is data for a three month period only, not a year to date figure.
Financial Quarter 1: 1 Jul 2016 to 30 Sept 2016
Metric type
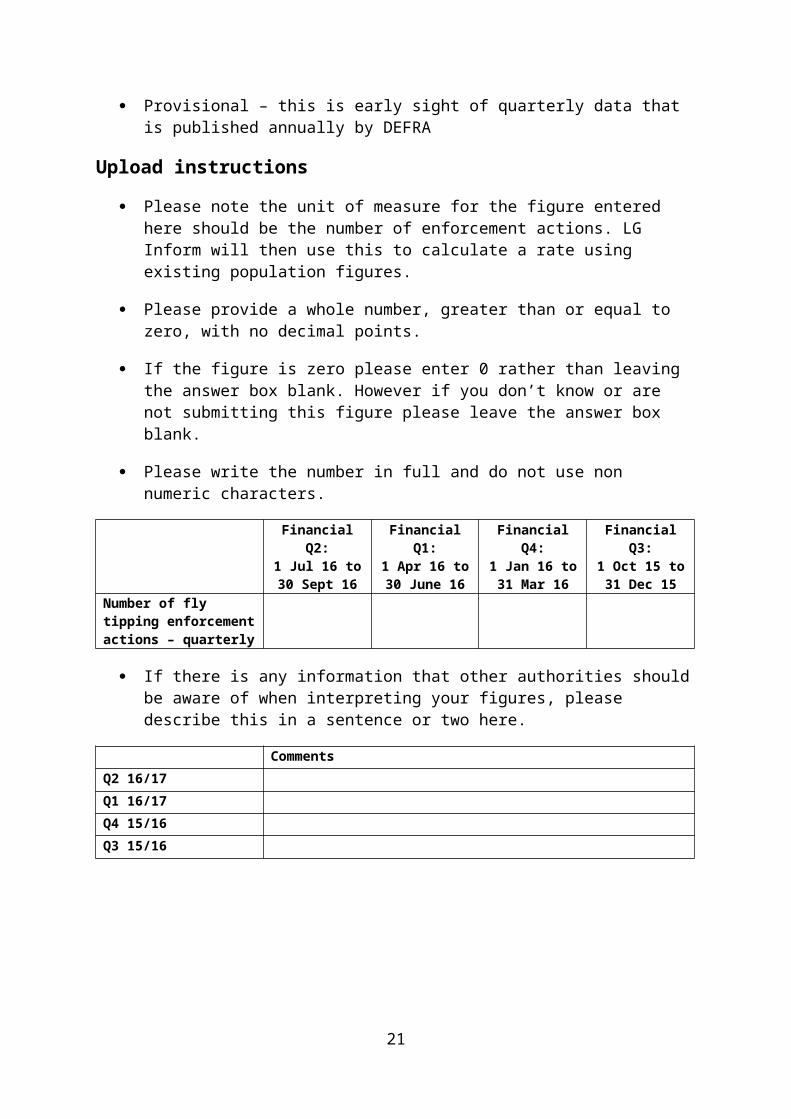
Provisional – this is early sight of quarterly data that is published annually by DEFRA
Upload instructions
Please note the unit of measure for the figure entered here should be the number of enforcement actions. LG Inform will then use this to calculate a rate using existing population figures.
18
Please provide a whole number, greater than or equal to zero, with no decimal points.
If the figure is zero please enter 0 rather than leaving the answer box blank. However if you don’t know or are not submitting this figure please leave the answer box blank.
Please write the number in full and do not use non numeric characters.
Financial Q2:1 Jul 16 to 30
Sept 16
Financial Q1:1 Apr 16 to 30
June 16
Financial Q4:1 Jan 16 to 31
Mar 16
Financial Q3:1 Oct 15 to 31
Dec 15Number of fly tipping enforcement actions – quarterly
If there is any information that other authorities should be aware of when interpreting your figures, please describe this in a sentence or two here.
CommentsQ2 16/17Q1 16/17Q4 15/16Q3 15/16
19
Metric 8: Number of unique website visitors (excluding authorities own staff) – quarterly
Description
This metric is the number of unique visitors to the authority’s website in the period, excluding visitors from the authority’s own staff. Unique visitors are the number of distinct individuals that visit a website in the period regardless of how many times they have visited the site in that period.
This metric definition should be readily available from most website analytical tools by filtering the data from specific domains or IP addresses used by the authority.
For those authorities using Google Analytics to collect these statistics, the correct figure to be submitted is number of ‘users’ in the period.
Reason for local collection
This data is not collected quarterly elsewhere.
Period type
Freestanding financial quarter. Please note that this is data for a three month period only, not a year to date figure.
Financial Quarter 1: 1 Jul 2016 to 30 Sept 2016
Metric type
Local – this data is not collected quarterly elsewhere.
Upload instructions
Please note the unit of measure for the figure entered here should be the number of unique website visitors. LG Inform will then use this to calculate number of unique visitors as a proportion of the resident population for an area.
Please provide a whole number, greater than or equal to zero, with no decimal points.
If the figure is zero please enter 0 rather than leaving the answer box blank. However if you don’t know or are not submitting this figure please leave the answer box blank.
20
Please write the number in full and do not use non numeric characters.
Financial Q2:1 Jul 16 to 30
Sept 16
Financial Q1:1 Apr 16 to 30
June 16
Financial Q4:1 Jan 16 to 31
Mar 16
Financial Q3:1 Oct 15 to 31
Dec 15Number of unique website visitors (excluding authorities own staff) – quarterly
If there is any information that other authorities should be aware of when interpreting your figures, please describe this in a sentence or two here.
CommentsQ2 16/17Q1 16/17Q4 15/16Q3 15/16
Please specify which website analytics package you are using to report on your website statistics:
21