
InfographicVQA - cvit.iiit.ac.in
10
InfographicVQA Minesh Mathew 1 Viraj Bagal 2 * Rub` en Tito 3 Dimosthenis Karatzas 3 Ernest Valveny 3 C.V. Jawahar 1 1 CVIT, IIIT Hyderabad, India 1 IISER Pune, India 3 Computer Vision Center, UAB, Spain [email protected], [email protected], [email protected] Abstract Infographics communicate information using a combi- nation of textual, graphical and visual elements. This work explores the automatic understanding of infographic images by using a Visual Question Answering technique. To this end, we present InfographicVQA, a new dataset comprising a diverse collection of infographics and question-answer annotations. The questions require methods that jointly rea- son over the document layout, textual content, graphical el- ements, and data visualizations. We curate the dataset with an emphasis on questions that require elementary reason- ing and basic arithmetic skills. For VQA on the dataset, we evaluate two Transformer-based strong baselines. Both the baselines yield unsatisfactory results compared to near perfect human performance on the dataset. The results sug- gest that VQA on infographics—images that are designed to communicate information quickly and clearly to human brain—is ideal for benchmarking machine understanding of complex document images. The dataset is available for download at docvqa.org 1. Introduction Infographics are documents created to convey informa- tion in a compact manner using a combination of textual and visual cues. The presence of the text, numbers and sym- bols, along with the semantics that arise from their relative placements, make infographics understanding a challeng- ing problem. True document image understanding in this domain requires methods to jointly reason over the docu- ment layout, textual content, graphical elements, data visu- alisations, color schemes and visual art, among others. Mo- tivated by the multimodal nature of infographics, and the human centered design, we propose a Visual Question An- swering (VQA) approach to infographics understanding. VQA received significant attention over the past few years [15, 5, 16, 20, 23, 3]. Several new VQA branches focus on images with text, such as answering questions * Work done during an internship at IIIT Hyderabad. How many companies have more than 10K delivery workers? Answer: 2 Evidence: Fig ure Answer-source: Non - ex trac tive Operation: Count ing Sort ing Who has better coverage in Toronto - Canada post or Amazon? Answer: canada post Evidence: Text Answer-source: Ques tion - span Im age - span Operation: none In which cities did Canada Post get maximum media coverage? Answer: vancouver, montreal Evidence: Text Map Answer-source: Multi - span Operation: none Figure 1: Example image from InfographicVQA along with ques- tions and answers. For each question, source of the answer, type of evidence the answer is grounded on, and the discrete operations required to find the answer are shown. by looking at text books [24], business documents [31], charts [21, 22, 10] and screenshots of web pages [41]. Still, infographics are unique in their combined use and purpose- ful arrangement of visual and textual elements. In this work, we introduce a new dataset for VQA on infographics, InfographicVQA, comprising 30, 035 ques- tions over 5, 485 images. An example from our dataset is shown in Figure 1. Questions in the dataset include ques- tions grounded on tables, figures and visualizations and questions that require combining multiple cues. Since most infographics contain numerical data, we collect questions that require elementary reasoning skills such as counting,
Transcript of InfographicVQA - cvit.iiit.ac.in

InfographicVQA
Minesh Mathew1 Viraj Bagal2* Ruben Tito3
Dimosthenis Karatzas3 Ernest Valveny3 C.V. Jawahar11CVIT, IIIT Hyderabad, India 1IISER Pune, India 3Computer Vision Center, UAB, [email protected], [email protected], [email protected]
Abstract
Infographics communicate information using a combi-nation of textual, graphical and visual elements. This workexplores the automatic understanding of infographic imagesby using a Visual Question Answering technique. To thisend, we present InfographicVQA, a new dataset comprisinga diverse collection of infographics and question-answerannotations. The questions require methods that jointly rea-son over the document layout, textual content, graphical el-ements, and data visualizations. We curate the dataset withan emphasis on questions that require elementary reason-ing and basic arithmetic skills. For VQA on the dataset,we evaluate two Transformer-based strong baselines. Boththe baselines yield unsatisfactory results compared to nearperfect human performance on the dataset. The results sug-gest that VQA on infographics—images that are designedto communicate information quickly and clearly to humanbrain—is ideal for benchmarking machine understandingof complex document images. The dataset is available fordownload at docvqa.org
1. IntroductionInfographics are documents created to convey informa-
tion in a compact manner using a combination of textualand visual cues. The presence of the text, numbers and sym-bols, along with the semantics that arise from their relativeplacements, make infographics understanding a challeng-ing problem. True document image understanding in thisdomain requires methods to jointly reason over the docu-ment layout, textual content, graphical elements, data visu-alisations, color schemes and visual art, among others. Mo-tivated by the multimodal nature of infographics, and thehuman centered design, we propose a Visual Question An-swering (VQA) approach to infographics understanding.
VQA received significant attention over the past fewyears [15, 5, 16, 20, 23, 3]. Several new VQA branchesfocus on images with text, such as answering questions
*Work done during an internship at IIIT Hyderabad.
How many companies have more than 10K delivery workers?Answer: 2 Evidence: FigureAnswer-source: Non-extractive Operation: Counting Sorting
Who has better coverage in Toronto - Canada post or Amazon?Answer: canada post Evidence: TextAnswer-source: Question-span Image-span Operation: none
In which cities did Canada Post get maximum media coverage?Answer: vancouver, montreal Evidence: Text MapAnswer-source: Multi-span Operation: none
Figure 1: Example image from InfographicVQA along with ques-tions and answers. For each question, source of the answer, typeof evidence the answer is grounded on, and the discrete operationsrequired to find the answer are shown.
by looking at text books [24], business documents [31],charts [21, 22, 10] and screenshots of web pages [41]. Still,infographics are unique in their combined use and purpose-ful arrangement of visual and textual elements.
In this work, we introduce a new dataset for VQA oninfographics, InfographicVQA, comprising 30, 035 ques-tions over 5, 485 images. An example from our dataset isshown in Figure 1. Questions in the dataset include ques-tions grounded on tables, figures and visualizations andquestions that require combining multiple cues. Since mostinfographics contain numerical data, we collect questionsthat require elementary reasoning skills such as counting,
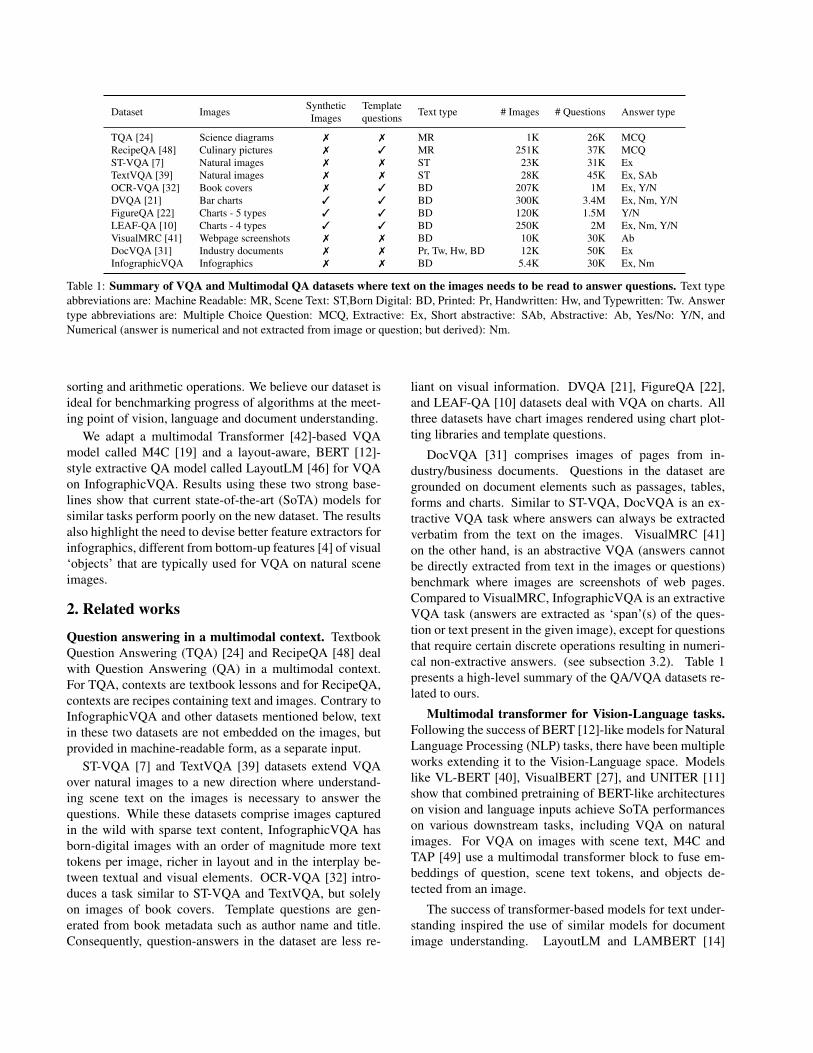
Dataset Images Synthetic Template Text type # Images # Questions Answer typeImages questions
TQA [24] Science diagrams ✗ ✗ MR 1K 26K MCQRecipeQA [48] Culinary pictures ✗ ✓ MR 251K 37K MCQST-VQA [7] Natural images ✗ ✗ ST 23K 31K ExTextVQA [39] Natural images ✗ ✗ ST 28K 45K Ex, SAbOCR-VQA [32] Book covers ✗ ✓ BD 207K 1M Ex, Y/NDVQA [21] Bar charts ✓ ✓ BD 300K 3.4M Ex, Nm, Y/NFigureQA [22] Charts - 5 types ✓ ✓ BD 120K 1.5M Y/NLEAF-QA [10] Charts - 4 types ✓ ✓ BD 250K 2M Ex, Nm, Y/NVisualMRC [41] Webpage screenshots ✗ ✗ BD 10K 30K AbDocVQA [31] Industry documents ✗ ✗ Pr, Tw, Hw, BD 12K 50K ExInfographicVQA Infographics ✗ ✗ BD 5.4K 30K Ex, Nm
Table 1: Summary of VQA and Multimodal QA datasets where text on the images needs to be read to answer questions. Text typeabbreviations are: Machine Readable: MR, Scene Text: ST,Born Digital: BD, Printed: Pr, Handwritten: Hw, and Typewritten: Tw. Answertype abbreviations are: Multiple Choice Question: MCQ, Extractive: Ex, Short abstractive: SAb, Abstractive: Ab, Yes/No: Y/N, andNumerical (answer is numerical and not extracted from image or question; but derived): Nm.
sorting and arithmetic operations. We believe our dataset isideal for benchmarking progress of algorithms at the meet-ing point of vision, language and document understanding.
We adapt a multimodal Transformer [42]-based VQAmodel called M4C [19] and a layout-aware, BERT [12]-style extractive QA model called LayoutLM [46] for VQAon InfographicVQA. Results using these two strong base-lines show that current state-of-the-art (SoTA) models forsimilar tasks perform poorly on the new dataset. The resultsalso highlight the need to devise better feature extractors forinfographics, different from bottom-up features [4] of visual‘objects’ that are typically used for VQA on natural sceneimages.
2. Related works
Question answering in a multimodal context. TextbookQuestion Answering (TQA) [24] and RecipeQA [48] dealwith Question Answering (QA) in a multimodal context.For TQA, contexts are textbook lessons and for RecipeQA,contexts are recipes containing text and images. Contrary toInfographicVQA and other datasets mentioned below, textin these two datasets are not embedded on the images, butprovided in machine-readable form, as a separate input.
ST-VQA [7] and TextVQA [39] datasets extend VQAover natural images to a new direction where understand-ing scene text on the images is necessary to answer thequestions. While these datasets comprise images capturedin the wild with sparse text content, InfographicVQA hasborn-digital images with an order of magnitude more texttokens per image, richer in layout and in the interplay be-tween textual and visual elements. OCR-VQA [32] intro-duces a task similar to ST-VQA and TextVQA, but solelyon images of book covers. Template questions are gen-erated from book metadata such as author name and title.Consequently, question-answers in the dataset are less re-
liant on visual information. DVQA [21], FigureQA [22],and LEAF-QA [10] datasets deal with VQA on charts. Allthree datasets have chart images rendered using chart plot-ting libraries and template questions.
DocVQA [31] comprises images of pages from in-dustry/business documents. Questions in the dataset aregrounded on document elements such as passages, tables,forms and charts. Similar to ST-VQA, DocVQA is an ex-tractive VQA task where answers can always be extractedverbatim from the text on the images. VisualMRC [41]on the other hand, is an abstractive VQA (answers cannotbe directly extracted from text in the images or questions)benchmark where images are screenshots of web pages.Compared to VisualMRC, InfographicVQA is an extractiveVQA task (answers are extracted as ‘span’(s) of the ques-tion or text present in the given image), except for questionsthat require certain discrete operations resulting in numeri-cal non-extractive answers. (see subsection 3.2). Table 1presents a high-level summary of the QA/VQA datasets re-lated to ours.
Multimodal transformer for Vision-Language tasks.Following the success of BERT [12]-like models for NaturalLanguage Processing (NLP) tasks, there have been multipleworks extending it to the Vision-Language space. Modelslike VL-BERT [40], VisualBERT [27], and UNITER [11]show that combined pretraining of BERT-like architectureson vision and language inputs achieve SoTA performanceson various downstream tasks, including VQA on naturalimages. For VQA on images with scene text, M4C andTAP [49] use a multimodal transformer block to fuse em-beddings of question, scene text tokens, and objects de-tected from an image.
The success of transformer-based models for text under-standing inspired the use of similar models for documentimage understanding. LayoutLM and LAMBERT [14]
Num
ber o
f Que
stio
ns
0
500
1000
1500
2000
Image-span Question-span Multi-span Non-extractive
(a) Answer-sources and their counts
Num
ber o
f Que
stio
ns
0
500
1000
1500
2000
Text Table/List Figure Map Visual/Layout
(b) Evidence types and their counts
Num
ber o
f Que
stio
ns
0
100
200
300
400
Counting Sorting Arithmetic
(c) Operation types and their counts
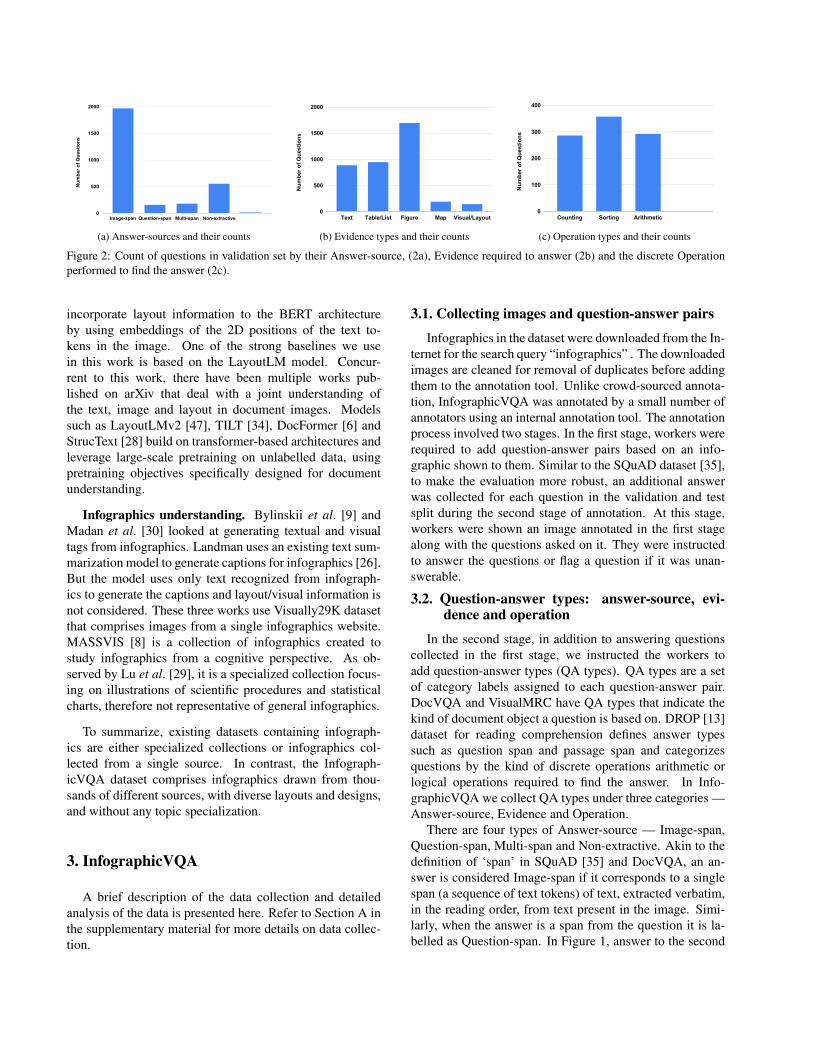
Figure 2: Count of questions in validation set by their Answer-source, (2a), Evidence required to answer (2b) and the discrete Operationperformed to find the answer (2c).
incorporate layout information to the BERT architectureby using embeddings of the 2D positions of the text to-kens in the image. One of the strong baselines we usein this work is based on the LayoutLM model. Concur-rent to this work, there have been multiple works pub-lished on arXiv that deal with a joint understanding ofthe text, image and layout in document images. Modelssuch as LayoutLMv2 [47], TILT [34], DocFormer [6] andStrucText [28] build on transformer-based architectures andleverage large-scale pretraining on unlabelled data, usingpretraining objectives specifically designed for documentunderstanding.
Infographics understanding. Bylinskii et al. [9] andMadan et al. [30] looked at generating textual and visualtags from infographics. Landman uses an existing text sum-marization model to generate captions for infographics [26].But the model uses only text recognized from infograph-ics to generate the captions and layout/visual information isnot considered. These three works use Visually29K datasetthat comprises images from a single infographics website.MASSVIS [8] is a collection of infographics created tostudy infographics from a cognitive perspective. As ob-served by Lu et al. [29], it is a specialized collection focus-ing on illustrations of scientific procedures and statisticalcharts, therefore not representative of general infographics.
To summarize, existing datasets containing infograph-ics are either specialized collections or infographics col-lected from a single source. In contrast, the Infograph-icVQA dataset comprises infographics drawn from thou-sands of different sources, with diverse layouts and designs,and without any topic specialization.
3. InfographicVQA
A brief description of the data collection and detailedanalysis of the data is presented here. Refer to Section A inthe supplementary material for more details on data collec-tion.
3.1. Collecting images and question-answer pairs
Infographics in the dataset were downloaded from the In-ternet for the search query “infographics” . The downloadedimages are cleaned for removal of duplicates before addingthem to the annotation tool. Unlike crowd-sourced annota-tion, InfographicVQA was annotated by a small number ofannotators using an internal annotation tool. The annotationprocess involved two stages. In the first stage, workers wererequired to add question-answer pairs based on an info-graphic shown to them. Similar to the SQuAD dataset [35],to make the evaluation more robust, an additional answerwas collected for each question in the validation and testsplit during the second stage of annotation. At this stage,workers were shown an image annotated in the first stagealong with the questions asked on it. They were instructedto answer the questions or flag a question if it was unan-swerable.
3.2. Question-answer types: answer-source, evi-dence and operation
In the second stage, in addition to answering questionscollected in the first stage, we instructed the workers toadd question-answer types (QA types). QA types are a setof category labels assigned to each question-answer pair.DocVQA and VisualMRC have QA types that indicate thekind of document object a question is based on. DROP [13]dataset for reading comprehension defines answer typessuch as question span and passage span and categorizesquestions by the kind of discrete operations arithmetic orlogical operations required to find the answer. In Info-graphicVQA we collect QA types under three categories —Answer-source, Evidence and Operation.
There are four types of Answer-source — Image-span,Question-span, Multi-span and Non-extractive. Akin to thedefinition of ‘span’ in SQuAD [35] and DocVQA, an an-swer is considered Image-span if it corresponds to a singlespan (a sequence of text tokens) of text, extracted verbatim,in the reading order, from text present in the image. Simi-larly, when the answer is a span from the question it is la-belled as Question-span. In Figure 1, answer to the second
question is found both in the image and question as singlesequence of contiguous tokens (or a ‘span’). Hence thereare two answer sources for the question — Image-span andQuestion-span. A Multi-span answer is composed of mul-tiple spans of text from the image. Like the DROP datasetannotation, we instructed our workers to enter Multi-spananswers by separating each individual span by a comma anda white space. For example, in Figure 1 for the last questionthe answer is names of two cities, which do not appear ina contiguous sequence of text. Hence it is a Multi-span an-swer. For a Multi-span answer, any order of the individualspans is a valid answer. In the above example, both “Van-couver, Montreal” and “Montreal, Vancouver” are valid an-swers. Since such answers are unordered lists, we considerall permutations of the list as valid answers for the questionat evaluation time. The ’Non-extractive’ type is assignedwhen the answer is not an extracted one. While collect-ing question-answer pairs, Non-extractive questions wereallowed only if the answer is a numerical value. Inclusionof Question-span, Multi-span and numerical Non-extractiveanswers in InfographicVQA is inspired by a similar settingin the DROP dataset. We see this as a natural next step inVQA involving text, different from the purely extractive QAsetting in datasets like DocVQA and ST-VQA, and abstrac-tive question answering in VisualMRC where automatedevaluation is difficult. Allowing only numerical answers inthe non-extractive case makes sure that such answers areshort and unique, giving no room for variability. Near per-fect human performance while using automatic evaluationmetrics (Table 4) validates that answers in InfographicVQAare unique with minimal variability when answered by dif-ferent individuals.
The Evidence type indicates the kind of evidence behindthe answer. Types of evidence are Text, Figure, Table/List,Map and Visual/Layout. For example, Map is used if thequestion is based on data shown on a geographical map.Visual/Layout type is added when evidence is based on thevisual or layout aspect of the image. For example, questionssuch as “What is the color of the hat - brown or black?” or“What is written at the top left corner” fall in this category.Sometimes it is difficult to discern evidence for a question-answer pair. For example, for the first question in Figure 1,although the evidence type assigned by the worker is ‘Fig-ure’, it could even be ‘Table/List’ since the visualizationlooks like a table. The operation type captures the kindof discrete operation(s) required to arrive at an answer —Counting, Arithmetic or Sorting.
Figure 2 shows the distribution of questions in the vali-dation split based on Answer-source, Evidence and Opera-tion. As evident from Figure 1, a question can have multipletypes of answer source, evidence, or operation and manyquestions do not require any of the specified discrete oper-ations to find the answer. For these reasons, counts in plots
shown in Figure 2 do not add up to 100%.
3.3. Summary, statistics, and analysis
Dataset Questions Answers Avg. tokens%Unique Avg. len %Unique Avg. len per image
ST-VQA 84.84 8.80 65.63 1.56 7.52TextVQA 80.36 8.12 51.74 1.51 12.17VisualMRC 96.26 10.55 91.82 9.55 151.46DocVQA 72.34 9.49 64.29 2.43 182.75InfographicVQA 99.11 11.54 48.84 1.60 217.89
Table 2: Statistics of questions, answers and OCR tokens in Info-graphicVQA and other similar VQA datasets.
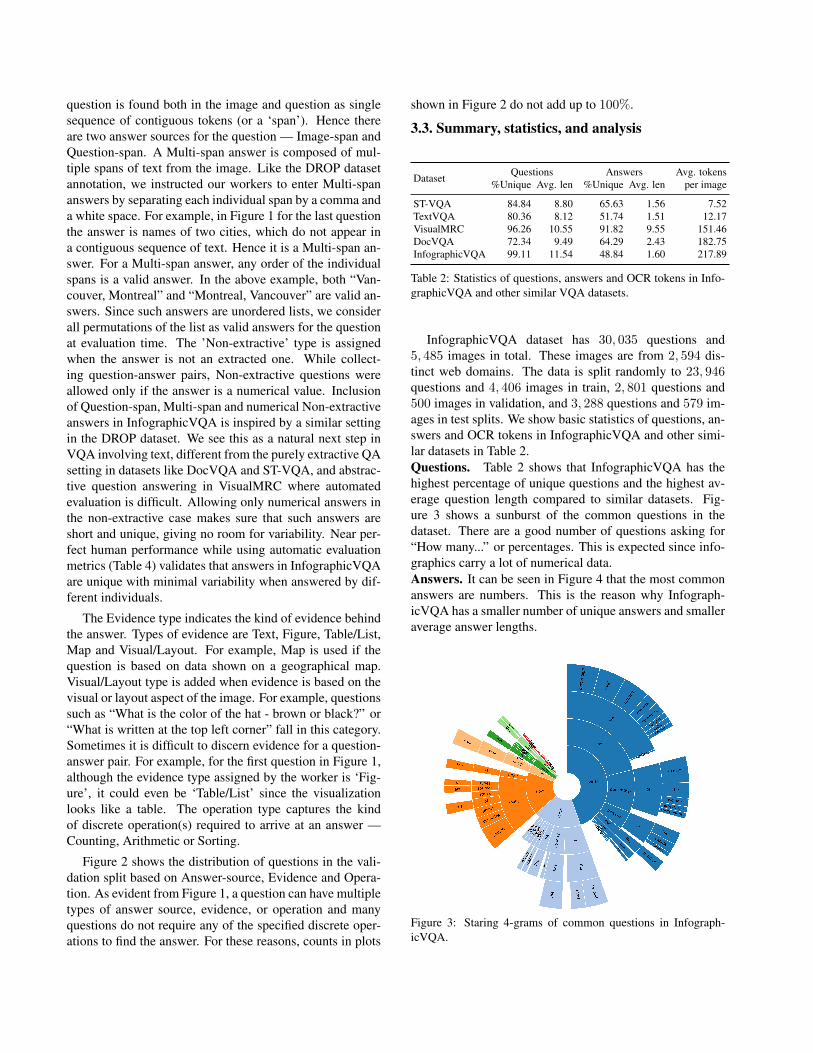
InfographicVQA dataset has 30, 035 questions and5, 485 images in total. These images are from 2, 594 dis-tinct web domains. The data is split randomly to 23, 946questions and 4, 406 images in train, 2, 801 questions and500 images in validation, and 3, 288 questions and 579 im-ages in test splits. We show basic statistics of questions, an-swers and OCR tokens in InfographicVQA and other simi-lar datasets in Table 2.Questions. Table 2 shows that InfographicVQA has thehighest percentage of unique questions and the highest av-erage question length compared to similar datasets. Fig-ure 3 shows a sunburst of the common questions in thedataset. There are a good number of questions asking for“How many...” or percentages. This is expected since info-graphics carry a lot of numerical data.Answers. It can be seen in Figure 4 that the most commonanswers are numbers. This is the reason why Infograph-icVQA has a smaller number of unique answers and smalleraverage answer lengths.
Figure 3: Staring 4-grams of common questions in Infograph-icVQA.
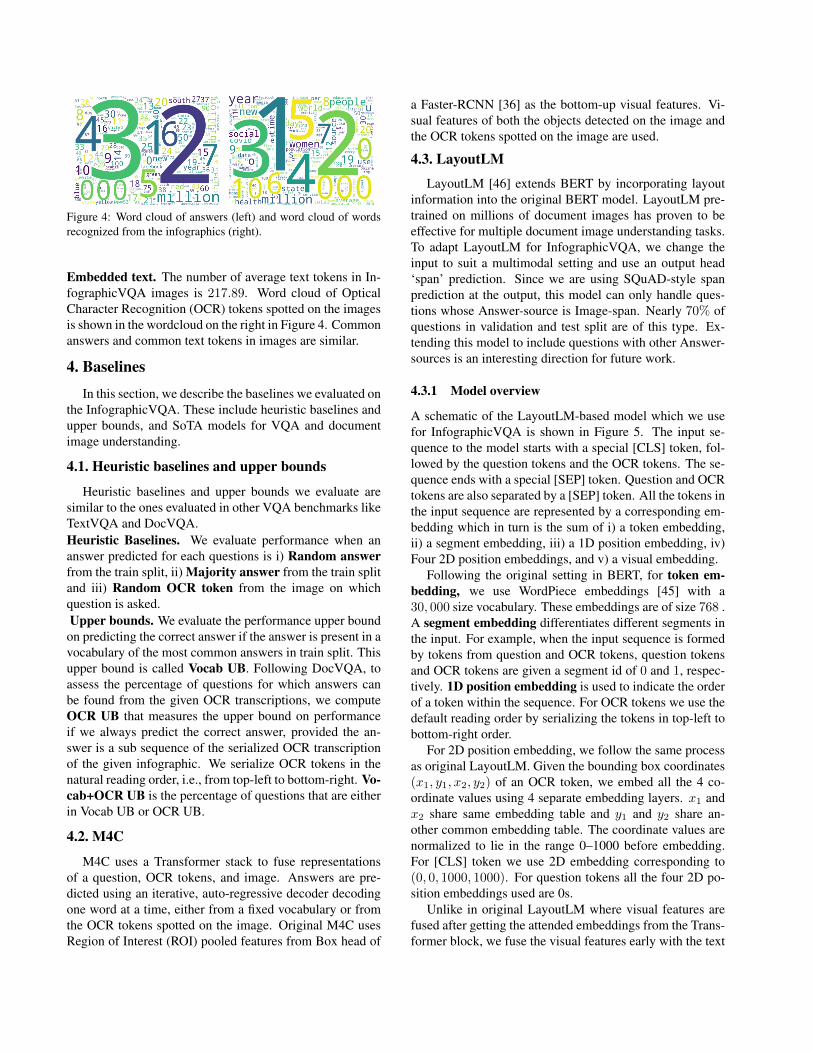
Figure 4: Word cloud of answers (left) and word cloud of wordsrecognized from the infographics (right).
Embedded text. The number of average text tokens in In-fographicVQA images is 217.89. Word cloud of OpticalCharacter Recognition (OCR) tokens spotted on the imagesis shown in the wordcloud on the right in Figure 4. Commonanswers and common text tokens in images are similar.
4. Baselines
In this section, we describe the baselines we evaluated onthe InfographicVQA. These include heuristic baselines andupper bounds, and SoTA models for VQA and documentimage understanding.
4.1. Heuristic baselines and upper bounds
Heuristic baselines and upper bounds we evaluate aresimilar to the ones evaluated in other VQA benchmarks likeTextVQA and DocVQA.Heuristic Baselines. We evaluate performance when ananswer predicted for each questions is i) Random answerfrom the train split, ii) Majority answer from the train splitand iii) Random OCR token from the image on whichquestion is asked.Upper bounds. We evaluate the performance upper boundon predicting the correct answer if the answer is present in avocabulary of the most common answers in train split. Thisupper bound is called Vocab UB. Following DocVQA, toassess the percentage of questions for which answers canbe found from the given OCR transcriptions, we computeOCR UB that measures the upper bound on performanceif we always predict the correct answer, provided the an-swer is a sub sequence of the serialized OCR transcriptionof the given infographic. We serialize OCR tokens in thenatural reading order, i.e., from top-left to bottom-right. Vo-cab+OCR UB is the percentage of questions that are eitherin Vocab UB or OCR UB.
4.2. M4C
M4C uses a Transformer stack to fuse representationsof a question, OCR tokens, and image. Answers are pre-dicted using an iterative, auto-regressive decoder decodingone word at a time, either from a fixed vocabulary or fromthe OCR tokens spotted on the image. Original M4C usesRegion of Interest (ROI) pooled features from Box head of
a Faster-RCNN [36] as the bottom-up visual features. Vi-sual features of both the objects detected on the image andthe OCR tokens spotted on the image are used.
4.3. LayoutLM
LayoutLM [46] extends BERT by incorporating layoutinformation into the original BERT model. LayoutLM pre-trained on millions of document images has proven to beeffective for multiple document image understanding tasks.To adapt LayoutLM for InfographicVQA, we change theinput to suit a multimodal setting and use an output head‘span’ prediction. Since we are using SQuAD-style spanprediction at the output, this model can only handle ques-tions whose Answer-source is Image-span. Nearly 70% ofquestions in validation and test split are of this type. Ex-tending this model to include questions with other Answer-sources is an interesting direction for future work.
4.3.1 Model overview
A schematic of the LayoutLM-based model which we usefor InfographicVQA is shown in Figure 5. The input se-quence to the model starts with a special [CLS] token, fol-lowed by the question tokens and the OCR tokens. The se-quence ends with a special [SEP] token. Question and OCRtokens are also separated by a [SEP] token. All the tokens inthe input sequence are represented by a corresponding em-bedding which in turn is the sum of i) a token embedding,ii) a segment embedding, iii) a 1D position embedding, iv)Four 2D position embeddings, and v) a visual embedding.
Following the original setting in BERT, for token em-bedding, we use WordPiece embeddings [45] with a30, 000 size vocabulary. These embeddings are of size 768 .A segment embedding differentiates different segments inthe input. For example, when the input sequence is formedby tokens from question and OCR tokens, question tokensand OCR tokens are given a segment id of 0 and 1, respec-tively. 1D position embedding is used to indicate the orderof a token within the sequence. For OCR tokens we use thedefault reading order by serializing the tokens in top-left tobottom-right order.
For 2D position embedding, we follow the same processas original LayoutLM. Given the bounding box coordinates(x1, y1, x2, y2) of an OCR token, we embed all the 4 co-ordinate values using 4 separate embedding layers. x1 andx2 share same embedding table and y1 and y2 share an-other common embedding table. The coordinate values arenormalized to lie in the range 0–1000 before embedding.For [CLS] token we use 2D embedding corresponding to(0, 0, 1000, 1000). For question tokens all the four 2D po-sition embeddings used are 0s.
Unlike in original LayoutLM where visual features arefused after getting the attended embeddings from the Trans-former block, we fuse the visual features early with the text

Figure 5: Overview of our LayoutLM based model for predicting answer spans. Textual, visual and layout modalities are embedded andmapped to the same space. Then, they are added and passed as input to a stack of Transformer layers.
input. Similar to M4C, for each OCR token, we use ROIpooled feature from the Box head of a pretrained object de-tection style model. This feature is mapped to the same sizeas other embeddings using a linear projection layer. For[CLS] and other special tokens we add visual feature cor-responding to an ROI covering the entire image, named as“Full Img” in Figure 5.
4.3.2 Training procedure
Similar to the BERT and original LayoutLM, we train themodel in two stages.Pretraining: Following original LayoutLM, we useMasked Visual-Language Model (MVLM) task for pre-training with a masking probability of 0.15. Whenevermasking, we replace each token with the [MASK] token80% of the time, with a random token 10% of the time andkeep it unchanged 10% of the time.Finetuning: For finetuning, similar to BERT QA model forSQuAD benchmark, we use an output head that predictsstart and end token positions of the answer span.
5. Experiments and results
In this section we report the experimental setting and re-sults.
Detector TextVQA DocVQA InfographicVQAAvg. <2 det.(%) Avg. <2 det.(%) Avg. <2 det.(%)
VG 28.8 0.0 4.1 43.9 7.4 23.9DLA 1.0 97.9 4.7 0.0 2.9 43.4
Table 3: Statistics of object detections using two detectors – VGand DLA. DLA is trained for detecting document layout objectsand VG is an object detection model trained on Visual Genome.Avg. shows average number of detections per image. ‘ <2det.(%)’ is the percentage of images on which number of detectedobjects is less than 2.
ANLS Accuracy(%)Baseline val test. val test
Human performance - 0.980 - 95.70Random answer 0.006 0.005 0.00 0.00Random OCR token 0.011 0.014 0.29 0.49Majority answer 0.041 0.035 2.21 1.73Vocab UB - - 53.16 51.34OCR UB - - 53.95 56.96Vocab + OCR UB - - 76.71 77.4
Table 4: Results of heuristics and upper bounds. Heuristics yieldnear zero results. More than 75% of the questions have their an-swer present either in a fixed vocabulary or as an Image-span ofthe OCR tokens serialized in default reading order.
5.1. Experimental setup
Evaluation metrics. For evaluating VQA performance onInfographicVQA, we use Average Normalized LevenshteinSimilarity (ANLS) and Accuracy metrics. The evaluationsetup is same as the evaluation in DocVQA.OCR transcription. Text transcriptions and boundingboxes for text tokens in the images are obtained using Tex-tract OCR [1].Human performance For evaluating human performance,all questions in the test split of the dataset are answeredwith the help of two volunteers (each question answered bya single volunteer).Vocabulary of most common answers. For Vocab UB andheuristics involving a vocabulary, we use a vocabulary of5,000 most common answers in the train split.ROI Features. For our experiments using M4C and Lay-outLM models, visual features of different bounding re-gions from the images are used. To this end, we use twopretrained object detection models — a Faster-RCNN [36]trained on Visual Genome [25] and a Mask-RCNN [17]trained on document images in PubLayNet [50] for Doc-ument Layout Analysis (DLA). We refer to these detectorsas VG and DLA, respectively, in further discussions. The
FasterRCNN model we use is same as the one used forM4C. We use the implementation in MMF framework [37].The DLA detector we use is from a publicly available De-tectron2 [44]-based implementation [18]. Features from thelast or second last Fully Connected (FC) layer are used asvisual features in M4C and LayoutLM model. In VG andDLA, these features are of size 2048 and 1024 respectively.
In Table 3 we summarize the results while using the twodetectors on TextVQA, DocVQA and InfographicVQA.With DLA, we notice that many of its detections, especiallywhen there is only one detection per image is a box coveringthe entire image.Experimental setting for M4C. We use the official imple-mentation of the model [37]. The training parameters andother implementation details are the same as the ones usedin the original paper. As done in original M4C, fixed vocab-ulary used with the model is created from 5, 000 most com-mon words among words from answers in the train split.Experimental setting for LayoutLM. The model is im-plemented in Pytorch [33]. In all our experiments, westart from a pretrained checkpoint of LayoutLM modelmade available by the authors in Hugginface’s Transformersmodel zoo [43, 2]. The newly introduced linear projectionlayer which maps the ROI pooled features to the commonembedding size of 768, is initialized from scratch. The fea-tures are from the last FC layer of the Box head of DLA orVG. To continue pretraining using in-domain data, we usefour samples in one batch and Adam optimizer with a learn-ing rate 2e− 5. For finetuning, we use a batch size of 8 andAdam optimizer with learning rate 1e − 5. For in-domainpretraining and finetuning no additional data other than trainsplit of InfographicVQA is used. To map answers in Info-graphicVQA train split to SQUAD [35]-style spans, we fol-low the same approach used by Mathew et al. for DocVQA.We take the first subsequence match of an answer in theserialized transcription as the corresponding answer span.This way we find approximate spans for 52% of questionsin the train split. Rest of the questions are not used for fine-tuning the model.
5.2. Results
Results of heuristic baselines, upper bounds, and humanperformance are shown in Table 4. Human performanceis comparable to the human performance on DocVQA. Asgiven by the Vocab + OCR UB, more than three quarters ofquestions have their answers present as a span of the OCRtokens serialized in the default reading order or in a vocab-ulary of most common answers in the train split.
We show results using M4C model in Table 5. In contrastto the original setting for which finetuning of visual featuresand features of detected objects are used, a setting that usesno finetuning and only a single visual feature correspondingto ROI covering the entire image, yields the best result.
Visual Finetune Object& # OCR ANLS Accuracy(%)Feature detector Count tokens val test val test
VG ✓ Obj. (100) 50 0.107 0.119 4.81 4.87VG ✓ Obj. (20) 50 0.111 0.122 4.82 4.87VG ✗ Obj. (20) 50 0.125 0.127 4.89 4.89VG ✗ Obj. (20) 300 0.128 0.134 4.90 5.08VG ✗ None 300 0.136 0.143 5.86 6.58VG ✗ Full Img 300 0.142 0.147 5.93 6.64DLA ✗ Obj. (20) 50 0.110 0.130 4.86 5.02DLA ✗ Obj. (20) 300 0.132 0.144 5.95 6.50DLA ✗ None 300 0.140 0.142 5.90 6.39DLA ✗ Full Img 300 0.138 0.140 5.97 6.42
Table 5: Performance of different variants of the M4C model. Theoriginal M4C setting is the one shown in the first row. ‘Fine-tune detector’ denotes the case when features from penultimateFC layer is used and last FC layer is finetuned along with theM4C model. This is the default setting in M4C. In our experi-ments, we get better results without finetuning. ‘Obj. (100)’ is thecase when features from up to 100 objects (bottom-up features) areused. We experiment with 20 objects per image and the results didnot change much. Using no object (‘None’) and feature from onlyone object—a box covering the entire image (‘Full Img’)—yieldbetter results than the case where bottom-up objects are used.
Results of the LayoutLM based model are shown in Ta-ble 6. In-domain pretraining, using text from question, andOCR tokens help the model significantly. This is inline withobservation by Singh et al. that pretraining on data simi-lar to the data for a downstream task is highly beneficial invisio-linguistic pretraining [38]. The model that uses FullImg feature from DLA, added to the CLS performs the beston validation set. On the test set, a model which does notuse any visual feature performs the best.
From Table 6, it is evident that models which use visualfeatures of OCR tokens do not give better results. This im-
Full Img Visual Continue OCR ANLS Accuracy (%)to feature pretrain. visual val test val test
- - ✗ ✗ 0.212 0.225 13.40 15.32- - ✓ ✗ 0.250 0.272 18.14 19.74CLS DLA ✓ ✗ 0.256 0.261 18.56 19.16All DLA ✓ ✗ 0.248 0.266 17.82 18.77Non-OCR DLA ✓ ✓ 0.245 0.263 17.21 18.37CLS VG ✓ ✗ 0.229 0.235 16.47 16.51All VG ✓ ✗ 0.109 0.106 5.43 4.96Non-OCR VG ✓ ✓ 0.042 0.037 1.75 1.28
Table 6: Performance of LayoutLM with different input settings.Row 1 and 2 show LayoutLM’s performance with and without in-domain pretraining. ‘Visual Feature’ column specify the kind ofdetector used for visual feature. ‘OCR visual’ indicate whethervisual features of the OCR tokens are used or not. ‘CLS’, ‘All’and ‘Non-OCR’ in ‘Full Img to’ column represent Full Img fea-ture added only to CLS token, all tokens and all non OCR tokensrespectively.
ANLS
0.00
0.25
0.50
0.75
1.00
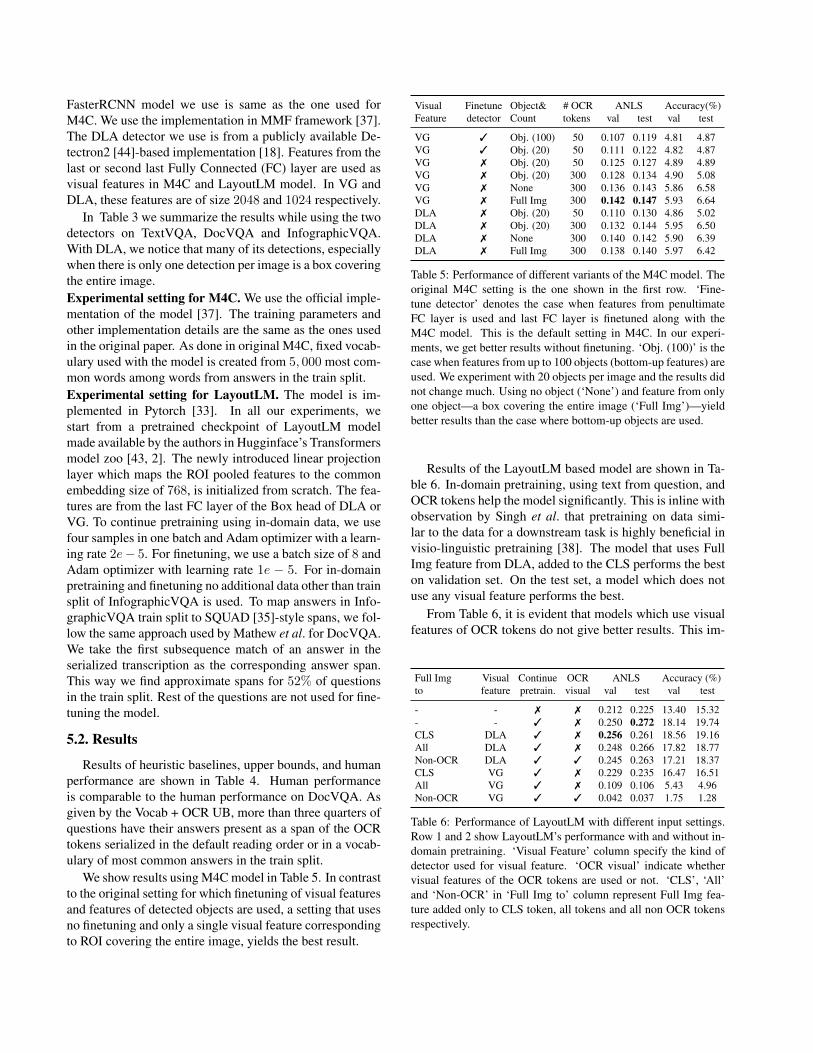
Overall Image-span Question-span Multi-span Non-extractive Text Table/list Figure Map Visual/Layout Counting Sorting Arithmetic
Human Vocab UB OCR UB Vocab + OCR UB LayoutLM M4C
Figure 6: Performance of baselines and upper bounds for different QA types.
What is the interest rates of European Cen-tral Bank and US FED?LayoutLM: 0.25% M4C: 0.1%Human: 0.25% GT: 0.25%
Which is the least populated continent in theworld?LayoutLM: EU M4C: OceaniaHuman: Oceania GT: Oceania
What percentage of workers are not workingfrom home?LayoutLM: 77% M4C: 66%Human: 23% GT: 23%
Figure 7: Qualitative Results For the left most question, evidence is Table/List and the LayoutLM gets it right. In case of the secondquestion where evidence is a Table/List and Sorting is involved, M4C answers correctly. In case of the last question that requires subtractionof 77 from 100 neither M4C, nor LayoutLM gets the answer correct. For better visualization, images we show here are relevant regionscropped from the original infographics. More qualitative examples showing images in original size are given in the supplementary material.
plies that token embeddings of the OCR tokens are goodenough and the additional information from visual featuresof the tokens contribute little to the performance.
Most of the recent models that employ visio-linguisticpretraining of BERT-like architectures [27, 40] incorporatebottom-up visual features—features of objects detected onthe images—into the model as visual tokens. We follow theapproach in VisualBERT [27], where visual tokens are con-catenated after the input stream of text tokens. Each visualtoken is represented by a dummy text token [OBJ], a sep-arate segment, 1D and 2D positions and the ROI pooledvisual feature of the object’s region. But in our experi-ments, the addition of visual tokens did not give us resultsany better than the model without visual tokens. Hence wedo not show this setting in illustration of our model archi-tecture or in the results table. We believe the visual tokenswe use impart little information since the object detectorswe use— a detector trained for detecting objects on naturalscene images and another for document layout analysis—are not suitable for infographics. This is evident from Ta-ble 3. Both the detectors detect only a few instances of ob-
jects on infographics.In Figure 6, the performance of our trained baselines on
the test split is compared against the upper bounds and hu-man performance. The M4C and LayoutLM models usedfor this comparison are the variants that give best ANLSon the test data. Finally a few qualitative results from ourexperiments are shown in Figure 7.
6. Conclusion
We introduce the InfographicVQA dataset and the taskof VQA on infographics. Results using the baseline modelssuggest that existing models designed for multimodal QAor VQA perform poorly on the new dataset. We believeour work will inspire research towards understanding im-ages with a complex interplay of layout, graphical elementsand embedded text.
AcknowledgementsThis work is supported by MeitY, Government of In-
dia, the CERCA Programme / Generalitat de Catalunya andproject PID2020-116298GB-I0.

References[1] Amazon Textract. https://aws.amazon.com/
textract/. Accessed: 2021-08-16.[2] Huggingface’s Models. https://huggingface.co/
models. Accessed: 2021-08-16.[3] stacked attention networks for image question answering.[4] Peter Anderson, Xiaodong He, Chris Buehler, Damien
Teney, Mark Johnson, Stephen Gould, and Lei Zhang.Bottom-Up and Top-Down Attention for Image Captioningand Visual Question Answering, 2017.
[5] Peter Anderson, Xiaodong He, Chris Buehler, DamienTeney, Mark Johnson, Stephen Gould, and Lei Zhang.Bottom-up and top-down attention for image captioning andvisual question answering. In CVPR, 2018.
[6] Srikar Appalaraju, Bhavan Jasani, Bhargava Urala Kota,Yusheng Xie, and R. Manmatha. Docformer: End-to-endtransformer for document understanding, 2021.
[7] Ali Furkan Biten, Ruben Tito, Andres Mafla, Lluis Gomez,Marcal Rusinol, Ernest Valveny, C.V. Jawahar, and Dimos-thenis Karatzas. Scene Text Visual Question Answering. InICCV, 2019.
[8] M. A. Borkin, A. A. Vo, Z. Bylinskii, P. Isola, S. Sunkavalli,A. Oliva, and H. Pfister. What Makes a Visualization Mem-orable? IEEE Transactions on Visualization and ComputerGraphics, 19(12):2306–2315, 2013.
[9] Z. Bylinskii, Sami Alsheikh, Spandan Madan, A. Recasens,Kimberli Zhong, H. Pfister, F. Durand, and A. Oliva. Under-standing infographics through textual and visual tag predic-tion. ArXiv, abs/1709.09215, 2017.
[10] R. Chaudhry, S. Shekhar, U. Gupta, P. Maneriker, P. Bansal,and A. Joshi. Leaf-qa: Locate, encode attend for figure ques-tion answering. In WACV, 2020.
[11] Yen-Chun Chen, Linjie Li, Licheng Yu, Ahmed El Kholy,Faisal Ahmed, Zhe Gan, Yu Cheng, and Jingjing Liu.UNITER: learning universal image-text representations.CoRR, abs/1909.11740, 2019.
[12] Jacob Devlin, Ming-Wei Chang, Kenton Lee, and KristinaToutanova. BERT: Pre-training of Deep Bidirectional Trans-formers for Language Understanding. In ACL, 2019.
[13] Dheeru Dua, Yizhong Wang, Pradeep Dasigi, GabrielStanovsky, Sameer Singh, and Matt Gardner. DROP:A Reading Comprehension Benchmark Requiring DiscreteReasoning Over Paragraphs. In NAACL-HLT, 2019.
[14] Łukasz Garncarek, Rafał Powalski, Tomasz Stanisławek,Bartosz Topolski, Piotr Halama, and Filip Gralinski. Lam-bert: Layout-aware language modeling using bert for infor-mation extraction. arXiv preprint arXiv:2002.08087, 2020.
[15] Y. Goyal, T. Khot, D. Summers-Stay, D. Batra, and D.Parikh. Making the V in VQA Matter: Elevating the Roleof Image Understanding in Visual Question Answering. InCVPR, 2017.
[16] Danna Gurari, Qing Li, Abigale J Stangl, Anhong Guo, ChiLin, Kristen Grauman, Jiebo Luo, and Jeffrey P Bigham.Vizwiz grand challenge: Answering visual questions fromblind people. In CVPR, 2018.
[17] Kaiming He, Georgia Gkioxari, Piotr Dollar, and Ross Gir-shick. Mask r-cnn. In CVPR, 2017.
[18] Himanshu. Detectron2 for document layout analysis.https://github.com/hpanwar08/detectron2.git, 2020.
[19] Ronghang Hu, Amanpreet Singh, Trevor Darrell, and Mar-cus Rohrbach. Iterative answer prediction with pointer-augmented multimodal transformers for textvqa. In CVPR,2020.
[20] Drew A. Hudson and Christopher D. Manning. GQA: anew dataset for compositional question answering over real-world images. CoRR, abs/1902.09506, 2019.
[21] Kushal Kafle, Brian Price, Scott Cohen, and ChristopherKanan. DVQA: Understanding Data Visualizations viaQuestion Answering. In CVPR, 2018.
[22] Samira Ebrahimi Kahou, Vincent Michalski, Adam Atkin-son, Akos Kadar, Adam Trischler, and Yoshua Bengio. Fig-ureqa: An annotated figure dataset for visual reasoning.arXiv preprint arXiv:1710.07300, 2017.
[23] Vahid Kazemi and Ali Elqursh. Show, ask, attend, and an-swer: A strong baseline for visual question answering. arXivpreprint arXiv:1704.03162, 2017.
[24] Aniruddha Kembhavi, Minjoon Seo, Dustin Schwenk,Jonghyun Choi, Ali Farhadi, and Hannaneh Hajishirzi. AreYou Smarter Than A Sixth Grader? Textbook Question An-swering for Multimodal Machine Comprehension. In CVPR,2017.
[25] Ranjay Krishna, Yuke Zhu, Oliver Groth, Justin Johnson,Kenji Hata, Joshua Kravitz, Stephanie Chen, Yannis Kalan-tidis, Li-Jia Li, David A. Shamma, Michael S. Bernstein, andLi Fei-Fei. Visual Genome: Connecting Language and Vi-sion Using Crowdsourced Dense Image Annotations. Int. J.Comput. Vision, 2017.
[26] Nathan Landman. Towards abstractive captioning of info-graphics. Master’s thesis, Massachusetts Institute of Tech-nology, Massachusetts Institute of Technology, 2018.
[27] Liunian Harold Li, Mark Yatskar, Da Yin, C. Hsieh, and Kai-Wei Chang. VisualBERT: A Simple and Performant Baselinefor Vision and Language. ArXiv, abs/1908.03557, 2019.
[28] Yulin Li, Yuxi Qian, Yuchen Yu, Xiameng Qin, ChengquanZhang, Yan Liu, Kun Yao, Junyu Han, Jingtuo Liu, and ErruiDing. Structext: Structured text understanding with multi-modal transformers, 2021.
[29] Min Lu, Chufeng Wang, Joel Lanir, Nanxuan Zhao,Hanspeter Pfister, Daniel Cohen-Or, and Hui Huang. Ex-ploring Visual Information Flows in Infographics. In ACMCHI, 2020.
[30] Spandan Madan, Zoya Bylinskii, Matthew Tancik, Adria Re-casens, Kimberli Zhong, Sami Alsheikh, Hanspeter Pfister,Aude Oliva, and Fredo Durand. Synthetically trained iconproposals for parsing and summarizing infographics. arXivpreprint arXiv:1807.10441, 2018.
[31] Minesh Mathew, Dimosthenis Karatzas, and C. V. Jawahar.DocVQA: A Dataset for VQA on Document Images. InWACV, 2020.
[32] Anand Mishra, Shashank Shekhar, Ajeet Kumar Singh, andAnirban Chakraborty. OCR-VQA: Visual question answer-ing by reading text in images. In ICDAR, 2019.

[33] Adam Paszke, Sam Gross, Francisco Massa, Adam Lerer,James Bradbury, Gregory Chanan, Trevor Killeen, ZemingLin, Natalia Gimelshein, Luca Antiga, Alban Desmaison,Andreas Kopf, Edward Yang, Zachary DeVito, Martin Rai-son, Alykhan Tejani, Sasank Chilamkurthy, Benoit Steiner,Lu Fang, Junjie Bai, and Soumith Chintala. Pytorch: Animperative style, high-performance deep learning library. InNeurIPS. 2019.
[34] Rafał Powalski, Łukasz Borchmann, Dawid Jurkiewicz,Tomasz Dwojak, Michał Pietruszka, and Gabriela Pałka. Go-ing full-tilt boogie on document understanding with text-image-layout transformer. arXiv preprint arXiv:2102.09550,2021.
[35] Pranav Rajpurkar, Jian Zhang, Konstantin Lopyrev, andPercy Liang. SQuAD: 100,000+ Questions for MachineComprehension of Text. In Proceedings of the 2016 Confer-ence on Empirical Methods in Natural Language Processing,pages 2383–2392, 2016.
[36] Shaoqing Ren, Kaiming He, Ross Girshick, and Jian Sun.Faster R-CNN: Towards Real-Time Object Detection withRegion Proposal Networks. In NeurIPS. 2015.
[37] Amanpreet Singh, Vedanuj Goswami, Vivek Natarajan, YuJiang, Xinlei Chen, Meet Shah, Marcus Rohrbach, DhruvBatra, and Devi Parikh. MMF: A multimodal framework forvision and language research. https://github.com/facebookresearch/mmf, 2020.
[38] Amanpreet Singh, Vedanuj Goswami, and D. Parikh. Arewe pretraining it right? Digging deeper into visio-linguisticpretraining. ArXiv, abs/2004.08744, 2020.
[39] Amanpreet Singh, Vivek Natarjan, Meet Shah, Yu Jiang,Xinlei Chen, Devi Parikh, and Marcus Rohrbach. TowardsVQA Models That Can Read. In CVPR, 2019.
[40] Weijie Su, X. Zhu, Y. Cao, B. Li, Lewei Lu, Furu Wei, andJifeng Dai. Vl-bert: Pre-training of generic visual-linguisticrepresentations. ArXiv, abs/1908.08530, 2020.
[41] Ryota Tanaka, Kyosuke Nishida, and Sen Yoshida. Vi-sualmrc: Machine reading comprehension on document im-ages. arXiv preprint arXiv:2101.11272, 2021.
[42] Ashish Vaswani, Noam Shazeer, Niki Parmar, Jakob Uszko-reit, Llion Jones, Aidan N Gomez, Ł ukasz Kaiser, and IlliaPolosukhin. Attention is All you Need. In NeurIPS. 2017.
[43] Thomas Wolf, Lysandre Debut, Victor Sanh, Julien Chau-mond, Clement Delangue, Anthony Moi, Pierric Cistac, TimRault, Remi Louf, Morgan Funtowicz, Joe Davison, SamShleifer, Patrick von Platen, Clara Ma, Yacine Jernite, JulienPlu, Canwen Xu, Teven Le Scao, Sylvain Gugger, MariamaDrame, Quentin Lhoest, and Alexander M. Rush. Hugging-face’s transformers: State-of-the-art natural language pro-cessing, 2020.
[44] Yuxin Wu, Alexander Kirillov, Francisco Massa, Wan-YenLo, and Ross Girshick. Detectron2. https://github.com/facebookresearch/detectron2, 2019.
[45] Y. Wu, M. Schuster, Z. Chen, Quoc V. Le, MohammadNorouzi, Wolfgang Macherey, M. Krikun, Yuan Cao, Q.Gao, Klaus Macherey, Jeff Klingner, Apurva Shah, M. John-son, X. Liu, L. Kaiser, S. Gouws, Y. Kato, Taku Kudo, H.Kazawa, K. Stevens, G. Kurian, Nishant Patil, W. Wang, C.
Young, J. Smith, Jason Riesa, Alex Rudnick, Oriol Vinyals,G. S. Corrado, Macduff Hughes, and J. Dean. Google’s neu-ral machine translation system: Bridging the gap betweenhuman and machine translation. ArXiv, abs/1609.08144,2016.
[46] Yiheng Xu, Minghao Li, Lei Cui, Shaohan Huang, Furu Wei,and Ming Zhou. LayoutLM: Pre-training of Text and Lay-out for Document Image Understanding. ACM SIGKDD, Jul2020.
[47] Yang Xu, Yiheng Xu, Tengchao Lv, Lei Cui, Furu Wei,Guoxin Wang, Yijuan Lu, Dinei Florencio, Cha Zhang,Wanxiang Che, et al. Layoutlmv2: Multi-modal pre-trainingfor visually-rich document understanding. arXiv preprintarXiv:2012.14740, 2020.
[48] Semih Yagcioglu, Aykut Erdem, Erkut Erdem, and NazliIkizler-Cinbis. RecipeQA: A Challenge Dataset for Mul-timodal Comprehension of Cooking Recipes. In EMNLP,2018.
[49] Zhengyuan Yang, Yijuan Lu, Jianfeng Wang, Xi Yin, DineiFlorencio, Lijuan Wang, Cha Zhang, Lei Zhang, and JieboLuo. TAP: Text-Aware Pre-training for Text-VQA and Text-Caption, 2020.
[50] Xu Zhong, Jianbin Tang, and Antonio Jimeno Yepes. Pub-LayNet: largest dataset ever for document layout analysis. InICDAR, 2019.


