Jitter-Camera: High Resolution Video from a Low Resolution ...


Acknowledgements
Concept and outline: Stefanos Fotiou
Authors: Stefanos Fotiou, Janet Salem, Peerayot Sidonrusmee
Contributors/Reviewers: Emily Briggs, Heinz Schandl, Jim West, Kaveh Zahedi, William Wyn Ellis, Donna Mei-Ling Park, Karin Hosking
Design and Layout: Peerayot Sidonrusmee
Cover photo: Mina Arampatzi
All data used in this report can be accessed at UNEP Live (http://uneplive.unep.org).
This publication is based on the following full report:UNEP (2015), Indicators for a Resource Efficient and Green Asia and the Pacific - Measuring progress of sustainable consumption and production, green economy and resource efficiency policies in the Asia-Pacific region, Schandl, H., West, J., Baynes, T., Hosking, K., Reinhardt, W., Geschke, A., Lenzen, M. United Nations Environment Programme, Bangkok.
This publication should be referenced as follows:UNEP (2015), Resource use in the Asia-Pacific - A booklet of infographics, United Nations Environment Programme, Bangkok.
Advance copy for the:
Copyright © United Nations Environment Programme, 2015
This publication may be reproduced in whole or in part and in any form for educational or non-profit purposes without special permission from the copyright holder, provided acknowledgement of the source is made. UNEP would appreciate receiving a copy of any publication that uses this publication as a source.
No use of this publication may be made for resale or for any other commercial purpose whatsoever without prior permission in writing from the United Nations Environment Programme.
DisclaimerThe designations employed and the presentation of the material in this publication do not imply the expression of any opinion whatsoever on the part of the United Nations Environment Programme concerning the legal status of any country, territory, city or area or of its authorities, or concerning delimitation of its frontiers or boundaries. Moreover, the views expressed do not necessarily represent the decisionor the stated policy of the United Nations Environment Programme, nor does citing of trade names or commercial processes constitute endorsement.
UNEP promotes environ-
mentally sound practices globally and in its own activities.
This publication is printed on 100% eco-�bers paper, using vegetable
-based inks and other eco-friendly practices. Our distribution policy aims
to reduce UNEP’s carbon footprint.
1st FORUM OF
MINISTERS & ENVIRONMENTAUTHORITIES OF ASIA PACIFIC19 - 20 May 2015, Bangkok
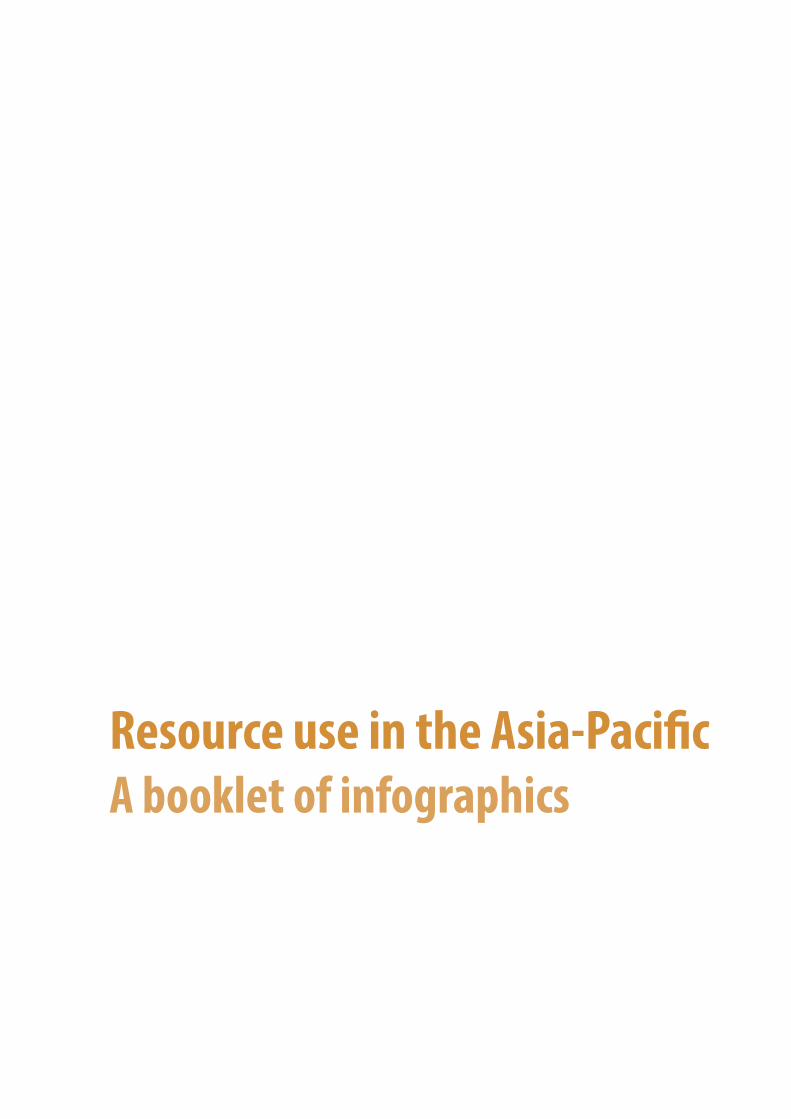
Resource use in the Asia-Pacific A booklet of infographics

IntroductionUnderstanding how efficiently we use natural resources is a vital step for designing policies to tackle inefficiencies. This booklet of infographics - based on the UNEP report “Indicators for a Resource Efficient and Green Asia and the Pacific” - reveals the patterns and the evolution of natural resource use in Asia-Pacific over the past 40 years. The findings of the report that are captured here provide a number of messages for decision makers including the following.
• The Asia-Pacific region consumes more than half of the world’s materials with increasing rates of growth and increasing material use per person. The use of materials in the Asia-Pacific region increased from 5.7 to 37 billion tonnes per year between 1970 and 2010. Global material consumption is 70 billion tonnes per year, so the Asia-Pacific region uses approximately 53%.
• There is great potential to improve the efficiency of materials use in Asia-Pacific. On average, Asia-Pacific needs 3 kilograms of materials to produce one dollar of GDP and this lags far behind the rest of the world, for which on average only 1 kilogram is needed per dollar of GDP.
• Looking at the Asia-Pacific region as a whole, the majority of materials used are not for exports but for consumption within the region. For a region known as the “manufacturing hub of the world”, the Asia-Pacific region is an exporter only in financial terms; in physical terms it is a net importer of materials.
• Energy consumption has increased more than fourfold in developing countries in the Asia-Pacific region and is dominated by non-renewable energy sources. In the developing countries group of the region, coal and petroleum represent three quarters of energy consumption, while in the industrialized countries coal and petroleum accounted for two thirds of overall consumption.
• Water use per person is decreasing and water efficiency is improving, driven by the agricultural sector and irrigation. During the past four decades, the region’s share of the global water consumption increased only slightly, from 51% in 1970 to 55% in 2010, with the developing countries group accounting for over 51% of use and the industrialized countries group responsible for less than 4%.
• Greenhouse Gas (GHG) emissions have increased fourfold, but emissions per dollar have reduced by three quarters in developing countries. Despite a fourfold increase in emissions in the region, there has been a dramatic reduction of carbon intensity in developing countries. In 1970, carbon intensity was almost 10 kg CO2-eq per dollar, whereas in 2010, it fell to below 3 kg CO2-eq per dollar.
The booklet presents these and additional findings in a graphical format, allowing readers to understand better the trends of resource use and resource efficiency in the region. Some of the main messages from the infographics are also highlighted on each page. The infographics and the report on which they were based are part of UNEP’s aim to communicate the latest science for policymakers to inspire and support action. We hope that the materials presented here help to convey the messages on resource use and efficiency in Asia-Pacific to the broadest possible audience and inspire us all into action. ©
Am
an, H
alim

The role of resources and emissions in our world
All societies depend on natural resources for human development through the provision of food, feed, fuel and �bre for people. Natural resources also serve as inputs to economic activities.
Some resources are renewable, like water. To remain as such they need to be managed sustainably. Others are non renewable, such as metal ores and fossil fuels.
For non-renewable resources it can be di�cult to know the quantity of reserves that we have left, yet we still extract the
Indicators are needed to keep track of our resource use. If we know how much we are using, how e�ciently we are using it, and what we use it for, we can make better decisions about the use of resources.
The most important objectives are to ensure that natural resources remain available and a�ordable, while keeping emissions to the environment within safe limits.
Atmosphere
Hydrosphere - Oceans, Rivers, Groundwater, Lakes
Earth's crust - Soils, Geological Sources, Land
Water use
Material use
Energy use
Air emissions
Water emissions
Atmosphere
ConsumptionEnd of life:
Waste, Recycling
Extraction: Agriculture,
Mining
Tertiary sector: Services, Transport
Hydrosphere - oceans, rivers, groundwater, lakes
Earth's crust - soils, geological sources, land
1 2 Over the whole life cycle, the use of resources creates environmental impacts. Extraction, production, consumption, transport and waste processes all lead to emissions, pollution and waste that impacts the air, water and environment which we depend on.
3
4
Money
Jobs
Population
Qualityof life
Production: Manufacturing,
Construction
Waste
We use resources over the entire life cycle from extraction (mining and agriculture) to production, consumption and �nally to the end of life, where they are either recycled or disposed.
Through each of these stages, society converts the natural resources into something that addresses our needs and wants - food, buildings, mobiliy - and generates other kinds of value, such as employment, money and well being.
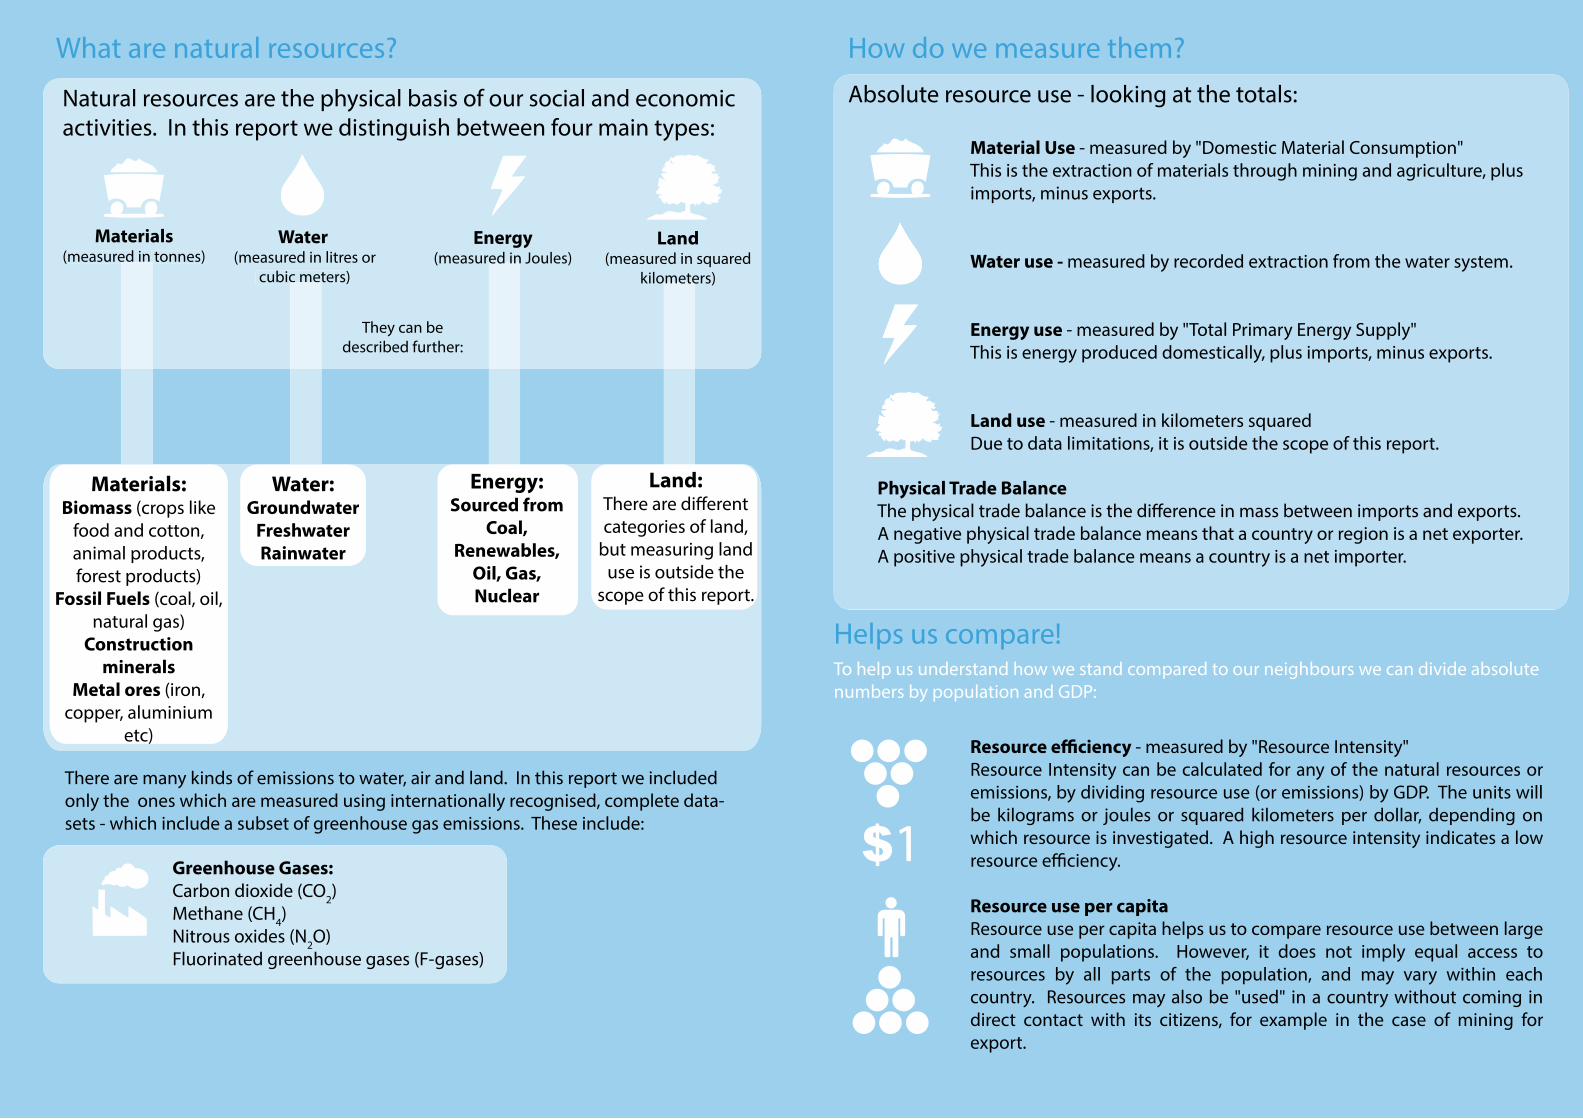
What are natural resources?
There are many kinds of emissions to water, air and land. In this report we included only the ones which are measured using internationally recognised, complete data-sets - which include a subset of greenhouse gas emissions. These include:
Natural resources are the physical basis of our social and economic activities. In this report we distinguish between four main types:
They can be described further:
How do we measure them? Absolute resource use - looking at the totals:
Helps us compare!To help us understand how we stand compared to our neighbours we can divide absolute numbers by population and GDP:
Material Use - measured by "Domestic Material Consumption" This is the extraction of materials through mining and agriculture, plus imports, minus exports.
Water use - measured by recorded extraction from the water system.
Energy use - measured by "Total Primary Energy Supply"This is energy produced domestically, plus imports, minus exports.
Land use - measured in kilometers squaredDue to data limitations, it is outside the scope of this report.
Materials (measured in tonnes)
Materials:Biomass (crops like
food and cotton, animal products, forest products)
Fossil Fuels (coal, oil, natural gas)
Construction minerals
Metal ores (iron, copper, aluminium
etc)
Water:Groundwater
FreshwaterRainwater
Energy:Sourced from
Coal, Renewables,
Oil, Gas, Nuclear
Greenhouse Gases:Carbon dioxide (CO2)Methane (CH4)Nitrous oxides (N2O)Fluorinated greenhouse gases (F-gases)
Water (measured in litres or
cubic meters)
Energy (measured in Joules)
Land (measured in squared
kilometers)
Land: There are di�erent categories of land,
but measuring land use is outside the
scope of this report.
(measured in tonnes) cubic meters)
Physical Trade Balance The physical trade balance is the di�erence in mass between imports and exports. A negative physical trade balance means that a country or region is a net exporter. A positive physical trade balance means a country is a net importer.
Resource e�ciency - measured by "Resource Intensity" Resource Intensity can be calculated for any of the natural resources or emissions, by dividing resource use (or emissions) by GDP. The units will be kilograms or joules or squared kilometers per dollar, depending on which resource is investigated. A high resource intensity indicates a low resource e�ciency.
Resource use per capita Resource use per capita helps us to compare resource use between large and small populations. However, it does not imply equal access to resources by all parts of the population, and may vary within each country. Resources may also be "used" in a country without coming in direct contact with its citizens, for example in the case of mining for export.
1

A snapshot of material use in the Asia-Paci�c region
Material useUnit: million tonnes
Asia-Paci�c The rest of the world
53 % 47 %36,940 million tonnes 32,991 million tonnes
China India
Indonesia
Viet Nam
Thailand
Australia
Philippines
Others
Japan
South Korea
Industrialized countryDeveloping country
Malaysia
Pakistan
Others
23,591 5,022
1,619 1,189
994 749
980
729
661
The rest of the world
32,991The rest of the world
Viet Nam1
Material use per dollar
How many kilograms of materials per dollar of GDP?
519
358
391 271
How much does the Asia-Paci�c use compared to
the rest of the world?
3,831 million people 3,070 million people
Year 2010
56 % 44 %
13 trillion dollars 38 trillion dollars25 % 75 %
What about material use per capita?
India Fiji Japan
1
China1
1 1 1
$$
9 Kg 6 Kg
4 Kg 2 Kg 0.3 Kg
The wide range of e�ciencies indicates
a huge potential for improvement!
India
China
Material use per capita (tonnes per person)
Indonesia
Australia
Japan
Fact fact factWhy does the Asia-Paci�c region
Fact fact factWhy does the Asia-Paci�c region
Fact fact factconsume more materials than Fact fact factconsume more materials than Fact fact factthe rest of the world? To start with, the region hosts more than half the world’s population.But there are other reasons, such as the diverse range of e�ciencies of the economies in Asia-Paci�c, as well as major di�erences in per capita consumption of materials.
Bangladesh
Papua New Guinea Developing
Asia-Paci�c
Industrialised Asia-Paci�c
Asia- Paci�c
1.7
4.2 6.7 8.0
9.3 9.3 9.6
15.3 17.0
43.7

Resource use per person over time
Industrialized countriesDeveloping countries
Kilolitres per person
Tonnes per person
Gigajoules per person
Industrialized countriesDeveloping countries
Industrialized countriesDeveloping countries
1970 2010
1970 2010
1970 2010
Developing countries in the Asia-Paci�c still consume fewer resources per person than the industrialized countries. However they are catching up fast. In 1970, on average a person in a developing country consumed only 24% as much materials as the average person in industrialized countries. In 2010, the proportion increased to 61%.
Water use per person
Material use per person
Energy use per person
Energy availability is still a challenge in developing Asia-Paci�c!
729 897 544 689
2
10 9 15
15
9347
184
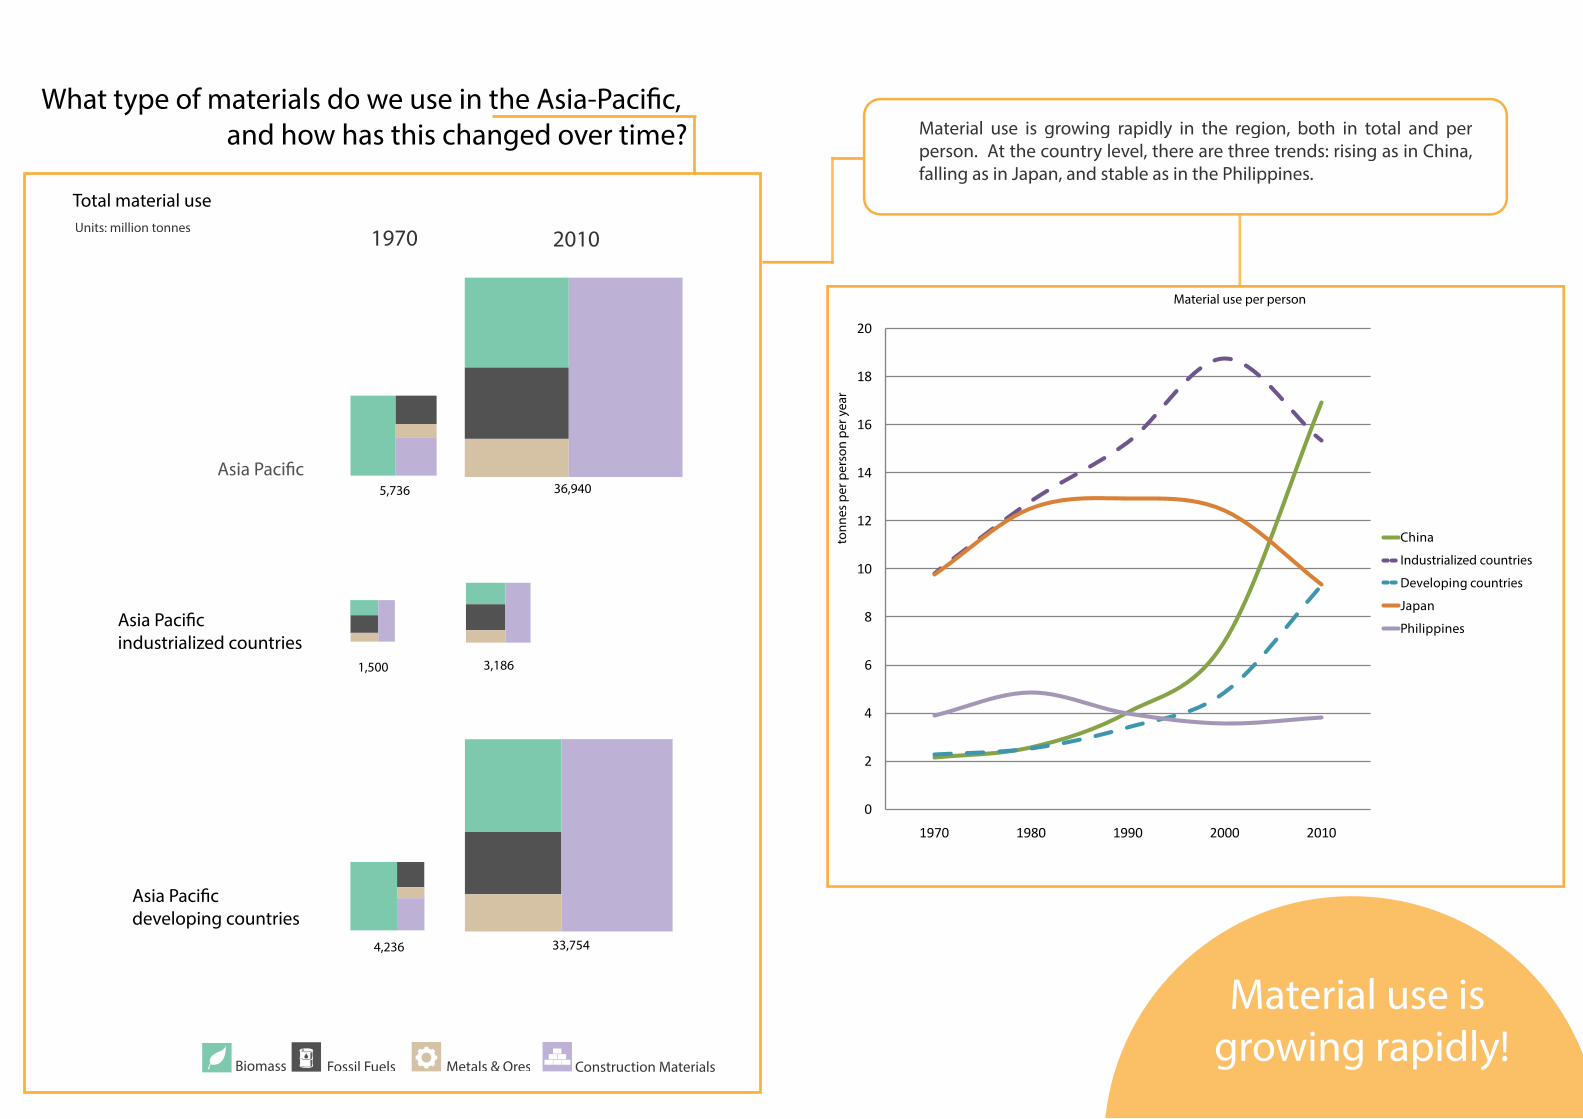
What type of materials do we use in the Asia-Paci�c, and how has this changed over time?
Total material use
Asia Paci�c
1970 2010
Metals & OresFossil FuelsBiomass Construction Materials
Asia Paci�c developing countries
Asia Paci�c industrialized countries
0
2
4
6
8
10
12
14
16
18
20
1970 1980 1990 2000 2010
China
Industrialized countries
Developing countries
Japan
Philippines
Material use is growing rapidly!
Material use is growing rapidly in the region, both in total and per person. At the country level, there are three trends: rising as in China, falling as in Japan, and stable as in the Philippines.
Material use per person
tonn
es p
er p
erso
n pe
r yea
r
5,736 36,940
1,500 3,186
4,236 33,754
Units: million tonnes

Asia-Paci�c
Asia-Paci�cdeveloping
countries
Asia-Paci�cindustrialized
countries
SouthAsia
SouthEast Asia
Total energy use
50,000
100,000
150,000
200,000
Unit: Petajoules
Asia-Paci�c
Asia-Paci�c developing countries
Asia-Paci�c industrialized countriesSouth AsiaSouth East Asia
Unit: Petajoules
Year
0
250,000
Gigajoules per person
54184
47 22 39
Energy use per person
0
50,000
100,000
150,000
200,000
250,000
Asia-Paci�c developing countries
Unit: Petajoules
CoalHydro Natural gas Nuclear PetroleumRenewables
20101970 1980 1990 2000
Year 2010
Energy use and energy sources in the Asia-Pacific region
Since the late 1990’s energy consumption has increased much faster than before in the Asia-Paci�c developing countries. Coal and Oil are three quarters of energy consumption in Asia-Paci�c developing countries.
447
6,774
4,766
15,130
1,142
10,045
89,054
3,482
12,815
1,130
33,659
25,230
Asia-Paci�c industrialized
countries
Asia-Paci�c developing
countries

Material use in different types of economies
Australia extracts almost double what it
actually usesdomestically
Japan's imports make up two-thirds of its material use.
AustraliaImport Export
Material use is calculated by adding the mass of domestic extraction and imports and subtracting the mass of exports.
JapanImport ExportDomestic Extraction
1,728
Material use = 980
567
Material use = 1,189
Domestic Extraction
} }Units: million tonnes Units: million tonnes
829
81
779
157
Metals & OresFossil FuelsBiomass
Construction Materials
+ _ + _

Explaining the footprint
Exportfootprint
Materialextraction
Importfootprint
Materialuse
MaterialFootprint
India1,456
4,290
8695,017
4,880
Japan156 2,560 2,152
1,162
566
Australia1,117
837
226
979
1,727
Data on the Extraction, Imports and Exports of a country (i.e. the material use of a country) are not enough to represent the overall impact of an economy upon the environment.
While material use re�ects the production of goods and services, “material footprint” is based on consumption patterns. The material footprint indicates the amount of resources or emissions that can be attributed to �nal demand (consumption and capital investment) in a country. It shows the responsibility of a country’s consumption along the supply chain of resources and emissions which may occur anywhere in the world to satisfy �nal demand of that country. The footprint approach corrects the direct indicators for the upstream requirements of trade.
To calculate the material footprint we use data on the footprint of imports and exports.
On the opposite page, three typical country pro�les are shown.
Australian exports have a large footprint, equal to 64% of its extraction. Hence, the material footprint is smaller than direct material use. Japan has a very large import footprint. It is 4 times bigger than what is extracted in Japan. Hence the material footprint is far larger than direct material use.
In India, import and export footprints are quite small compared to extraction. The footprint is close in value to material use.
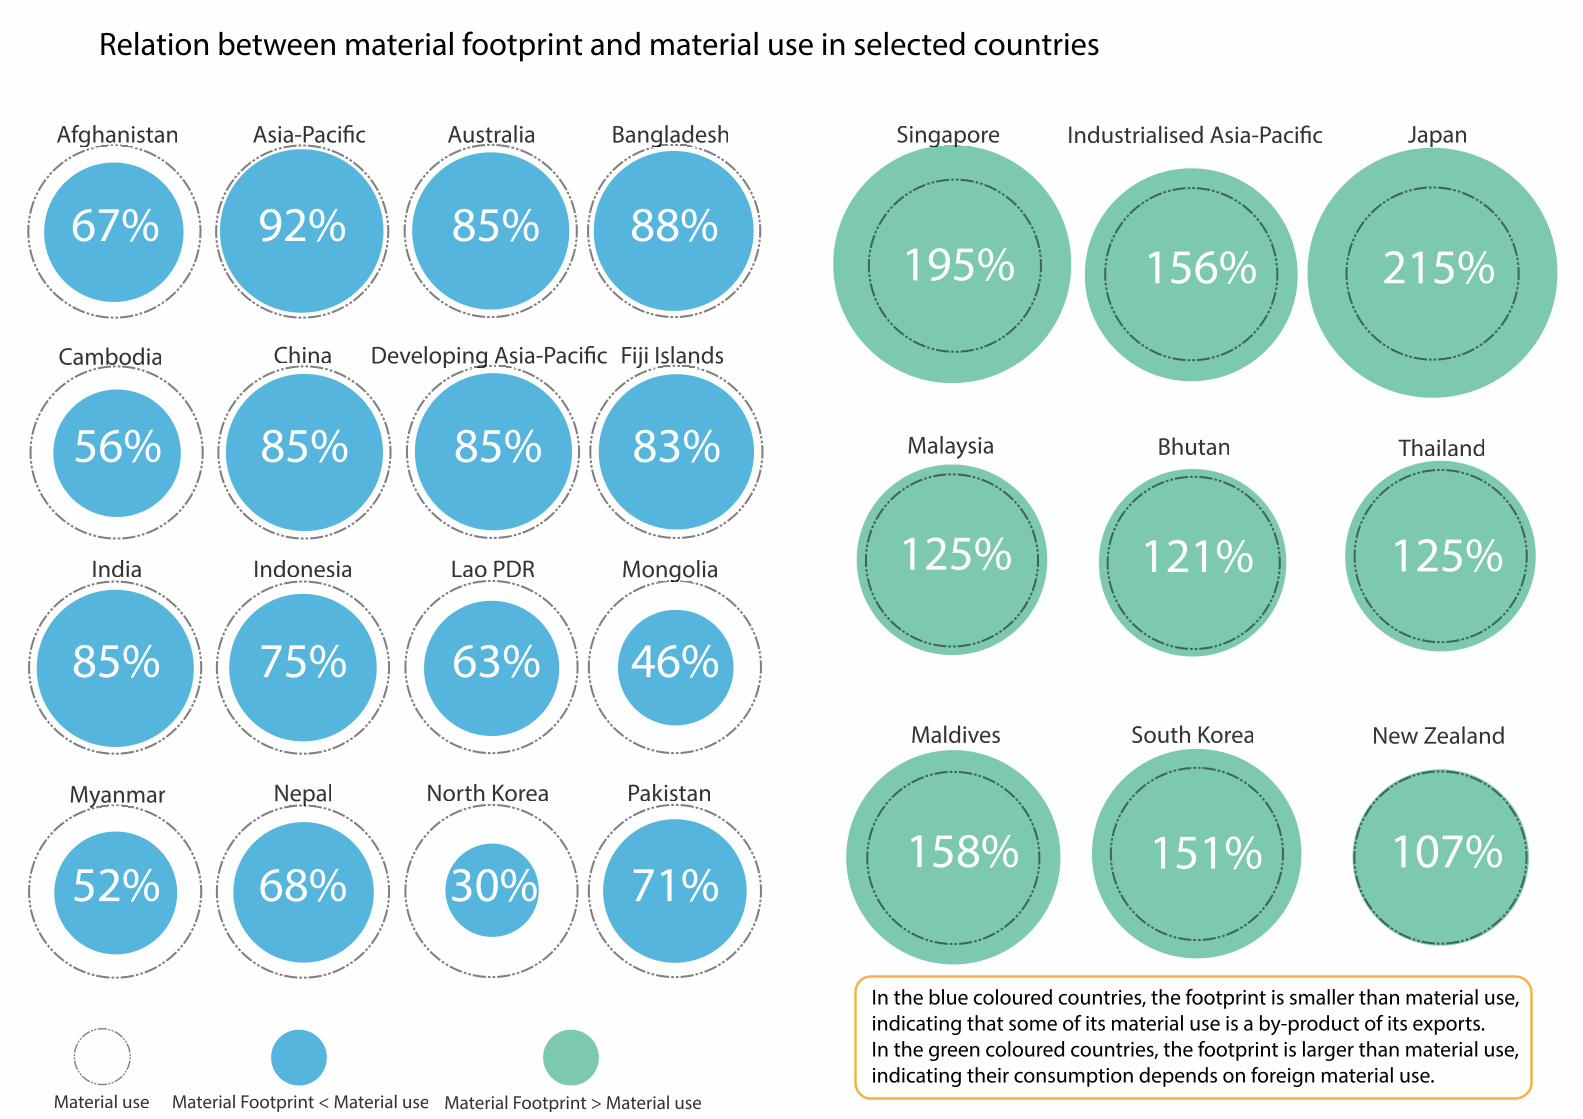
Relation between material footprint and material use in selected countries
Afghanistan Asia-Paci�c Australia
Bhutan
Industrialised Asia-Paci�c Japan
Material Footprint > Material use
Bangladesh
Material Footprint < Material useMaterial use
AfghanistanAfghanistanAfghanistanAfghanistanAfghanistanAfghanistan BangladeshBangladeshBangladeshBangladeshBangladeshBangladesh
Cambodia China Developing Asia-Paci�c Fiji IslandsDeveloping Asia-Paci�cDeveloping Asia-Paci�cDeveloping Asia-Paci�cDeveloping Asia-Paci�cDeveloping Asia-Paci�cDeveloping Asia-Paci�c Fiji IslandsFiji IslandsFiji IslandsFiji IslandsFiji IslandsFiji Islands
India Indonesia Lao PDR MongoliaMongoliaMongoliaMongoliaMongolia
Myanmar Nepal North Korea PakistanMyanmarMyanmarMyanmarMyanmarMyanmarMyanmar NepalNepalNepalNepal
Malaysia
Maldives New Zealand
SingaporeSingapore
South Korea
Thailand
67% 85%92% 88%
121%
156% 215%
56% 85%85% 83%
85% 63%75% 46%
52% 30%68% 71%
125%
158% 107%
195%
151%
125%
In the blue coloured countries, the footprint is smaller than material use, indicating that some of its material use is a by-product of its exports.In the green coloured countries, the footprint is larger than material use, indicating their consumption depends on foreign material use.

Physical vs economic trade balances in groups of countries
Some countries are exporters economically, but importers in physical terms.
Million Tonnes
Billion $
Net exporterNet importer
Million Tonnes
Billion $
Net exporterNet importer
Counting imports and exports in terms of economic value and physical volumes could make a country both an exporter and importer.
Physical trade balance year 2010Economic trade balance year 2010
China
Indonesia
Japan
-1200 -1000 -800 -600 -400 -200 0 200 400 600 800 1000 1200
-200 -150 -100 -50 0 50 100 150 200
Malaysia
Pakistan
-100 -80 -60 -40 -20 0 20 40 60 80 100
-25 -20 -15 -10 -5 0 5 10 15 20 25
Net exporterNet importer
Million Tonnes
Billion $
Bangladesh
Fiji Islands
Nepal
Papua New Guinea
Viet Nam
-10 -8 -6 -4 -2 0 2 4 6 8 10
-12 -10 -8 -6 -4 -2 0 2 4 6 8 10 12
India
Philippines
Sri Lanka

Asia is consuming more and more of everything... but on di�erent scales between countries.
Trends in material use over time
0 5,000 10,000 15,000 20,000 25,000
Indonesia
Pakistan
Phillippines
Thailand
0 500 1,000 1,500 2,0000
0 100 200 300 400 500 600 700 8000
0 50 100 150 200 250 300 350 4000
0 100 200 300 400 500 6000
1970
1980
1990
2000
2010
China
19701980199020002010
19701980199020002010
19701980199020002010
19701980199020002010
0 100 200 300 400 500 600 700 800
South Korea19701980199020002010
Biomass Fossil Fuels Metals & Ores Construction Materials
Year
3,250 3,724 1,987 14,630
Million tonnes
Million tonnesYear

Material efficiency in selected Asian countries over time
Developing countries in the Asia-Paci�c region use �ve times as more materials per dollar of GDP (5kg/$) than the rest of the world, and ten times more than industrialized countries (0.4kg/$) in the Asia-Paci�c region. The regional averages mask wide ranges from 17kg/$ down to 0.3kg/$ with the poorer countries most dependent on natural resources often having very low resource e�ciency.
The most e�cient country in the region is performing 67 times better than
the least e�cient!
1970
1980199020002010
Year
Units: Kilograms per dollar
AfghanistanDevelopingAsia Paci�c
Myanmar
Lao PDR
South Korea
New Zealand
Viet Nam
Sri Lanka
55
1010
1515
2020

Water efficiency in selected Asia-Pacific countries over time
Water e�ciency has improved across the region, but still varies among countries.Thailand
Pakistan
Indonesia
Bangladesh
India
Malaysia
Mongolia
BhutanNepalCambodiaChinaDeveloping Asia Paci�cIndiaPakistanThailandSouth KoreaSingaporeAustraliaJapan
China
1970
1980199020002010
Year
Thailand Indonesia
Mongolia
22
44
66
88
11
33
55
77
L/$
Units: 1,000 liters per dollar

The evolution of trade balances in the developing countries of the Asia-Paci�c
200
0
200
400
600
800
1,000
1,200
1970
1971
1972
1973
1974
1975
1976
1977
1978
1979
1980
1981
1982
1983
1984
1985
1986
1987
1988
1989
1990
1991
1992
1993
1994
1995
1996
1997
1998
1999
2000
2001
2002
2003
2004
2005
2006
2007
2008
2009
2010
250
200
150
100
50
50
100
E c o n o m i c t r a d e b a l a n c e , D e v e l o p i n g A s i a - P a c i fic
P h y s i c a l t r a d e b a l a n c e , D e v e l o p i n g A s i a - P a c i fic
Units: million tonnes
0
Net Importer
Net Importer
0
200
400
600
800
1,000
1,200
P h y s i c a l t r a d e b a l a n c e , D e v e l o p i n g A s i a - P a c i fic
200
0
50
100
0
250
200
150
100
50
E c o n o m i c t r a d e b a l a n c e , D e v e l o p i n g A s i a - P a c i fic
00
In the late 1990s, developing countries in the Asia-Paci�c, known as the "manufacturing hub of the world", changed their role in international trade. On an economic basis, these countries collectively switched from being net importers to net exporters, as they increasingly used labour inputs to add value to exports.On a physcial basis however, these countries switched from being exporters to importers, implying that they become increasingly dependent upon resources sourced from outside the region.
Exporter or importer?
Net Exporter
Net Exporter
Units: billion USD

Composition of imports and exports of materials in the Asia-Paci�c region over time
200
700
1,200
1,700
2,200
2,700
3,200
3,700
4,200
200
700
1,200
1,700
2,200
2,700
3,200
3,700
4,200
1970
1972
1974
1976
1978
1980
1982
1984
1986
1988
1990
1992
1994
1996
1998
2000
2002
2004
2006
2008
2010
Units: million tonnes Units: million tonnes
1970
1972
1974
1976
1978
1980
1982
1984
1986
1988
1990
1992
1994
1996
1998
2000
2002
2004
2006
2008
2010
Since the 1970s, the Asia-Paci�c region has increasingly imported and exported resources, implying that materials will increasingly dominate trade discussions. Metals & Ores
Fossil Fuels
Biomass
Construction Materials
Both imports and exports are growing
rapidly!
Asia-Paci�cImport Export

Share (%) of different sectors of the country's material footprint
Agriculture
Mining and energy
Manufacturing
Construction
Transport
Services
< 1,000 1,000 - 10,000 >10,000
Total material footprintUnits: Million tonnes
BangladeshChina India IndonesiaJapan Lao PDRMalaysia NepalNew Zealand
Sri Lanka
22620,100 4,290 1,2102,560 31490 5794 51
41% 31%
37% 32% 33% 50% 37% 49% 51%
37%
Material footprint per person (Unit: tonnes per person)Material footprint intensity (Unit: kilograms per dollar)
14.5
5.2
3.6
3.4
20.1
0.6
5.0
3.2
17.3
2.7
1.5
2.6
21.5
0.8
2.1
5.6
2.5
1.5
4.8
7.7

Share (%) of di�erent sectors of the Asia-Paci�c's energy footprint
Agriculture
Manufacturing
Construction
Transport
Services
< 100,000100,000 - 150,000 >150,000
Mining and energy
Total energy footprintUnits: Petajoules
Asia Paci�c Asia Paci�c developing countries
Asia Paci�cindustrialized countries
47%
2%
31%
1%
14%
5%
47%
1%
25%
1%
18%
7%
47%
2%
33%
1%
13%
4%
157,396 41,384116,012
Energy footprint per person (Unit: Gigajoules per person)Energy footprint intensity (Unit: Megajoules per dollar)
41.1
11.9
199.3
6.1
32.0
17.9

Sectoral GHGs footprint in selected countries in the Asia-Pacific
7.7 2.7 16.8 28.4 2.38.3 1.6 8.23.4
2.8 2.68 0.5 0.7 1.62.4 1.0 1.61.0
Agriculture
Manufacturing
Construction
Transport
Services
Mining and energy
Australia MaldivesChina India Japan Fiji IslandsSri LankaPhilippinesThailand
Thousand tonnes
< 100,000 100,000 - 1,000,000 >1,000,000 636,173 2,68210,745,120 3,278,277 2,144,984 2,89133,329219,214549,504
49% 43% 40% 38%
40%
35% 25%
30%29%
GHG footprint per person (Unit: tonnes per person)GHG footprint per dollar (Unit: Kilograms per person)

Putting it all together: resource e�ciency and human development
Afghanistan Australia
Bangladesh Bhutan
Cambodia China
Fiji Islands India
Each �ower presents country performance in �ve di�erent indicators.
Performance is indexed from 1 to 10, with 1 representing the most resource intensive value in the region, and 10 representing the most resource e�cient value. As HDI is already indexed, we simply multiply it by 10 to �t it to the scale.
• Material e�ciency (measured in kilograms per dollar)
• Greenhouse gas emissions per capita (measured in tonnes per capita)
• Material footprint per capita (measured in tonnes per capita)
• Water e�ciency (measured in litres per dollar)
• Human Development Index (measured as the average of three indexes measuring human development: life expectancy, years of schooling and gross national income per capita).
Greenhouse gas emissions per capita
Material footprint
per capita
Water e�ciency
Human
Development Index
Material e�ciency
Fiji Islands10
9
1
3 2
1
29
97
8
9
3
54
5
5
5
6 3
3
7
5
5 2
3
4
6
72
7
6
9
7 5
7
7
3
5 3

Putting it all together: resource e�ciency and human development
Pakistan
PapuaNew
Guinea
Greenhouse gas emissions per capita
Material footprint
per capita
Water e�ciency
Human
Development Index
Material e�ciency
7
8
1
5 3
10
8
8
4 2
Indonesia Japan
Lao PDR Malaysia
Maldives Mongolia
Myanmar Nepal
New Zealand
6
7
4
63
3
39
9
10
4
7
2
51
3
38
75
7
4
10
6
6
3
5
6
6
1
4
9
1
5 2
8
9
2
4 2
2
38
9
8

271
Putting it all together: resource e�ciency and human development
Philippines Singapore
SouthKorea
Sri Lanka
Thailand Viet Nam
Greenhouse gas emissions per capita
Material footprint
per capita
Water e�ciency
Human
Development Index
Material e�ciency
8
7
3
64
3
110
8
7
2
39
9
8
8
8
4
75
4
5
5
75
6
6
2
62
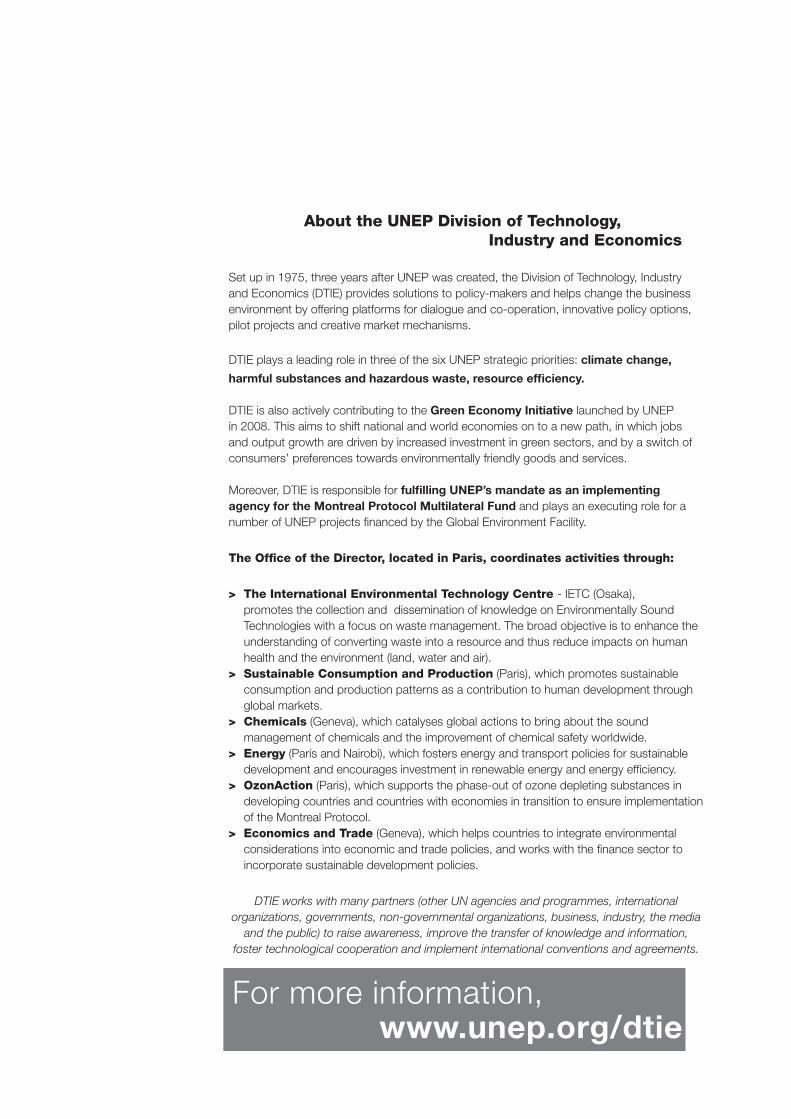
About the UNEP Division of Technology,Industry and Economics
Set up in 1975, three years after UNEP was created, the Division of Technology, Industry and Economics (DTIE) provides solutions to policy-makers and helps change the business environment by offering platforms for dialogue and co-operation, innovative policy options, pilot projects and creative market mechanisms.
DTIE plays a leading role in three of the six UNEP strategic priorities: climate change,
harmful substances and hazardous waste, resource efficiency.
DTIE is also actively contributing to the Green Economy Initiative launched by UNEP in 2008. This aims to shift national and world economies on to a new path, in which jobs and output growth are driven by increased investment in green sectors, and by a switch of consumers’ preferences towards environmentally friendly goods and services.
Moreover, DTIE is responsible for fulfilling UNEP’s mandate as an implementing agency for the Montreal Protocol Multilateral Fund and plays an executing role for a number of UNEP projects financed by the Global Environment Facility.
The Office of the Director, located in Paris, coordinates activities through:
> The International Environmental Technology Centre - IETC (Osaka), promotes the collection and dissemination of knowledge on Environmentally Sound Technologies with a focus on waste management. The broad objective is to enhance the understanding of converting waste into a resource and thus reduce impacts on human health and the environment (land, water and air).
> Sustainable Consumption and Production (Paris), which promotes sustainable consumption and production patterns as a contribution to human development through global markets.
> Chemicals (Geneva), which catalyses global actions to bring about the sound management of chemicals and the improvement of chemical safety worldwide.
> Energy (Paris and Nairobi), which fosters energy and transport policies for sustainable development and encourages investment in renewable energy and energy efficiency.
> OzonAction (Paris), which supports the phase-out of ozone depleting substances in developing countries and countries with economies in transition to ensure implementation of the Montreal Protocol.
> Economics and Trade (Geneva), which helps countries to integrate environmental considerations into economic and trade policies, and works with the finance sector to incorporate sustainable development policies.
DTIE works with many partners (other UN agencies and programmes, international organizations, governments, non-governmental organizations, business, industry, the media
and the public) to raise awareness, improve the transfer of knowledge and information, foster technological cooperation and implement international conventions and agreements.
For more information,www.unep.org/dtie


![Low-Calorie Drinks & Weight Loss [INFOGRAPHIC]](https://static.fdocuments.us/doc/165x107/587b28b81a28ab057d8b463b/low-calorie-drinks-weight-loss-infographic.jpg)