
Influxdb and time series data
39
InfluxDB The time series database Modern Factory #workshops Marcin Szepczyński, July 2016
-
Upload
marcin-szepczynski -
Category
Engineering
-
view
256 -
download
1
Transcript of Influxdb and time series data
InfluxDB The time series database
Modern Factory #workshops Marcin Szepczyński, July 2016

What is time series data?

What is time series data?
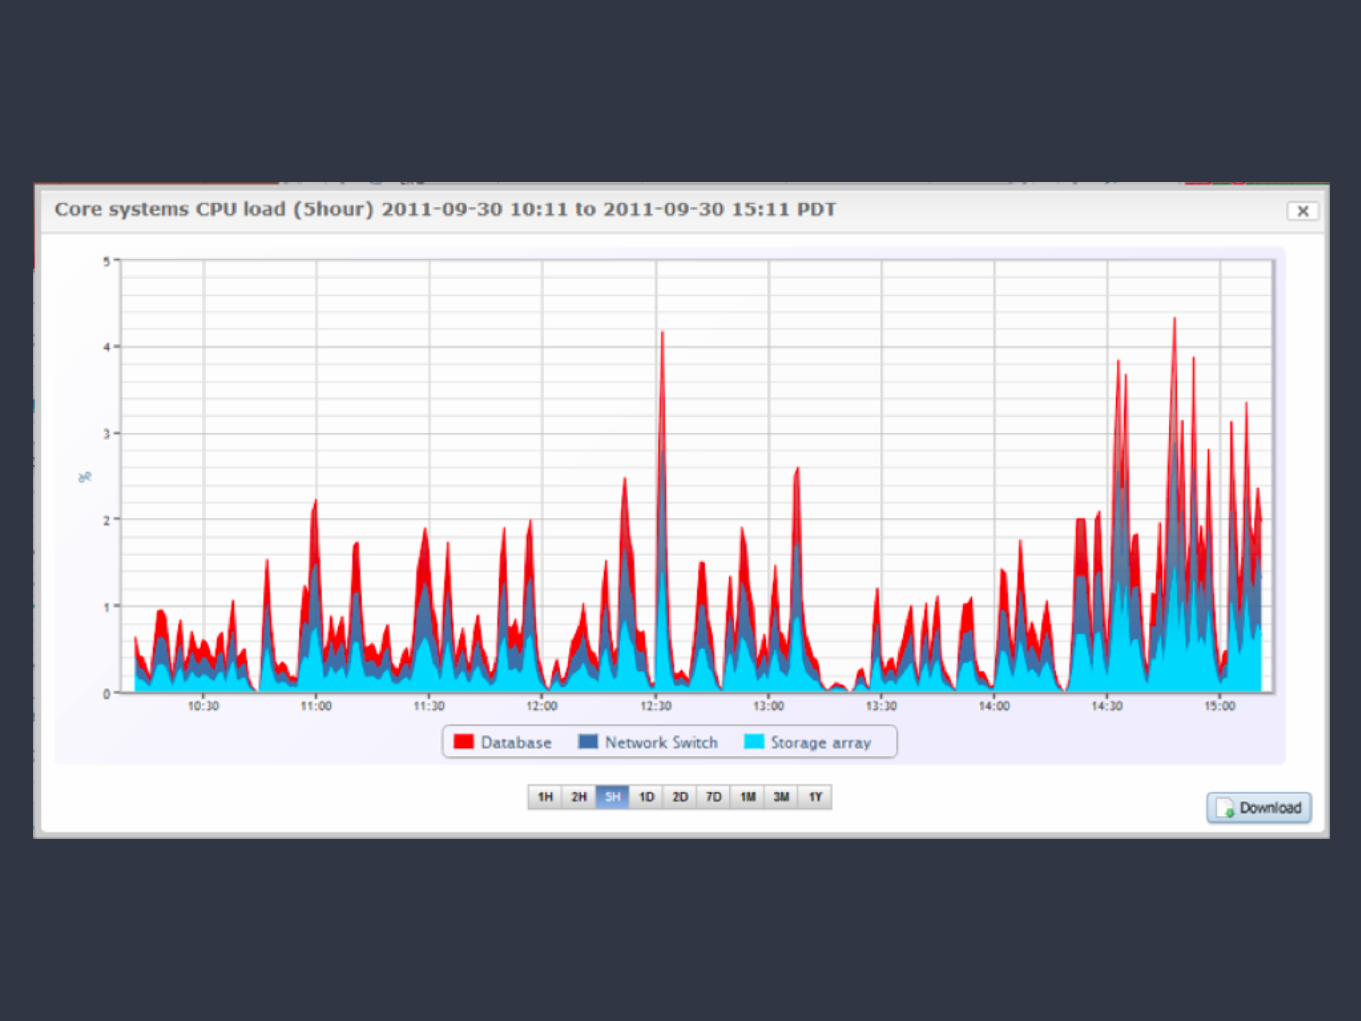
• A time series data is a sequence of data points made from the same source over the time interval.
• If you have a time series data and plot it, one of your axes will be always a time.
Examples of time series data

What is not a time series data?


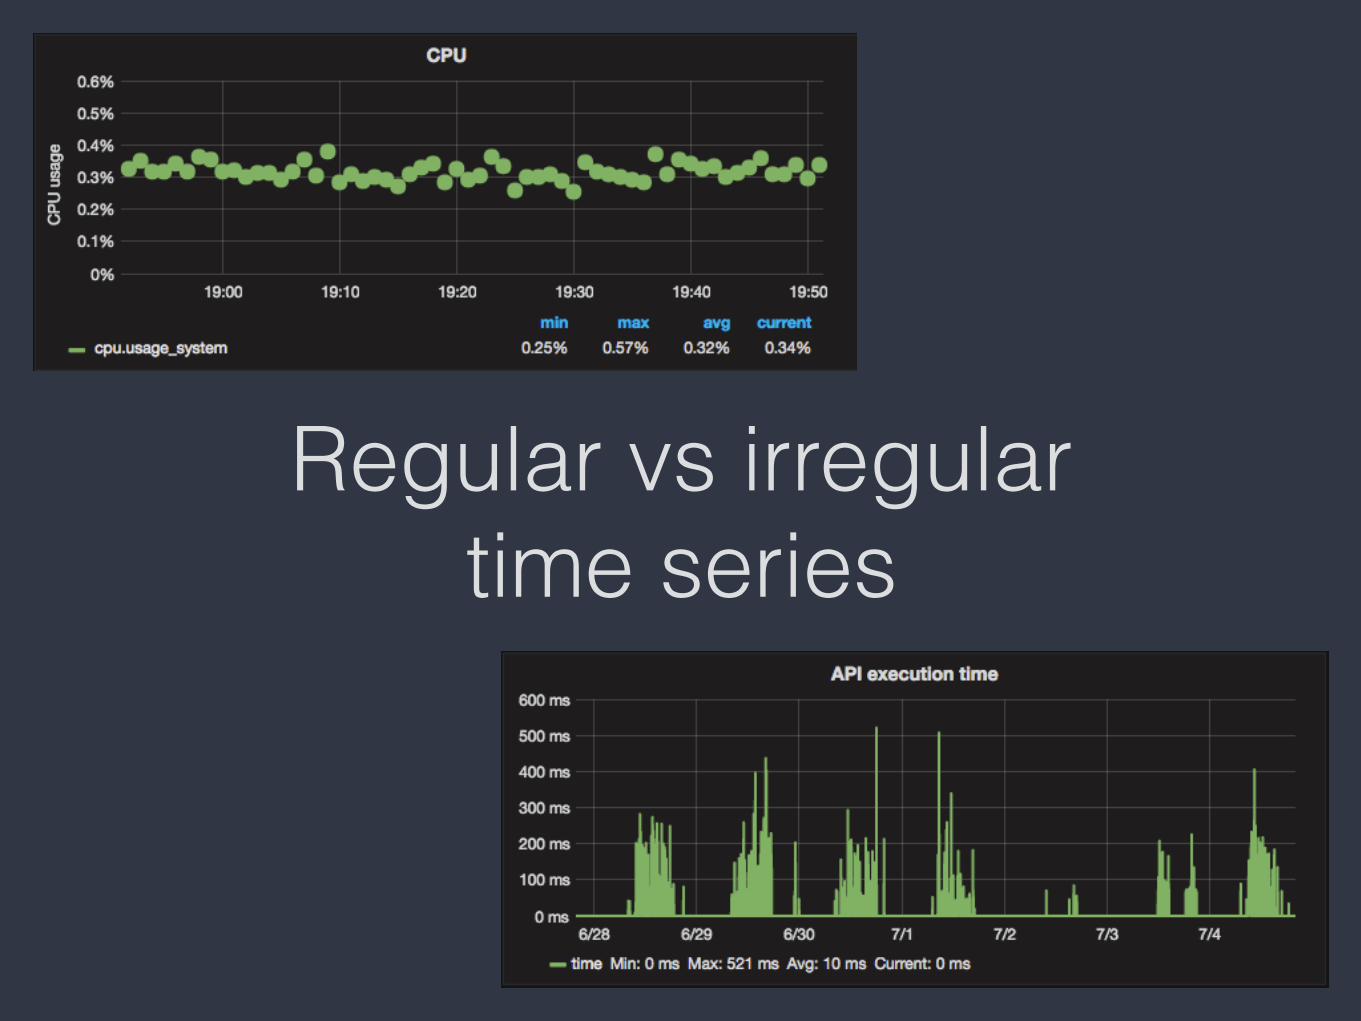
Regular vs irregular time series

Time series data is good for
• Internet of Things (e.g. sensors data)
• Alerting
• Monitoring
• Real Time Analytics

InfluxDB is I in TICK stack
• Telegraf - time data collector
• InfluxDB - time series database
• Chronograf - time series data visualization
• Kapacitor - time series data processing and alerting

InfluxDB features
• SQL-like query language
• Schemaless
• Case sensitive
• Data types: string, float64, int64, boolean
Measurement
• Measurement (or Point) is a single record (row) in InfluxDB data store
• Each measurement has time (as primary key), tags (indexed columns) and fields (not indexed columns)
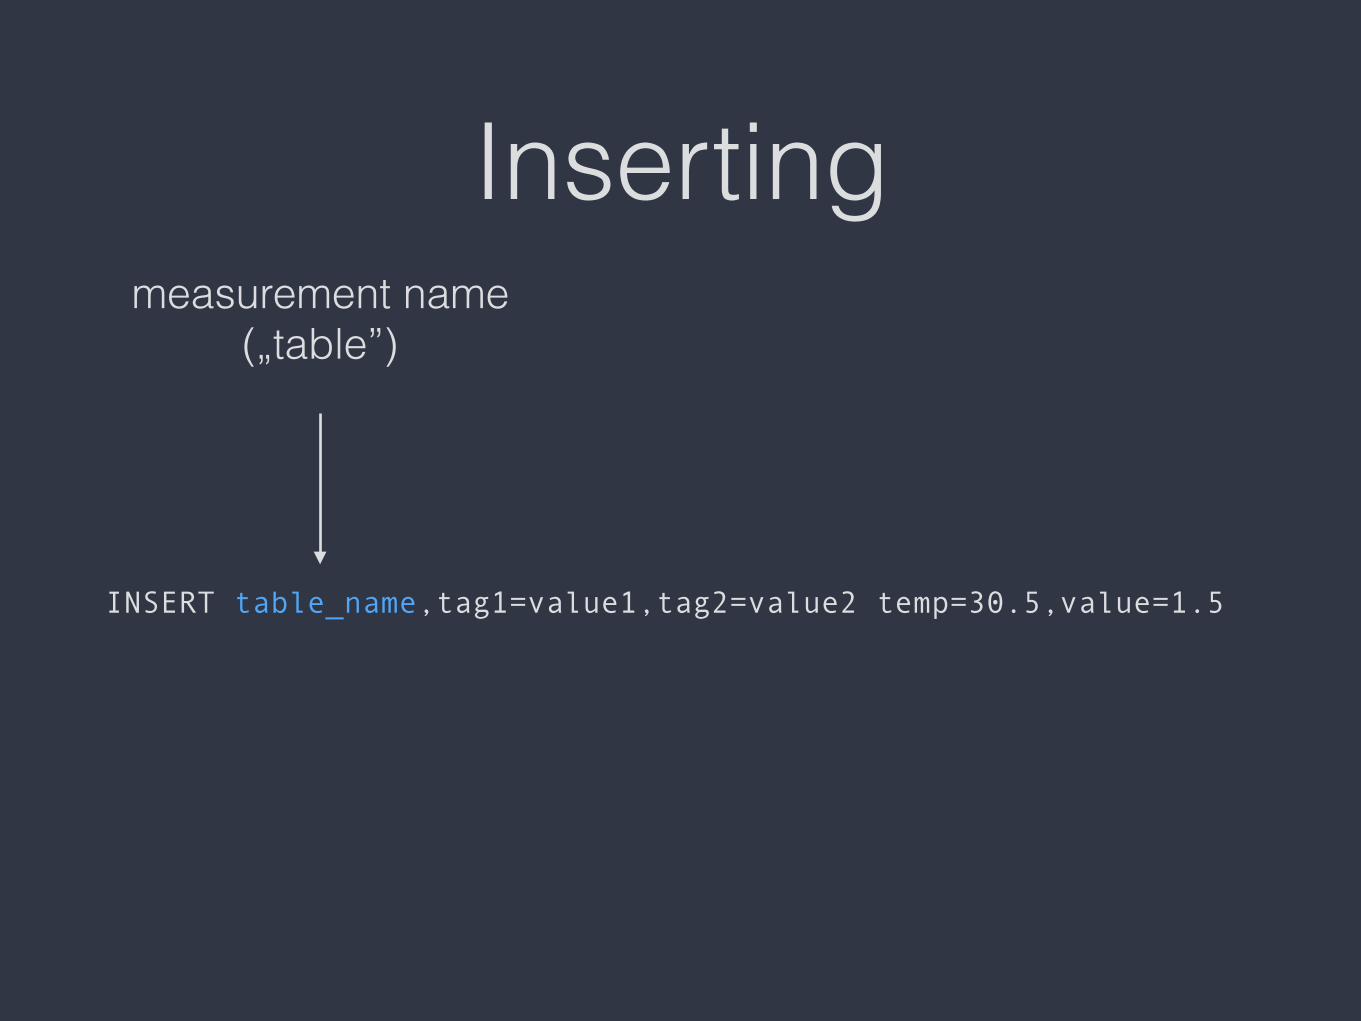
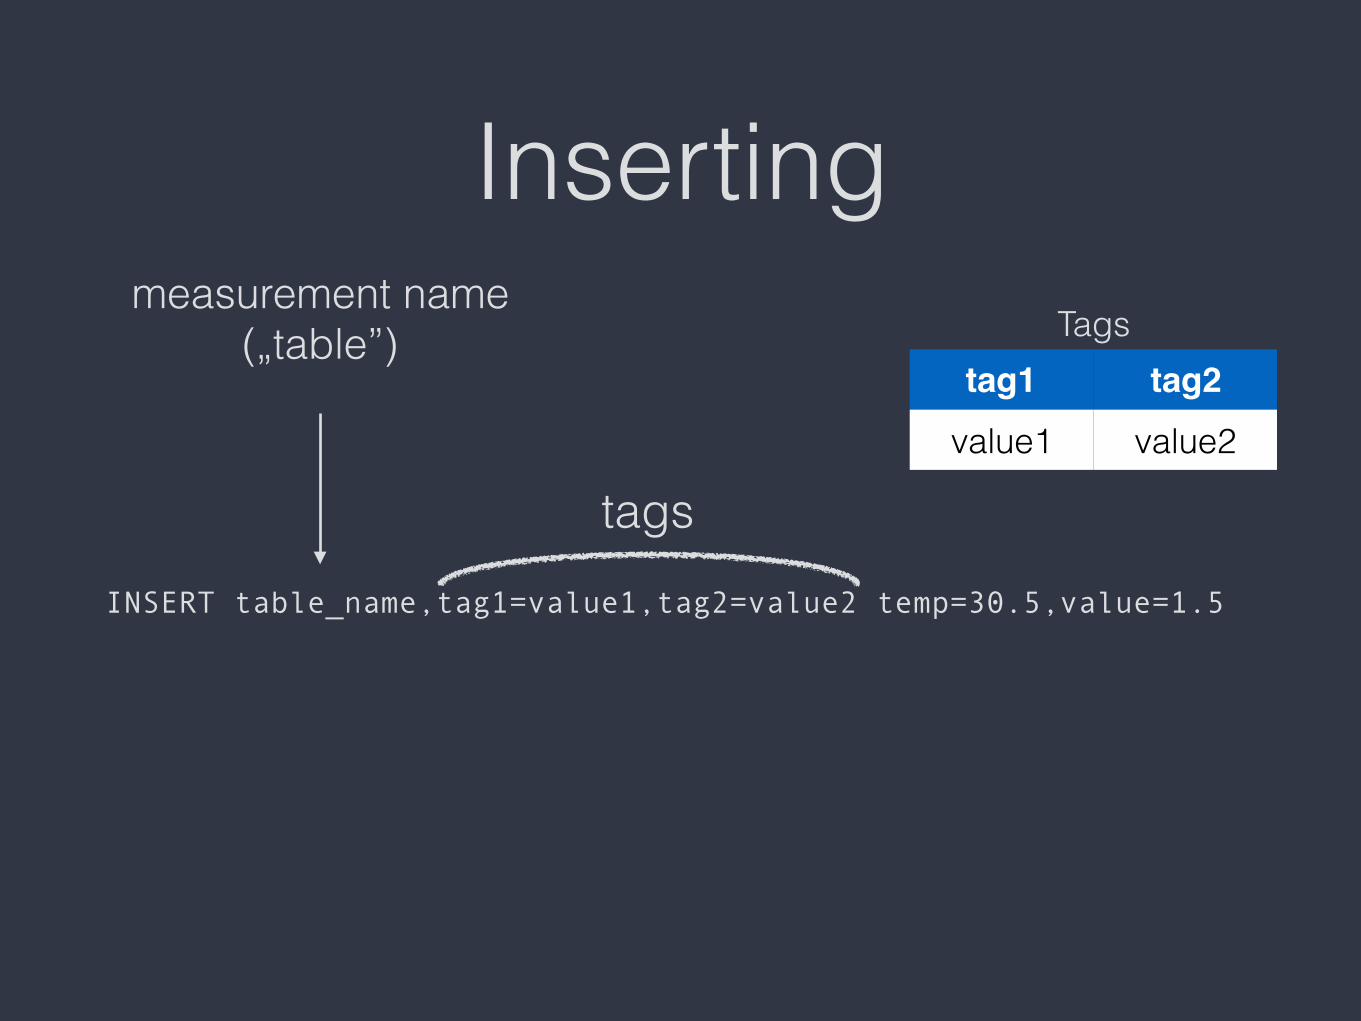
Inserting
INSERT table_name,tag1=value1,tag2=value2 temp=30.5,value=1.5
measurement name („table”)
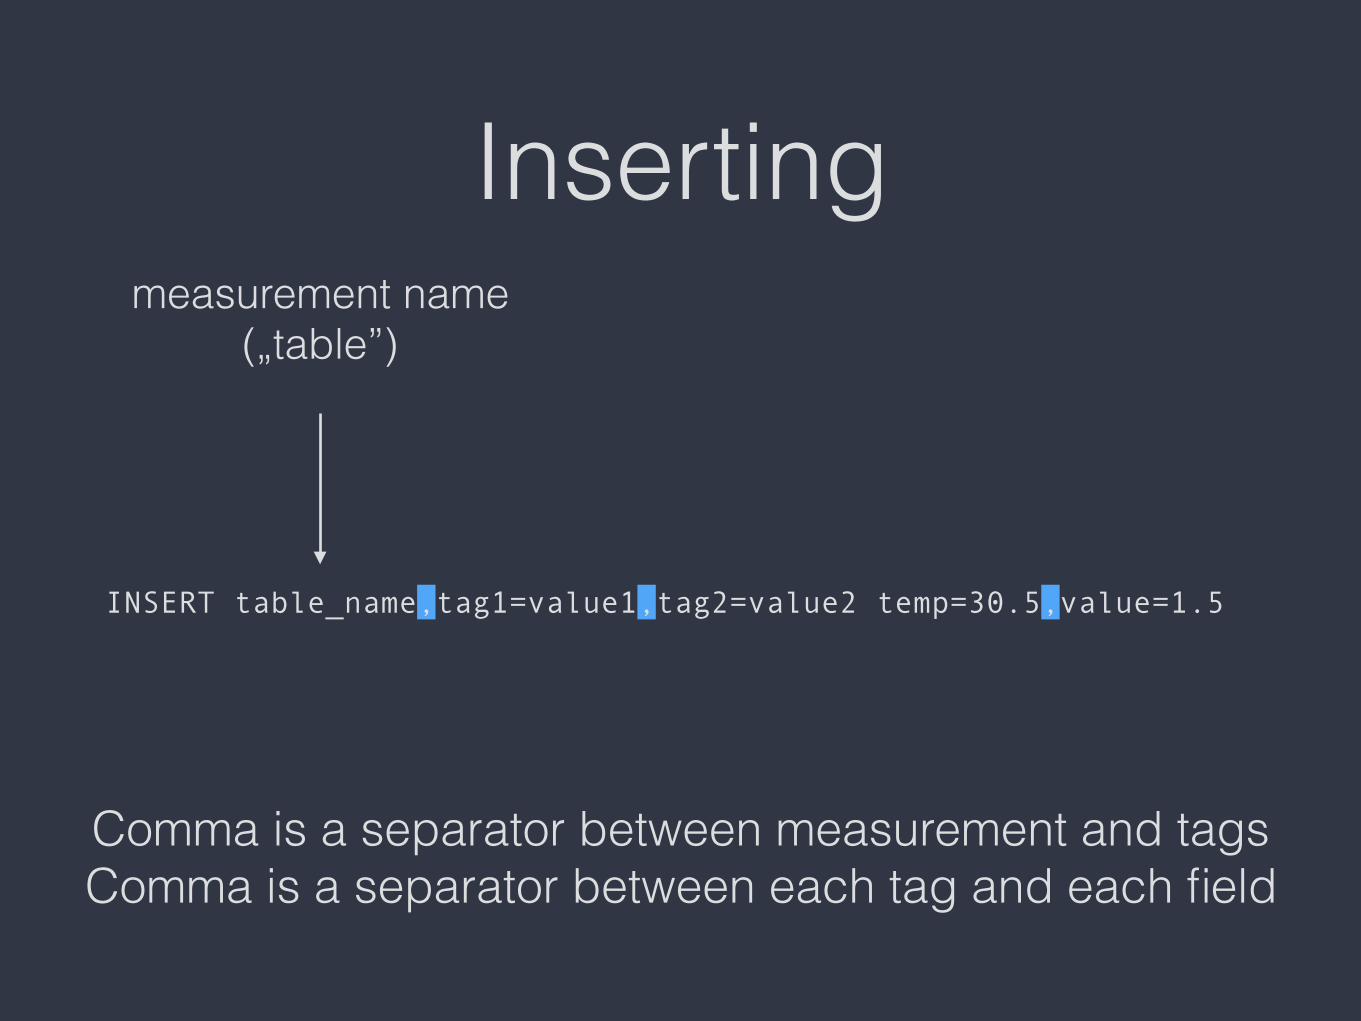
Inserting
INSERT table_name,tag1=value1,tag2=value2 temp=30.5,value=1.5
measurement name („table”)
Comma is a separator between measurement and tags Comma is a separator between each tag and each field

Inserting
INSERT table_name,tag1=value1,tag2=value2 temp=30.5,value=1.5
measurement name („table”)
Space is a separator between tags and fields
Inserting
INSERT table_name,tag1=value1,tag2=value2 temp=30.5,value=1.5
measurement name („table”)
tags
Tagstag1 tag2
value1 value2
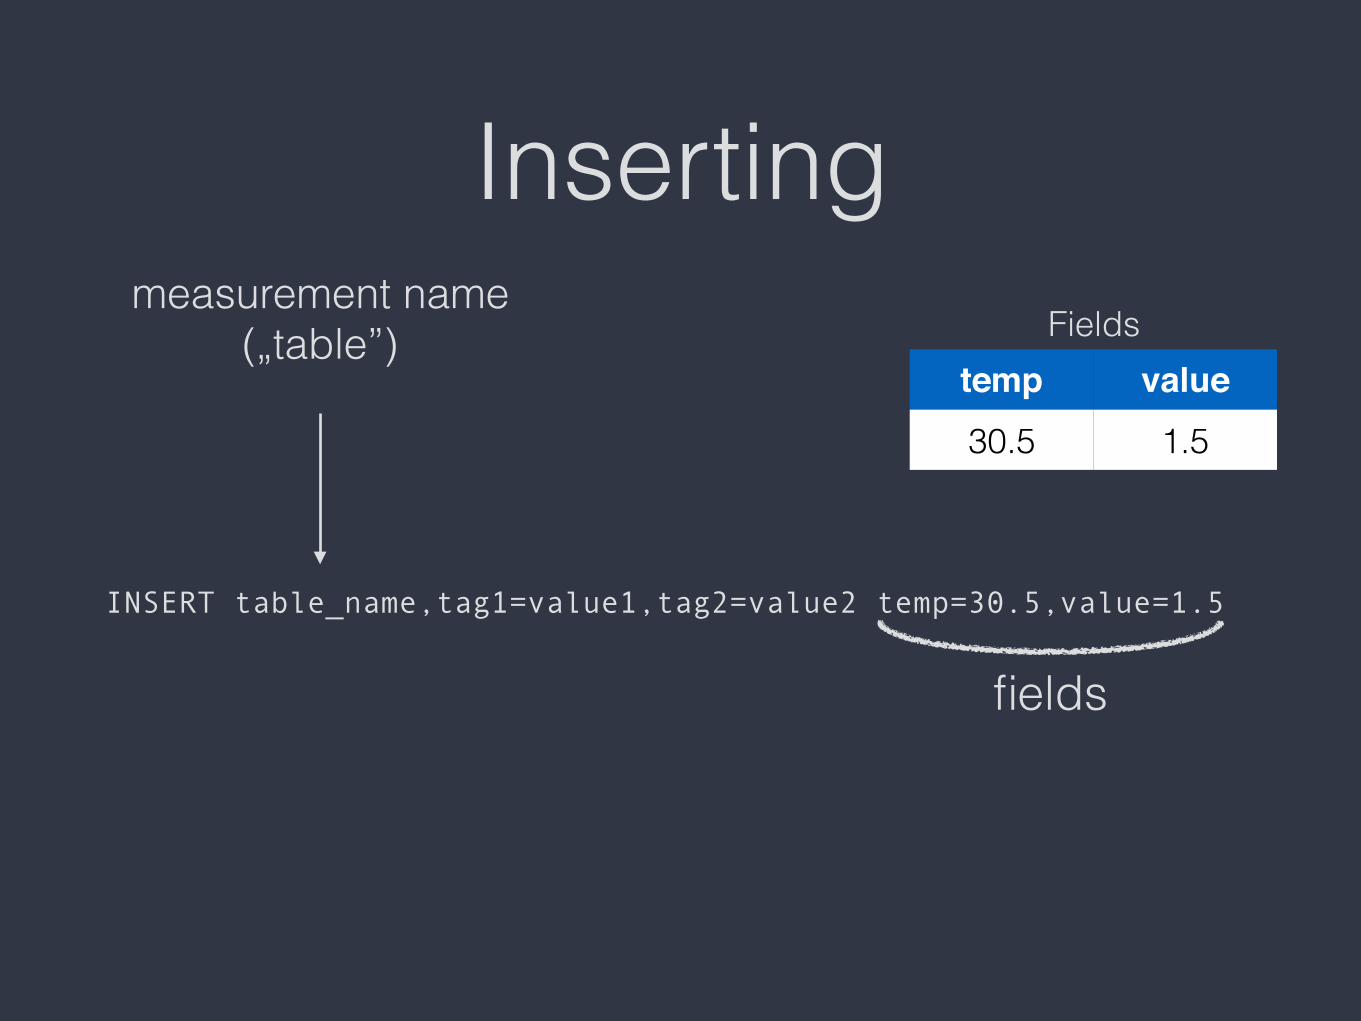
Inserting
INSERT table_name,tag1=value1,tag2=value2 temp=30.5,value=1.5
measurement name („table”)
fields
Fieldstemp value30.5 1.5
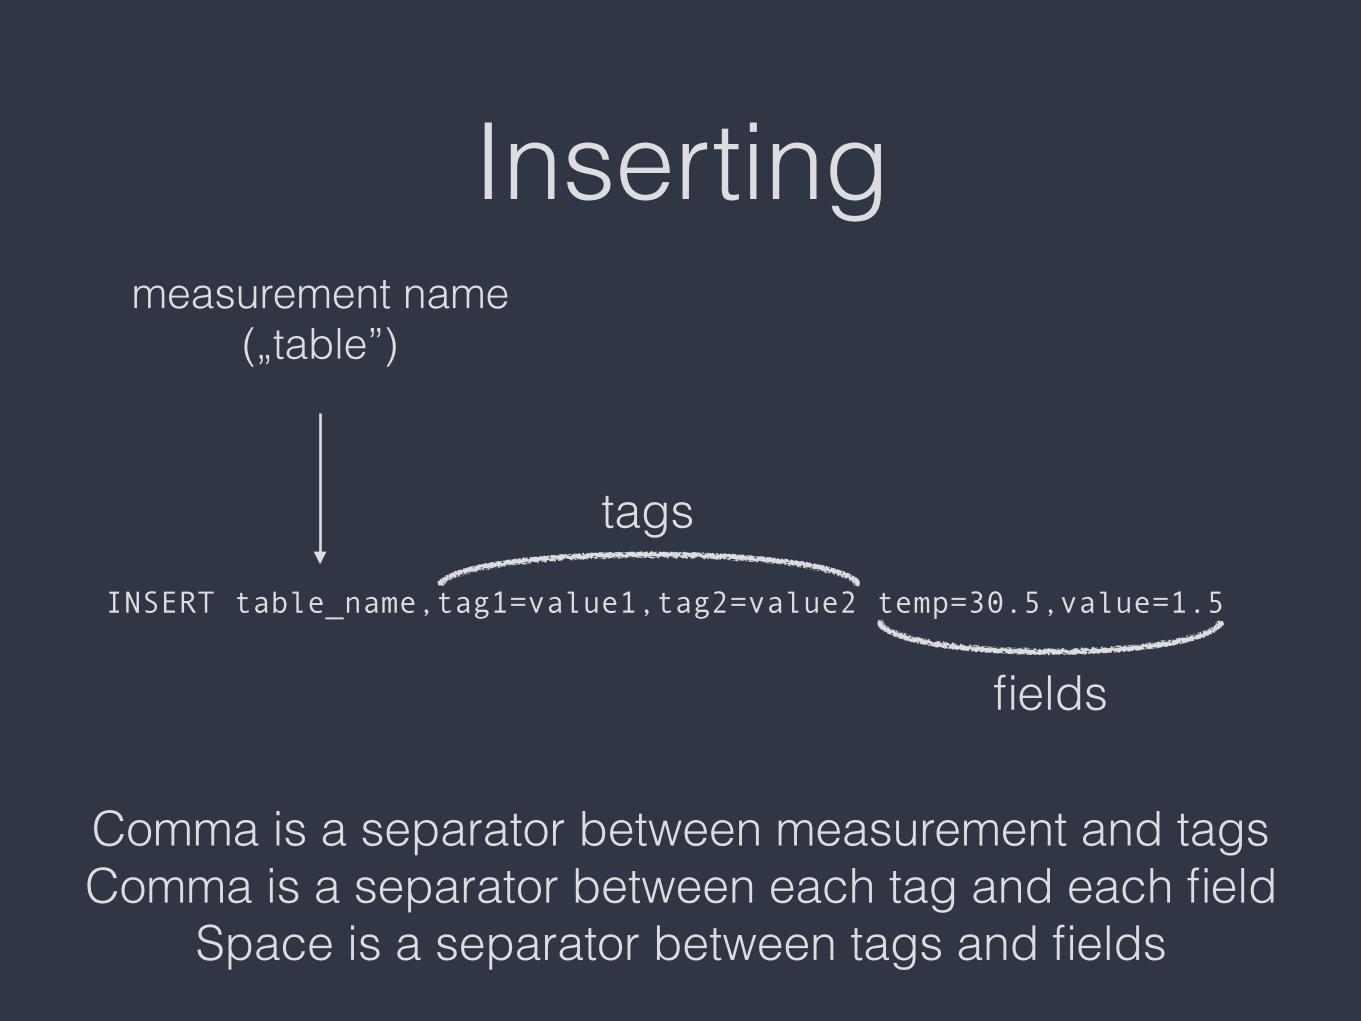
Inserting
INSERT table_name,tag1=value1,tag2=value2 temp=30.5,value=1.5
measurement name („table”)
Comma is a separator between measurement and tags Comma is a separator between each tag and each field
Space is a separator between tags and fields
tags
fields

Querying• Show databases: > SHOW DATABASES
• Select database: > USE workshop
• Show measurements („tables”)> SHOW MEASUREMENTS
• Simple select all > SELECT * FROM measurement_name

Querying (2)• Select with limit:> SELECT * FROM measure LIMIT 10
• Select with offset: > SELECT * FROM measure OFFSET 10
• Select where clause: > SELECT * FROM measure WHERE tag1 = ’value1’
• Select with order clause: > SELECT * FROM measure ORDER BY cpu DESC
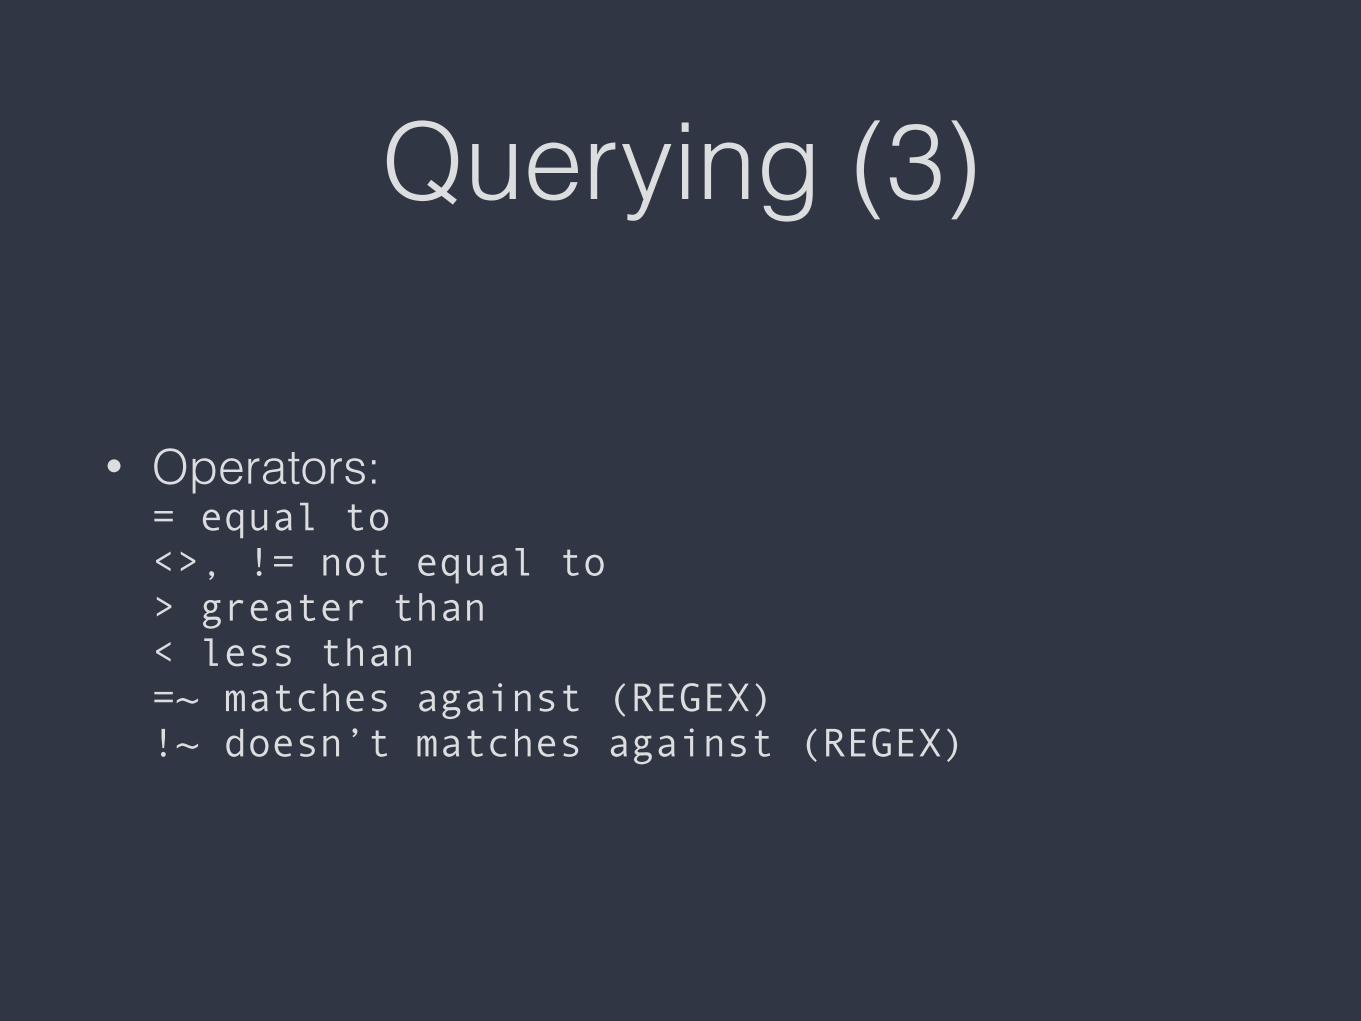
Querying (3)
• Operators:= equal to <>, != not equal to > greater than < less than =~ matches against (REGEX) !~ doesn’t matches against (REGEX)

Aggregations - COUNT()
Returns the number of non-null values. > SELECT count(<field>) FROM measure > SELECT count(cpu) FROM cpu_temp WHERE time > '2016-07-04' AND time < '2016-07-05' GROUP BY time(1h)
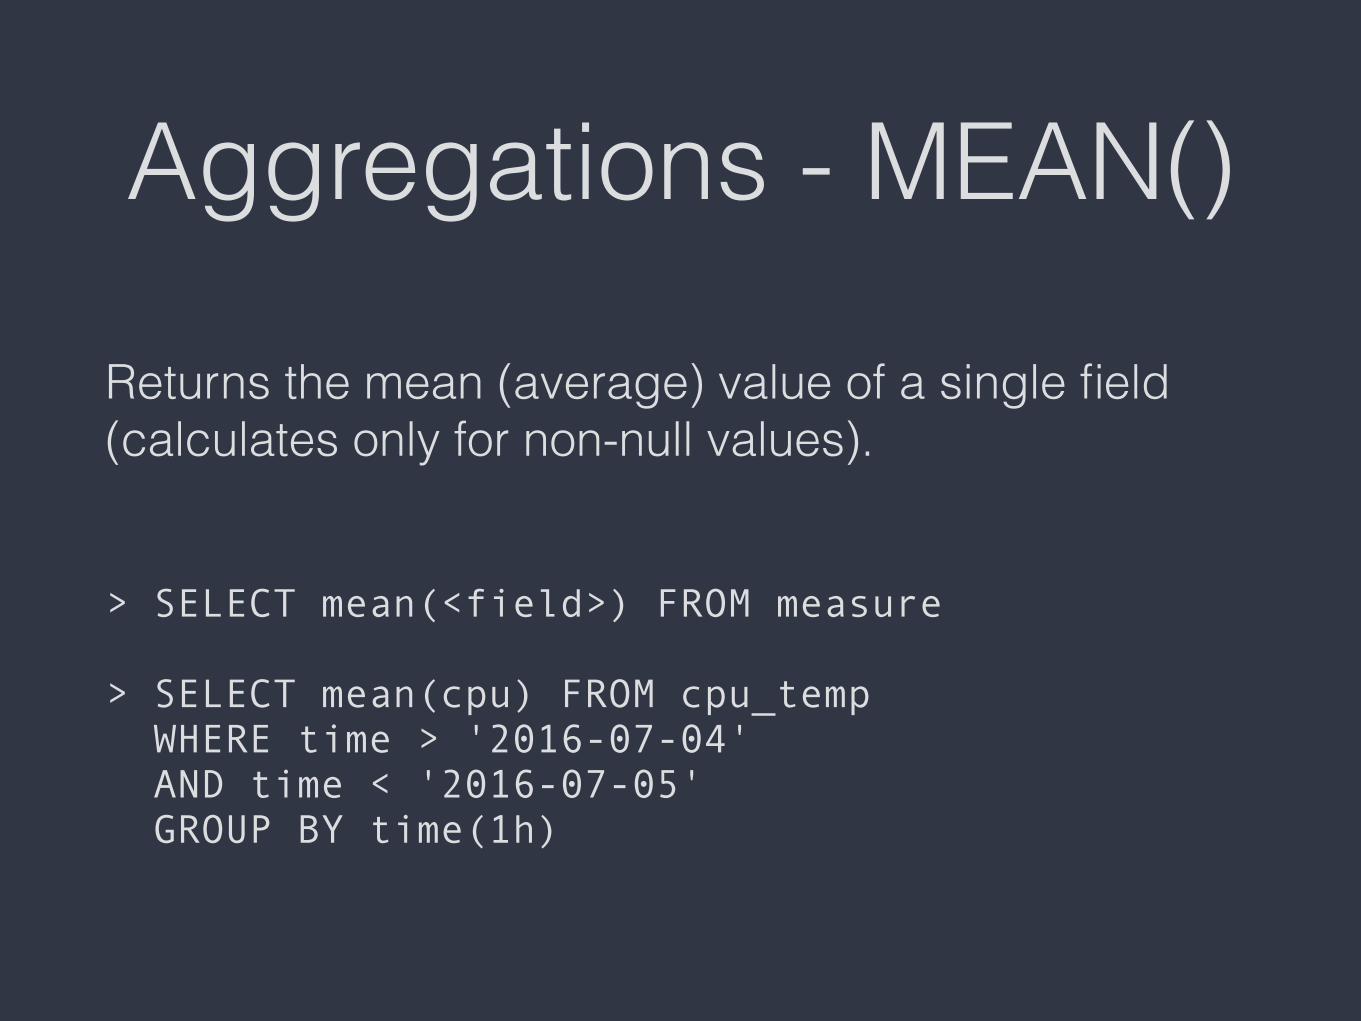
Aggregations - MEAN()
Returns the mean (average) value of a single field (calculates only for non-null values). > SELECT mean(<field>) FROM measure > SELECT mean(cpu) FROM cpu_temp WHERE time > '2016-07-04' AND time < '2016-07-05' GROUP BY time(1h)
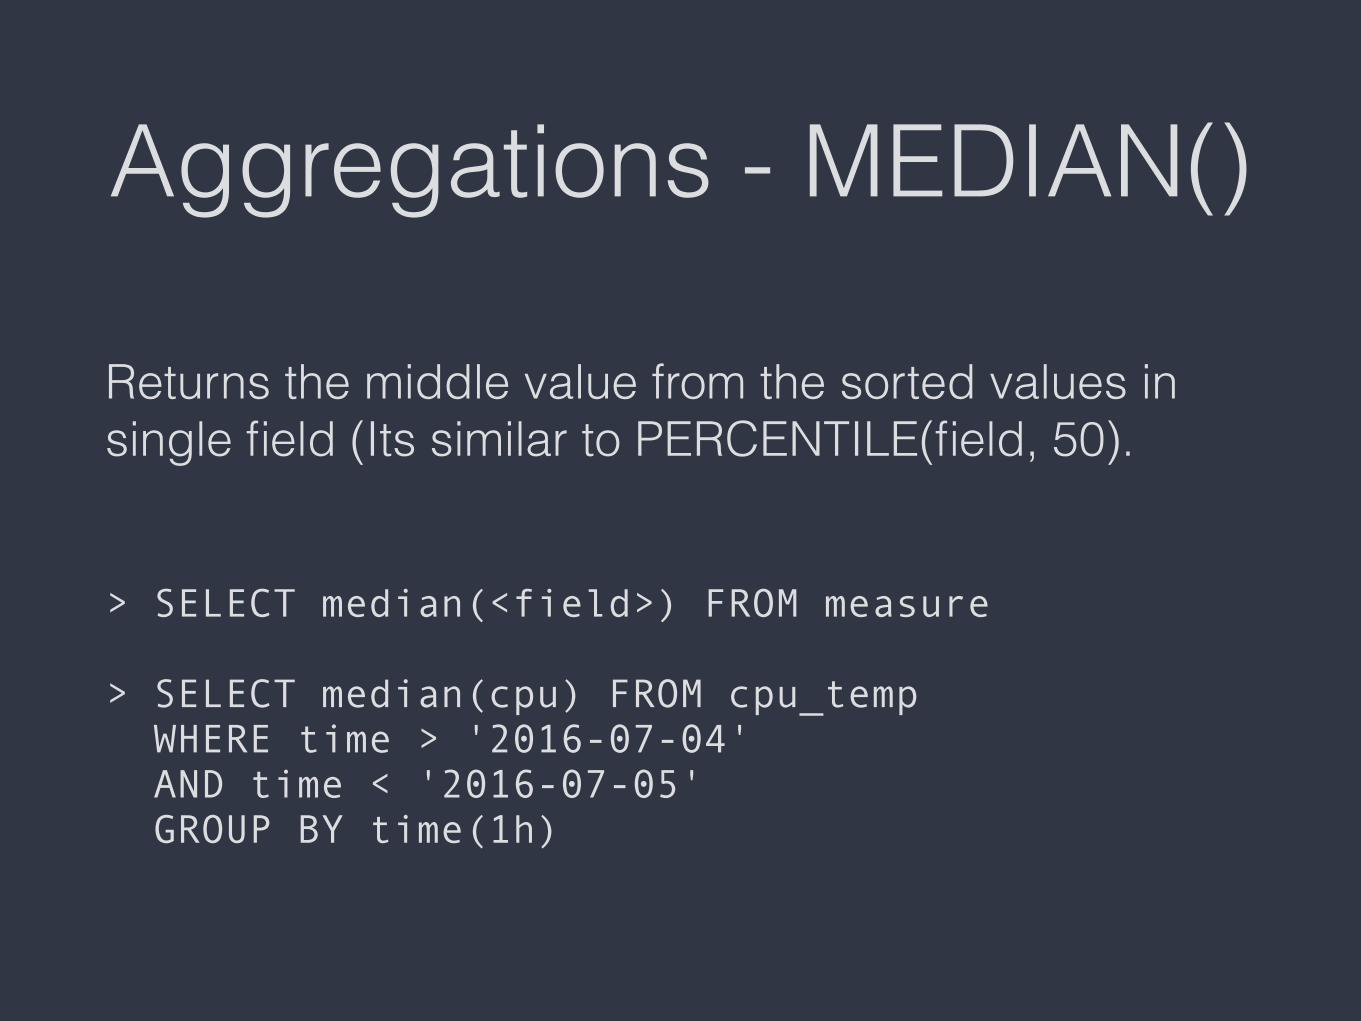
Aggregations - MEDIAN()
Returns the middle value from the sorted values in single field (Its similar to PERCENTILE(field, 50). > SELECT median(<field>) FROM measure > SELECT median(cpu) FROM cpu_temp WHERE time > '2016-07-04' AND time < '2016-07-05' GROUP BY time(1h)

Aggregations - SPREAD()
Returns the difference between minimum and maximum value of the field. > SELECT spread(<field>) FROM measure > SELECT spread(cpu) FROM cpu_temp WHERE time > '2016-07-04' AND time < '2016-07-05' GROUP BY time(1h)
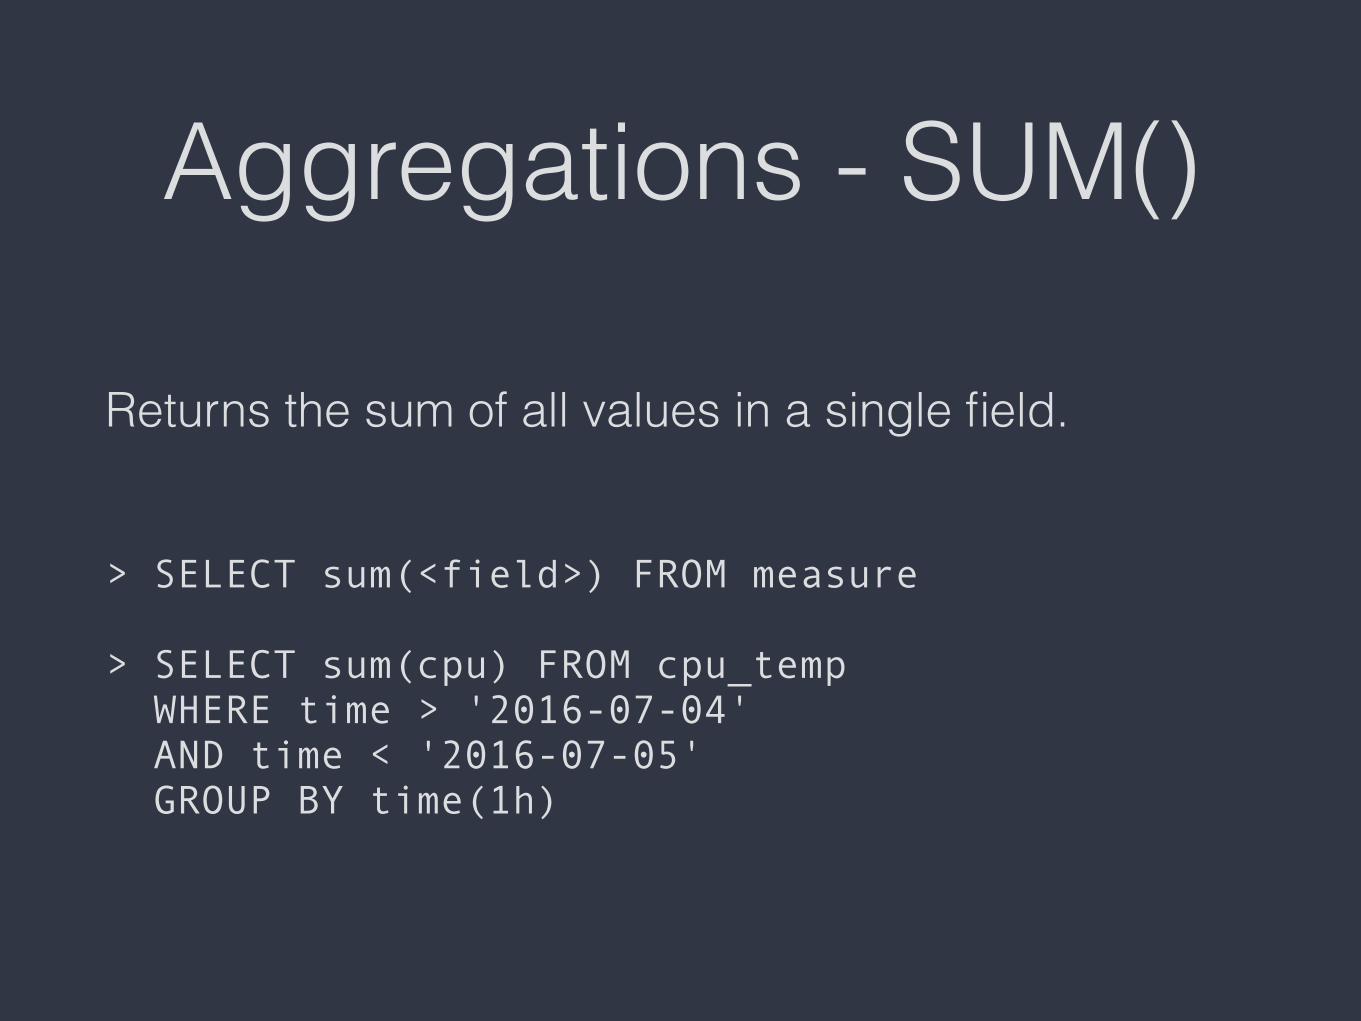
Aggregations - SUM()
Returns the sum of all values in a single field. > SELECT sum(<field>) FROM measure > SELECT sum(cpu) FROM cpu_temp WHERE time > '2016-07-04' AND time < '2016-07-05' GROUP BY time(1h)

Selectors - BOTTOM(N)
Returns the smaller N values in a single field. > SELECT bottom(<field>, <N>) FROM measure > SELECT bottom(cpu, 5) FROM cpu_temp WHERE time > '2016-07-04' AND time < '2016-07-05' GROUP BY time(1h)
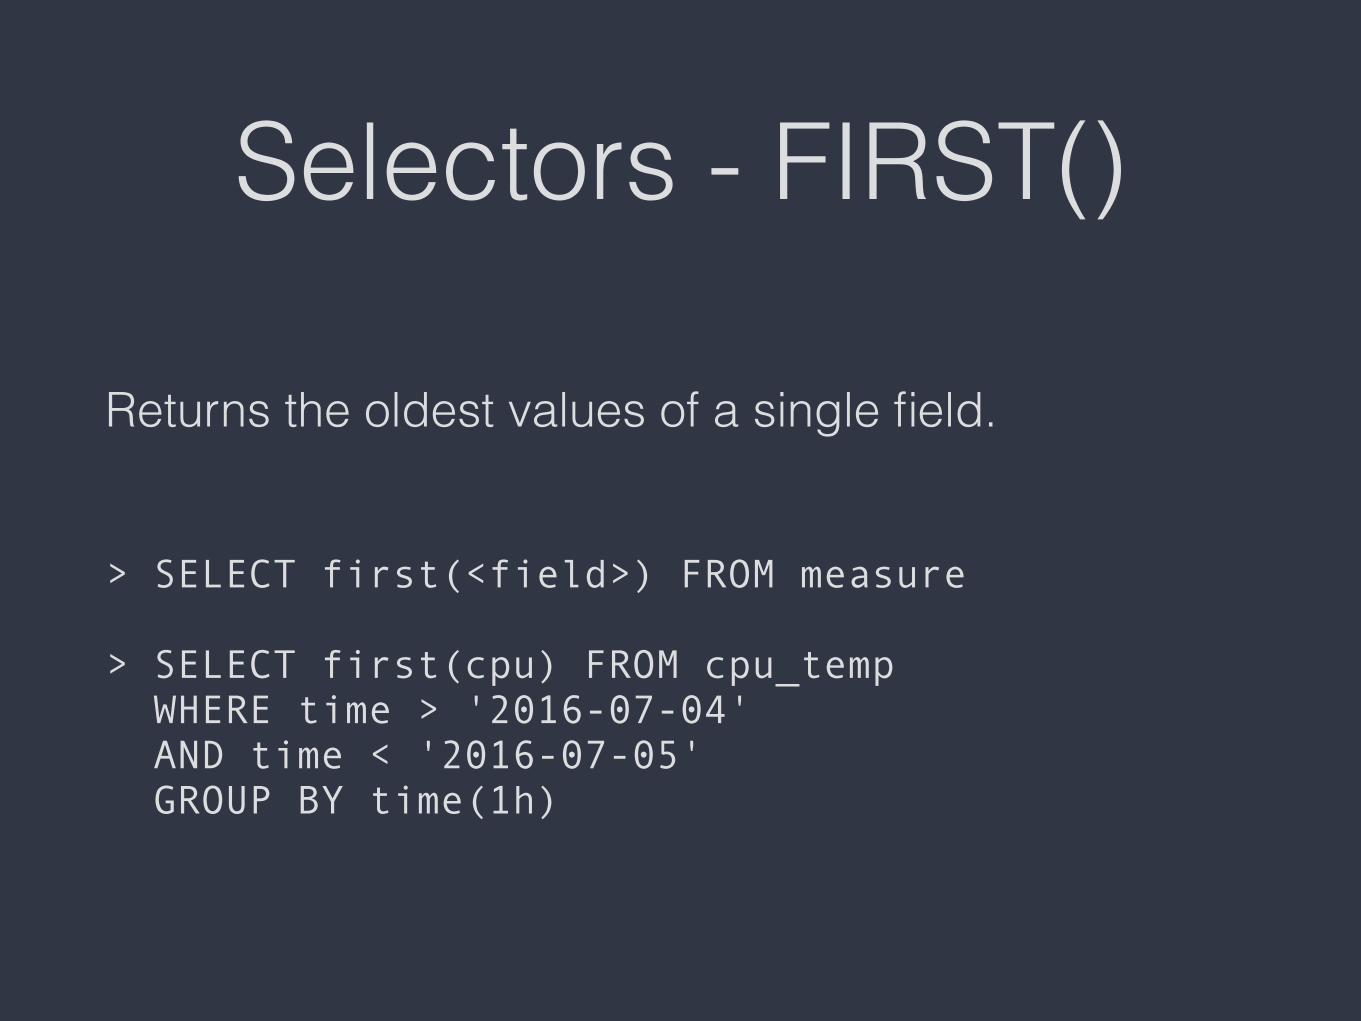
Selectors - FIRST()
Returns the oldest values of a single field. > SELECT first(<field>) FROM measure > SELECT first(cpu) FROM cpu_temp WHERE time > '2016-07-04' AND time < '2016-07-05' GROUP BY time(1h)

Selectors - LAST()
Returns the newest values of a single field. > SELECT last(<field>) FROM measure > SELECT last(cpu) FROM cpu_temp WHERE time > '2016-07-04' AND time < '2016-07-05' GROUP BY time(1h)
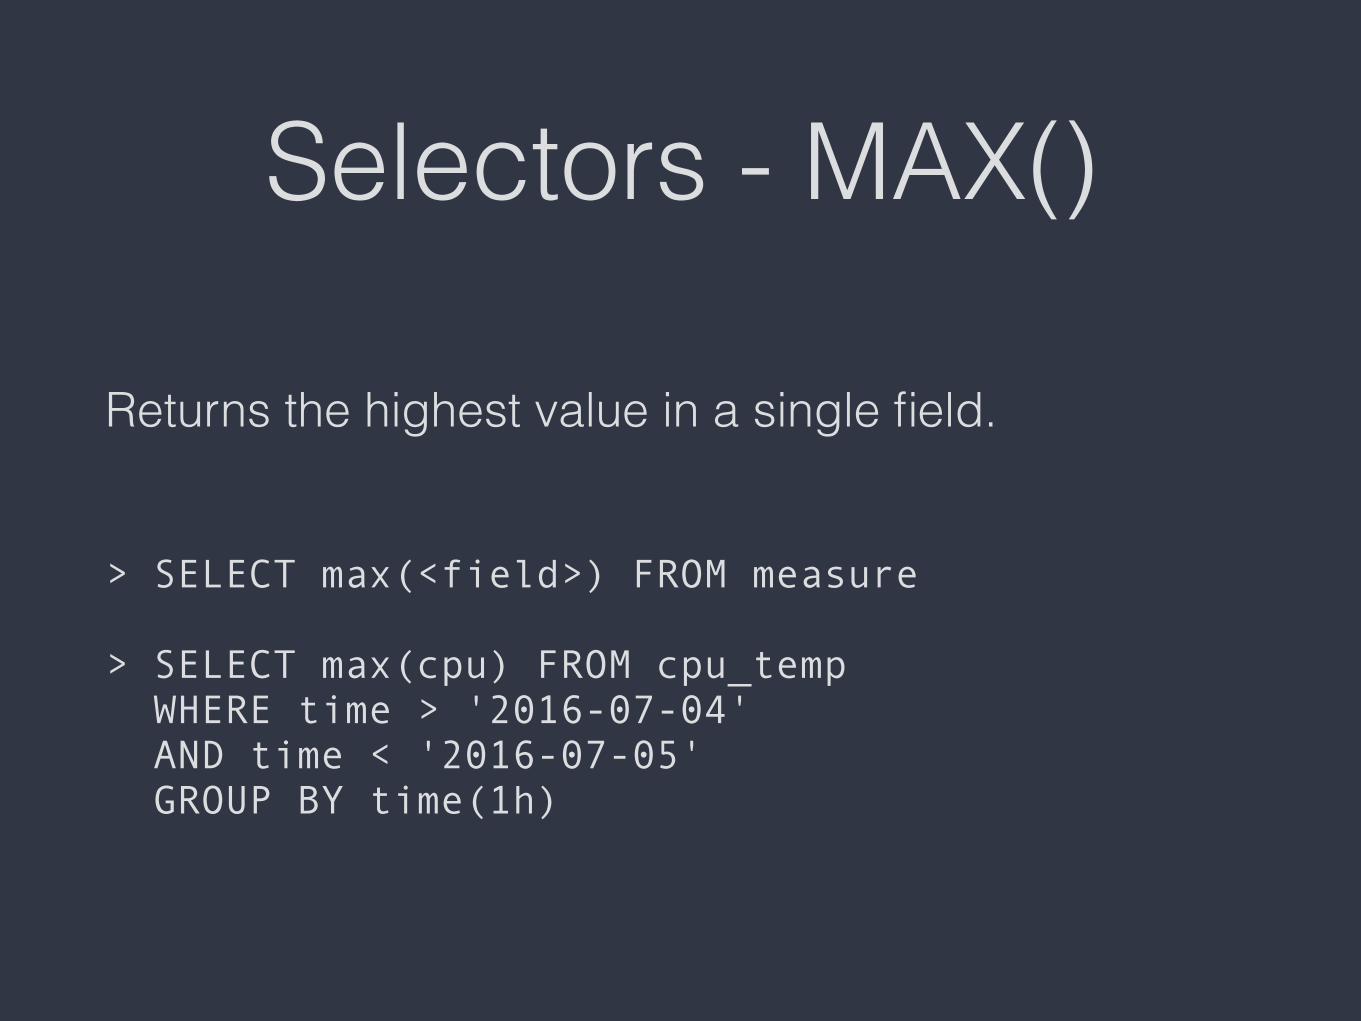
Selectors - MAX()
Returns the highest value in a single field. > SELECT max(<field>) FROM measure > SELECT max(cpu) FROM cpu_temp WHERE time > '2016-07-04' AND time < '2016-07-05' GROUP BY time(1h)

Selectors - MIN()
Returns the lowest value in a single field. > SELECT min(<field>) FROM measure > SELECT min(cpu) FROM cpu_temp WHERE time > '2016-07-04' AND time < '2016-07-05' GROUP BY time(1h)

Selectors - PERCENTILE(N)
Returns the N-percentile value for sorted values of a single field.> SELECT percentile(<field>, <N>) FROM measure> SELECT percentile(cpu, 95) FROM cpu_temp WHERE time > '2016-07-04' AND time < '2016-07-05' GROUP BY time(1h)
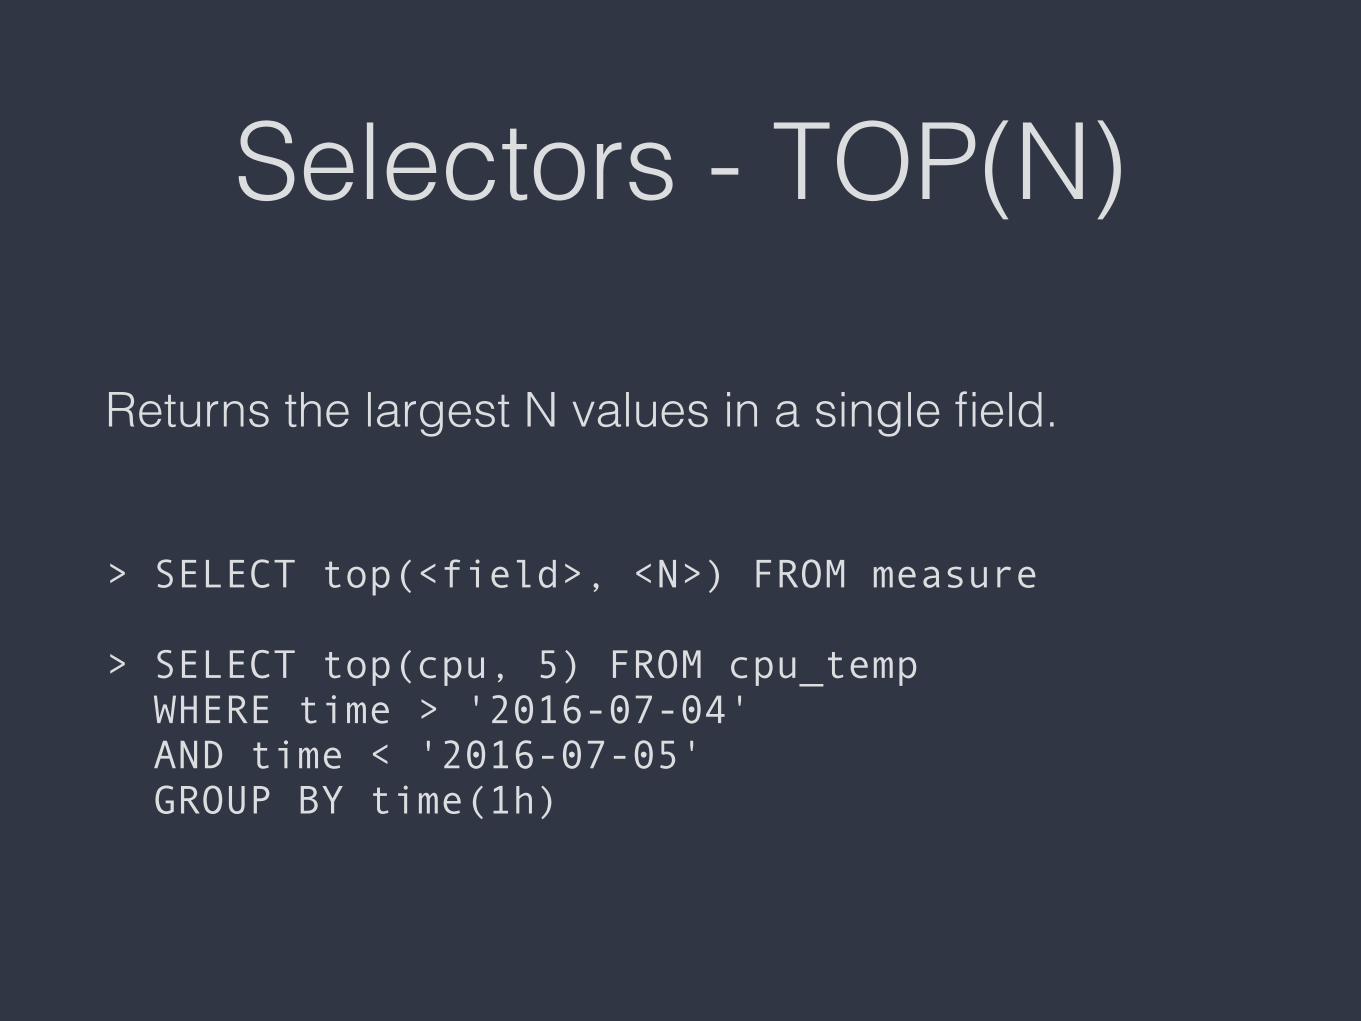
Selectors - TOP(N)
Returns the largest N values in a single field. > SELECT top(<field>, <N>) FROM measure > SELECT top(cpu, 5) FROM cpu_temp WHERE time > '2016-07-04' AND time < '2016-07-05' GROUP BY time(1h)

GROUP BY clause
InfluxDB supports GROUP BY clause with tag values, time intervals, tag values and time intervals and GROUP BY with fill().
Downsampling
InfluxDB can handle hundreds of thousands of data points per second. Working with that much data over a long period of time can create storage concerns. A natural solution is to downsample the data; keep the high precision raw data for only a limited time, and store the lower precision, summarized data for much longer or forever.

Data retention
A retention policy is the part of InfluxDB’s data structure that describes for how long InfluxDB keeps data and how many copies of those data are stored in the cluster. A database can have several RPs and RPs are unique per database.
More
https://influxdata.com/videos/
https://docs.influxdata.com/influxdb


![EPICS and Open Source Data Analytics Platformsaccelconf.web.cern.ch/AccelConf/icalepcs2017/papers/thpha032.pdf · InfluxDB InfluxDB is the "I" in InfluxData's TICK stack [2]. It is](https://static.fdocuments.us/doc/165x107/5e10b6a492860a5fec500b29/epics-and-open-source-data-analytics-influxdb-influxdb-is-the-i-in-influxdatas.jpg)


