Factors influencing Malaysian consumers' consumption of dairy ...

P a g e | i
Influencing customer retention for low-consumption
credence goods through social norms
Trent Ryan Lockstone
13061373
A research project submitted to the Gordon Institute of Business
Science, University of Pretoria, in partial fulfilment of the
requirements for the degree of Master of Business Administration.
11 November 2013
© 2014 University of Pretoria. All rights reserved. The copyright in this work vests in the University of Pretoria.

P a g e | ii
Abstract
Social norms have been claimed to influence customer retention when the
social network the customer engages with is well aware of a customer’s use of
the product or service. This research investigates whether social norms will also
influence customer retention for services that are used so infrequently that the
social network the customer engages with is not aware that the customer has
the product or service. The specific services investigated are also impacted by
the fact that the customers themselves are not entirely certain as to their
individual need of the product, namely credence goods. The aim of this
research is to provide a profile of a customer that would be more influenced by
social norms; which knowledge would allow organisations to target specific
customers.
Using the Mann-Whitney and Kruskal-Wallis tests, hypotheses were tested by
analysing questionnaire feedback data on 100 active insurance customers and
100 inactive insurance customers from within the South African financial
services market.
Empirical support for the effect of social norms on customer retention of
credence goods is found.
Empirical proof that females are more influenced by social norms than males
was found as well as the link between culture value orientation to social norms.
© 2014 University of Pretoria. All rights reserved. The copyright in this work vests in the University of Pretoria.

P a g e | iii
In this research a link between a customer’s age to social norm influence was
not found.
Keywords
Customer Retention, Social Norms, Credence Goods, Culture Value
Orientation, Theory of Planned Behaviour, Idiocentric, Allocentric
© 2014 University of Pretoria. All rights reserved. The copyright in this work vests in the University of Pretoria.
P a g e | iv
Declaration
I declare that this research project is my own work. It is submitted
in partial fulfilment of the requirements for the degree of Master of
Business Administration at the Gordon Institute of Business
Science, University of Pretoria. It has not been submitted before
for any degree or examination in any other University.
I further declare that I have obtained the necessary authorisation
and consent to carry out this research.
Trent Ryan Lockstone
11 November 2013
© 2014 University of Pretoria. All rights reserved. The copyright in this work vests in the University of Pretoria.

P a g e | v
Acknowledgements
I would like to thank:
- My wonderful wife, Jodi Megan, for her endless support, motivation and
guidance. She has always been my rock and my safe place.
- My two beautiful children, Gabriel and Sarah, who always understood
why I had to spend so much time working. They made all the hard work
worthwhile.
- Clive Corder, my supervisor, for guiding me through this process.
- Sean O’Keeffe, my mentor, for believing in me from the very beginning.
© 2014 University of Pretoria. All rights reserved. The copyright in this work vests in the University of Pretoria.
P a g e | vi
Table of Contents
Chapter 1: Definition of Problem and Purpose ................................................... 1
1.1 Research Title ........................................................................................... 1
1.2 Background to Research Problem ............................................................ 1
1.3 Research Problem .................................................................................... 2
1.4 Research Aims.......................................................................................... 3
1.5 Research Objectives ................................................................................. 4
1.6 Research Scope ....................................................................................... 5
Chapter 2: Theory and Literature Review .......................................................... 6
2.1 Introduction ............................................................................................... 6
2.2 Customer Retention .................................................................................. 8
2.3 Theory of Planned Behaviour ................................................................. 12
2.4 Social Norms........................................................................................... 16
2.5 Linking Social Norms and Customer Retention ...................................... 17
2.6 Personal Characteristics Impacting Normative Influence ........................ 17
2.7 Culture Orientation Value and Normative Behaviour .............................. 21
2.8 Credence Goods ..................................................................................... 23
2.9 Chapter Conclusion ................................................................................ 24
Chapter 3: Research Hypotheses .................................................................... 27
Chapter 4: Research Methodology and Design................................................ 32
4.1 Introduction ............................................................................................. 32
4.2 Population ............................................................................................... 32
4.3 Sampling Frame ...................................................................................... 33
© 2014 University of Pretoria. All rights reserved. The copyright in this work vests in the University of Pretoria.

P a g e | vii
4.4 Sampling and Size of Sample ................................................................. 33
4.5 Rationale for the Proposed Methods ....................................................... 34
4.6 Questionnaire Design ............................................................................. 35
4.7 Data Collection........................................................................................ 36
4.8 Quality Controls ...................................................................................... 36
4.9 Validity and Reliability ............................................................................. 36
4.11 Data Processing .................................................................................... 37
4.12 Data Analysis ........................................................................................ 38
4.13 Research Limitations ............................................................................ 41
Chapter 5: Results ........................................................................................... 42
5.1 Introduction ............................................................................................. 42
5.2 Normality of Data .................................................................................... 42
5.3 Factor Analysis of Social Norms ............................................................. 44
5.4 Demographic Profile of Sample .............................................................. 47
5.5 Reliability Results .................................................................................... 49
5.6 Summary of Responses .......................................................................... 52
5.7 Results of Hypothesis Testing ................................................................ 59
5.8 Chapter Summary ................................................................................... 66
Chapter 6: Discussion of Results ..................................................................... 67
6.1 Introduction ............................................................................................. 67
6.2 Hypotheses Results and Discussion ....................................................... 68
Chapter 7: Conclusion ...................................................................................... 73
7.1. Introduction ............................................................................................ 73
© 2014 University of Pretoria. All rights reserved. The copyright in this work vests in the University of Pretoria.

P a g e | viii
7.2. Summary of Key Findings ...................................................................... 73
7.3. Recommendations and Managerial Implications.................................... 74
7.4 Future Research ..................................................................................... 76
References ....................................................................................................... 77
Appendices ......................................................................................................... I
Appendix 1: Questionnaire Design .................................................................. I
Appendix 2: Questionnaire: ............................................................................ IV
Table of Figures
Figure 1: Diagrammatic Overview. ..................................................................... 7
Figure 2: Impact on Profits When Increasing Customer Retention. .................... 9
Figure 3: Theory of Planned Behaviour (Source: Ajzen 1991, p. 182). ............ 14
Figure 4: Normative Impact on Intention to Defect. .......................................... 15
Figure 5: Moderating Effects of Gender - Structural Model for Females .......... 19
Figure 6: Moderating Effects of Gender - Structural Model for Males .............. 20
Figure 7: Expanded Research Conceptual Model Adapted from Ajzen (1991). 26
Figure 8: Histogram of Social Norm Scores ..................................................... 53
Figure 9: Research Conceptual Model Adapted from Ajzen (1991) ................. 67
List of Tables
Table 1: Hypothesis 1 Link to Literature ........................................................... 28
Table 2: Hypothesis 2 Link to Literature ........................................................... 29
© 2014 University of Pretoria. All rights reserved. The copyright in this work vests in the University of Pretoria.

P a g e | ix
Table 3: Hypothesis 3 Link to Literature ........................................................... 30
Table 4: Hypothesis 4 Link to Literature ........................................................... 30
Table 5: Shapiro-Wilk W Test of Normality - Active .......................................... 43
Table 6: Shapiro-Wilk W Test of Normality - Inactive ....................................... 43
Table 7: KMO and Bartlett's Test ..................................................................... 44
Table 8: Factor Analysis - Component Matrix .................................................. 45
Table 9: Factor Analysis - Variance Explained - Active .................................... 46
Table 10: Factor Analysis - Variance Explained - Inactive ............................... 47
Table 11: Frequency of Gender Distribution – Active ....................................... 47
Table 12: Frequency of Gender Distribution - Inactive ..................................... 48
Table 13: Frequency of Age Distribution - Active ............................................. 48
Table 14: Frequency of Age Distribution - Inactive ........................................... 48
Table 15: Reliability Statistics for Norms .......................................................... 49
Table 16: Reliability Statistics for Norms .......................................................... 50
Table 17: Reliability Statistics for Norms if Item Deleted - Active ..................... 51
Table 18: Descriptive Statistics for Sample and Social Norms Score .............. 53
Table 19: Frequency of Cultural Value Orientation - Active ............................. 55
Table 20: Frequency of Cultural Value Orientation - Inactive ........................... 55
Table 21: Descriptive Statistics for CVO and Social Norms Score - Active ...... 56
Table 22: Descriptive Statistics for CVO and Social Norms Score - Inactive ... 56
Table 23: Descriptive Statistics for Age and Social Norms Score - Active ....... 57
Table 24: Descriptive Statistics for Age and Social Norms Score - Inactive ..... 57
© 2014 University of Pretoria. All rights reserved. The copyright in this work vests in the University of Pretoria.

P a g e | x
Table 25: Descriptive Statistics for Gender and Social Norms Score - Active .. 58
Table 26: Descriptive Statistics for Gender and Social Norms Score - Inactive 58
Table 27: Hypotheses and Applied Statistical Test .......................................... 59
Table 28: Hypothesis 1 Test Summary ............................................................ 60
Table 29: Independent-Samples Mann-Whitney U Test for Injunctive Norms .. 61
Table 30: Independent-Samples Mann-Whitney U Test for Descriptive Norms 61
Table 31: Hypothesis 2 Test Summary ............................................................ 63
Table 32: Mann-Whitney Test for Gender and Social Norms ........................... 64
Table 33: Hypothesis 4 Test Summary - Kruskal Wallis Test Statistics ........... 65
Table 34: Results of Statistical Tests on Hypotheses ...................................... 66
© 2014 University of Pretoria. All rights reserved. The copyright in this work vests in the University of Pretoria.
P a g e | 1
Chapter 1: Definition of Problem and Purpose
1.1 Research Title
Influencing customer retention for low-consumption credence goods through
social norms
1.2 Background to Research Problem
Clare (2007) believes that a business’ purpose is to make profit; but he further
stated that the second and third priority for any business was customer
acquisition and customer retention. Customer retention has become a major
focus of service providers (Evans, 2002). A primary reason for this focus has
been the highly competitive nature of the services industry and the ethical
requirements expected from that industry. Because of the ethical requirements,
institutions like insurers have found it increasingly difficult to compete on price
(Alrubaiee, 2012). The price for their financial service offerings has been
directly impacted by the costs of acquiring and retaining clients. This has in turn
been exacerbated by the fact that many of these services are credence goods,
for which the consumer is unable to evaluate the appropriateness of the service
being offered even after use.
Van den Poel and Larivière (2004) show that increasing the retention rate of
existing customers by one percentage point would result in a substantial
increase in profitability. As stated in Benoit and Van den Poel (2012), most
financial services organisations consider customer retention their highest
© 2014 University of Pretoria. All rights reserved. The copyright in this work vests in the University of Pretoria.

P a g e | 2
priority, as the longer the customer stays with the organisation the more
profitable it is. Based on this type of research and the high level of competitive
pressure, companies have recognised that their most valuable asset is their
existing customer base. Even with this focus on retention, service providers are
struggling to keep their customers. According to statistics for 2011 released by
ASISA, the representative body of the life insurance industry within South
Africa, customer retention rates of insurance products decreased by 12%
compared with the previous year; and that trend has perpetuated (ASISA,
2012).
1.3 Research Problem
A main aspect of customer retention is customer satisfaction; an aspect that has
been prolifically researched (Gustafsson, Johnson, & Roos, 2005; Johnson &
Fornell, 1991; Mittal & Kamakura, 2001). However, Keaveney & Parthasarathy
(2001) reported that there was a need to consider causes affecting retention
beyond just dissatisfaction.
Evans (2002) highlights the need for further research on retention by identifying
the sparseness of churn management programmes and how powerful they
would be if implemented. Evans (2002) stresses the need to identify actual and
potential reasons for defection and take specific action on these.
Bansal, Taylor, and St. James (2005) found social influence, or subjective
norms, could play a significant role in customer retention, but only limited
research on the impact of subjective norms in customer-switching was found in
© 2014 University of Pretoria. All rights reserved. The copyright in this work vests in the University of Pretoria.
P a g e | 3
the literature. Nitzan & Libai (2011) agree with Bansal et al. (2005), in finding
an absence of research focussed on the social influence of customer retention
and highlighted the need for additional research in this field. Based on this, it is
imperative to further this area of study.
Lee, Murphy, and Neale (2009) found that when researching the link between
norms and customer retention one needs to include the manner in which the
service is being consumed. They postulated that people were likely to consume
products differently and one could be misguided if one did not take account of
consumption characteristics. Lee et al. (2009) studied the interactions of high
consumption characteristics on social norms and they stated that future
research should be done on other moderating consumption characteristics. In
their 2009 study they found that there had been no other studies conducted on
the interaction between norms and consumption.
1.4 Research Aims
This research is designed to add to the body of literature on customer retention
by focussing on the fundamental question, ‘If a consumer has an important
service such as insurance, which is not overtly known by his social network, is
he still influenced by social norms?’ This will be done by investigating whether
there may be a relationship between social norms and customer retention for
credence goods. According to White, Smith, Terry, Greenslade and McKimmie
(2009), one is not able to investigate social norms without understanding how
culture value orientation interacts with norms; therefore, the aim in this research
© 2014 University of Pretoria. All rights reserved. The copyright in this work vests in the University of Pretoria.

P a g e | 4
is also to provide understanding of this aspect. A further aim is to address
questions raised by Lee et al. (2009), on how personal characteristics such as
age and gender impact the norm-loyalty association of clients. These aspects
have been included as research shows the link to social norms. In order to
understand how customer retention can be influenced by social norms, it is
important to understand how one can maximise this social norm influence.
Studies have been conducted on customer retention for experiential goods
which are high-consumption, enjoyable services such as cellular airtime (Bansal
et al., 2005; Lee et al., 2009; Nitzan & Libai, 2011) but none have been found
on credence goods which are low-consumption, low enjoyment but important
services, such as insurance.
For insurance service providers, the findings of this study would assist
managers recognise the role of social influences in customer loyalty. As
illustrated, customer retention in the insurance industry is a primary concern.
Understanding how consumers are influenced by norms and which customer
characteristics strengthen social norm influence would help these service
providers create marketing strategies to target existing and new customers.
1.5 Research Objectives
Objectives formulated to provide form to this study include the assessment of
whether:
Social norms impact customer retention in credence services;
© 2014 University of Pretoria. All rights reserved. The copyright in this work vests in the University of Pretoria.

P a g e | 5
The level of influence changes based on personal characteristics, such
as age and gender;
Allocentric individuals are more likely to be influenced by social norms for
credence services than idiocentric individuals.
1.6 Research Scope
The general focus of this study is the financial services sector and, more
specifically, the short-term insurance industry. The scope of this study is how
one can influence customer retention for low-consumption credence goods
through social norms; since the industry’s success depends on the customer
viewing the industry offerings as being important to them.
© 2014 University of Pretoria. All rights reserved. The copyright in this work vests in the University of Pretoria.

P a g e | 6
Chapter 2: Theory and Literature Review
2.1 Introduction
Research has been conducted on how social norms impact customer retention
and how consumption relates to this, but the focus of this research is on
experience goods. However, as mentioned above, the researcher found no
study focussed on credence goods.
This Chapter provides an overview of the literature applicable to customer
retention and social norms. Initially addressed is the underlying theory to which
this research will be contributing, namely customer retention. The concept of
customer retention, as it is defined by different authors, is presented to show its
importance and the manner in which it relates to customer behaviour. The
Theory of Planned Behaviour (TPB), which is the primary framework associated
with predicting customer behaviour, is then described. That is followed by a
review on what various authors believe to be a weakness of the TPB,
specifically in connection with subjective norms. The area of subjective norms
is then considered in its own right. Following this, an understanding of social
norms, of which subjective norms is an element, is given and the manner in
which aspects raised in the literature impact social norms, namely personal
characteristics and culture value orientation. Finally, the researcher reviews
literature with regard to applied products, specifically credence goods with low-
consumption. A diagrammatic overview of this review is presented in Figure 1.
© 2014 University of Pretoria. All rights reserved. The copyright in this work vests in the University of Pretoria.

P a g e | 7
Figure 1: Diagrammatic Overview.
Retention
Theory of Planned
Behaviour
Social Norms
(Descriptive and Injunctive)
Culture value
orientation
Applied Product
Influence of personal
characteristics on
social norms
© 2014 University of Pretoria. All rights reserved. The copyright in this work vests in the University of Pretoria.
P a g e | 8
2.2 Customer Retention
2.2.1 What is Customer Retention?
Customer retention is the future propensity of a customer to stay with the
service provider (Ranaweera & Prabhu, 2003).
As stated in Gerpott, Rams, and Schindler (2001), customer retention is
primarily about maintaining a business relationship that had been established
between a service provider and a customer. This retention could be achieved
by future purchases or by the customer extending their contract with the
supplier. As there were no clear threshold values as to the duration that the
customer would need to extend the contract or continue with future purchases
in order to be considered retained, retention was seen as a continuous variable
which could consist of different variables over time (Gerpott et al., 2001).
Nitzan and Libai (2011) identified several drivers of customer retention, namely:
customer satisfaction, usage patterns, customer tenure, personal
characteristics, such as age and gender, and social influence.
2.2.2. The Importance of Customer Retention
Research by Reichheld and Sasser Jr. (1990) indicated that customer defection
rates were a lead indicator regarding a company’s profitability. They further
illustrated that by increasing customer retention by 5% a company’s profits
could increase by up to 85%. The reasoning behind this increase in profitability
was due to five factors: (1) The high costs of acquiring a new customer was
© 2014 University of Pretoria. All rights reserved. The copyright in this work vests in the University of Pretoria.

P a g e | 9
reduced by retaining customers; (2) The longer the customer was with the
company, the greater the revenues generated would be; (3) Established
customers required less employee attention as they were more familiar with the
company’s process; (4) Long-term customers provided more referrals than new
customers; (5) Long-term customers were less price sensitive as they were
more loyal and were prepared to pay a premium (Reichheld & Sasser, 1990).
These five factors are illustrated in Figure 2.
Figure 2: Impact on Profits When Increasing Customer Retention.
Source: Reichheld (1996).
Similarly to that of Reichheld and Sasser (1990), Zeithaml (2000) proposed that
customer retention leads to an organisation increasing profits in the following
ways: reducing costs to service customers, having the ability to charge higher
prices, increasing sales through word of mouth, and increasing the volume of
purchases. Beatty, Mayer, Coleman, Reynolds, and Lee (1996) found that
© 2014 University of Pretoria. All rights reserved. The copyright in this work vests in the University of Pretoria.
P a g e | 10
companies that formed a good relationship with their customers enjoyed higher
sales, lower cost-per-transaction, and greater word-of-mouth recommendation.
The link between customer retention and increasing profits had been shown in
many other research papers (Reichheld & Markey Jr., 2000; Van den Poel &
Larivière, 2004). However, East, Hammond, and Gendall (2006) disagreed with
that commonly held belief. They were of the opinion that increased tenure did
not necessarily translate into increased profits and focus should rather be on
the correct acquisition of customers. In their paper East et al. (2006)
commented negatively on the findings of Reichheld and Sasser (1990), and this
they did mainly through illustrating how specific industries did not benefit as
much as was believed. One may question whether the rationale provided by
East et al. (2006) was not comprehensive enough. In their attempt to shift focus
from retention to acquisition, the East et al. (2006) failed to address a
fundamental aspect of retention, that of advocacy. Samson (2006) suggested
that the correlation between consumer advocacy and business growth was
becoming a well-established fact. Similarly to East et al. (2006), Sharp (2008)
also questioned this view of Reichheld and Sasser (1990) by illustrating that
when the authors mentioned a 5% increase in customer retention they were in
fact referring to a 5% reduction in the customer attrition rate, which sat at 10%
in their specific example. This meant that the company would need to halve its
attrition rate (Sharp, 2008), which was extremely difficult to do. However, whilst
reducing attrition rates by this level is not easy, one cannot ignore the influence
© 2014 University of Pretoria. All rights reserved. The copyright in this work vests in the University of Pretoria.

P a g e | 11
customer retention has on profits. It is therefore important to understand why
customers switch between businesses. Reinartz, Thomas, and Kumar (2005)
showed that inadequate provision of resources into retaining existing customers
would have a greater impact on long-term customer profitability as compared to
inadequate provision of resources into customer acquisition efforts.
2.2.3. How can Customer Retention be Achieved?
Gerpott, Rams, and Schindler (2001) postulated that customer retention could
be achieved in two ways: Firstly, the customer may have continued the
relationship involuntarily because they were prevented, for various reasons,
from terminating it. Secondly, the customer may have continued the relationship
because they had a favourable attitude towards the service provider and
because they wanted to keep the business relationship going for their common
benefit.
As highlighted earlier, the largest body of research into customer retention has
focussed on customer satisfaction. While a customer’s satisfaction with regard
to a physical product can be measured by matching the physical attributes and
specifications of the physical product, the suitability of a service could only be
measured through the customer’s perception of that service (Rust & Tuck Siong
Chung, 2006). The authors explained that, based on the Theory of Expectancy
Disconfirmation, the main determinant of satisfaction was the difference
between what the customer expected and what the customer received. It may
be argued that the Theory of Expectancy Disconfirmation was suitable for
© 2014 University of Pretoria. All rights reserved. The copyright in this work vests in the University of Pretoria.

P a g e | 12
experience and search goods but did not describe what influences customer
satisfaction for credence goods. This meant when managing customer
satisfaction for credence goods compared with managing customer satisfaction
for product providers, there was a greater need to manage customer’s
behaviour and perceptions.
2.3 Theory of Planned Behaviour
Based on the previous paragraph reflecting on the need to manage customer’s
behaviour and perceptions in order to manage customer retention when looking
at credence goods, it is important to understand what influences an individual’s
behaviour.
2.3.1 What is the Theory of Planned Behaviour
Research regarding social influence when in the context of the connection
between individual’s attitudes and their behaviour has been conducted primarily
within the frameworks of the theories of reasoned action (Fishbein & Ajzen,
1975) and planned behaviour (Ajzen, 1991). In both of these models, the
concept of subjective norms denotes social influence. The Theory of Planned
Behaviour stresses the important influence that normative perceptions have on
behavioural intentions and behaviour, this reaffirms previous literature linking
norms and customer retention.
The Theory of Planned Behaviour (TPB) is one of the most frequently cited
models applied for predicting social behaviour (Ajzen, 2011). Manning (2011)
© 2014 University of Pretoria. All rights reserved. The copyright in this work vests in the University of Pretoria.
P a g e | 13
reiterates that the TPB is one of the most widely used models incorporating the
influence of normative perceptions on behaviour.
The concept of the TPB is to understand what drives one’s behaviour. Ajzen
(1991) stated that an individual’s intention to perform a behaviour is a vital
factor in the Theory of Planned Behaviour. By understanding intentions, one is
able get an indication of how hard an individual is willing to try in order to
perform a behaviour.
A finding of Ajzen (1991) was that the proximal determinant of one’s behaviour
is ones intention to perform the behaviour. The stronger the intention, the more
likely an individual is to be motivated to perform the behaviour. Simply put,
behavioural intention predicts behaviour. Ajzen (1991) posited that intention is
determined by three constructs: one’s attitude toward the behaviour, one’s
sense of subjective norms, and one’s perception of the control one has over
performing the behaviour (PBC) – which includes the influence of both internal
and external areas of control. The TPB is illustrated in Figure 3.
© 2014 University of Pretoria. All rights reserved. The copyright in this work vests in the University of Pretoria.

P a g e | 14
Figure 3: Theory of Planned Behaviour (Source: Ajzen 1991, p. 182).
2.3.2 TPB and Normative Behaviour
Cialdini, Reno, and Kaligren (1990) showed that perceived norms had a
substantial impact on human action. However, the impact could only be
properly recognised by separating two types of norms: injunctive norms and
descriptive norms. This has been seen as a weakness in the TPB, in which
only injunctive norms are accounted. This weakness was highlighted by
Norman, Clark, and Walker (2005), who argued that the average correlation
between subjective norm and intention was considerably weaker than the
average correlations achieved by the attitude and perceived behavioural
constructs; however this was dependent on the behaviour and the population
being studied. Norman et al. (2005) postulated that the weak correlation could
be caused by too much reliance on a single normative pressure, with that being
© 2014 University of Pretoria. All rights reserved. The copyright in this work vests in the University of Pretoria.

P a g e | 15
subjective norms. They proposed that by including descriptive norms into the
TPB one would be able to strengthen the correlation of normative behaviour
and intention. Lee et al. (2009) identified that by adding descriptive norms to
the TPB one is able to improve the TPB’s predicative ability. They found that “a
combined subjective and descriptive norm was about twice as strong as attitude
and thrice as strong as PBC in relating to intended loyalty” (Lee et al., 2009, p
279). Lee at al. (2009) also found conflicting influences in the addition of
descriptive norms into the TPB, stating that the inclusion of both norms should
be done dependent on the type of consumption and the service being used.
Figure 4 illustrates the inclusion of descriptive norms into the TPB. Based on
this finding, this research included both subjective and descriptive norms when
attempting to ascertain a link between norms and retention.
Figure 4: Normative Impact on Intention to Defect.
The TPB illustrates how norms influence social behaviour; Lee et al. (2009)
postulated that subjective and descriptive norms could similarly influence
consumer behaviour, particularly customer loyalty.
Subjective Norm
Descriptive
Norm
Intention to
defect
Defection
© 2014 University of Pretoria. All rights reserved. The copyright in this work vests in the University of Pretoria.

P a g e | 16
2.4 Social Norms
As determined by Manning (2011), social psychological research has
demonstrated that people behave in line with normative expectations and
observations. This view was supported by White et al. (2009), who suggested
that one of social psychology’s central subjects was the study of the impact of
social norms upon behaviour.
2.4.1 Defining Social Norms
Berkowitz (2004) highlighted two different types of norms. The first type
referred to attitudes or what a person felt was correct based on morals or
beliefs. These were injunctive norms. A subjective norm was a social injunctive
norm which involved perceptions of what significant others approved of or
thought one should have done. Manning (2011, p. 352) defined subjective
norms as, ‘perceptions of the extent to which relevant others want you to
engage in the behaviour weighted by the extent to which you are motivated to
comply with the injunctions of those relevant referents’. White et al. (2009)
explained that social injunctive norms encouraged one to take action by
emphasising the potential rewards and punishments within ones social
environment for taking or not taking the action.
A second type of norm was concerned with the actual behaviour of a person.
These were descriptive norms. Descriptive norms were based on what one
observed others doing. White et al. (2009, p.137) defined descriptive norms as,
© 2014 University of Pretoria. All rights reserved. The copyright in this work vests in the University of Pretoria.

P a g e | 17
to ‘reflect the perception of whether other people perform the behaviour in
question.’
2.5 Linking Social Norms and Customer Retention
The finding of Bansal et al. (2005) was that subjective norms have played an
important role in people migration and that migration literature can be used to
understand customers migrating between service providers. Tsuda (1999), as
cited in Bansal et al. (2005), found that significant others played an significant
role in decisions to migrate, whether this is physical migration, or service
migration. For these reasons, when researching customer retention, it is
important to understand social norms.
The following hypothesis will test if there is a link between social norms and
customer retention:
H10: Social norms do not influence customer retention of important low-
consumption services
H1A: Social norms have an influence on customer retention of important low-
consumption services
2.6 Personal Characteristics Impacting Normative Influence
According to Baumann, Burton, and Elliott (2005), personal characteristics such
as age and gender had an impact on customer retention, with older female
clients being more loyal.
© 2014 University of Pretoria. All rights reserved. The copyright in this work vests in the University of Pretoria.

P a g e | 18
2.6.1 How Age Influences Social Norms
Martin & Bush (2000) explained younger consumers were particularly
susceptible to social pressure when consumption of a service was done through
a group, such as mobile services. Lee at al. (2009) agreed that younger
consumers were especially susceptible to social influences.
Milner & Rosenstreich (2013) conducted research on financial services, and
they found that older consumers were more likely to use credence goods,
especially those of financial services. As such, it is possible that older
customers are more comfortable with using a service in which they rely on the
expertise of others and will not be as influenced by social norms as younger
customer.
The hypothesis below was used to test these findings;
H20: Younger consumers and older consumers show no or little difference on
being influenced by social norms
H2A: Younger consumers are significantly more influenced by social norms than
older consumers
2.6.2 How Gender Influences Social Norms
Putrevu (2001) identified gender as being one of the most utilised forms of
segmentation in marketing practice. Nysveen, Pedersen, and Thorbjørnsen
(2005) established three reasons why gender is frequently used to segment
within marketing strategy. Firstly, gender was easy to identify and was
© 2014 University of Pretoria. All rights reserved. The copyright in this work vests in the University of Pretoria.

P a g e | 19
accessible. Secondly, gender segments could be measured and were
responsive to the elements of the marketing mix.
Lastly, gender segments were large and profitable.
In their research, Nysveen et al. (2005) found that while male respondents
perceive little social pressure towards using mobile services, they still
considered social and personal identity when using these services. Female
users were influenced by normative pressure, resulting in it being a significant
driver of intention to use these services.
Figure 5 and Figure 6 illustrate the findings of Nysveen et al. (2005) on the
differences between gender; specifically looking at cellular services. As one can
see, females are significantly more impacted by social norms compared with
males.
Figure 5: Moderating Effects of Gender - Structural Model for Females
Source: Nysveen et al. (2005, p. 252).
© 2014 University of Pretoria. All rights reserved. The copyright in this work vests in the University of Pretoria.

P a g e | 20
Figure 6: Moderating Effects of Gender - Structural Model for Males
Source: Nysveen et al. (2005, p. 252).
In order to test this, the following hypotheses will be tested:
H30: Female consumers and male consumers show no or little difference on
being influenced by social norms
H3A: Female consumers are significantly more influenced by social norms than
male consumers
The aim in this study is to ascertain whether older consumers are also
susceptible to social influences and to understand whether this differs based on
the consumer’s gender.
© 2014 University of Pretoria. All rights reserved. The copyright in this work vests in the University of Pretoria.

P a g e | 21
2.7 Culture Orientation Value and Normative Behaviour
White et al. (2009) found that the stronger one’s collective self, was the greater
it would influence the relationship between the social injunctive norm–intention
and the personal injunctive norm–intention. They stated that individuals with a
strong sense of collective self would be more influenced by subjective norms.
Fischer et al. (2009) also stated that the link between the individualism and
collectivism constructs and normative behaviour was strong. Based on this
finding, it is valuable to understand what collectivism is and how it differs from
individualism.
2.7.1 Individualism vs Collectivism
Triandis (2001) identified collective societies as those societies that emphasised
the views, needs and goals of the multitude rather than the self. He also found
that collectivist cultures are particularly concerned with relationships. He
proposed that individualists place less importance on their in-groups and
prioritise their personal goals over that of their in-group.
Triandis (1989) as cited in White et al. (2009) argued that individualistic people
are generally influenced by personal goals, whereas collectivists have a greater
likelihood of being predisposed to the norms and values of the in-group
The four defining attributes of the constructs of individualism and collectivism
are: definition of self; how an individual relates to others; structure of the goals
the individual follows; and the concerns that drive their behaviour (Singelis &
Triandis, 1995). First, individuals could define themselves based on their
© 2014 University of Pretoria. All rights reserved. The copyright in this work vests in the University of Pretoria.

P a g e | 22
individual attributes or they could define themselves as interdependent with the
in-group. Second, individuals relate to others in either an emotional and social
manner or in a rational manner. Third, individualistic cultures have goals that
are less based on the goals of the community and more based on the goals of
the individual. Fourth, collectivistic cultures have individuals who are generally
guided by group norms (Fischer et al., 2009).
2.7.2 Idiocentrics and Allocentrics
The constructs of collectivism and individualism refer to societies. The terms
idiocentrism and allocentrism are used to describe individuals within society
(Triandis, Bontempo, Villareal, Asai, & Lucca, 1988). Idiocentrics see
themselves as separate from others and prioritise their personal goals, whereas
allocentrics see themselves as part of society and prioritise the collectives’
goals (Chen, Arzu Wasti, & Triandis, 2007). According to Triandis et al. (1988),
idiocentric people would do things that suited themselves with disregard for their
communities and families, whereas allocentric people were more concerned
about their communities and families.
Allocentric people would find their behaviour governed more by social norms. It
is therefore important to identify whether an individual is allocentric or
idiocentric, as this will have an impact on the strength of the social norm
influence on customer retention. Triandis (2001) agreed that social norms are
important to allocentrics; he stated that allocentrics enjoyed doing what their in-
groups expected them to do, which strongly correlated with injunctive norms.
© 2014 University of Pretoria. All rights reserved. The copyright in this work vests in the University of Pretoria.

P a g e | 23
Based on this, the following hypothesis will be tested:
H40: Allocentric consumers and idiocentric consumers show no or little
difference on being influenced by social norms.
H4A: Allocentric consumers are significantly more influenced by social norms
than idiocentrics
2.8 Credence Goods
In their seminal paper Darby and Karni (1973) introduced the term credence
goods, adding it to Phillip Nelson’s classification of search and experience
goods (Nelson, 1970). Darby and Karni (1973) postulated that credence goods
were goods that could not be evaluated in normal use, compared with search
goods, which had the qualities that could be ascertained prior to the purchase of
the service, during the search process. Experience goods had the qualities that
could be ascertained only during product use. Howden and Pressey (2008)
expanded on this description by establishing that, due to the technical
complexity of certain services, the need existed for them to be sold within
relationships where the seller determined the customer’s requirements.
Professional services such as accounting, legal and insurance were examples
of credence goods.
2.8.1 Consumption Characteristics
Considering that the focus of this paper is on low-consumption services, it is
befitting that literature on consumption characteristics is reviewed.
© 2014 University of Pretoria. All rights reserved. The copyright in this work vests in the University of Pretoria.

P a g e | 24
Product and service consumption has been seen as a key indicator in the
prediction of customer retention. Nitzan and Libai (2011) illustrated that a
decrease in customer consumption of a service typically served as a key signal
of their eventual defection.
The consumption characteristics of a service or product impact the manner in
which normative behaviour impacts the continuation or discontinuation of the
product or service. Lee et al. (2009) stated that consumption characteristics
must be taken into account when analysing the impacts of normative behaviour
on customer retention. In their 2009 study, Lee at al. investigated two
consumption characteristics, namely perceived product enjoyment and product
importance.
2.9 Chapter Conclusion
This review commenced by considering the topic of customer retention. While
scholars do differ in their views on the importance of this element, the majority
of studies do reveal a benefit in improving this aspect of an organisation. The
main body of literature on customer retention is focussed on customer
satisfaction and - more specifically - on search and experience goods and
services. However, there is a growing need to study credence goods. As
organisations continue to create complex services, specifically within the
financial service industry, credence goods will become more important to
organisation sustainability. In order to understand customer retention for
credence goods, one needs to understand consumer behaviour as this is often
© 2014 University of Pretoria. All rights reserved. The copyright in this work vests in the University of Pretoria.

P a g e | 25
the only indicator of customer satisfaction for a service offering where the
customer does not know if it met their expectations.
Consumer behaviour literature including the Theory of Planned Behaviour
(TPB) highlights that one of the key aspects guiding behaviour is social norms.
Many studies were found that questioned the predictive power of the normative
aspect of the TPB and illustrated that descriptive norms needed to be added to
the original subjective norm within the theory. The review then looked at what
social norms are and what influences them. Two key influences were identified,
culture orientation and personal characteristics. Studies showed that allocentric
consumers should be more susceptible to social norms than idiocentric
consumers. It was also postulated that younger consumers were also
influenced more by social norms than older consumers; however tests for this
were not found in any of the literature. While literature was found on studies of
the impact of social norms on search and experience goods, none was found on
credence goods. The importance of researching credence goods was
highlighted by illustrating the impact the product enjoyment, importance and
tenure had on customer retention.
The model presented in Figure 7 diagrammatically shows the purpose of this
research. Based on the TPB, we understand that subjective norms influence
ones intentions which in turn influences ones behaviour. Following literature
presented in Chapter 2, this research attempts to ascertain if subjective and
descriptive norms influence customer loyalty when an important credence good
© 2014 University of Pretoria. All rights reserved. The copyright in this work vests in the University of Pretoria.

P a g e | 26
is involved. It then investigates if Culture Value Orientation and personal
characteristics influence these norms. This model can be used by organisations
in predicting and influencing customer retention.
Important Credence goods as a
moderator
Perceived
Behavioural
Control
Attitude
Allocentrism vs
Idiocentrism
Intention
Personal
Characteristics
Subjective
Norm
Descriptive
Norm
Customer
Loyalty
Behaviour
Figure 7: Expanded Research Conceptual Model Adapted from Ajzen (1991).
© 2014 University of Pretoria. All rights reserved. The copyright in this work vests in the University of Pretoria.

P a g e | 27
Chapter 3: Research Hypotheses
Zikmund (2003 p. 44) describes a hypothesis as, “a proposition that is
empirically testable. It is an empirical statement concerned with the relationship
among variables’. In order to explore the influence of social norms on retention
the following hypotheses, which have were from the literature, were formulated:
Hypothesis 1:
H10: Social norms do not influence customer retention of important low-
consumption services
H1A: Social norms have an influence on customer retention of important low-
consumption services
Considering that the service that this research is investigating are generally
unknown to the social network of the customer, the null hypothesis states that
there is no significant link between social norms and customer retention for
important low-consumption services. The alternative hypothesis states that a
significant link exists between social norms and customer retention for important
low-consumption services.
© 2014 University of Pretoria. All rights reserved. The copyright in this work vests in the University of Pretoria.

P a g e | 28
Table 1 below provides a link between the literature review and the hypothesis
being tested.
Table 1: Hypothesis 1 Link to Literature
Link to literature review
Authors
Ajzen (1991)
Bansal et al., (2005)
Cialdini et al., (1990)
Lee et al., (2009)
Manning (2011)
Norman et al., (2005)
Nitzan & Libai (2011)
Hypothesis 2:
H20: Younger consumers and older consumers show no or little difference on
being influenced by social norms
H2A: Younger consumers are significantly more influenced by social norms than
older consumers
The null hypothesis stated that there is little or no difference between age
groups when looking at the influence of social norms. The alternative
hypothesis stated that there is a significant difference between age groups
when looking at the influence of social norms.
© 2014 University of Pretoria. All rights reserved. The copyright in this work vests in the University of Pretoria.

P a g e | 29
Table 2 below provides a link between the literature review and hypothesis 2.
Table 2: Hypothesis 2 Link to Literature
Link to literature review
Authors
Baumann et al., (2005)
Lee et al., (2009)
Milner & Rosenstreich (2013)
Hypothesis 3:
H30: Female consumers and male consumers show no or little difference on
being influenced by social norms
H3A: Female consumers are significantly more influenced by social norms than
male consumers
The null hypothesis stated that there is little or no difference between gender
groups when looking at the influence of social norms. The alternative
hypothesis stated that there is a significant difference between gender groups
when looking at the influence of social norms.
© 2014 University of Pretoria. All rights reserved. The copyright in this work vests in the University of Pretoria.

P a g e | 30
Table 3 below provides a link between the literature review and hypothesis 3.
Table 3: Hypothesis 3 Link to Literature
Link to literature review
Authors
Baumann et al., (2005)
Nysveen et al. (2005)
Hypothesis 4:
H40: Allocentric consumers and idiocentric consumers show no or little
difference on being influenced by social norms.
H4A: Allocentric consumers are significantly more influenced by social norms
than idiocentrics
The null hypothesis stated that there is little or no difference between
allocentrics and idiocentrics when looking at the influence of social norms.
The alternative hypothesis stated that there is a significant difference between
allocentrics and idiocentrics when looking at the influence of social norms.
Table 4 below provides a link between the literature review and hypothesis 4.
Table 4: Hypothesis 4 Link to Literature
Link to literature review
Authors
Bansal et al., (2005)
Fischer et al., (2009)
Triandis (2001)
White et al., (2009)
© 2014 University of Pretoria. All rights reserved. The copyright in this work vests in the University of Pretoria.

P a g e | 31
The hypotheses provided above have been chosen on the basis that they allow
for deeper exploration of the influence of social norms on retention of insurance
customers. They will also allow for comparisons on the influence of the two
areas also being tested in this study, that being personal characteristics and
cultural value orientation. This will allow one to ascertain if social norms impact
customer retention and, if so, can one identify customers who would be more
susceptible to social norms.
© 2014 University of Pretoria. All rights reserved. The copyright in this work vests in the University of Pretoria.

P a g e | 32
Chapter 4: Research Methodology and Design
4.1 Introduction
This Chapter presents a discussion of the research methodology used in this
study. The research design is outlined and the reasons for the proposed
methods being chosen explained. The data collection methodology, population
and sample size are considered. Discussion of the limitations of the research
concludes the Chapter.
4.2 Population
Saunders and Lewis (2012) defined a population as, the complete set of group
members. For this study there were two population groups. The first population
group was defined as, any client of Bank A who had at least one transactional
banking account and from whom they had previously purchased an accident
and health insurance product. The insurance product was however not active,
and it must have been active for at least 6 months prior to it being made inactive
and the customer must have specifically cancelled the product. (The
cancelation must have been the customer’s choice, not an automatic
cancellation or an insufficient funds cancellation). The total population size was
48,598. This population and related sample was referred to as the inactive
group. The second population group was defined as; any client of Bank A who
had at least one transactional banking account and had previously purchased
an accident and health insurance product. The insurance product must still
have been active; it must have been active for at least six months. The total
© 2014 University of Pretoria. All rights reserved. The copyright in this work vests in the University of Pretoria.

P a g e | 33
population size was 72,010. This population and related sample was referred to
as the active group.
4.3 Sampling Frame
Saunders and Lewis (2012) defined a sampling frame as, the complete list of all
members of the total population. In this case one of the sample frames
consisted of the population who had an active accident and health insurance
policy and the other sample frame consisted of the population who no longer
had an active policy.
4.4 Sampling and Size of Sample
Saunders and Lewis (2012) defined a sample as a subgroup of the whole
population. For the purpose of this research, the systematic sampling method
was used for both sampling frames, i.e. for active policyholders and for inactive
policyholders. Systematic sampling is defined by Lewis and Saunders (2012, p.
136) as, “a type of probability sampling in which the first sample member is
selected from a sampling frame at random, using a random number”. The
balance of the sample members were selected at regular intervals from the
sampling frame.
Aspects to take account of in the selection of an appropriate sample size
include cost, timeous collection of data, and non-sampling error (Albright,
Winston, & Zappe, 2009, p. 417). Due to the population size being between
50,000 and 100,000, it was originally planned to create a sample size of 397
customers per population group. This would have provided a sampling error of
© 2014 University of Pretoria. All rights reserved. The copyright in this work vests in the University of Pretoria.

P a g e | 34
5% (Israel, 1992). In order to obtain a sample size of 794 and allowing for non-
responders and customers who could not be contacted, 1000 customers were
selected (500 active and 500 inactive policyholders). However, after two weeks
of calling, agents were only able to obtain a sample size of 100 customers from
the first population group and 100 customers from the second population group.
The reason for not obtaining additional respondents was due to the agents not
being able to contact the remaining sample members, even after multiple
attempts.
4.5 Rationale for the Proposed Methods
The aim of this study was to determine the link, if any, that social norms have
on customer retention for important low-consumption services. Many studies
have been conducted focused on customer retention and therefore a qualitative
study was not required. Based on this, this study was quantitative in design.
A cross-sectional study which allows data to be collected at a single point in
time (Zikmund, 2003) was used to address the research objective.
The relationship between social norms (independent variable) and customer
retention (dependent variable) was investigated. Following this, the relationship
between social norms and the respondents’ personal characteristics such as
age, gender and culture value orientation was investigated. The research was
purely descriptive and did not determine causality.
© 2014 University of Pretoria. All rights reserved. The copyright in this work vests in the University of Pretoria.

P a g e | 35
4.6 Questionnaire Design
The tool used to collect data was a questionnaire. Lewis and Saunders (2012,
p. 141) define a questionnaire as, “all methods of data collection in which each
potential respondent is asked to answer the same set of questions in the same
order”. In this study the questionnaire presented a number of closed questions
that were designed to test the propositions outlined in Chapter 3. To reduce
order effects, questions were ordered randomly.
Likert scales were used to gather responses. They were chosen as they are
commonly applied to measure attitude (Jamieson, 2004), and also allow for a
numerical value to be assigned to a respondent’s opinion.
The questionnaire contains three sections, namely, Demographic Profile,
Culture Value Orientation (CVO), and Normative Effects (Details of these
sections can be found in Appendix 1. The actual questionnaire can be found in
Appendix 2). The questions included in the CVO section were taken from
Triandis and Gelfand (1998). The normative questions were adapted from
Norman et al. (2005).
The design of the questionnaire allowed for the calculation of both a CVO score
and a social norm score. The scores obtained were used to group respondents
by the relevant areas.
© 2014 University of Pretoria. All rights reserved. The copyright in this work vests in the University of Pretoria.

P a g e | 36
4.7 Data Collection
A structured interview was conducted over the telephone by a team of specialist
call centre agents. The agents were provided with both samples, which totalled
1,000 customers. A telephone interview was conducted as the surveying tool
based on Díaz de Rada (2011), who highlighted the numerous advantages of
this technique in comparison to other alternatives. The advantages included:
ease of accessibility to the target market, greater sample distribution without
additional cost, and improved quality of information as the respondents feel that
this approach is more anonymous.
4.8 Quality Controls
In order to ensure the quality of the data collection, all calls were recorded and
listened to by a separate team of call centre quality control agents.
4.9 Validity and Reliability
Validity
Validity has been defined as, the extent to which a test measures what it claims
to measure (Woods & West, 2010). Saunders and Lewis (2012) emphasised
the importance of piloting a test questionnaire before its formal release. They
stated that a pilot test checked that the statements would be understood and
the responses could be accurately recorded (Saunders & Lewis, 2012 p.148-
149). Face validity was ensured by the researcher. This was done by reading
the relevant literature and extracting the dimensions applicable to the research
questions.
© 2014 University of Pretoria. All rights reserved. The copyright in this work vests in the University of Pretoria.

P a g e | 37
The questionnaire used the measurement scales designed by Triandis, who is
regarded as an authority on culture value orientation and Ajzen, who is
regarded as an expert at consumer behaviour and norms.
A pilot was conducted in order to further test the order of the questions, as well
as to avoid response errors. The piloted questionnaire was circulated to five
people, who were requested to give feedback on the clarity and sense of the
questionnaire. The feedback from the pilot survey was positive; therefore, no
changes were made to the original questionnaire.
The researcher ensured construct validity by formulating suitable items that
appropriately measured the constructs being studied and which directly related
to the objectives of the research study.
Reliability
Reliability refers to how the data collection methods and analysis were
employed to produce consistent findings (Saunders & Lewis, 2012, p. 128).
Reliability Analysis (Cronbach’s alpha)
Ensuring the reliability of this research was done through careful planning,
which was done regarding the data collection method; and the Cronbach’s
alpha analysis technique was used to test internal consistency estimate of
reliability of the hypotheses presented in Chapter 3.
4.11 Data Processing
The data was captured in MS Excel and exported to IBM’s Statistical Package
for the Social Sciences (SPSS) for detailed analysis.
© 2014 University of Pretoria. All rights reserved. The copyright in this work vests in the University of Pretoria.

P a g e | 38
4.12 Data Analysis
The analysis was descriptive in nature. Non-parametric tests were chosen for
this research for two reasons. Firstly, the data obtained through a Likert scale
was ordinal; meaning the response categories had a rank order, but one could
not presume that the intervals between values are equal (Jamieson, 2004).
Jamieson (2004, p 1217) stated that, ‘the appropriate inferential statistics for
ordinal data are those employing non-parametric tests, such as chi square,
Spearman’s Rho, or the Mann–Whitney U-test’.
Secondly, as the original sample size of 397 participants per population group
proved to be unobtainable, and that eventuated in the relatively small sample
size of 100 respondents participating in this study, non-parametric tests were
applied to the data obtained. Weiers (2010) identified that non-parametric
testing should be applied when sample sizes are small.
For this study the following techniques for data analysis were adopted:
Descriptive Statistics Analysis
The descriptive data collected with the aid of the questionnaire was coded
based on different variables and captured into Microsoft Excel. This data was
then analysed using statistical analysis software. Frequencies, percentages,
and means were used to summarise the information collected. Zikmund (2003)
shows how frequency distribution is used to condense demographic profiles, to
ascertain the number of times a particular value of a variable occurred.
© 2014 University of Pretoria. All rights reserved. The copyright in this work vests in the University of Pretoria.

P a g e | 39
In addition to the descriptive and frequency statistics mentioned, two statistical
tests (Kruskal-Wallis and two-tailed Mann-Whitney) were used in this research.
These are described below, indicating their application to specific hypotheses.
Mann-Whitney U Test
The Mann-Whitney U test is used to compare differences between two
independent groups when the dependent variable is either ordinal or
continuous. This test was used to analyse the means of the datasets within
each hypothesis, to see if there was a statistical difference.
The Mann-Whitney U test was used for Hypotheses 1, 2 and 3.
Kruskal-Wallis Test
The Kruskal-Wallis test is used when the independent variable consists of two
or more categorical, independent groups. It is the non-parametric version of
ANOVA and a generalised form of the Mann-Whitney test method, since it
permits two or more groups. Huizingh stated that “the Kruskal-Wallis test and
the median test are non-parametric tests that are often used when the
assumptions of analysis of variance are not met” (Huizingh, 2007, p. 334). The
author explained that the test uses more information and is better than the
median test. The Kruskal-Wallis test does not assume normality in the data and
is therefore much less sensitive to outliers.
The Kruskal Wallis test was chosen for Hypothesis 4, as CVO is divided into
three groups (neutral, Idiocentric, and Allocentric) and one is not able to use
Mann-Whitney U test for more than two groups.
© 2014 University of Pretoria. All rights reserved. The copyright in this work vests in the University of Pretoria.
P a g e | 40
Factor analysis
Factor analysis was used to assess the dimensionality of the construct
measuring “Social Norms”. Gliem and Gliem (2003) defined factor analysis as a
statistical method used for the reduction of data. The factor analysis was
applied to reduce the eight attributes that were measuring “Social Norms” to just
one construct, which was defined as Social Norm Influence.
© 2014 University of Pretoria. All rights reserved. The copyright in this work vests in the University of Pretoria.

P a g e | 41
4.13 Research Limitations
The limitations in this research that were identified include:
1. Insurance was selected as the credence good to test the research
variables; one would not be able to generalise the results to other
credence goods.
2. The sample sizes of 100 are potentially too small to infer onto the
population.
3. Only a single organisation within one industry was used, therefore, the
results might not be relevant to other organisation or industries.
4. Although there are many personal characteristics, only two (i.e. age and
gender) were tested in this research.
Despite these limitations this study presents a valid basis for future research
and contributes to the knowledge of customer retention.
© 2014 University of Pretoria. All rights reserved. The copyright in this work vests in the University of Pretoria.

P a g e | 42
Chapter 5: Results
5.1 Introduction
In this Chapter the results of the survey are reported. 200 respondents
participated in the research. Based on their responses the hypotheses of this
study were tested and the result of the analysis is presented in this Chapter.
The presentation is divided into five sections and, to enable discussion, the
results are presented using tables and figures.
The first section reports the normality of the data and the factor analysis
The second section of the research results will summarise the
demographic profile of the sample.
The third section will summarise the responses obtained from the scales
used to measure the idiocentric level culture and social norms.
The fourth section reports the reliability of the instrument employed to
measure the social norms.
Finally, the fifth section reports on the results after testing the hypotheses
proposed in Chapter 3.
5.2 Normality of Data
In order to ascertain what statistical tests should be run on data, it is important
to understand if the data has a normal distribution. Assessing the normality of
data is essential for many statistical tests because normal data is an underlying
assumption in parametric testing. Park (2008) stated that normality is critical in
© 2014 University of Pretoria. All rights reserved. The copyright in this work vests in the University of Pretoria.
P a g e | 43
data if one wants to infer results onto a greater dataset. If normality is not
present, then inference would not be reliable or valid.
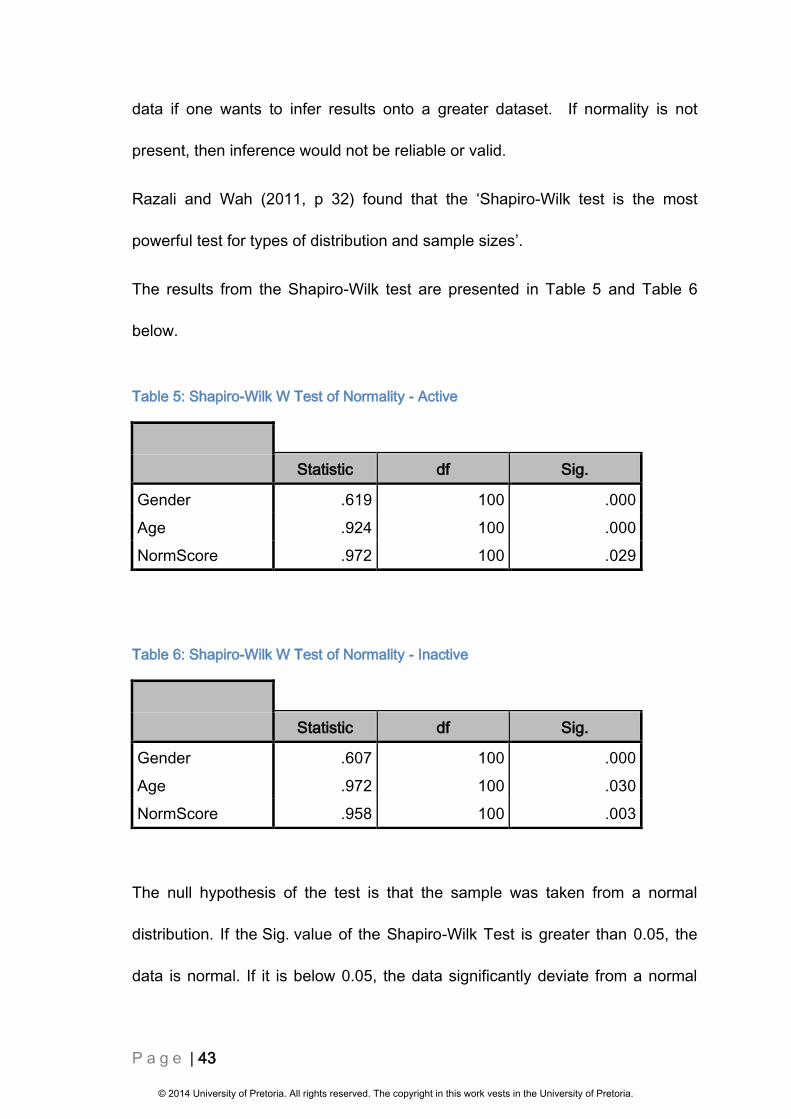
Razali and Wah (2011, p 32) found that the ‘Shapiro-Wilk test is the most
powerful test for types of distribution and sample sizes’.
The results from the Shapiro-Wilk test are presented in Table 5 and Table 6
below.
Table 5: Shapiro-Wilk W Test of Normality - Active
Statistic df Sig.
Gender .619 100 .000
Age .924 100 .000
NormScore .972 100 .029
Table 6: Shapiro-Wilk W Test of Normality - Inactive
Statistic df Sig.
Gender .607 100 .000
Age .972 100 .030
NormScore .958 100 .003
The null hypothesis of the test is that the sample was taken from a normal
distribution. If the Sig. value of the Shapiro-Wilk Test is greater than 0.05, the
data is normal. If it is below 0.05, the data significantly deviate from a normal
© 2014 University of Pretoria. All rights reserved. The copyright in this work vests in the University of Pretoria.

P a g e | 44
distribution. As can be seen in both Table 5 and Table 6, for all variables the
Sig. (P-value) is below 0.05, therefore the data is not normally distributed.
In addition to the reasons given in Chapter 4 for the use of non-parametric
statistics, this finding reaffirms the need to use non-parametric tests.
5.3 Factor Analysis of Social Norms
In order to perform factor analysis on a dataset, one needs to ensure that the
strength of the relationship among variables is sufficient.
The Kaiser-Meyer-Olkin (KMO) and Bartlett's Test are used to test if the data
is suitable for data reduction.
The Kaiser-Meyer-Olkin statistic has a value between 0 and 1. The closer the
value is to 1, the patterns of correlations are relatively compact. It is
recommended that data should have a KMO statistic of at least 0.5 (Field,
2005). As shown in Table 7 the KMO statistic for both samples is greater than
0.5, meaning the data is suitable to run factor analysis.
Table 7: KMO and Bartlett's Test
Active Inactive
Kaiser-Meyer-Olkin Measure of Sampling Adequacy. .932 .866
Bartlett's Test of
Sphericity
Approx. Chi-Square 618.215 391.041
df 28 28
Sig. .000 .000
© 2014 University of Pretoria. All rights reserved. The copyright in this work vests in the University of Pretoria.
P a g e | 45
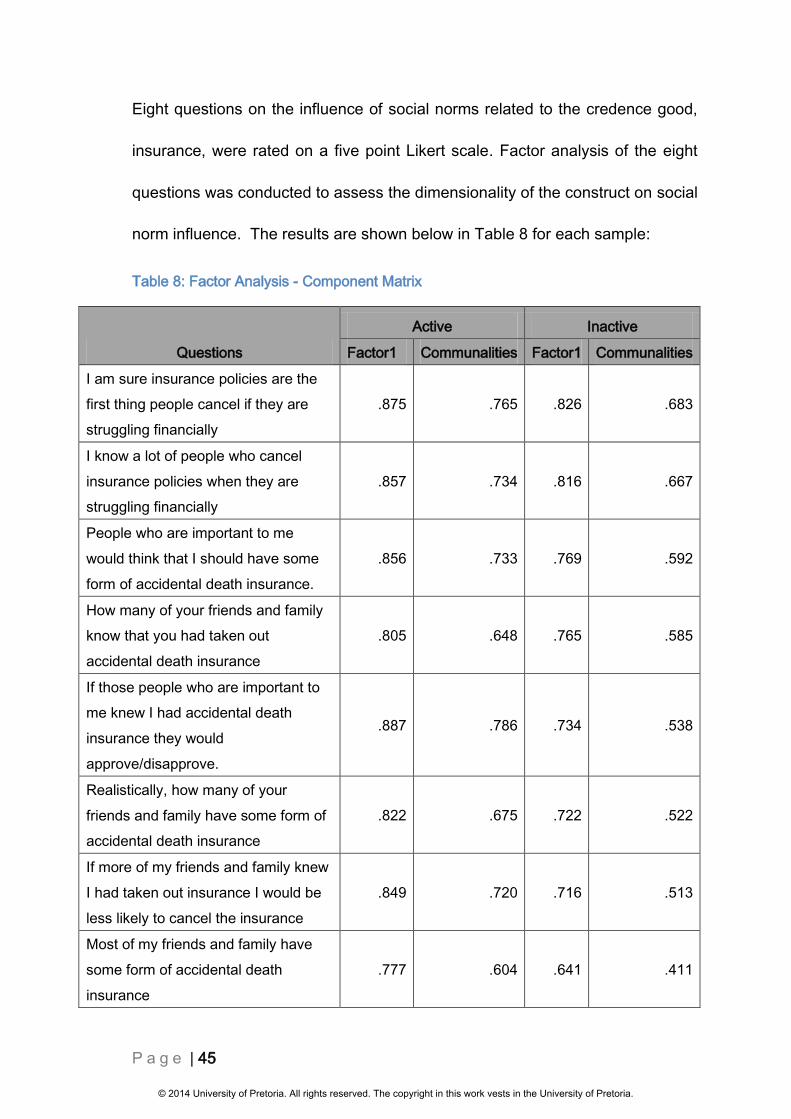
Eight questions on the influence of social norms related to the credence good,
insurance, were rated on a five point Likert scale. Factor analysis of the eight
questions was conducted to assess the dimensionality of the construct on social
norm influence. The results are shown below in Table 8 for each sample:
Table 8: Factor Analysis - Component Matrix
Questions
Active Inactive
Factor1 Communalities Factor1 Communalities
I am sure insurance policies are the
first thing people cancel if they are
struggling financially
.875 .765 .826 .683
I know a lot of people who cancel
insurance policies when they are
struggling financially
.857 .734 .816 .667
People who are important to me
would think that I should have some
form of accidental death insurance.
.856 .733 .769 .592
How many of your friends and family
know that you had taken out
accidental death insurance
.805 .648 .765 .585
If those people who are important to
me knew I had accidental death
insurance they would
approve/disapprove.
.887 .786 .734 .538
Realistically, how many of your
friends and family have some form of
accidental death insurance
.822 .675 .722 .522
If more of my friends and family knew
I had taken out insurance I would be
less likely to cancel the insurance
.849 .720 .716 .513
Most of my friends and family have
some form of accidental death
insurance
.777 .604 .641 .411
© 2014 University of Pretoria. All rights reserved. The copyright in this work vests in the University of Pretoria.

P a g e | 46
The factor analysis resulted in confirmation that the questionnaire had one
latent variable, being social norm influence. The Social Norm score was created
based on this latent variable.
The tables 9 and 10 below show that there was one Eigenvalues greater than 1
for each of the samples, indicating there was one component to be extracted for
these variables. The cumulative percentage showed that the model explained
70.8% of the variation in the active sample and 68.9% of the variation in the
inactive sample. The minimum acceptable value is 60%, thus the factor analysis
produced acceptable results.
Table 9: Factor Analysis - Variance Explained - Active
Component
Initial Eigenvalues Extraction Sums of Squared Loadings
Total % of Variance Cumulative % Total % of Variance Cumulative %
1 5.666 70.822 70.822 5.666 70.822 70.822
2 .603 7.537 78.360
3 .462 5.773 84.133
4 .327 4.089 88.222
5 .277 3.462 91.684
6 .236 2.949 94.633
7 .232 2.905 97.538
8 .197 2.462 100.000
Extraction Method: Principal Component Analysis.
a. Active_Inactive = Active
© 2014 University of Pretoria. All rights reserved. The copyright in this work vests in the University of Pretoria.

P a g e | 47
Table 10: Factor Analysis - Variance Explained - Inactive
Component
Initial Eigenvalues Extraction Sums of Squared Loadings
Total % of Variance Cumulative % Total % of Variance Cumulative %
1 5.511 68.882 68.882
5.511 68.882 68.882
2 .638 7.980 76.861
3 .479 5.984 82.845
4 .444 5.546 88.391
5 .388 4.845 93.236
6 .236 2.946 96.182
7 .169 2.118 98.300
8 .136 1.700 100.000
Extraction Method: Principal Component Analysis.
a. Active_Inactive = Inactive
5.4 Demographic Profile of Sample
The following demographic profiles were elicited from the respondents
and the findings are illustrated in Tables 11 to 14.
5.4.1 Gender Distribution
The gender distribution of the active sample is illustrated in Table 11.
The gender distribution of the inactive sample is illustrated in Table 12.
Table 11: Frequency of Gender Distribution – Active
Gender Frequency Percentage
Male 61 61%
Female 39 39%
Total 100 100.0%
© 2014 University of Pretoria. All rights reserved. The copyright in this work vests in the University of Pretoria.
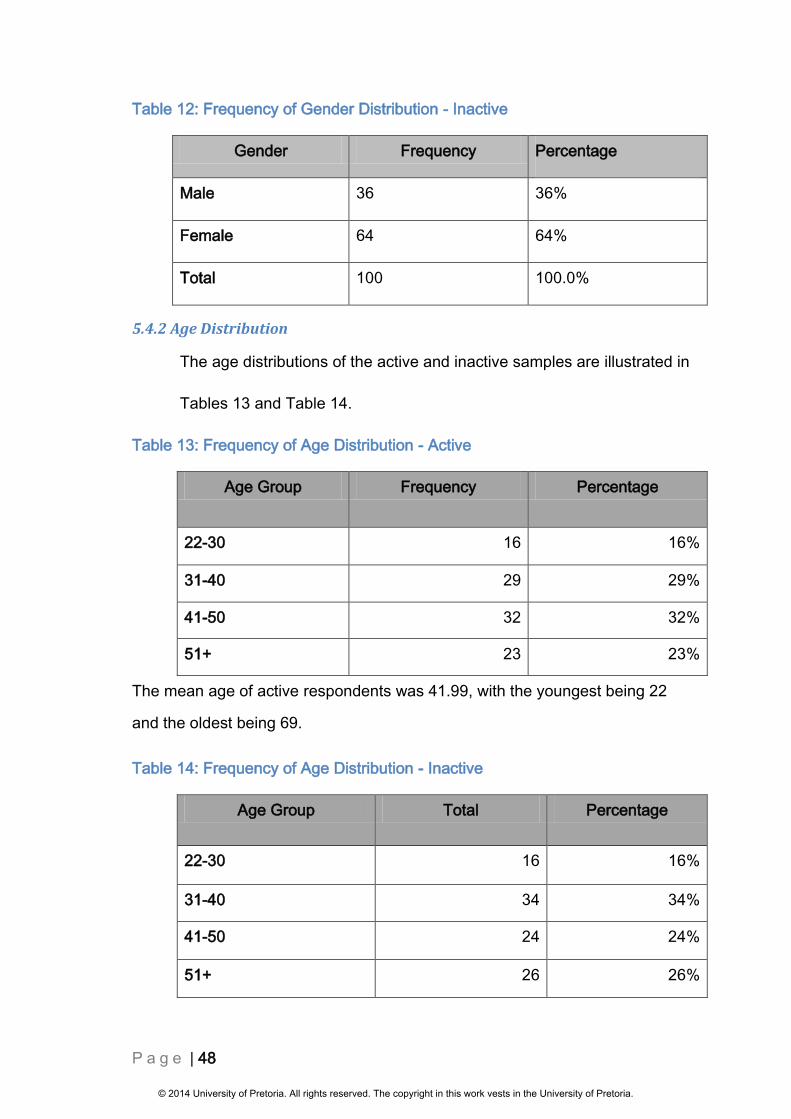
P a g e | 48
Table 12: Frequency of Gender Distribution - Inactive
Gender Frequency Percentage
Male 36 36%
Female 64 64%
Total 100 100.0%
5.4.2 Age Distribution
The age distributions of the active and inactive samples are illustrated in
Tables 13 and Table 14.
Table 13: Frequency of Age Distribution - Active
Age Group Frequency Percentage
22-30 16 16%
31-40 29 29%
41-50 32 32%
51+ 23 23%
The mean age of active respondents was 41.99, with the youngest being 22
and the oldest being 69.
Table 14: Frequency of Age Distribution - Inactive
Age Group Total Percentage
22-30 16 16%
31-40 34 34%
41-50 24 24%
51+ 26 26%
© 2014 University of Pretoria. All rights reserved. The copyright in this work vests in the University of Pretoria.
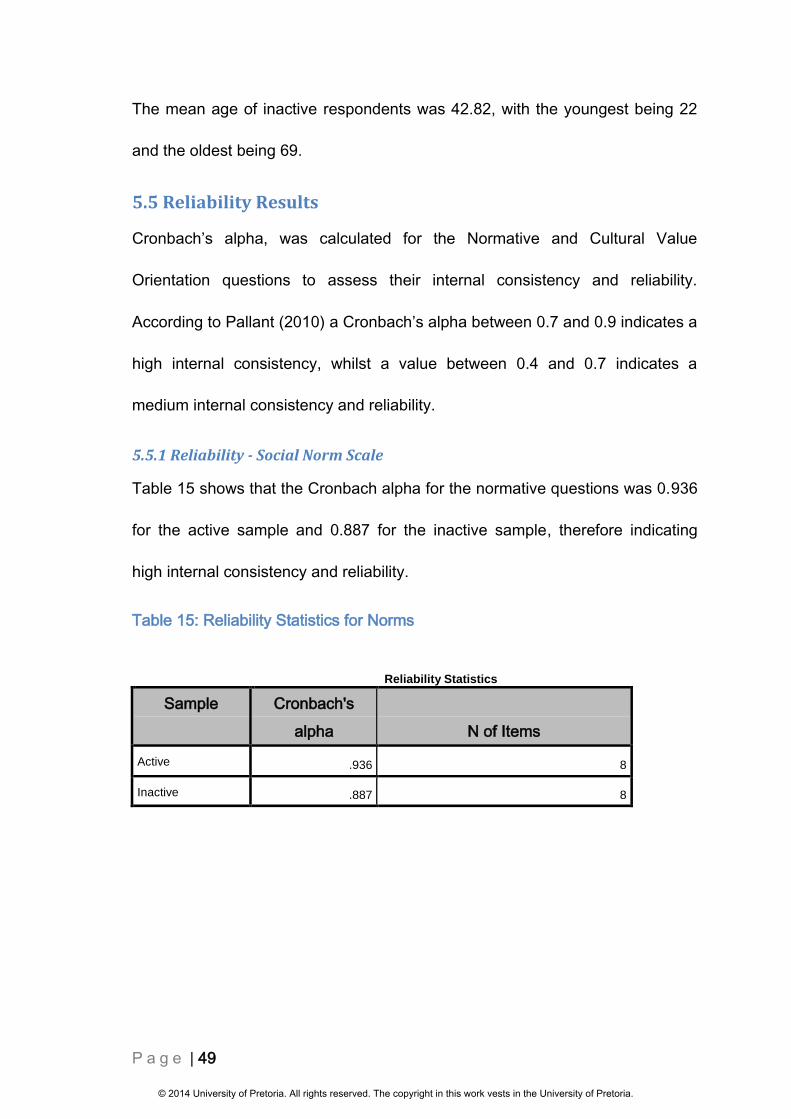
P a g e | 49
The mean age of inactive respondents was 42.82, with the youngest being 22
and the oldest being 69.
5.5 Reliability Results
Cronbach’s alpha, was calculated for the Normative and Cultural Value
Orientation questions to assess their internal consistency and reliability.
According to Pallant (2010) a Cronbach’s alpha between 0.7 and 0.9 indicates a
high internal consistency, whilst a value between 0.4 and 0.7 indicates a
medium internal consistency and reliability.
5.5.1 Reliability - Social Norm Scale
Table 15 shows that the Cronbach alpha for the normative questions was 0.936
for the active sample and 0.887 for the inactive sample, therefore indicating
high internal consistency and reliability.
Table 15: Reliability Statistics for Norms
Reliability Statistics
Sample Cronbach's
alpha N of Items
Active .936 8
Inactive .887 8
© 2014 University of Pretoria. All rights reserved. The copyright in this work vests in the University of Pretoria.
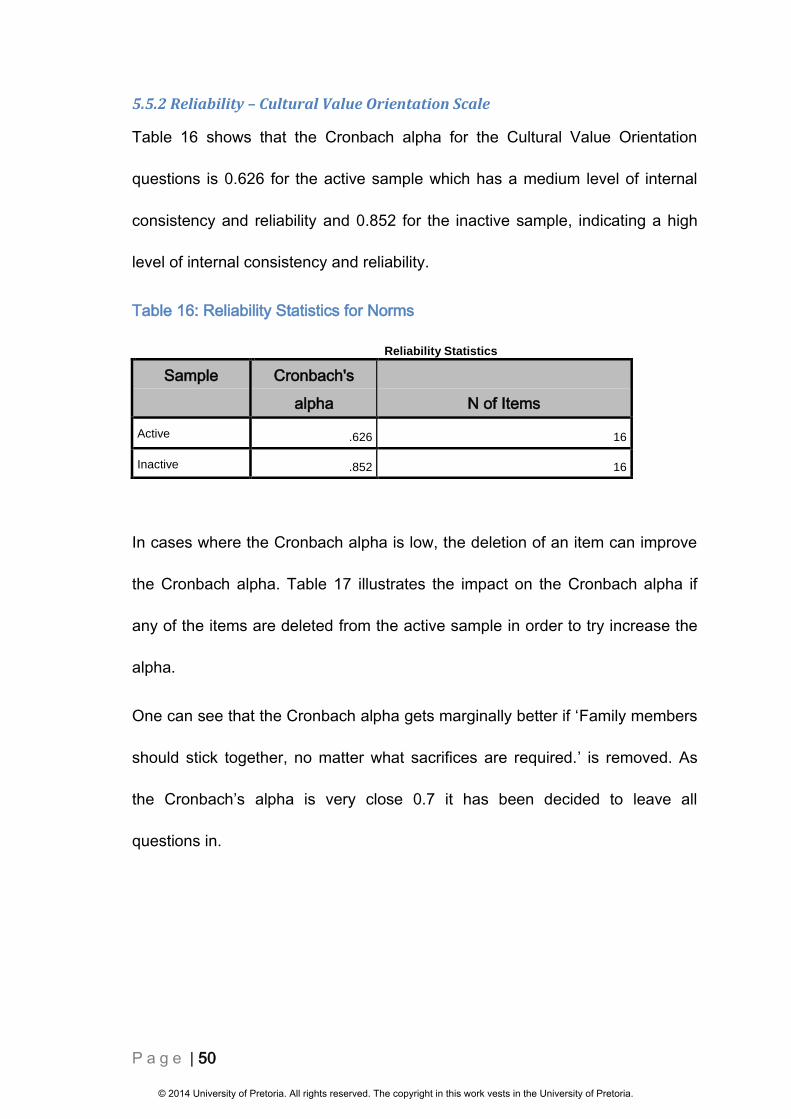
P a g e | 50
5.5.2 Reliability – Cultural Value Orientation Scale
Table 16 shows that the Cronbach alpha for the Cultural Value Orientation
questions is 0.626 for the active sample which has a medium level of internal
consistency and reliability and 0.852 for the inactive sample, indicating a high
level of internal consistency and reliability.
Table 16: Reliability Statistics for Norms
Reliability Statistics
Sample Cronbach's
alpha N of Items
Active .626 16
Inactive .852 16
In cases where the Cronbach alpha is low, the deletion of an item can improve
the Cronbach alpha. Table 17 illustrates the impact on the Cronbach alpha if
any of the items are deleted from the active sample in order to try increase the
alpha.
One can see that the Cronbach alpha gets marginally better if ‘Family members
should stick together, no matter what sacrifices are required.’ is removed. As
the Cronbach’s alpha is very close 0.7 it has been decided to leave all
questions in.
© 2014 University of Pretoria. All rights reserved. The copyright in this work vests in the University of Pretoria.

P a g e | 51
Table 17: Reliability Statistics for Norms if Item Deleted - Active
Scale Mean if
Item Deleted
Scale
Variance if
Item
Deleted
Corrected
Item-Total
Correlation
Cronbach's
alpha if Item
Deleted
I'd rather depend on myself than others. 57.98 23.420 .058 .638
I rely on myself most of the time; I rarely
rely on others. 57.72 21.602 .533 .583
I often do "my own thing." 58.05 22.328 .184 .620
My personal identity, independent of
others, is very important to me. 58.03 22.589 .091 .641
It is important that I do my job better
than others. 58.39 20.759 .240 .615
Winning is everything. 57.86 22.321 .203 .617
Competition is the law of nature. 57.84 22.955 .244 .613
When another person does better than I
do, I get tense and aroused. 57.61 20.619 .442 .579
If a coworker gets a prize, I would feel
proud. 58.14 22.941 .122 .629
The well-being of my coworkers is
important to me. 57.55 21.130 .481 .581
To me, pleasure is spending time with
others. 58.09 21.122 .322 .598
I feel good when I cooperate with others. 58.12 21.986 .229 .613
Parents and children must stay together
as much as possible. 57.69 22.035 .375 .597
It is my duty to take care of my family,
even when 1 have to sacrifice what I
want.
57.71 23.427 .252 .615
Family members should stick together,
no matter what sacrifices are required. 59.23 23.178 .045 .647
It is important to me that I respect the
decisions made by my groups. 57.60 21.202 .486 .581
© 2014 University of Pretoria. All rights reserved. The copyright in this work vests in the University of Pretoria.
P a g e | 52
5.6 Summary of Responses
5.6.1 Level of Social Norm Influence
By running a factor analysis on the social norm questions (8 in total) and
obtaining the outcome of a single factor, one was able to compute a SocialNorm
score by adding all the Likert responses together and using this score to
represent the underlying construct of social norms influence.
In order to calculate influence and exposure to social norms, respondents’
answers to items 17,18,19,20,21,22,23 and 24 were added together, and
divided by 8; this provided a Social Norm Score. The higher the score the more
the respondent was deemed to be influenced by social norms.
The histogram in Figure 8 illustrates the NormScore and frequency for both the
active and the inactive samples. One can see that the distribution of the norm
score differs between the two samples. The active sample has a greater
frequency of lower norm scores, whilst the inactive sample has a greater
frequency of higher norm scores.
© 2014 University of Pretoria. All rights reserved. The copyright in this work vests in the University of Pretoria.

P a g e | 53
Figure 8: Histogram of Social Norm Scores
Normal descriptive statistics were run in order to show the difference between
the mean of the social norm score by sample. This is shown in Table 18.
Table 18: Descriptive Statistics for Sample and Social Norms Score
Sample Mean Std. Deviation
Active 3.038 .844
Inactive 3.369 .698
© 2014 University of Pretoria. All rights reserved. The copyright in this work vests in the University of Pretoria.
P a g e | 54
The higher mean for the inactive sample suggests that respondents who have
cancelled their policies were more influenced by social norms than those who
still have active policies.
5.6.2 Level of Culture Value Orientation
As mentioned in Chapter 2, Culture Value Orientation relates to how an
individual engages with their community. Allocentric individuals are considered
to be more communal whilst idiocentric individuals are considered to be more
self-reliant.
In order to calculate Culture Value Orientation, respondents’ answers to items
1, 2,3,4,5,6,7,8 were added together and divided by 8, this provided an
idiocentric score. The same was done for allocentric by adding responses to
items 9, 10,11,12,13,14,15,16 and dividing by 8. If the idiocentric mean score
was higher than the allocentric mean score, the respondent was deemed to be
idiocentric. If the allocentric mean score was higher than the idiocentric mean
score, then the respondent was deemed to be idiocentric. This follows the
research done by Triandis and Gelfand (1998)
Tables 19 and 20 below illustrate the frequency of Culture Value Orientation
(CVO) for each sample. As mentioned above, the label of allocentric or
idiocentric was assigned based on which ever calculation was higher.
As can be seen both Table 19 and Table 20, 31 respondents CVO calculation
was equal.
© 2014 University of Pretoria. All rights reserved. The copyright in this work vests in the University of Pretoria.
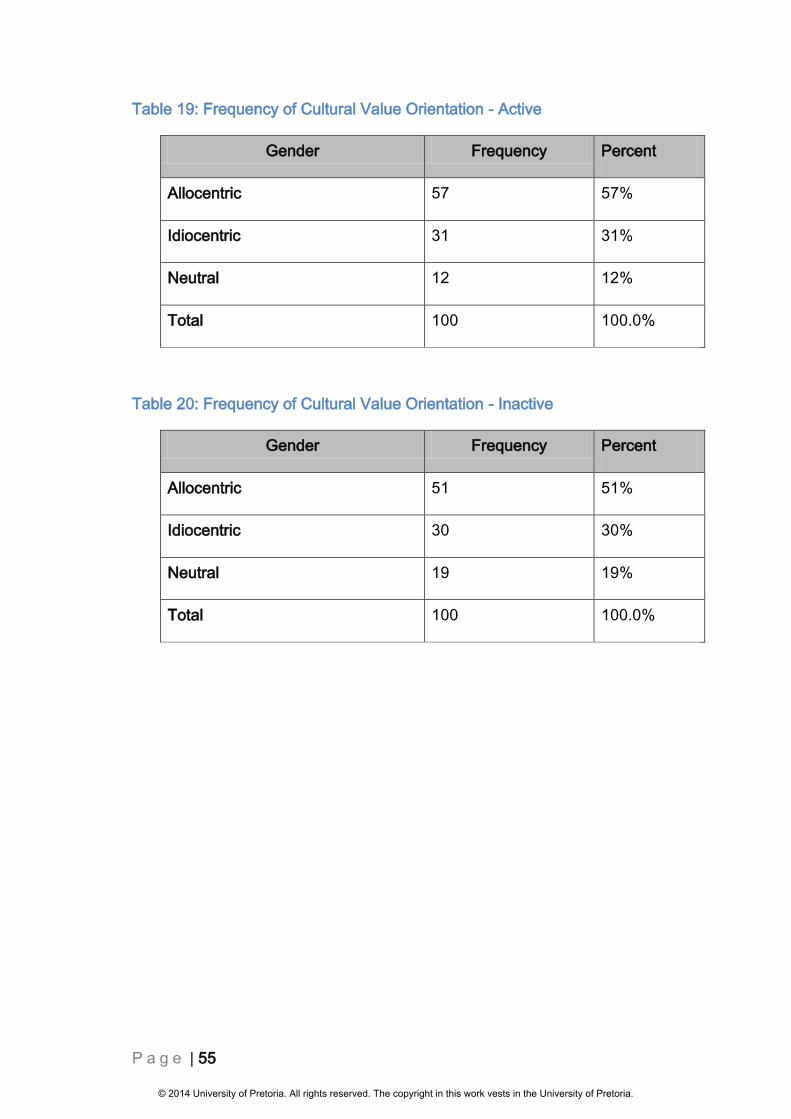
P a g e | 55
Table 19: Frequency of Cultural Value Orientation - Active
Gender Frequency Percent
Allocentric 57 57%
Idiocentric 31 31%
Neutral 12 12%
Total 100 100.0%
Table 20: Frequency of Cultural Value Orientation - Inactive
Gender Frequency Percent
Allocentric 51 51%
Idiocentric 30 30%
Neutral 19 19%
Total 100 100.0%
© 2014 University of Pretoria. All rights reserved. The copyright in this work vests in the University of Pretoria.

P a g e | 56
Table 21 and Table 22 illustrate the Mean and the Standard Deviation for the
active and inactive samples.
Table 21: Descriptive Statistics for CVO and Social Norms Score - Active
CVO Mean Std. Deviation
Neutral 3.523 .387
Idiocentric 2.669 .807
Allocentric 3.616 .603
Table 22: Descriptive Statistics for CVO and Social Norms Score - Inactive
CVO Mean Std. Deviation
Neutral 3.244 .604
Idiocentric 3.130 .754
Allocentric 3.827 .384
The mean is a measure of central tendency whilst the standard deviation shows
the measure of variability or dispersion of the distribution (Zikmund, 2003)
This table is useful as it indicates which group can be considered as having the
higher social norm influence, overall; namely Allocentric, as they have the
highest mean. This is applicable to both active and inactive groups.
© 2014 University of Pretoria. All rights reserved. The copyright in this work vests in the University of Pretoria.
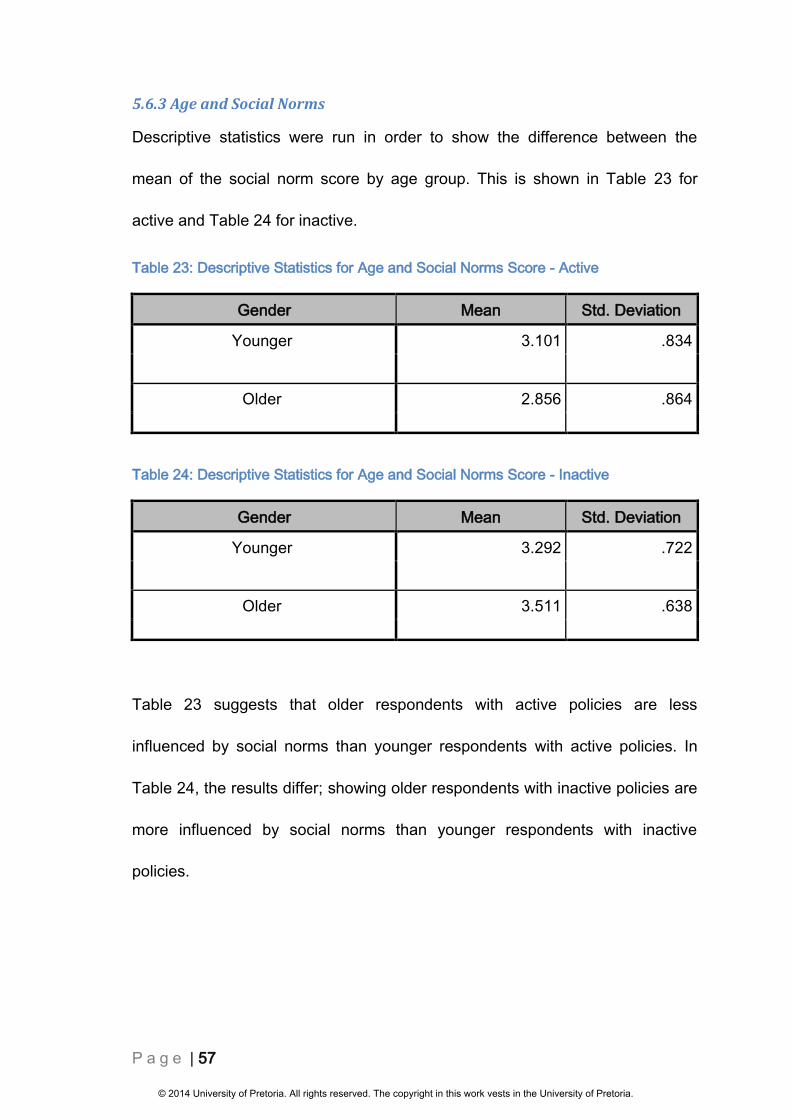
P a g e | 57
5.6.3 Age and Social Norms
Descriptive statistics were run in order to show the difference between the
mean of the social norm score by age group. This is shown in Table 23 for
active and Table 24 for inactive.
Table 23: Descriptive Statistics for Age and Social Norms Score - Active
Gender Mean Std. Deviation
Younger 3.101 .834
Older 2.856 .864
Table 24: Descriptive Statistics for Age and Social Norms Score - Inactive
Gender Mean Std. Deviation
Younger 3.292 .722
Older 3.511 .638
Table 23 suggests that older respondents with active policies are less
influenced by social norms than younger respondents with active policies. In
Table 24, the results differ; showing older respondents with inactive policies are
more influenced by social norms than younger respondents with inactive
policies.
© 2014 University of Pretoria. All rights reserved. The copyright in this work vests in the University of Pretoria.

P a g e | 58
5.6.4 Gender and Social Norms
Descriptive statistics were run in order to show the difference between the
mean of the social norm score by gender. This is shown in Table 25 for active
and Table 26 for inactive.
Table 25: Descriptive Statistics for Gender and Social Norms Score - Active
Gender Mean Std. Deviation
Male 2.783 .759
Female 3.436 .825
Table 26: Descriptive Statistics for Gender and Social Norms Score - Inactive
Gender Mean Std. Deviation
Male 3.139 .755
Female 3.498 .634
As can be seen in both Tables 25 and 26, the Norm Score is higher for females
than males.
This table is useful as it indicates which group can be considered as having the
higher social norm influence, overall; namely females, as they have the highest
mean. This is applicable to both active and inactive groups.
© 2014 University of Pretoria. All rights reserved. The copyright in this work vests in the University of Pretoria.

P a g e | 59
5.7 Results of Hypothesis Testing
Table 27 below provides a list of the hypotheses and the statistical tests run for
each of them
Table 27: Hypotheses and Applied Statistical Test
Hypotheses Statistical Test
1 - Social norms have an influence on
customer retention of important low-
consumption services
Mann-Whitney U test
2 - Younger consumers are significantly
more influenced by social norms than older
consumers
Mann-Whitney U test
3 - Female consumers are significantly
more influenced by social norms than male
consumers
Mann-Whitney U test
4 - Allocentrics’ customer retention for
important low-consumption services is
significantly more influenced by social norms
than idiocentrics
Kruskal-Wallis test
© 2014 University of Pretoria. All rights reserved. The copyright in this work vests in the University of Pretoria.

P a g e | 60
5.7.1 Hypothesis 1:
H10: Social norms do not influence customer retention of important low-
consumption services
H1A: Social norms have an influence on customer retention of important low-
consumption services
The Mann-Whitney U test was used to test the statistical differences between
the mean scores of social norms between those respondents who had retained
their insurance policy and those who cancelled their insurance policy. Table 28
presents the outcome of the hypothesis test.
Table 28: Hypothesis 1 Test Summary
Test Statistics
Active
Mann-Whitney U 3919.500
Wilcoxon W 8969.500
Z -2.644
Asymp. Sig. (2-tailed) .008
Grouping variable: Active_Inactive
The p-value, labelled as “Asymp. Sig”, in Table 28 has a value of 0.008.
Because this p-value is lower than alpha=0.05, the null hypothesis is rejected.
© 2014 University of Pretoria. All rights reserved. The copyright in this work vests in the University of Pretoria.

P a g e | 61
The above Hypothesis test was done on a combined Social Norm Score, which
includes both the Descriptive Norm score and the Injunctive Norm score. Table
29 and Table 30 provide the outcomes of the Mann-Whitney U Test run
separately on the Descriptive Norm Score and the Injunctive Norm Score
Table 29: Independent-Samples Mann-Whitney U Test for Injunctive Norms
Null Hypothesis Test Sig. Decision
1 The distribution of NormScore_Injunctive is the same across categories of Active_Inactive.
Independent-Samples Mann-Whitney U Test
.005 Reject the null hypothesis.
Asymptotic significances are displayed. The significance level is .05.
Table 30: Independent-Samples Mann-Whitney U Test for Descriptive Norms
Hypothesis Test Summary
Null Hypothesis Test Sig. Decision
1 The distribution of NormScore_Descriptive is the same across categories of Active_Inactive.
Independent-Samples Mann-Whitney U Test
.001 Reject the null hypothesis.
Asymptotic significances are displayed. The significance level is .05.
© 2014 University of Pretoria. All rights reserved. The copyright in this work vests in the University of Pretoria.
P a g e | 62
5.7.2 Hypothesis 2:
H20: Younger consumers and older consumers show no or little difference on
being influenced by social norms
H2A: Younger consumers are significantly more influenced by social norms
than older consumers
The Mann-Whitney U test was also used to test the statistical differences
between the mean scores of social norms for respondents based on their age.
Separate tests were run for each sample. For the purposes of this research,
respondents 40 years of age and younger were regarded as ‘younger’ and
respondents older than 40 years of age were regarded as ‘older’. This grouping
was done as suggested by Milner and Rosenstreich in their 2013 study (Milner
& Rosenstreich, 2013). Table 31 provides the outcome of the hypothesis test
for the active and inactive samples.
© 2014 University of Pretoria. All rights reserved. The copyright in this work vests in the University of Pretoria.

P a g e | 63
Table 31: Hypothesis 2 Test Summary
Test Statistics
Active Inactive
Mann-Whitney U 827.500 936.000
Wilcoxon W 1178.500 3081.000
Z -1.060 -1.459
Asymp. Sig. (2-tailed) .289 .145
Grouping variable: AgeCategory
The Mann-Whitney U test above revealed a difference between active and
inactive groups for distribution of the NormScore across categories of age
however in both test the p-value is greater than alpha=0.05.
The p-value (labelled as “Asymp. Sig”) in Table 31 has a value of 0.289 for
active and 0.145 for inactive. Because these p-values are greater than
alpha=0.05, we cannot reject the null hypothesis.
© 2014 University of Pretoria. All rights reserved. The copyright in this work vests in the University of Pretoria.
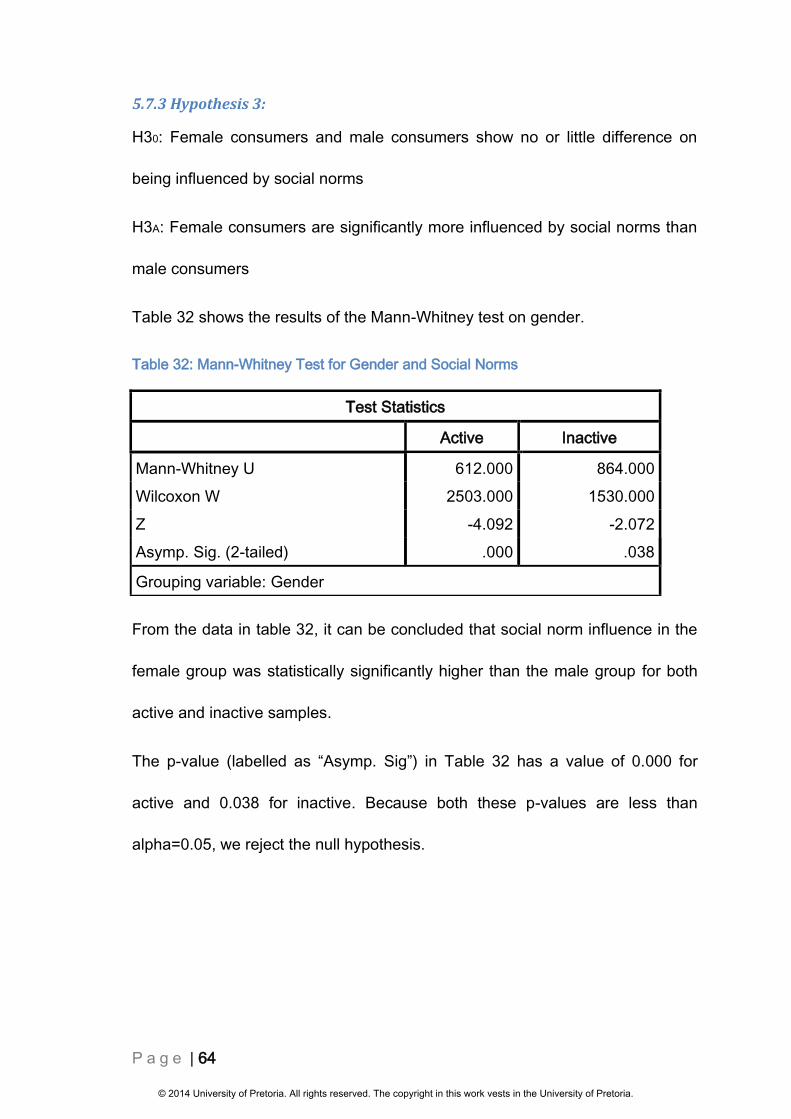
P a g e | 64
5.7.3 Hypothesis 3:
H30: Female consumers and male consumers show no or little difference on
being influenced by social norms
H3A: Female consumers are significantly more influenced by social norms than
male consumers
Table 32 shows the results of the Mann-Whitney test on gender.
Table 32: Mann-Whitney Test for Gender and Social Norms
Test Statistics
Active Inactive
Mann-Whitney U 612.000 864.000
Wilcoxon W 2503.000 1530.000
Z -4.092 -2.072
Asymp. Sig. (2-tailed) .000 .038
Grouping variable: Gender
From the data in table 32, it can be concluded that social norm influence in the
female group was statistically significantly higher than the male group for both
active and inactive samples.
The p-value (labelled as “Asymp. Sig”) in Table 32 has a value of 0.000 for
active and 0.038 for inactive. Because both these p-values are less than
alpha=0.05, we reject the null hypothesis.
© 2014 University of Pretoria. All rights reserved. The copyright in this work vests in the University of Pretoria.
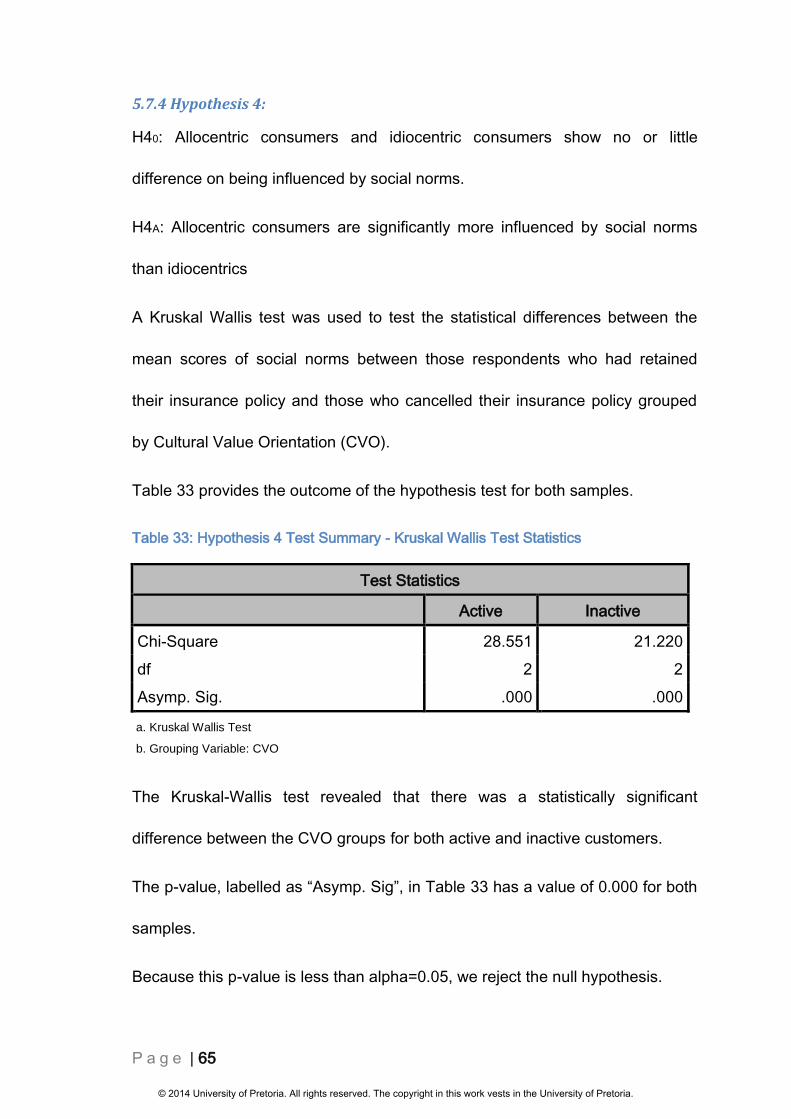
P a g e | 65
5.7.4 Hypothesis 4:
H40: Allocentric consumers and idiocentric consumers show no or little
difference on being influenced by social norms.
H4A: Allocentric consumers are significantly more influenced by social norms
than idiocentrics
A Kruskal Wallis test was used to test the statistical differences between the
mean scores of social norms between those respondents who had retained
their insurance policy and those who cancelled their insurance policy grouped
by Cultural Value Orientation (CVO).
Table 33 provides the outcome of the hypothesis test for both samples.
Table 33: Hypothesis 4 Test Summary - Kruskal Wallis Test Statistics
Test Statistics
Active Inactive
Chi-Square 28.551 21.220
df 2 2
Asymp. Sig. .000 .000
a. Kruskal Wallis Test
b. Grouping Variable: CVO
The Kruskal-Wallis test revealed that there was a statistically significant
difference between the CVO groups for both active and inactive customers.
The p-value, labelled as “Asymp. Sig”, in Table 33 has a value of 0.000 for both
samples.
Because this p-value is less than alpha=0.05, we reject the null hypothesis.
© 2014 University of Pretoria. All rights reserved. The copyright in this work vests in the University of Pretoria.
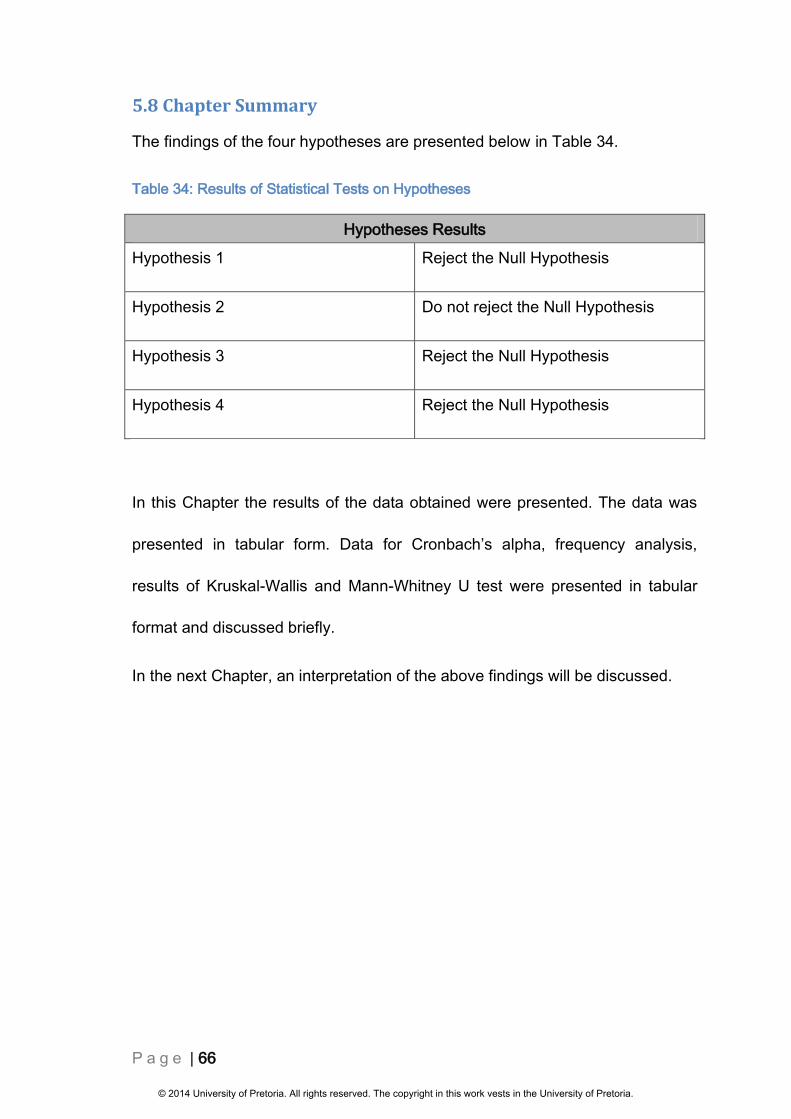
P a g e | 66
5.8 Chapter Summary
The findings of the four hypotheses are presented below in Table 34.
Table 34: Results of Statistical Tests on Hypotheses
Hypotheses Results
Hypothesis 1 Reject the Null Hypothesis
Hypothesis 2 Do not reject the Null Hypothesis
Hypothesis 3 Reject the Null Hypothesis
Hypothesis 4 Reject the Null Hypothesis
In this Chapter the results of the data obtained were presented. The data was
presented in tabular form. Data for Cronbach’s alpha, frequency analysis,
results of Kruskal-Wallis and Mann-Whitney U test were presented in tabular
format and discussed briefly.
In the next Chapter, an interpretation of the above findings will be discussed.
© 2014 University of Pretoria. All rights reserved. The copyright in this work vests in the University of Pretoria.

P a g e | 67
Chapter 6: Discussion of Results
6.1 Introduction
The results of this study reported in Chapter 5 are discussed in this Chapter.
The objective of this research was to discover whether social norms impacted
customer retention of low-consumption credence goods and whether that was
impacted by ones cultural value orientation or personal characteristics such as
age and gender. The hypotheses tested show how Customer Loyalty
Behaviour is impacted by subjective and descriptive norms. They then show
how allocentrism and idiocentrism as well as one’s personal characteristics
influence these subjective and descriptive norms. Figure 9 shows this outcome
in the research conceptual model.
Figure 9: Research Conceptual Model Adapted from Ajzen (1991)
Important Credence goods as a
moderator
Perceived
Behavioural
Control
Attitude
Allocentrism
vs Idiocentrism
Intention
Personal
Characteristics
Subjective
Norm
Descriptive
Norm
Customer
Loyalty
Behaviour
© 2014 University of Pretoria. All rights reserved. The copyright in this work vests in the University of Pretoria.

P a g e | 68
The hypotheses presented in Chapter 3 will each be discussed in terms of
whether it should or should not be rejected; in each ensuing discussion a
conclusion is drawn and a justification for each conclusion is provided.
The Cronbach’s alpha of both scales was high enough to allow for the results of
the questionnaire to be accepted with confidence. Whilst the normative scale
was slightly below the 0.7 referenced in this research, other researchers regard
0.65 as acceptable.
6.2 Hypotheses Results and Discussion
6.2.1 Hypothesis 1
The Null hypothesis (H10) stated that there is no significant link between social
norms and customer retention for important low-consumption services. The
alternative hypothesis (H1A) stated that there is a significant link between social
norms and customer retention for important low-consumption services
The results show in Table 28 that the null hypothesis (H10) is rejected in favour
of the alternative hypothesis because the p-value of 0.008 is smaller than the
0.05 level of significance; which implies that the variable is statistically
significant at the 5% level. Thus a conclusion can be drawn that there are
interaction effects between social norms and customer retention for credence
goods.
This finding is in line with that postulated by numerous researchers (Ajzen
(1991); Bansal et al., (2005); Cialdini et al., (1990); Lee et al. (2009); Manning
(2011); Nitzan & Libai (2011); Norman et al., (2005)) that social norms have an
© 2014 University of Pretoria. All rights reserved. The copyright in this work vests in the University of Pretoria.
P a g e | 69
impact on customer retention. Lee at al. (2009) postulated that when
individuals shared common activities they tended to conform to each other’s
behaviours. These common activities have been the type of activities that
formed the subject of previous research, which were high consumption products
and services where the customers’ social network is actively involved with the
customer. The results of this hypothesis show that even if the service is a
credence low-consumption one, the customer is impacted by social norms.
Part of this research was to combine the impact of both injunctive norms and
descriptive norms, as suggested by Norman et al., (2005). In order to test the
validity of this suggestion when dealing with credence goods, additional
statistical tests were run, as shown in Tables 29 and 30. The results of these
tests show that whether one looks at descriptive norms, injunctive norms or a
combination of both, the p-value is below 0.05 and as such illustrates that each
of these normative types has interaction effects on customer retention.
In their research, Lee et al., (2009) found that social norms impacted retention
of a customer when the customer believed they would be negatively impacted
by others should they migrate or cancel their service. This finding together with
the results of this current research affirms the normative part of the Theory of
Planned Behaviour.
By showing that social norms can be used towards understanding customer
retention, this research provides a possible answer to the question posed in
Chapter 1, namely ‘If a consumer has an important service such as insurance,
© 2014 University of Pretoria. All rights reserved. The copyright in this work vests in the University of Pretoria.

P a g e | 70
which is not overtly known by his social network, is he still influenced by social
norms?’.
6.2.2 Hypothesis 2
The Null hypothesis (H20) stated that there is little or no difference between age
groups when looking at the influence of social norms. The alternative
hypothesis (H2A) stated that there is a significant difference between age
groups when looking at the influence of social norms.
The results in Table 31 show that the null hypothesis (H10) cannot be rejected
for either the active or inactive samples, because the p-values of 0.289 and
0.145 respectively are greater than the 0.05 level of significance; which implies
that the variable is statistically insignificant at the 5% level. Lee et al. (2009)
suggested that additional research be conducted on the impact social norms
have on older customers. The current study looked at the influence age had on
social norms specifically around credence goods, as postulated by Milner and
Rosenstreich (2013) who believed that older customers would be more
comfortable using credence goods. Martin and Bush (2000) and Lee et al.,
(2009) found that younger customers were impacted by social norms. They
found this particularly in high-consumption, high-enjoyment products and
services. The aim with Hypothesis 2 was to test the link between age and social
norms; which was not possible, as the finding was that there was no significant
difference in social norms between respondents under 41 and respondents over
41. This however does not necessarily address the question posed by Lee et
© 2014 University of Pretoria. All rights reserved. The copyright in this work vests in the University of Pretoria.
P a g e | 71
al., (2009) on whether older clients are influenced by social norms regarding
retention of high consumption, enjoyable products. This could be due to this
current study being on low-consumption products.
6.2.3 Hypothesis 3
The Null hypothesis (H30) stated that there is little or no difference between
gender groups when looking at the influence of social norms. The alternative
hypothesis (H3A) stated that there is a significant difference between gender
groups when looking at the influence of social norms.
The results show in Table 32 that the null hypothesis (H10) is rejected because
the p-values of both samples, being 0.000 for active and 0.038 for inactive, are
smaller than the 0.05 level of significance, which implies that the variable is
statistically significant at the 5% level. Thus a conclusion can be drawn that
social norms are influenced by gender. The mean shown in Tables 21 and 22
suggests that female respondents are more influenced by social norms than
male respondents, whether their policy is active or inactive.
This confirms the findings of both Baumann et al. (2005) and Nysveen et al.
(2005) that gender impact social norms differently. Based on this knowledge
regarding the moderating effects of customer characteristics, credence goods
can be tailored to preferences in segments based on gender, resulting in better
customer retention.
© 2014 University of Pretoria. All rights reserved. The copyright in this work vests in the University of Pretoria.

P a g e | 72
6.2.4 Hypothesis 4
The Null hypothesis (H40) stated that there is little or no difference between
allocentrics and idiocentrics when looking at the influence of social norms.
The alternative hypothesis (H4A) stated that there is a significant difference
between allocentrics and idiocentrics when looking at the influence of social
norms.
The results show in Table 33 that the Null hypothesis (H40) is rejected because
the p-value of 0.049 is less than the 0.05 level of significance, which implies that
the variable is statistically significant at the 5% level.
Tables 17 and 18 shows that allocentric respondents have a higher Social Norm
Score mean than that of idiocentric respondents. This reaffirms findings by
Triandis (2001) that allocentric people worry more about what others think than
idiocentric people. This means that in order to influence customer retention for
allocentric customers, one must positively influence the customers’ social
network and community. The research conducted by Nitzan and Libai (2011)
where they found that exposure to a defecting neighbour is associated with an
80% increased risk of defection is more applicable to allocentrics than
idiocentrics.
© 2014 University of Pretoria. All rights reserved. The copyright in this work vests in the University of Pretoria.

P a g e | 73
Chapter 7: Conclusion
7.1. Introduction
The intent of this study was to develop a deeper understanding of how social
norms impacted customer retention and how one can predict the impact of
social norms through customers’ personal characteristics by applying a
quantitative methodology. Researcher’s such as Nitzan and Libai (2011)
postulated that loyalty could be seen as immunity against certain effects that
might cause customer defection. The aim of the question asked in this research
is whether the same impact loyalty has in on defection will be in effect among
customers who are exposed to other’s in their network defecting.
This Chapter presents a summary of the findings of the research with reference
to its achievement of the original aim. In addition, recommendations are also
offered to enable organisations improve their customer retention rate.
7.2. Summary of Key Findings
This research brought to light the influence social norms had on customer
retention for credence goods. This research provides a valuable contribution to
theory in terms of creating a conceptual model that adapted the TPB allowing
researchers and managers to understand the aspects that influence social
norms and how this then influences customer retention. This model allowed for
the mapping of how certain personal characteristics, namely age, gender and
culture value orientation impact upon individual’s social norms.
© 2014 University of Pretoria. All rights reserved. The copyright in this work vests in the University of Pretoria.
P a g e | 74
One of the primary findings confirmed that social norms influence customer
behaviour even if the product or service in question is one that is not known to
the customers’ social network.
Secondly, it was found that certain personal characteristics impact how a
customer is influenced by social norms. The findings that gender and culture
value orientation have an impact on social norm behaviour are consistent with
the hypothesis and indicated that female customers and Allocentric customers
are more influenced by social norms. The research was unable to find a link
between age and social norm influence, as postulated by Lee et al. (2009).
The results of this study have significant implications for the understanding of
some of the drivers of customer retention. Organisations that aim to predict and
positively impact their customer retention rate should consider these
implications
7.3. Recommendations and Managerial Implications
Customer retention has long been a key focus point for managers. Research in
this regard has focussed mainly on customer satisfaction. One of the
implications of this study is that managers need to take a customer’s social
network into account when trying to manage and predict their customer
retention ability.
Managers could benefit from studying social networks, with the aim of gaining a
better understanding of switching patterns and identifying which customers
have the most influence in impacting retention.
© 2014 University of Pretoria. All rights reserved. The copyright in this work vests in the University of Pretoria.

P a g e | 75
Managing descriptive and subjective norms will assist in reducing customer
defection rates. Marketers could benefit by developing strategies around these
differing norms, which target current customers’ social networks. An example of
this is targeting a customer’s family with a marketing plan which reinforces the
social aspects of the brand.
Organisations can use the model proposed in this research to focus their ‘social
network’ marketing campaigns on the customers who are more influenced by
social norms.
Practically, it is recommended that satisfaction surveys be developed which
examine the satisfaction of friends, either by asking the primary customer or by
independent surveys.
Lastly, managers must not make across-the-board conclusions on social norm
strategies without considering consumption characteristics. In research by Lee
at al. (2009), it is reiterated that doing this would produce an incomplete picture,
resulting in misleading conclusions and ineffective managerial decisions.
© 2014 University of Pretoria. All rights reserved. The copyright in this work vests in the University of Pretoria.

P a g e | 76
7.4 Future Research
- The survey originally attempted to obtain sufficient respondents in order
to use parametric statistical tests in order for the results to be inferred
onto a greater population. It would be beneficial for this study to be
redone with a significantly larger sample size, which would allow for
inference via parametric statistical tests.
- This study was limited to insurance products as being the credence
good. It would be desirable to extend the reach of this study to other
credence goods in order to discover similarities in the findings.
- In order to specifically address the questions raised by Lee at al. (2009)
around the impact of social norms on older customers, it would be
valuable to conduct research on high-consumption goods and the impact
of social norms on age.
- This study was done by using a quantitative method of data collection
and analysis; applying a qualitative approach to a similar study would
help in understanding the underlying causes of social norms influence
upon the use of credence goods.
© 2014 University of Pretoria. All rights reserved. The copyright in this work vests in the University of Pretoria.

P a g e | 77
References
Ajzen, I. (1991). The Theory of Planned Behavior. Organizational Behavior &
Human Decision Processes, 50(2), 179.
Ajzen, I. (2011). The theory of planned behaviour: Reactions and reflections.
Psychology & Health, 26(9), 1113–1127.
doi:10.1080/08870446.2011.613995
Albright, S. C., Winston, W. L., & Zappe, C. J. (2009). Data Analysis and
Decision Making with Microsoft® Excel. CengageBrain. com.
Alrubaiee, L. (2012). Exploring the Relationship between Ethical Sales
Behavior, Relationship Quality, and Customer Loyalty. International
Journal of Marketing Studies, 4(1), 7–25.
ASISA. (2012, December). Industry Statistics: Life Industry Trade Figures.
ASISA. Retrieved from http://www.asisa.org.za/index.php/industry-
statistics/long-term-insurance.html
Bansal, H. S., Taylor, S. F., & St. James, Y. (2005). “Migrating” to New Service
Providers: Toward a Unifying Framework of Consumers’ Switching
© 2014 University of Pretoria. All rights reserved. The copyright in this work vests in the University of Pretoria.
P a g e | 78
Behaviors. Journal of the Academy of Marketing Science, 33(1), 96–115.
doi:10.1177/0092070304267928
Baumann, C., Burton, S., & Elliott, G. (2005). Determinants of customer loyalty
and share of wallet in retail banking. Journal of Financial Services
Marketing, 9(3), 231–248.
Beatty, S. E., Mayer, M., Coleman, J. E., Reynolds, K. E., & Lee, J. (1996).
Customer-sales associate retail relationships. Journal of Retailing, 72(3),
223–247. doi:10.1016/S0022-4359(96)90028-7
Benoit, D. F., & Van den Poel, D. (2012). Improving customer retention in
financial services using kinship network information. Expert Systems with
Applications, 39(13), 11435–11442.
Berkowitz, A. D. (2004). The social norms approach. Theory, research and
annotated bibliography. Retrieved from http://www. alanberkowitz.
com/articles/social_norms. pdf.
Chen, X.-P., Arzu Wasti, S., & Triandis, H. C. (2007). When does group norm or
group identity predict cooperation in a public goods dilemma? The
© 2014 University of Pretoria. All rights reserved. The copyright in this work vests in the University of Pretoria.

P a g e | 79
moderating effects of idiocentrism and allocentrism. International Journal
of Intercultural Relations, 31(2), 259–276.
Cialdini, R. B., Reno, R. R., & Kaligren, C. A. (1990). A Focus Theory of
Normative Conduct: Recycling the Concept of Norms to Reduce Littering
in Public Places. Journal of Personality & Social Psychology, 58(6),
1015–1026.
Clare, A. (2007). Trust and its importance in developing long-term, profitable
B2B relationships. Journal of Marketing, (April/May), 18–18.
Darby, M. R., & Karni, E. (1973). Free competition and the optimal amount of
fraud. Journal of law and economics, 16(1), 67–88.
Díaz de Rada, V. (2011). Face-to-face versus telephone surveys on political
attitudes: a comparative analysis. Quality & Quantity, 45(4), 817–827.
East, R., Hammond, K., & Gendall, P. (2006). Fact and Fallacy in Retention
Marketing. Journal of Marketing Management, 22(1/2), 5–23.
Evans, M. (2002). Prevention is better than cure: Redoubling the focus on
customer retention. Journal of Financial Services Marketing, 7(2), 186.
© 2014 University of Pretoria. All rights reserved. The copyright in this work vests in the University of Pretoria.

P a g e | 80
Field, A. (2005). Discovering statistics with SPSS. London: Sage, Last access:
August, 27, 2012.
Fischer, R., Ferreira, M., Assmar, E., Redford, P., Harb, C., Glazer, S., …
Achoui, M. (2009). Individualism-collectivism as descriptive norms:
development of a subjective norm approach to culture measurement.
Journal of Cross-Cultural Psychology, 40(2), 187–213.
Fishbein, M., & Ajzen, I. (1975). Belief, attitude, intention and behavior: An
introduction to theory and research.
Gerpott, T. J., Rams, W., & Schindler, A. (2001). Customer retention, loyalty,
and satisfaction in the German mobile cellular telecommunications
market. Telecommunications Policy, 25(4), 249–269. doi:10.1016/S0308-
5961(00)00097-5
Gliem, J. A., & Gliem, R. R. (2003). Calculating, interpreting, and reporting
Cronbach’s alpha reliability coefficient for Likert-type scales. Midwest
Research-to-Practice Conference in Adult, Continuing, and Community
Education.
© 2014 University of Pretoria. All rights reserved. The copyright in this work vests in the University of Pretoria.

P a g e | 81
Gustafsson, A., Johnson, M. D., & Roos, I. (2005). The Effects of Customer
Satisfaction, Relationship Commitment Dimensions, and Triggers on
Customer Retention. Journal of Marketing, 69(4), 210–218.
Howden, C., & Pressey, A. D. (2008). Customer value creation in professional
service relationships: the case of credence goods. The Service Industries
Journal, 28(6), 789–812.
Huizingh, E. (2007). Applied statistics with SPSS. Sage.
Israel, G. D. (1992). Determining sample size. University of Florida Cooperative
Extension Service, Institute of Food and Agriculture Sciences, EDIS.
Jamieson, S. (2004). Likert scales: how to (ab) use them. Medical education,
38(12), 1217–1218.
Johnson, M. D., & Fornell, C. (1991). A framework for comparing customer
satisfaction across individuals and product categories. Journal of
Economic Psychology, 12(2), 267–286. doi:10.1016/0167-
4870(91)90016-M
Keaveney, S. M., & Parthasarathy, M. (2001). Customer Switching Behavior in
Online Services: An Exploratory Study of the Role of Selected Attitudinal,
© 2014 University of Pretoria. All rights reserved. The copyright in this work vests in the University of Pretoria.

P a g e | 82
Behavioral, and Demographic Factors. Journal of the Academy of
Marketing Science, 29(4), 374–390.
Lee, R., Murphy, J., & Neale, L. (2009). The interactions of consumption
characteristics on social norms. Journal of Consumer Marketing, 26(4),
277–285.
Manning, M. (2011). When We Do What We See: The Moderating Role of
Social Motivation on the Relation Between Subjective Norms and
Behavior in the Theory of Planned Behavior. Basic & Applied Social
Psychology, 33(4), 351–364.
Martin, C. A., & Bush, A. J. (2000). Do role models influence teenagers’
purchase intentions and behavior? Journal of Consumer Marketing,
17(5), 441–453.
Milner, T., & Rosenstreich, D. (2013). Insights into mature consumers of
financial services. Journal of Consumer Marketing, 30(3), 248–257.
Mittal, V., & Kamakura, W. A. (2001). Satisfaction, Repurchase Intent, and
Repurchase Behavior: Investigating the Moderating Effect of Customer
Characteristics. Journal of Marketing Research (JMR), 38(1), 131–142.
© 2014 University of Pretoria. All rights reserved. The copyright in this work vests in the University of Pretoria.
P a g e | 83
Nelson, P. (1970). Information and Consumer Behavior. Journal of Political
Economy, 78(2), 311.
Nitzan, I., & Libai, B. (2011). Social Effects on Customer Retention. Journal of
Marketing, 75(6), 24–38.
Norman, P., Clark, T., & Walker, G. (2005). The Theory of Planned Behavior,
Descriptive Norms, and the Moderating Role of Group Identification.
Journal of Applied Social Psychology, 35(5), 1008–1029.
Nysveen, H., Pedersen, P. E., & Thorbj&3x00F8;rnsen, H. (2005). Explaining
intention to use mobile chat services: moderating effects of gender.
Journal of Consumer Marketing, 22(5), 247–256.
Pallant, J. (2010). SPSS Survival Manual: A Step by Step Guide to Data
Analysis using SPSS for Windows (4th ed.). Berkshire: Open Univerity
Press.
Park, H. M. (2008). Univariate analysis and normality test using SAS, Stata, and
SPSS. The University Information Technology Services (UITS) Center for
Statistical and Mathematical Computing, Indiana University.
© 2014 University of Pretoria. All rights reserved. The copyright in this work vests in the University of Pretoria.
P a g e | 84
Putrevu, S. (2001). Exploring the origins and information processing differences
between men and women: Implications for advertisers. Academy of
Marketing Science Review, 10(1), 1–14.
Ranaweera, C., & Prabhu, J. (2003). The influence of satisfaction, trust and
switching barriers on customer retention in a continuous purchasing
setting. International Journal of Service Industry Management, 14(4),
374–395.
Razali, N. M., & Wah, Y. B. (2011). Power comparisons of shapiro-wilk,
kolmogorov-smirnov, lilliefors and anderson-darling tests. Journal of
Statistical Modeling and Analytics, 2(1), 21–33.
Reichheld, F. F., & Sasser Jr., W. E. (1990). Zero defections: Quality comes to
services. Harvard Business Review, 68(5), 105–111.
Reichheld, F. R., & Markey Jr., R. G. (2000). The loyalty effect--the relationship
between loyalty and profits. European Business Journal, 12(3), 134.
Reinartz, W., Thomas, J. S., & Kumar, V. (2005). Balancing Acquisition and
Retention Resources to Maximize Customer Profitability. Journal of
Marketing, 69(1), 63–79.
© 2014 University of Pretoria. All rights reserved. The copyright in this work vests in the University of Pretoria.

P a g e | 85
Rust, R. T., & Tuck Siong Chung. (2006). Marketing Models of Service and
Relationships. Marketing Science, 25(6), 560–580.
Samson, A. (2006). Understanding the buzz that matters: negative vs positive
word of mouth. International Journal of Market Research, 48(6), 647–
657.
Saunders, M., & Lewis, P. (2012). Doing research in business and
management: An essential guide to planning your project. England:
Pearson.
Sharp, B. (2008). Net Promoter Score Fails the Test. Marketing Research,
20(4), 28–30.
Singelis, T. M., & Triandis, H. C. (1995). Horizontal and vertical dimensions of
individualism and collectivism: A theoretical and... Cross-Cultural
Research, 29(3), 240.
Triandis, H. C. (2001). Individualism-Collectivism and Personality. Journal of
Personality, 69(6), 907–924.
Triandis, H. C., Bontempo, R., Villareal, M. J., Asai, M., & Lucca, N. (1988).
Individualism and collectivism: Cross-cultural perspectives on self-
© 2014 University of Pretoria. All rights reserved. The copyright in this work vests in the University of Pretoria.

P a g e | 86
ingroup relationships. Journal of Personality and Social Psychology,
54(2), 323–338.
Triandis, H. C., & Gelfand, M. J. (1998). Converging Measurement of Horizontal
and Vertical Individualism and Collectivism. Journal of Personality &
Social Psychology, 74(1), 118–128.
Van den Poel, D., & Larivière, B. (2004). Customer attrition analysis for financial
services using proportional hazard models. European Journal of
Operational Research, 157(1), 196.
Weiers, R. (2010). Introduction to business statistics (7th ed.). Pennsylvania:
Cengage Learning.
White, K. M., Smith, J. R., Terry, D. J., Greenslade, J. H., & McKimmie, B. M.
(2009). Social influence in the theory of planned behaviour: The role of
descriptive, injunctive, and in-group norms. British Journal of Social
Psychology, 48(1), 135–158.
Woods, S., & West, M. (2010). The Psychology of Work and Organizations.
Hampshire: Cengage Learning.
© 2014 University of Pretoria. All rights reserved. The copyright in this work vests in the University of Pretoria.
P a g e | 87
Zeithaml, V. A. (2000). Service Quality, Profitability, and the Economic Worth of
Customers: What We Know and What We Need to Learn. Journal of the
Academy of Marketing Science, 28(1), 67–85.
Zikmund, W. (2003). Business research methods (7th ed.). Ohio: Thomson
Learning.
© 2014 University of Pretoria. All rights reserved. The copyright in this work vests in the University of Pretoria.

P a g e | I
Appendices
Appendix 1: Questionnaire Design
The questionnaire contains three sections, namely;
Section 1 (Demographic Profile) – Information of the respondents; age, gender,
policy status and location. This information was pre-populated based on
information provided by Bank A. This information was used to group and
measure respondents based on age. The results from this section were used to
test hypothesis 3.
Section 2 (Idiocentric/Allocentric) – The aim of this section was to identify if the
respondent is idiocentric or allocentric. The results from this section were used
to test hypothesis 4. The respondents answered 16 closed questions. A 5-point
Likert scale was utilised instead of the recommended 9-point scale due to the
data collection method. It was deemed to be too complicated to communicate a
9-point scale telephonically. The items were mixed up prior to administration of
the questionnaire. All items are answered on a 5-point scale, ranging from 1=
Strongly Disagree and 5 = Strongly Agree.
Below are the groupings for the questions.
Horizontal individualism items:
1. I'd rather depend on myself than others.
2. I rely on myself most of the time; I rarely rely on others.
3. I often do "my own thing."
© 2014 University of Pretoria. All rights reserved. The copyright in this work vests in the University of Pretoria.

P a g e | II
4. My personal identity, independent of others, is very important to me.
Vertical individualism items:
5. It is important that I do my job better than others.
6. Winning is everything.
7. Competition is the law of nature.
8. When another person does better than I do, I get tense and aroused.
Horizontal collectivism items:
9. If a coworker gets a prize, I would feel proud.
10. The well-being of my coworkers is important to me.
11. To me, pleasure is spending time with others.
12. I feel good when I cooperate with others.
Vertical collectivism items:
13. Parents and children must stay together as much as possible.
14. It is my duty to take care of my family, even when 1 have to sacrifice
what I want.
15. Family members should stick together, no matter what sacrifices are
required.
16. It is important to me that I respect the decisions made by my groups.
In this study it was not necessary to distinguish between horizontal or vertical
constructs, therefore items were grouped by either individualism or collectivism.
Collectivism score was computed by adding items 9, 10,11,12,13,14,15,16 and
© 2014 University of Pretoria. All rights reserved. The copyright in this work vests in the University of Pretoria.

P a g e | III
dividing by 8. Individualism was computed by adding items 1, 2,3,4,5,6,7,8 and
dividing by 8.
Section 3 (Normative effects) –The respondents answered 6 closed questions
relating to the hypotheses. The aim of this section was to identify the social
influences of the respondent. The results from this section were used to develop
a ‘Social Norm Score’. A 5-point Likert scale was utilised. This section
specifically looked at injunctive and descriptive norms. Injunctive norms were
assessed using two items. These items were “People who are important to me
would think that I should have some form of accidental death insurance”
(disagree-agree); and “Those people who are important to me would
approve/disapprove of me not having accidental death insurance.” (Disagree-
agree); Descriptive norms were assessed using two items. The descriptive
norm items were “Realistically, how many of your friends and family have some
form of accidental death insurance?” (none-all) and “Most of my friends and
family have some form of accidental death insurance” (Disagree-agree);
In order to generate a ‘Social Norm Score’, questions 17,18,19,20,21,22,23 and
24 were added together, the sum was then divided by 8.
© 2014 University of Pretoria. All rights reserved. The copyright in this work vests in the University of Pretoria.

P a g e | IV
Appendix 2: Questionnaire:
The data gathering process chosen for this study is a questionnaire. The
questionnaire contains three sections, namely;
Section 1 (Demographic Profile) – Information of the respondents; age, gender,
policy status and location. This information is pre-populated based on
information provided by Bank A.
Section 2 (Idiocentric/Allocentric) – The aim of this section is to identify if the
respondent is idiocentric or allocentric. The respondents will need to answer 16
closed questions
Section 3 (Normative effects) –The respondents will need to answer 8 closed
questions relating to the propositions. The aim of this section is to identify the
social influences of the respondent.
© 2014 University of Pretoria. All rights reserved. The copyright in this work vests in the University of Pretoria.

P a g e | V
Good morning/afternoon Mr/s… my name is [agent name] and I work for
O’Keeffe and Swartz.
Bank A together with an MBA student in the University of Pretoria’s Gordon
Institute of Business Science are conducting a study to assess the impact of
social norms on customer retention.
We would like to ask you some questions for this study. Your input would be of
great value and it will take no more than 7 minutes to complete the questions.
Mr/s….Your participation is completely voluntary and you can stop at any time
you like. Your answers will be kept 100% confidential; the results from this study
will be reported without any identifying information. This research is for
academic purposes and also to see how we can better help consumers.
May I go ahead and ask you a few questions?
Yes – Continue
No – Close interview
Great, Can I confirm that you are voluntarily taking part in this questionnaire?
Yes – Continue
No – Close interview
We would like to find out some information about your involvement with your
social network, which would include family, friends and people you do business
with.
© 2014 University of Pretoria. All rights reserved. The copyright in this work vests in the University of Pretoria.
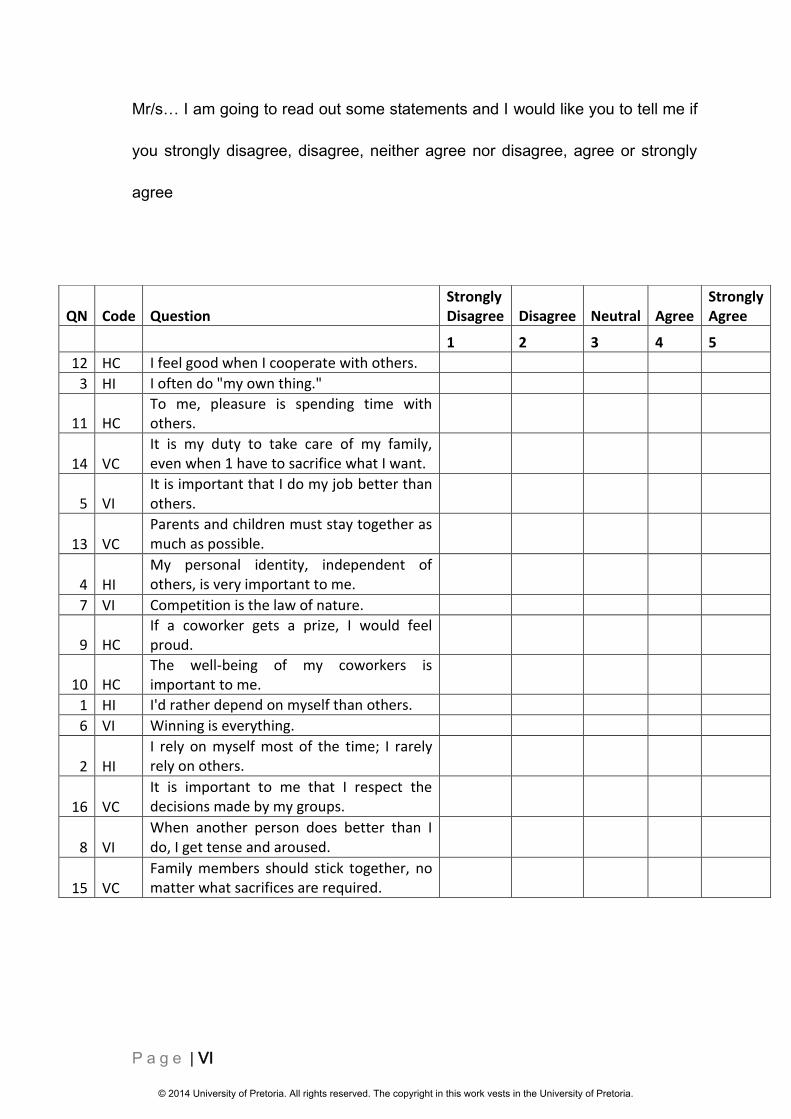
P a g e | VI
Mr/s… I am going to read out some statements and I would like you to tell me if
you strongly disagree, disagree, neither agree nor disagree, agree or strongly
agree
QN Code Question Strongly Disagree Disagree Neutral Agree
Strongly Agree
1 2 3 4 5
12 HC I feel good when I cooperate with others.
3 HI I often do "my own thing."
11 HC To me, pleasure is spending time with others.
14 VC It is my duty to take care of my family, even when 1 have to sacrifice what I want.
5 VI It is important that I do my job better than others.
13 VC
Parents and children must stay together as much as possible.
4 HI My personal identity, independent of others, is very important to me.
7 VI Competition is the law of nature.
9 HC If a coworker gets a prize, I would feel proud.
10 HC The well-being of my coworkers is important to me.
1 HI I'd rather depend on myself than others.
6 VI Winning is everything.
2 HI
I rely on myself most of the time; I rarely rely on others.
16 VC It is important to me that I respect the decisions made by my groups.
8 VI When another person does better than I do, I get tense and aroused.
15 VC Family members should stick together, no matter what sacrifices are required.
© 2014 University of Pretoria. All rights reserved. The copyright in this work vests in the University of Pretoria.
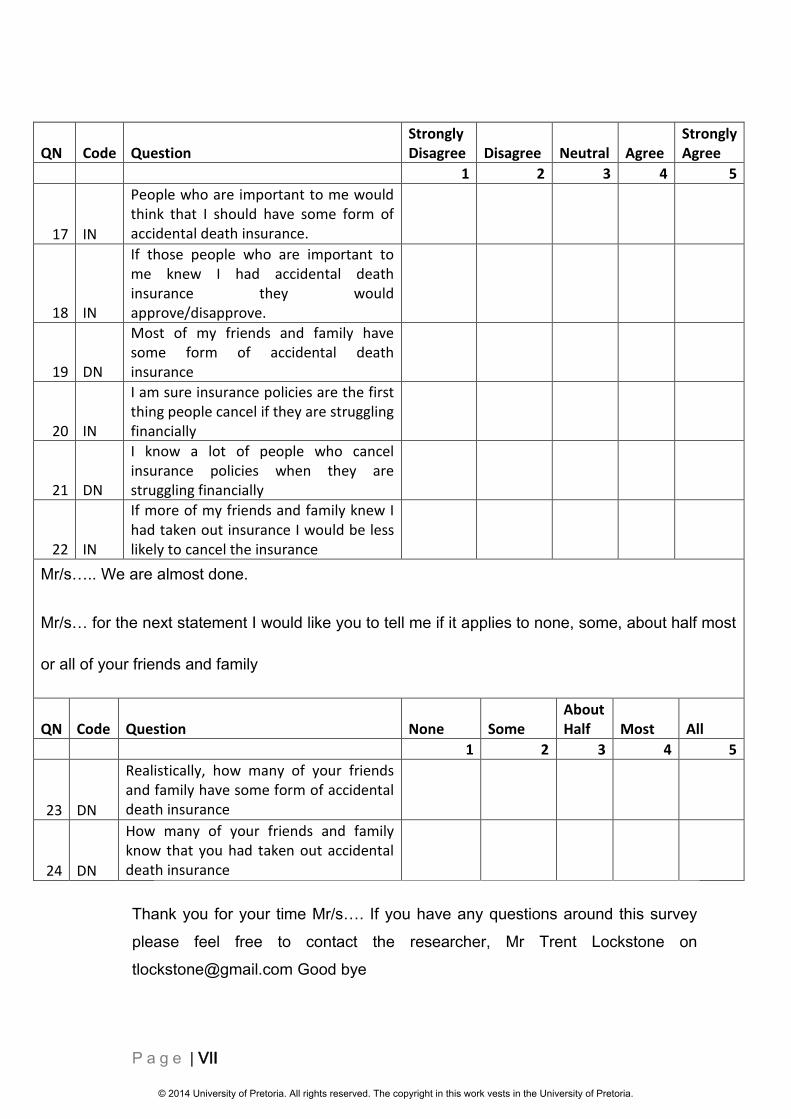
P a g e | VII
QN Code Question Strongly Disagree Disagree Neutral Agree
Strongly Agree
1 2 3 4 5
17 IN
People who are important to me would think that I should have some form of accidental death insurance.
18 IN
If those people who are important to me knew I had accidental death insurance they would approve/disapprove.
19 DN
Most of my friends and family have some form of accidental death insurance
20 IN
I am sure insurance policies are the first thing people cancel if they are struggling financially
21 DN
I know a lot of people who cancel insurance policies when they are struggling financially
22 IN
If more of my friends and family knew I had taken out insurance I would be less likely to cancel the insurance
Mr/s….. We are almost done.
Mr/s… for the next statement I would like you to tell me if it applies to none, some, about half most
or all of your friends and family
QN Code Question None Some About Half Most All
1 2 3 4 5
23 DN
Realistically, how many of your friends and family have some form of accidental death insurance
24 DN
How many of your friends and family know that you had taken out accidental death insurance
Thank you for your time Mr/s…. If you have any questions around this survey
please feel free to contact the researcher, Mr Trent Lockstone on
[email protected] Good bye
© 2014 University of Pretoria. All rights reserved. The copyright in this work vests in the University of Pretoria.