Influence ofHydrologic Processes onReproduction ofthe ... · Influence ofHydrologic Processes...
17
Influence of Hydrologic Processes on Reproduction of the Introduced Bivalve Potamocorbula amurensis in Northern San Francisco Bay, California! Francis Parchaso and Janet K Thompson 2 Abstract: Monthly censusing of reproductive condition of the Asian clam Pota- mocorbula amurensis at four sites in northern San Francisco Bay over a 9-yr pe- riod revealed year-to-year differences in local reproductive activity that are associated with patterns of hydrologic variability. Between 1989 and 1992, Northern California experienced a drought, whereas the period between 1993 and 1998 was marked by a mix of wet and dry years. We took advantage of the extreme year-to-year differences to examine reproductive responses to river in- flow patterns. Populations of P. amurensis at the upstream sites in Suisun Bay and Carquinez Strait were more reproductively active during wet years than dry years. Conversely, at the downstream site in San Pablo Bay, the population was more reproductively active during dry years than wet years. We suggest that the different reproductive patterns observed reflect the clam's response to different sources of food. During wet years, organic matter from the rivers augments food supplies in Suisun Bay. During dry years, when inflow into the San Francisco Bay Estuary from the rivers is reduced, water transported from the adjacent ocean into the estuary as far as San Pablo Bay provides a supplemental food supply for the local production. The populations take advantage of these spa- tially distinct food supplies by initiating and maintaining local reproductive activity. We conclude that the ability of P. amurensis to consume and use various types of food to regulate its reproductive activity is part of the reason for its success as an invasive species. THE ASIAN CLAM Potamocorbula amurensis, a native of East Asia, Khabarovsk (a republic of the former Soviet Union), and Korea, was introduced into San Francisco Bay in 1986. The success with which P. amurensis colo- nized and established itselfin the benthic com- munity of San Francisco Bay has been well documented (Thompson et al. 1988, Carlton et al. 1990, Nichols et al. 1990), although the reasons for its success have not been dis- cussed. In this period of accelerating rates of - 1 Support for this project was provided by the San Francisco Bay Toxic Substances Hydrology Program and the San Francisco Bay Place-Based Ecosystem Program. Manuscript accepted 28 November 200l. 2 U.S. Geological Survey, Water Resources Division, Menlo Park, California 94025. Pacific Science (2002), vol. 56, no. 3:329-345 © 2002 by University of Hawai'i Press All rights reserved exotic species introductions in estuaries, and in San Francisco Bay in particular (Cohen and Carlton 1998), the mechanisms of the successful spread of a species following inoc- ulation is of growing interest. In a 2-yr period (1986-1987) P. amurensis spread throughout San Francisco Bay, occupying a variety of in- tertidal and subtidal substrates (sand, clay, mud, peat, and combinations thereof) in a wide range of salinities (1 to > 30 psu) (Carl- ton et al. 1990). The spatial success of P. amurensis is acutely relevant in this estuary because P. amurensis is an efficient filter feeder, able to filter food -rangirtg-ihsize from bacte- ria to copepod larvae (Werner and Holli- baugh 1993, Kimmerer et al. 1994). Several authors (Cloern 1982, Nichols 1985) have suggested mechanisms by which the filter- feeding benthos, primarily bivalves, can con- trol phytoplankton biomass in both South and North San Francisco Bay, and Alpine and Cloern (1992) hypothesized that P. amurensis 329
-
Upload
truongngoc -
Category
Documents
-
view
218 -
download
0
Transcript of Influence ofHydrologic Processes onReproduction ofthe ... · Influence ofHydrologic Processes...

Influence of Hydrologic Processes on Reproductionof the Introduced Bivalve Potamocorbula amurensis
in Northern San Francisco Bay, California!
Francis Parchaso and Janet K Thompson2
Abstract: Monthly censusing of reproductive condition of the Asian clam Potamocorbula amurensis at four sites in northern San Francisco Bay over a 9-yr period revealed year-to-year differences in local reproductive activity that areassociated with patterns of hydrologic variability. Between 1989 and 1992,Northern California experienced a drought, whereas the period between 1993and 1998 was marked by a mix of wet and dry years. We took advantage of theextreme year-to-year differences to examine reproductive responses to river inflow patterns. Populations of P. amurensis at the upstream sites in Suisun Bayand Carquinez Strait were more reproductively active during wet years than dryyears. Conversely, at the downstream site in San Pablo Bay, the population wasmore reproductively active during dry years than wet years. We suggest that thedifferent reproductive patterns observed reflect the clam's response to differentsources of food. During wet years, organic matter from the rivers augments foodsupplies in Suisun Bay. During dry years, when inflow into the San FranciscoBay Estuary from the rivers is reduced, water transported from the adjacentocean into the estuary as far as San Pablo Bay provides a supplemental foodsupply for the local production. The populations take advantage of these spatially distinct food supplies by initiating and maintaining local reproductiveactivity. We conclude that the ability of P. amurensis to consume and use varioustypes of food to regulate its reproductive activity is part of the reason for itssuccess as an invasive species.
THE ASIAN CLAM Potamocorbula amurensis, anative of East Asia, Khabarovsk (a republic ofthe former Soviet Union), and Korea, wasintroduced into San Francisco Bay in 1986.The success with which P. amurensis colonized and established itself in the benthic community of San Francisco Bay has been welldocumented (Thompson et al. 1988, Carltonet al. 1990, Nichols et al. 1990), although thereasons for its success have not been discussed. In this period of accelerating rates of
- 1 Support for this project was provided by the SanFrancisco Bay Toxic Substances Hydrology Program andthe San Francisco Bay Place-Based Ecosystem Program.Manuscript accepted 28 November 200l.
2 U.S. Geological Survey, Water Resources Division,Menlo Park, California 94025.
Pacific Science (2002), vol. 56, no. 3:329-345© 2002 by University of Hawai'i PressAll rights reserved
exotic species introductions in estuaries, andin San Francisco Bay in particular (Cohenand Carlton 1998), the mechanisms of thesuccessful spread of a species following inoculation is of growing interest. In a 2-yr period(1986-1987) P. amurensis spread throughoutSan Francisco Bay, occupying a variety of intertidal and subtidal substrates (sand, clay,mud, peat, and combinations thereof) in awide range of salinities (1 to >30 psu) (Carlton et al. 1990). The spatial success of P.amurensis is acutely relevant in this estuarybecause P. amurensis is an efficient filter feeder,able to filter food -rangirtg-ihsize from bacteria to copepod larvae (Werner and Hollibaugh 1993, Kimmerer et al. 1994). Severalauthors (Cloern 1982, Nichols 1985) havesuggested mechanisms by which the filterfeeding benthos, primarily bivalves, can control phytoplankton biomass in both Southand North San Francisco Bay, and Alpine andCloern (1992) hypothesized that P. amurensis
329

330 PACIFIC SCIENCE· July 2002
is responsible for the disappearance of theannual phytoplankton bloom in the northernbay. The continuing dominance of P. amurensis in San Francisco Bay has also resulted inchanges in the San Francisco Bay ecosystemby altering both benthic community structureand interspecific dynamics (Nichols et al.1990).
An important component in the spatiallyextensive success of P. amurensis is its abilityto reproduce and recruit into establishedbenthic communities under highly variableconditions characteristic of the estuarine environment. In this study, we examined connections between patterns of change in theestuary's hydrologic regime and the reproductive patterns of P. amurensis during a 9-yrperiod at four sites along the salinity gradientin northern San Francisco Bay. We show thatP. amurensis successfully reproduces in northern San Francisco Bay every year, and that
local reproductive patterns within each yearare related to spatial and temporal changes inthe hydrologic conditions and thus in thefood supply along the salinity gradient of theestuary. The success of P. amurensis in thissystem is therefore related to its ability to usea variety offood sources and the apparent lackof temperature or salinity control on reproductive activity.
Hydrologic Setting
The drainage basin of the Sacramento-SanJoaquin River system (Figure 1) is the sourceof 90% of the freshwater inflow into SanFrancisco Bay (Conomos et al. 1985). Freshwater flow within this river-estuary system,although managed by dams and diversions, isseasonal, composed of rainfall runoff in thewinter and snowmelt in the spring and earlysummer. The adjacent Pacific Ocean is the
600000
500000
400000
----c2lu-; 300000ofi:
200000
100000
19971996199519941993199219911990
o,'U~MftlIlM."""""~-~~~-~~~Wf--~':-~.L,~~
1989
FIGURE 1. Freshwater flow from the drainage basin of the Sacramento and San]oaquin Rivers into San Francisco Bay.Inset shows smdy area.

Influence of Hydrologic Processes on Potamocorbula amurensis . Parchaso and Thompson
oo 10 kilometers
331
FIGURE 2. Northern San Francisco Bay and Sacramento and San]oaquin River Delta showing collection sites in central San Pablo Bay, Carquinez Strait, and Suisun Bay. All stations are located in the deep-water shipping channel.
source of saline water that is transportedtidally into San Francisco Bay through theGolden Gate (Figure 2). The extent of themarine influence on the salinity gradientwithin San Francisco Bay is highly seasonal.In dry summers, saline water can reach as faras the confluence of the Sacramento and SanJoaquin Rivers. During extremely wet winterslow-salinity water « 10 psu) can be foundthroughout northern San Francisco Bay andbeyond the Golden Gate (Conomos et al.J985). -
During this study, California experienced a6-yr drought that ended in 1993 (Figure 1).The following year, 1994, was also a dry year.The California Department of Water Resources classified the remaining years of thisstudy (1995-1997) as wet years. The differinghydrologic conditions during this study provide a contrast in environmental influences
that coincide with changes in the reproductive behavior of P. amurensis.
Bivalve Reproductive Strategies
Giese and Pearse (1974, 1979), in their reviewof reproduction in bivalves, described manyexogenous regulators of gametogenesis. As anexample, they pointed out that it is importantthat marine invertebrates reproduce at a timewhen the young have a good chance of surviving (e.g., when temperatures; salinity, -orfood conditions are favorable for larval survival). Often, reproductive activities such asgametogenesis are begun much in advance ofsuch favorable conditions, indicating thatsome environmental changes must act as earlycues to synchronize reproduction with thesubsequent favorable conditions. These environmental changes represent an indirect

332
exogenous control on reproduction. Suchenvironmental changes need not be restrictedto a single factor, but may consist of severalfactors that, when operating together, canexternally stimulate synchrony of reproductive activities.
Studies of the reproductive cycles of otherintroduced bivalves common in San FranciscoBay show that bay populations tend to havelonger reproductive seasons than are reportedfor conspecific populations on the Atlanticand Pacific Northwest coast of North America. For example, Rosenblum and Niesen(1985) found that Mya arenaria was reproductively active from March through November in San Francisco Bay, a reproductive __season 2 months longer than seen in populations in the state of Washington. Pacificcoast populations of M. arenaria also have asingle reproductive season, whereas Atlanticcoast populations have a biannual reproductive cycle. These differences in the reproductive cycle of M. arenaria have been attributedto differences in temperature regimes: SanFrancisco Bay has a longer period of optimum temperatures than in Washington; favorably warm temperatures occur initiallybetween March and April and secondarilybetween June and July on the East Coast(Rosenblum and Niesen 1985).
Varon (1978) found a similarly long reproductive season in Venerupis japonica, anative of Japan, in San Francisco Bay (Aprilthrough October), which is slightly longerthan that of the same species in Washington(April through September). He also noted thatpopulations in Japan have biannual spawnsand suggested that the differing temperatureregimes among the three locations may beresponsible for their different reproductivepatterns.
Previous studies of reproduction in P.amurensisand- congeneric species have described the reproductive behavior and suggested environmental factors that may influence reproduction. In San Francisco Bay,Parchaso (1995) found that P. amurensis is dioecious, begins reproducing at approximately4 mm in length, and has both seasonal reproduction in Suisun Bay and near-continuous reproduction in South San FranciscoBay. Furthermore, temperature and salinity
PACIFIC SCIENCE· July 2002
changes were not controlling factors of reproduction. That earlier work was conducted during the previously mentioned 6-yrdrought.
Carlton et al. (1990) reviewed reproduction literature for a congeneric species inAsia, Potamocorbula laevis, and found that thisspecies undergoes gametogenesis betweenmid-September and mid-October when watertemperature is between 12 and 23°C. Potamocorbula laevis is primarily dioecious, with afew hermaphrodites observed. Fertile eggsare released when water temperature is between 16 and 20°C. Metamorphosis to a veliger larva occurs after 20 to 22 days, andsettlement occurs after 30 to 40 days at a sizeof 370 /lm.
Study Locations
Northern San Francisco Bay is a partiallymixed estuary dominated by seasonally varying river flow from the Sacramento and SanJoaquin Rivers, which are fed by numeroustributary rivers and streams that drain theSierra Nevada Range (Figure 1). Our foursampling sites are located in three differentregions along the salinity gradient of thenorthern San Francisco Bay estuary: (1) Suisun Bay, (2) Carquinez Strait, connecting SanPablo Bay and Suisun Bay, and (3) San PabloBay (Figure 2). These regions were selectedto represent different environmental characteristics, each with distinct patterns of variation in physical characteristics (e.g., temperature and salinity) at the sites.
The Mallard Island station (MI) is locatednear the confluence of the Sacramento andSan Joaquin Rivers (Figure 2). During thewinter and spring, salinities can be as low aso psu and temperatures can be as low as4°C. During the summer and fall, salinitiesrange from 1Oto 15psu-and temperatures canreach 23°C (Conomos 1979, Cloern andNichols 1985).
The Concord Naval Weapons Station(CNWS) site is located north of the ConcordNaval Weapons Station in the southern partof Suisun Bay and in the deep-water shippingchannel (Figure 2). The salinity and temperature characteristics are similar to those atMI.

Influence of Hydrologic Processes on Potamocorbula amurensis . Parchaso and Thompson 333
The Carquinez Strait station (CS), locatedin the narrow channel that connects Suisunand San Pablo Bays (Figure 2), is characterized by high tidal current velocities andenhanced vertical tidal mixing (Walters et al.1985). Carquinez Strait is a transitional zonebetween San Pablo Bay and Suisun Bay, withsalinities ranging from 2 psu in the winter to15 psu in the summer (Conomos et al. 1985)and temperatures ranging between 10 and20°C (Conomos 1979).
The San Pablo Bay site (SPB), in the largeembayment west of Carquinez Strait, is located on the edge of the shipping channel eastof Pt. Pinole (Figure 2). San Pablo Bay salinities range from 20-28 psu in the spring to24-30 psu in the fall, and temperatures rangefrom 8°C in the winter to 18°C in the summer (Conomos et al. 1985). Seasonal freshwater and marine influences characterize theSPB site.
MATERIALS AND METHODS
Potamocorbula amurensis specimens were collected monthly from the four subtidal stations, from October 1989 to December 1997,to determine their reproductive condition.Clams were collected with a Van Veen grab(0.05 m2) and preserved in 10% buffered formalin. In the laboratory, 10 to 15 clams representing the full size range available at eachstation were examined for each sampling date.Minimum sample size was 10 except duringmonths when tissue samples were damagedduring the histological processing or whenanimals were difficult to collect.
The visceral mass of each clam was removed and stored in 70% ETOH. Thetissues were prepared using standard histological techniques. The embedded sampleswere thin sectioned using a microtome and
- then·· staihed- with- Hari"is'lierilatoxylin andeosin. The stained thin sections were examined with a light microscope. Each specimenwas characterized by sex and developmentalstage of the gonads, thus allowing each specimen to be placed in one of five qualitativestages ofgonadal development: inactive, active,ripe, spawning, and spent.
Individuals at each reproductive stage ateach station were tabulated and the data con-
vetted to percentages. Although five gonadalstages were defined, gonadal development inmany of the clams was continuous, and theclams were commonly in transition betweenstages (e.g., developing from active to ripe).To alleviate the difficulty in determining thedevelopmental stages of clams in transitionbetween the defined stages, the percentagesof clams in the active, ripe, and partially spentstages were given positive values (multipliedby +1), and the percentages of clams in theinactive and spent stages were given negativevalues (multiplied by -1). These values weresummed for each month at each station, andthese represent the "central tendency of reproduction." For example: a month with 30%active, 10% ripe, and 70% inactive clamswould be scored as -30%. A Kruskal-Wallisone-way analysis of variance (ANOVA) wasused to test significance among the monthlycentral tendencies. The coefficient of variation of each month was used to compare thevariation in reproduction between wet anddry years.
To characterize the physical and biologicalenvironment of northern San Francisco Bayduring our study, we used temperature, salinity, and cWorophyll data collected by otheragencies. The California Department ofWater Resources (CDWR) collected MallardIsland and Carquinez Strait salinity and temperature data every hour using an in situsurface conductivity and temperature sensor(California Department of Water Resources1999). San Pablo Bay data were collectedevery 15 min by the U.S. Geological Survey(USGS) using in situ conductivity and temperature sensors on the surface and bottom(Buchanan 1999). These salinity and temperature data were summarized to acquire amean monthly value for wet and dry years.CWorophyll a flux was calculated as describedby Jassby etar (1993): mUltiplication nClliecharacteristic surface cWorophyll a concentration of the Sacramento and San JoaquinRivers by their outflow rates. These valuesrepresent the estimated carbon from microalgae that are transported into the bay fromthe freshwater tributaries. Because primaryproduction can be high in these areas, thecarbon flux can be substantial (Jassby et al.1993). CWorophyll a concentrations for the

334
cWorophyll flux calculation and for cWorophyll a concentrations at the MI, CNWS,CS, and SPB sites and for central San Francisco Bay were provided by the USGS(Wienke et al. 1990, 1991, 1992, 1993, Caffrey et al. 1994, Edmunds et al. 1995, 1997,Baylosis et al. 1997, 1998). Kendall's Tao andKendall's concordance correlations were usedto test significance between reproductive central tendency and physical parameters.
RESULTS
Reproductive Patterns
Potamocorbula amurensis reached reproductivematurity (i.e., sperm and eggs were present)each year at all four locations. Reproductivelyactive individuals were observed in salinitiesas low as 0.1 psu (spring, Suisun Bay) and ashigh as 27.6 psu (summer, San Pablo Bay)and at temperatures ranging from 6.4°C (winter, Suisun Bay) to 23.0°C (summer, SuisunBay). There were marked temporal differences in the central tendency of reproductionamong the populations of P. amurensis.
WET YEARS. During wet years (1993,1995, 1996, and 1997), a greater percentageof individuals at the stations closer to freshwater inflow (MI and CNWS) were reproductively active than individuals duringdry years (Figure 3). The reproductive centraltendency of the MI population (the closest tofreshwater inflow) showed reproductiveactivity for 10 months during wet years. Theonly months of reproductive inactivity wereJune and October. The population at the nextclosest down-bay station, CNWS, was activefor 9 months. The populations at the stationscloser to the marine influence, CS and SPB(Figure 3), were active for shorter periods (8months) than the populations at the fresher1 -- - -.--- - - -ocatlons.
DRY YEARS. Reproductive activity wasshorter in duration and a smaller percentageof individuals were reproductive during thedry years (1989-1992, 1994), relative to thewet years, at the stations closest to freshwaterinflow (MI, CNWS, and CS) (Figure 3). Although there was reproductive activity fromJanuary through May at MI, the percentages
PACIFIC SCIENCE· July 2002
of reproductive individuals during dry yearsshow a consistent trend of being lower thanthe percentages during wet years. During thesummer and fall, reproductive activity wasobserved only in September. The MI population initiated reproductive activity againin November and December. Reproductiveactivity in the CNWS population was of alesser magnitude and shorter duration during dry years than during wet years. TheCNWS and CS populations were active for4-5 months, primarily from January throughApril and then again in December at CNWS.SPB animals showed an opposite trend fromthat seen at the other sites, with reproductiveactivity greater in duration and in magnitudefor most months during the dry years thanduring wet years (Figure 3). The SPB population was reproductively active from January toMay and again from July through December.
The coefficients of variation for the centraltendencies were in phase for dry and wetyears during the winter and spring for populations at the freshest station, during winterand fall at MI and CNWS, although the coefficient of variation was larger, with one exception, in the dry years at these stations(Figure 4). Peaks in the monthly coefficient ofvariation at CS were out of phase for the wetand dry years only during spring. The coefficients of variation for the CS population(Figure 4) peaked in summer and fall duringthe wet years and dry years. Conversely, thecoefficient of variation for the CS populationwas very high in spring of dry years, but thewet-year coefficient of variation was at anannual low during spring. The variability ofSPB central tendency values in wet and dryyears was mostly out of phase with the greatest variability occurring during the late springin the dry years and the late summer in thewet years.
DISCUSSION
Interannual differences in freshwater inflowsfrom the Sacramento and San Joaquin Riversare shown by marked differences in salinitydistributions in the estuary. Although thedaily average salinity dropped between January and April during every year of the study,

Influence of Hydrologic Processes on Potamocorbula amurensis . Parchaso and Thompson 335
100
80 100
60 80
~ 40 ~600
;.,0
40<.> 20 ;.,e <.>
" e 20-0 "e 0 -0
" e 0I- "~
-20 I--20
" -40 ~ -40U "-60 u -60
-80 -80
-100, -100
MI
100 . , 100., .80
80
60 ~60
~
0
40~ ;.,~ 40 g 20;.,
"<.> 20 -0e e 0" "-00 l-e -20" ~I-
] -20 an -40"e -40 U -60
"u-80-60
-80 -100
-100CNWS
.' .
CS
SPB
FIGURE 3. Mean monthly central tendency (percentage with 1 SD) of reproductive (positive) and nonreproductive(negative) populations at the Mallard Island (MI), Concord Naval Weapons Station (CNWS), Carquinez Strait (CS),and San Pablo Bay (SPB) locations during pooled wet (.) and dry (.) years. Central tendency (y axis) is an index thatcombines the percentage of reproductive individuals (active, ripe, and spawning, see text for definitions) and nonreproductive individuals (inactive and spent). For clarity nonreproductive central tendency values are given negativevalues. Periods of significant differences between wet and dry years are indicated (*, P < 0.10; **, P < 0.05).
corresponding to periods of freshwater inflows, dry years obviously had substantiallyhigher average salinities than wet years. Thesalinity at the most up-stream station, Mallard Island, and the down-stream station,Carquinez Strait, dropped to 0 psu in the wetyears (Figure 5).
Spatial differences in salinity reflect the--~----estuatme-nature--of nortlIern-San-Frane1s-co
Bay. Mallard Island, the location farthest upstream, had the lowest mean monthly salinityvalues and narrowest range (0 to 10 psu)(Figure 5). In contrast, the mean monthly salinity in San Pablo Bay showed a strong marine influence and ranged from 12 to 29 psu.The variability in the mean monthly salinityat the Carquinez Strait station was the great-
est of all the stations sampled, ranging from 2to 22 psu (Figure 5).
Reproductive individuals of P. amurensiswere found throughout the salinity range investigated in this study. However, reproductive seasonality was not consistent among thestations. For example, the Suisun Bay populations (M! and CNWS) of P. amurensis<leifiOfistfateo- a seasoIYal- rept6chfctive -cyclethat was characterized by a high percentageof reproductive individuals during wet years.In contrast, the San Pablo Bay population,the most marine station, had near-continuousreproductive activity during the high-salinitydry years.
Fluctuations in salinity, particularly inshallow marine areas and estuaries that expe-

336 PACIFIC SCIENCE· July 2002
2 2c: c:0 0.~
1.5.~
1.5.1: .1:
'" '"> >..... .....0 0
c c., .,<J <J
lE 0.5 lE 0.5., .,0 0U U
0 0
Jan Mar May Jul Sep Nov Jan Mar May Jul Sep Nov
MI CS
2 2c: c:0 0.~
1.5.~
1.5.1: .1:
'" '"> >..... .....0 0
c c., .,<J <J
!E 0.5 lE 0.5., .,0 0
U U
0 0
Jan Mar May Jul Sep Nov Jan Mar May Jul Sep Nov
CNWS SPB
FIGURE 4. Variability of central tendency of individuals at the Mallard Island (MI), Concord Naval Weapons Station(CNWS), Carquinez Strait (CS), and San Pablo Bay (SPB) locations during pooled wet (.) and dry (.) years.
rience large and prolonged changes in salinity The recorded average mean monthly temduring periods of heavy rainfall, have been perature at all locations showed seasonalsuggested as possible factors for regulating variability (Figure 5) and little interannualreproduction in some marine invertebrates variation. There was little spatial variability in(Giese and Pearse 1974, 1979). For example, the mean monthly values. Throughout theWilson (1969) showed that gametogenesis sample locations, the mean monthly temperand spawning in a Western Australian estua- atures ranged from 8 to 22°C. Reproducrine mussel, Xenostrobus securus, are related to tive activity at all the stations was observedsalinity fluctuations, and that spawning occurs throughout the observed temperature rangeat different times in several populations, in (Figure 6).each case correlated with a critical salinity The differences in reproductive patternslevel. The onset of gametogenesis, matura- between wet and dry years in Suisun Bay aretion of gametes, and spawning occurs in syn- associated with variations in freshwater flowchrony with periods of rainfall each year, into Suisun Bay from the Sacramento and
- reg3:r-dlessof~tD.etiming-bfthe rainfall-periods· ·-San-Joaquin -Rivers, burare-norsp-ecifrcallyand thus regardless of temperature within a related to some critical salinity, temperature,given year. We show here that the processes or volume of freshwater flow. We suggestthat determine patterns of salinity (i.e., fresh- that the seasonality of reproduction in Suisunwater flow) also appear to control the repro- Bay populations is linked to the seasonal naductive patterns of P. amurensis in northern ture of locally produced phytoplankton andSan Francisco Bay, but that neither salinity river-borne food supplies. Because of its abilnor temperature are, by themselves, control- ity to efficiently filter and assimilate a wideling factors of reproduction. range of particle sizes and food types, from

14
12
iil 108 8.£ 6.5;;;en 4
2
O+-'F~""~~!-r-l;"'==-'--~---,----.----':=-,
Jan Mar May Jul Sep Nov
SalinityMI
30
25
~ 208~ 15:5;3j 10
5
O+:l:,...;I;...,..<'"-r-'=-r----,-------.-~_____,~,_____~~
Jan Mar May Jul Sep Nov
Salinity CS
35
30
";' 258 20
.£ 15.5;3j 10
5
O+--.----.----.---~~~,__,__,_____,_____.__.
Jan Mar May Jul Sep Nov
Salinity SPB
25
~ 20
e 15
~"c..
~ 5
Jan Mar May Jul Sep Nov
Temperature for all stations
FIGURE 5. Mean monthly salinity (psu) at the MaIlard Island (Ml), Carquinez Strait (CS), and San Pablo Bay (SPB)locations during pooled wet (.) and dry (+) years; mean monthly temperature eC ± 1 SD) at the Mallard Island,Carquinez Strait, and San Pablo Bay locations during pooled wet (.) and dry (+) years.

25.00
•
100
-100
PACIFIC SCIENCE· July 2002
".'1" •••• ••
>, 50 • • •
~ ..~ 0+---.------,-------..:----,~ 5. 0 10.00 15.00 ~.toa-50
25.00
......•• •
..100
-100
i 50 , •-g •~ 0 +----.----.--.----.--'.-:---.
U1 5.)0 10.00 15.00 '0.00·- -50 • ••••..
338
Mean Temperature Mean Temperature
MIDryyear Mi Wet year
25.00
..
............. ..100
-100
>,g 50
1f- 0 +----,-----4~._-.~,__-_____,•~ 5.)0 10.00 15.00 20.01t
U -50 ••
25.00.15.00 20.00
• • .$•••••
100
-100
Mean Temperature Mean Temperature
GS Dry year CS Wet year
25.00...•
50
100
-100
.......• •.. ......
o+---r------,-+.~h----,1 5.)0 10.00 15.00. '0.00U -50
•
~.oo
• •10.00
50
100
-100
~ ... .... .:. ......• •0+----,__---,+---------,
U1 5.0- -50
Mean Temperature Mean Temperature
SPB Dry year SPB Wet year
FIGURE 6. Scatter plot of temperature versus central tendency (see text) at the Mallard Island (MI), Carquinez Strait(CS), and San Pablo Bay (SPB) locations during pooled wet and dry years.
phytoplankton to free and particle-bound bacteria (Decho and Luoma 1991, Werner andHollibaugh 1993), P. amurensis is able to use avariety of food resources. We know that the
seasonal patterns of freshwater flow are directly related to the quantity and quality ofcarbon in this system. Up to 75% of the carbon found in Suisun Bay could be traced to

Influence of Hydrologic Processes on Potamocorbula amuremis . Parchaso and Thompson 339
riverine inputs (Jassby et al. 1993) before theelimination of the phytoplankton bloom in1987. With the introduction of P. amurensisto the system, allochthonous sources of carbon are likely to be even more important thanautochthonous sources of carbon (Schemel etal. 1996). We also know that the timing offreshwater inputs is critical to the quality offood available to organisms in Suisun Bay.Although freshwater transports suspendedsolids from the Sacramento and San JoaquinRivers into Suisun Bay, the relationship between freshwater outflow and suspended solidconcentration and the concentration of labilecarbon is not correlated. The initial pulse offreshwater from the first rains of the rainyseason, usually in the late fall or early winter,is the greatest source of suspended solids intoSuisun Bay (Ruhl and Shoelhammer 1997)and is likely to be a combination of near-fieldwatershed and marsh sediments and particulate matter (Jassby and Cloern 2000). Subsequent rain and snowmelt events transportsuspended solids downstream but not at thesame magnitude or with the same high percentage of labile carbon (Canuel and Cloern1996) as the first pulse of the rainy season.
Food transported into Suisun by way ofthis first freshwater pulse may be the energysource that initiates reproductive activity in P.amurensis in winter. This is the most consistent reproductive cue seen for P. amurensis
during all wet years as shown by the lowvariability in positive reproductive activityduring this period (i.e., the coefficient ofvariation of the reproductive central tendencywas consistently low during wet winters)(Figure 4). The lack of large storms duringdry years produces less particulate carbon(Jassby and Cloern 2000) and is less likely toproduce a large, one-time pulse of particulatecarbon from the spatially disparate sourcesof carbon, the distant watershed and nearbymarshes. A5 we might expect, this cue was lesstemporally consistent during the dry yearsand the coefficients of variation during winterwere thus larger in dry years than in wetyears. Because this cue for initiation of reproduction is not linearly related to freshwater flow (i.e., maximum reproductive activity does not occur at minimum or maximumfreshwater flow volumes), we would not expect, nor do we see, a strong correlation between these variables (Table 1).
It is likely that some riverine sources offood are supplied to P. amurensis throughoutthe year. It is unknown what percentage ofthe suspended solids that are transported intothe bay contain bioavailable carbon at thetime of transport and how much is transformed in transit. It is clear that there arebacteria living on these particles once theyenter the bay and that they are both productive (Hollibaugh and Wong 1996) and sea-
TABLE 1
Significant Kendall's Tao and Kendall's Concordance Values for Central Tendency Versus CWorophyll aConcentration, Chlorophyll a Flux, and Freshwater Flow for Pooled Wet and Dry Years
Station Water Year Factor Kendall Tao Factor Kendall Concordance
MI Dry CWorophyll a and cWorophyll flux 0.87***Wet Freshwater flow 0.30* .ClJ1()rClphylla and clUClr()ph}'nHux~ 0.77***
-CNWS --- -Dry-- CWorophyll a and cWorophyll flux - ~~b:7f*';'Wet CWorophyll a 0.46*** CWorophyll a and cWorophyll flux 0.76***
CWorophyll flux 0.41***CS Dry CWorophyll a and cWorophyll flux 0.75**
Wet CWorophyll a 0.50***Chlorophyll flux 0.28*
SPB Dry CWorophyll a and cWorophyll flux 0.87**Wet CWorophyll flux 0.37*** CWorophyll a and chlorophyll flux 0.80***
Note: Significantly related physical factors were not included in these analyses.*, P < 0.05; **, P < 0.01; ***, P < 0.001.

PACIFIC SCIENCE· July 2002340
8.E+IO
7.E+IO
6.E+10
-;;;- 5.E+10bb5
>< 4.E+IO::l'i:>...c:: 3.E+10c.e0:;::
2.E+IOU
I.E+ 10
O.E+OO
-I.E+IO
1986 1988 1990 1992 1994 1996 1998
FIGURE 7. CWorophyll a flux into Suisun Bay from the Sacramento-San Joaquin River Delta from 1986 to 1998.
sonally varying (Murrel et al. 1999). The amurensis during spring and summer. Theabundance of particle-associated bacteria re- positive rank correlation between central tenmains constant between April and July, and deney and chlorophyll a concentration at twodeclines in August during which time the of the four sites (Table 1) supports this hyabundance offree-living bacteria concurrently pothesis. Phytoplankton from the tributariesincreases (Murre! et al. 1999). Because P. also enters the bay as bioavailable carbonamurensis is capable of feeding on free-living when phytoplankton growth rate exceeds resbacteria (Werner and Hollibaugh 1993), it is piration and consumption in the Sacramentolikely that riverine sources of carbon through- San Joaquin Delta. Freshwater phytoplanktonout the year are providing, at the least, a is transported into Suisun Bay throughout thesource of bacterial food, if not particulate year, but a peak in this transported carbonfood. The consumption of this food source by (shown as chlorophyll a flux, Figure 7) occursP. amurensis may contribute to the summer when peak flows and high chlorophyll a condecline in particle-associated bacteria (Murre! centrations are coincident. The amount ofet al. 1999). chlorophyll a transported into Suisun Bay
Locally produced phytoplankton and phy- during wet years was substantially greatertoplankton transported from other regions in than during dry years.the system are likely to be additional sources We suggest that food inputs from later
-~ .... 'of f~md' for-P:-amuren:sis:- Phytoplankton-pro:: --freshwaterpulses are-the~ cue that-determinesduction in the bay and in the rivers is highest the length of reproductive activity in spring.in the spring through late summer due to During wet years, freshwater input is proseasonal increases in hydraulic residence times tracted and food sources such as riverineand irradiance. Although phytoplankton bio- phytoplankton become available to even themass has declined in the northern bay since most down-bay populations. The magnitude1987, the higher primary production during of chlorophyll a flux into Suisun Bay from thethese seasons is likely to increase the impor- delta varied little in magnitude during drytance of phytoplankton as a food supply to P. years (1989-1992 and 1994), but consistently
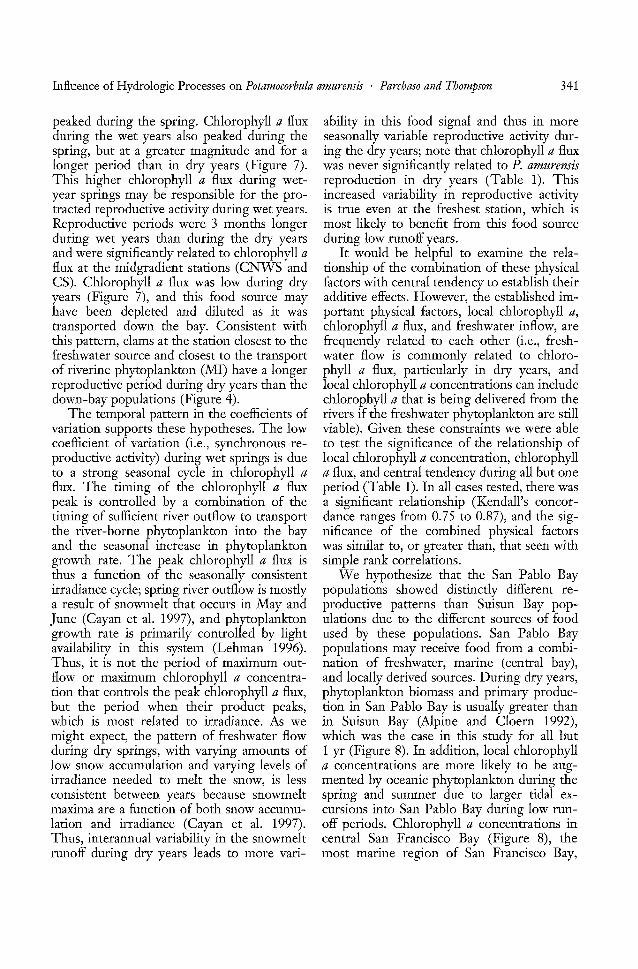
Influence of Hydrologic Processes on Potamocorbula amurensis . Parchaso and Thompson 341
peaked during the spring. Chlorophyll a flux ability in this food signal and thus in moreduring the wet years also peaked during the seasonally variable reproductive activity durspring, but at a greater magnitude and for a ing the dry years; note that cWorophyll a fluxlonger period than in dry years (Figure 7). was never significantly related to P. amurensisThis higher chlorophyll a flux during wet- reproduction in dry years (Table 1). Thisyear springs may be responsible for the pro- increased variability in reproductive activitytracted reproductive activity during wet years. is true even at the freshest station, which isReproductive periods were 3 months longer most likely to benefit from this food sourceduring wet years than during the dry years during low runoff years.and were significantly related to chlorophyll a It would be helpful to examine the relaflux at the midgradient stations (CNWS and tionship of the combination of these physicalCS). Chlorophyll a flux was low during dry factors with central tendency to establish theiryears (Figure 7), and this food source may additive effects. However, the established imhave been depleted and diluted as it was portant physical factors, local cWorophyll a,transported down the bay. Consistent with chlorophyll a flux, and freshwater inflow, arethis pattern, clams at the station closest to the frequently related to each other (i.e., freshfreshwater source and closest to the transport water flow is commonly related to chioroof riverine phytoplankton (MI) have a longer phyll a flux, particularly in dry years, andreproductive period during dry years than the local chlorophyll a concentrations can includedown-bay populations (Figure 4). chlorophyll a that is being delivered from the
The temporal pattern in the coefficients of rivers if the freshwater phytoplankton are stillvariation supports these hypotheses. The low viable). Given these constraints we were ablecoefficient of variation (i.e., synchronous re- to test the significance of the relationship ofproductive activity) during wet springs is due local chlorophyll a concentration, cWorophyllto a strong seasonal cycle in chlorophyll a a flux, and central tendency during all but oneflux. The timing of the chlorophyll a flux period (Table 1). In all cases tested, there waspeak is controlled by a combination of the a significant relationship (Kendall's concortiming of sufficient river outflow to transport dance ranges from 0.75 to 0.87), and the sigthe river-borne phytoplankton into the bay nificance of the combined physical factorsand the seasonal increase in phytoplankton was similar to, or greater than, that seen withgrowth rate. The peak chlorophyll a flux is simple rank correlations.thus a function of the seasonally consistent We hypothesize that the San Pablo Bayirradiance cycle; spring river outflow is mostly populations showed distinctly different rea result of snowmelt that occurs in May and productive patterns than Suisun Bay popJune (Cayan et a1. 1997), and phytoplankton ulations due to the different sources of foodgrowth rate is primarily controlled by light used by these populations. San Pablo Bayavailability in this system (Lehman 1996). populations may receive food from a combiThus, it is not the period of maximum out- nation of freshwater, marine (central bay),flow or maximum chlorophyll a concentra- and locally derived sources. During dry years,tion that controls the peak chlorophyll a flux, phytoplankton biomass and primary producbut the period when their product peaks, tion in San Pablo Bay is usually greater thanwhich is most related to irradiance. As we in Suisun Bay (Alpine and Cloern 1992),
._.. -mighr-exp-ect, th~patternoffre-shwa:t~rflbw-whichwa:sth·eca:se-in-thisstudy-for-all butduring dry springs, with varying amounts of 1 yr (Figure 8). In addition, local chlorophylllow snow accumulation and varying levels of a concentrations are more likely to be augirradiance needed to melt the snow, is less mented by oceanic phytoplankton during theconsistent between years because snowmelt spring and summer due to larger tidal exmaxima are a function of both snow accumu- cursions into San Pablo Bay during low runlation and irradiance (Cayan et a1. 1997). off periods. Chlorophyll a concentrations inThus, interannual variability in the snowmelt central San Francisco Bay (Figure 8), therunoff during dry years leads to more vari- most marine region of San Francisco Bay,

342 PACIFIC SCIENCE· July 2002
9.00
8.00
7.00
~ 6.00<::l
~ 5.00I:o
::2U 4.00
1'3 3.00OJU
2.00
1.00
19971996199519941993199219911990
0.00 +-------,-----T-------,------,----,----------r"---,-----,----
1989
FIGURE 8. Calculated chlorophyll a concentrations at MI (.), CNWS (-), CS (~), SPB (e), and central San Francisco Bay (.).
from which high-salinity water can be tidally the populations sampled (Duda 1992). A highadvected into San Pablo Bay, can peak in degree of genetic variability, allowing anboth spring and summer, but they show organism to have flexibility to respond tono hydrologically consistent pattern, because changes in environmental factors, could be ahigh values occur during dry and wet years. factor in the variable reproductive strategiesThus, it is a combination of river-transported and, thus, the success of P. amurensis in colocarbon, locally derived phytoplankton (which nizing and establishing itself in San Franciscopeaks in spring and fall in wet years, Figure Bay.8), and marine phytoplankton (which peaks in One of our motivating factors in doing thisspring and summer) that provides the near- study was to examine the reproductive charcontinuous food source for this population acteristics of P. amurensis that might contrib(Figure 8). These multiple sources are appar- ute to its success as an invading species. In theendy sufficient to support near-continuous estuarine environment, some of the factorsreproduction (10 months of the year) during that invading species must adapt to includedry years (Figure 3). seasonal variations in salinity, temperature,
Although there are large differences in the food supply, and predators. Presuming an.... reproducrive-patt~rITsof-Suisun-Ba:yand-S-~fll-.. invading-sp-eciesrequires-an--op-eninginth-e
Pablo Bay populations of P. amurensis, there community or a high number of propagulesis no evidence that the differences can be at- (Levine 2000), this opening can be used iftributed to genetic differences. The bay pop- individuals of a species have a greater tolerulation as a whole maintains high levels of ance to environmental extremes, the ability togenetic diversity, as measured in degrees of outcompete an existing species in the utilizaheterozygosity, levels of polymorphism, and tion of a resource, and are capable of prothe number of alleles per locus, but no dis- ducing a large number of larvae under a widertinct genetic difference was found between variety of conditions. It has been shown that

Influence of Hydrologic Processes on Potamocorbula amurensis . Parchaso and Thompson 343
ACKNOWLEDGMENTS
Literature Cited
We gratefully acknowledge Cindy Brown,Thomas Duda, Oscar Mace, Scott Shapley,and Michelle Shouse for their assistance inthe field; Byron Richards and Scott Conard ofthe RIV Polaris; and Dave Menaugh and hiscrew for their histology work. We thank SamLuoma, Fred Nichols, and two anonymousreviewers for reviewing this work.
P. amurensis larvae are capable of surviving alarge range in salinity and temperature (Nicolini and Penry 2000). Thus, it is likely thatonce P. amurensis settled into San FranciscoBay, its ability to (1) utilize locally available,but varying sources of food resources tomaximize reproductive activity, (2) withstandand reproduce during wide changes in salinityand temperature, and (3) survive as a larva ina wide range of salinities and temperaturesallowed P. amurensis to produce many larvaeand establish a continuing presence in thebenthic community of San Francisco Bay.
ronment in the San Francisco Bay Estuary,California: Regional monitoring results,1993. U.S. Geological Survey Open-FileReport 94-82.
California Department of Water Resources.1999. California data exchange center(http://cdec.water.ca.gov/).
Canuel, E. A., and J. E. Cloern. 1996. Regional differences in the origins of organicmatter in the San Francisco Bay ecosystem. Pages 305-324 in J. T Hollibaugh,ed. San Francisco Bay: The ecosystem.American Association for the Advancement of Science, Pacific Division, SanFrancisco.
Carlton, J. T, J. K. Thompson, L. E. Schemel, and F. H. Nichols. 1990. Remarkableinvasion of San Francisco Bay (California,USA) by the Asian clam Potamocorbulaamurensis. I. Introduction and dispersal.Mar. Ecol. Prog. Ser. 66:81-94.
Cayan, D. R, D. H. Peterson, L. Riddle, M.D. Dettinger, and R Smith. 1997. Springrunoff pulse from the Sierra Nevada. IEP(Interagency Ecol. Program) Newsl. 10(3): 25-28.
Cloern, J. E. 1982. Does the benthos controlAlpine, A. E., andJ. E. Cloern. 1992. Trophic phytoplankton biomass in South San Fran-
interactions and direct physical effects cisco Bay? Mar. Ecol. Prog. Ser. 9: 191-control phytoplankton biomass and pro- 202.duction in an estuary. Limnol. Oceanogr. Cloern, J. E., and F. H. Nichols. 1985. Time37:946-955. scales and mechanisms of estuarine vari-
Baylosis, J. I.,]. L. Edmunds, B. E. Cole, and ability, a synthesis from studies of SanJ. E. Cloern. 1997. Studies of the San Francisco Bay. Hydrobiologia 129:229-Francisco Bay, California estuarine eco- 237.system: Pilot regional monitoring results, Cohen, A. N., and J. T Carlton. 1998.1996. U.S. Geological Survey Open-File Accelerating invasion rate in a highlyReport 97-598. invaded estuary. Science (Washington,
Baylosis, J. I., B. E. Cole, and J. E. Cloern. D.C.) 279:555-558.1998. Studies of the San Francisco Bay, Conomos, T J. 1979. Properties and circula-California estuarine ecosystem: Regional tion of San Francisco Bay waters. Pagesmonitoring results, 1997. U.S. Geological 47-84 in San Francisco Bay: The urban-
. _. SUrVey Open--=-FileRep6rt-98-16S:-··· -izeo-esttraty. Amerit-afi1\ssoci:rtioicfonneBuchanan, P. A. 1999. Specific conductance, Advancement of Science, Pacific Division,
water temperature and water level data, San Francisco.San Francisco Bay, California, water year Conomos, T ]., R E. Smith, and J. W.1998. IEP (Interagency Ecol. Program) Gartner. 1985. Environmental setting ofNewsl. 14 (4): 46. San Francisco Bay. Hydrobiologia 129:1-
Caffrey, J. M., B. E. Cole, J. E. Cloern, J. R 12.Rudek, A. C. Tyler, and A. D. ]assby. Decho, A. W., and S. N. Luoma. 1991.1994. Studies of the plankton and its envi- Time-courses in the retention of food ma-

344 PACIFIC SCIENCE· July 2002
terial in the bivalves Potamocorbula amur- concentration and phytoplankton commu-ensis and Macoma balthica: Significance to nity composition with water-year type inthe absorption of carbon and chromium. the upper San Francisco Estuary. PagesMar. Ecol. Prog. Ser. 78:303-314. 351-374 in J. T Hollibaugh, ed. San
Duda, T F. 1992. Genetic population struc- Francisco Bay: The ecosystem. Ameri-ture of Potamocorbula amurensis in San can Association for the Advancement ofFrancisco Bay. M.S. thesis, San Francisco Science, Pacific Division, San Francisco.State University, San Francisco. Levine, J. M. 2000. Species diversity and bi-
Edmunds, J. L., B. E. Cole, J. E. Cloern, J. ological invasions: Relating local process toM. Caffrey, and A. D.Jassby. 1995. Studies community patterns. Science (Washing-of the San Francisco Bay, California, es- ton, D.C.) 288:852-854.tuarine ecosystem: Pilot regional monitor- Murrel, M. c., J. T Hollibaugh, M. W.ing program results, 1994. U.S. Geological Silver, and P. S. Wong. 1999. Bacterio-Survey Open-File Report 95-378. plankton dynamics in northern San Fran-
Edmunds, J. L., B. E. Cole, J. E. Cloern, and cisco Bay: Role of particle association andR. G. Dufford. 1997. Studies of the San seasonal freshwater flow. Limnol. Ocean-Francisco Bay, California, estuarine eco- ogr. 44:295-308.system: Pilot regional monitoring program Nichols, F. H. 1985. Increased benthic graz-results, 1995. U.S. Geological Survey ing: An alternative explanation for lowOpen-File Report 97-15. phytoplankton biomass in northern San
Giese, A. c., and J. S. Pearse. 1974. Repro- Francisco Bay during the 1976-1977duction of marine invertebrates. Vol. 1. drought. Estuarine Coastal Shelf Sci. 21:Introduction: General principles. Academic 379-388.Press, New York. Nichols, F. H., J. K. Thompson, and L. E.
---. 1979. Reproduction of marine in- Schemel. 1990. Remarkable invasion ofvertebrates. Vol. 5. Molluscs: Pelecypods San Francisco Bay (California, USA) byand lesser classes. Academic Press, New the Asian clam Potamocorbula amurensis. II.York. Displacement of a former community.
Hollibaugh, J. T, and P. S. Wong. 1996. Mar. Ecol. Prog. Ser. 66:95-101.Distribution and activity of bacteri- Nicolini, M. H., and D. L. Penry. 2000.oplankton in San Francisco Bay. Pages Spawning, fertilization, and larval devel-263-288 in J. T Hollibaugh, ed. San opment of Potamocorbula amurensis (Mol-Francisco Bay: The ecosystem. Ameri- lusca: Bivalvia) from San Francisco Bay,can Association for the Advancement of California. Pac. Sci. 54:377-388.Science, Pacific Division, San Francisco. Parchaso, F. 1995. Seasonal reproduction of
Jassby, A. D., andJ. E. Cloern. 2000. Organic Potamocorbula amurensis in San Franciscomatter sources and rehabilitation of the Bay, California. M.S. thesis, San FranciscoSacramento-San Joaquin Delta (Califor- State University, San Francisco.nia, USA). Aquat. Conserv. Mar. Fresh- Rosenblum, S., and T M. Niesen. 1985. Thewater Ecosyst. 10:323-352. spawning cycle of soft-shell clam Mya
Jassby, A. D.,J. E. Cloern, and T M. Powell. arenaria in San Francisco Bay. Fish. Bull.1993. Organic carbon sources and sinks in 83:403-412.
---San--Fram:isco-Bay:-Variabtlity" inducecloy-Ru:lli; -e:-A,-and 'O:-1l.--SnoelnanillieC1997~ -river flow. Mar. Ecol. Prog. Ser. 95:39- Time series of suspended-solids concen-54. tration in Honker Bay during water year
Kimmerer, W. J., E. Gartside, and J. J. Orsi. 1997. San Francisco Estuary Institute,1994. Predation by an introduced clam as 1997 Regional Monitoring Program An-the likely cause of substantial declines in nual Report.zooplankton in San Francisco Bay. Mar. Schemel, L. E., S. W. Hager, and D. Child-Ecol. Prog. Ser. 113 :81-93. ers. 1996. The supply of suspended sedi-
Lehman, P. 1996. Changes in chlorophyll a ment from the Sacramento River to San

Influence of Hydrologic Processes on Potamocorbula amurensis . Parchaso and Thompson 345
Francisco Bay. Pages 217-235 in J. T.Hollibaugh, ed. San Francisco Bay: Theecosystem. American Association for theAdvancement of Science, Pacific Division,San Francisco.
Thompson, J. K., L. E. Schemel, F. H.Nichols, and J. T. Carlton. 1988. The invasion of San Francisco Bay by the bivalvePotamocorbula. Am. Zoo1. 28:359.
Varon, S. C. 1978. The population distribution and reproductive cycle of Tapes japonica. M.S. thesis, San Francisco StateUniversity, San Francisco.
Walters, R. A., R. T. Cheng, and T. J. Conomos. 1985. Time scales and mixing processes of San Francisco Bay waters.Hydrobiologia 129:13-16.
Werner, I., andJ. T. Hollibaugh. 1993. Potamocorbula amurensis: Comparison of clearance rates and assimilation efficiencies forphytoplankton and bacterioplankton. Limno1. Oceanogr. 38:949-964.
Wienke, S. M., J. E. Cloern, and B. E. Cole.1990. Plankton studies in San FranciscoBay. XI. Chlorophyll distributions and hy-
drographic properties in San FranciscoBay, 1988-1989. U.S. Geological SurveyOpen-File Report 90-562.
Wienke, S. M., B. E. Cole, J. E. Cloern, andA. E. Alpine. 1991. Plankton studies in SanFrancisco Bay. XII. Chlorophyll distributions and hydrographic properties in SanFrancisco Bay, 1990. U.S. Geological Survey Open-File Report 91-476.
---. 1992. Plankton studies in San Francisco Bay. XIII. Chlorophyll distributionsand hydrographic properties in San Francisco Bay, 1991. U.S. Geological SurveyOpen-File Report 92-158.
---. 1993. Plankton studies in San Francisco Bay. XIV. Chlorophyll distributionsand hydrographic properties in San Francisco Bay, 1992. U.S. Geological SurveyOpen-File Report 93-423.
Wilson, B. R. 1969. Survival and reproduction of the mussel Xenostrobus securis (Lamarck) (Mollusca; Bivalvia; Mytilidae) in aWestern Australian estuary. Part II: Reproduction, growth and longevity. J. Nat.Rist. 3:93-120.