Influence of the LRFD Bridge Design Specifications on Seismic ...
Influence of the structural configuration on the seismic
response of steel frame structures
ABSTRACT This study investigates the influence of the in-plan structural layout on the seismic response of
symmetric and asymmetric steel frame structures. A five-storey steel frame building was used as
reference structure and two different structural systems were employed to represent torsional stiff and
torsional flexible structures. Accurate numerical models of the different structures were developed
and nonlinear static and dynamic analyses under bi-directional ground motion were carried out. The
influences of axial force-bending moment interaction in columns in the two main directions and
second order effects were taken into account in the numerical analyses. The results of the numerical
investigations on symmetric structures showed that the reduction of the number of moment resisting
connections may lead to an increase of the structural damage. Asymmetric variants of the investigated
structures were created by assuming different mass eccentricities in each of the two principal
directions and extensive parametric studies were performed. For the torsionally flexible building, the
influence of ground motion intensity was very strong. A transition from torsionally flexible to
torsionally stiff behaviour in the weaker direction of the initially torsionally flexible structure was
observed for high-intensity ground motion. A change of the stiffness of the structure in one direction
due to high levels of plastic deformations affected the structural response in the orthogonal direction.
Torsional effects decreased in case of severe seismic excitations and high levels of plastic
deformations. The reduction of torsional effects observed in the elastic range on the stiff side of
torsionally stiff buildings may disappear in the inelastic range.
Keywords: structural typology, steel structures, seismic response, asymmetry, damage.
1. Introduction
The aim of this study is to evaluate the influence of different structural configurations on the seismic
response of symmetric and asymmetric steel structures. A five-storey steel frame building was used as
reference structure and two different structural systems were employed. The main differences between
the investigated structural systems were in their torsional stiffness and in the number of dissipative
zones. Numerical models of the different structures were developed, and nonlinear static and dynamic
analyses were carried out. The combined effects of bending moment and axial force in columns in the
two main directions and second order theory were taken into account in the numerical analyses. The
results of the numerical investigations showed that the reduction of the number of moment resisting
connections may lead to an increase of the structural damage. An extensive parametric study was
performed in order to analyze the seismic response of plan-asymmetric structures with bi-axial
eccentricity. Asymmetry was created by assuming different mass eccentricities in each of the two
principal directions and nonlinear dynamic analyses of asymmetric building structures subjected to bi-
directional ground motion were performed. For the torsionally flexible building, the influence of
ground motion intensity was very strong. A transition from torsionally flexible to torsionally stiff
behaviour in the weak direction of the initially torsionally flexible structure was observed.
2. Structural configurations
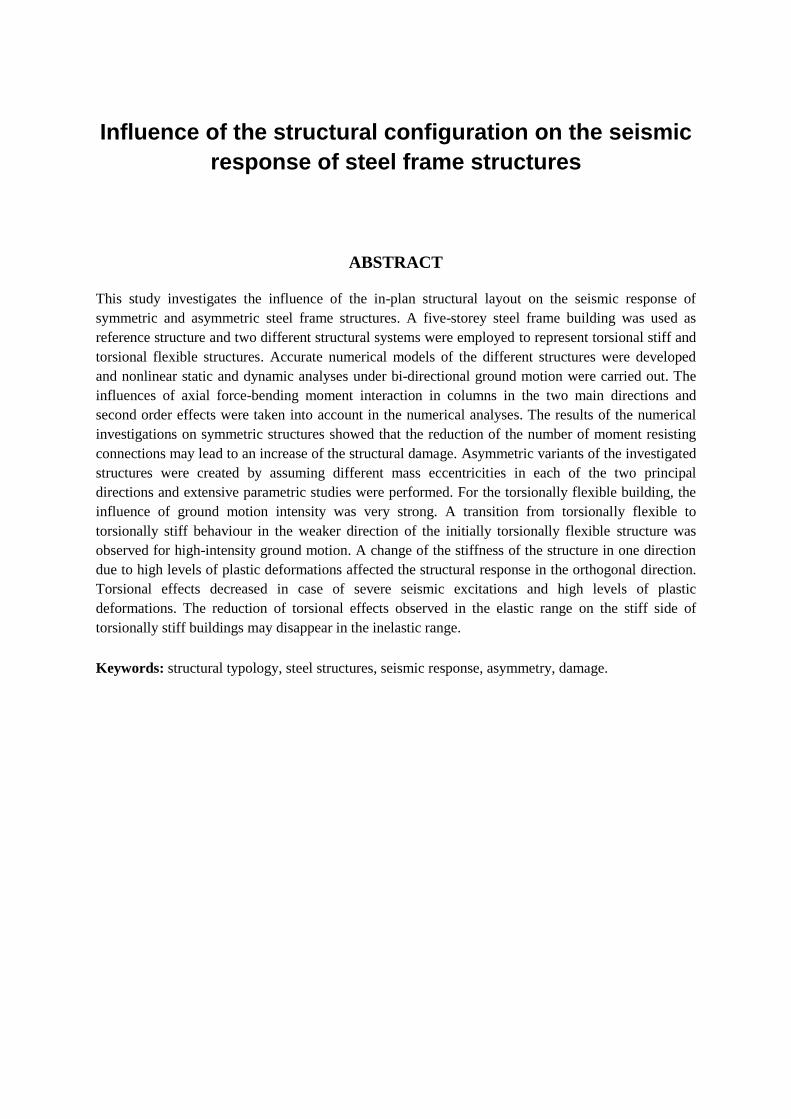
In order to investigate the influence of the in-plan structural layout on the seismic response of steel
framed buildings, a 3-bay x 3-bay 5-storey steel building was considered. Two different structural
systems were analyzed: the space moment resisting frame, denoted as S-MRF, and the few bays
moment resisting frame, denoted as FB-MRF, Figure 1. The structures were designed according to
pre-standards Eurocode 3 and Eurocode 8 by Mazzolani and Piluso (1997). The design spectrum for
stiff soil, normalised to a peak ground acceleration of 0.35g, was used. In the S-MRF structure, all the
beam-to-column connections are moment resistant. This solution provides a great number of
dissipative zones located at the beam ends. The S-MRF building is torsionally stiff (for both
directions, x and z). The first two modes are predominantly translational and the third mode is
predominantly torsional. In the FB-MRF building, moment-resisting frames are located in the interior
of the plan in order to create a torsionally flexible structure with a predominantly torsional first mode.
To obtain approximately equal lateral stiffness and strength as for S-MRF building, the cross-sections
of the columns of FB-MRF building were increased. All the column sections of the investigated
structures are composed by means of two hot-rolled double T profiles welded along the longitudinal
axis to form a X-shaped section.
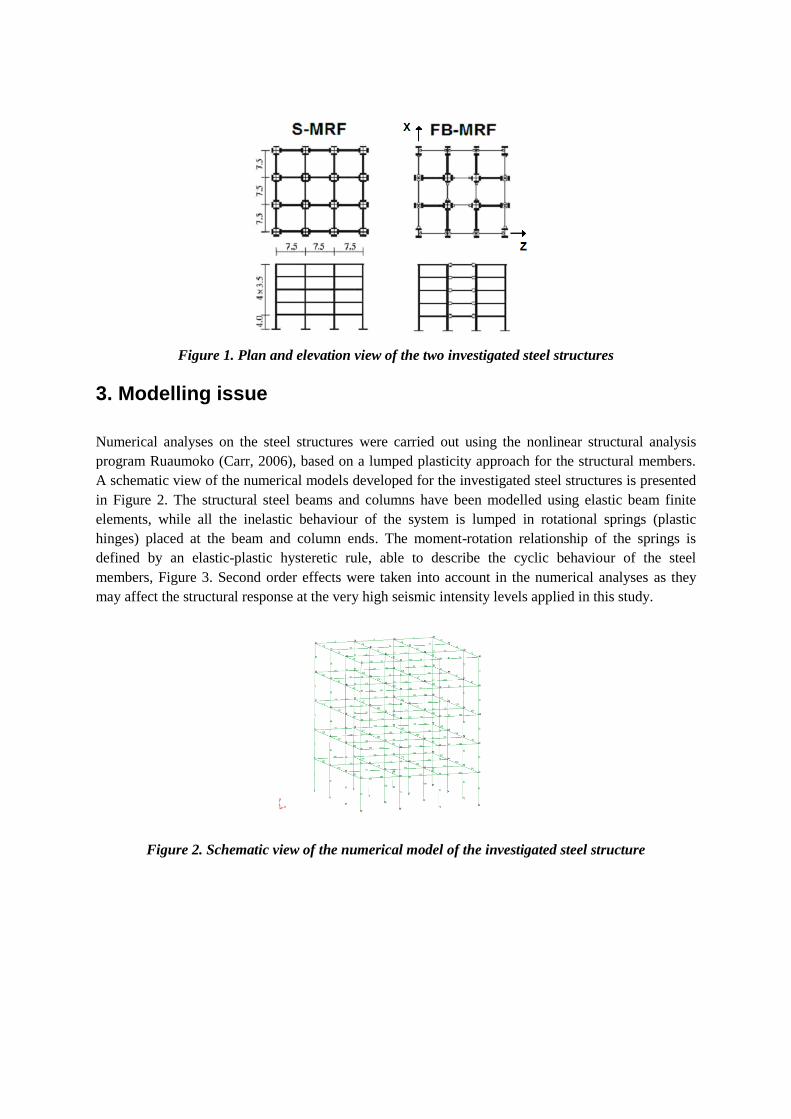
Figure 1. Plan and elevation view of the two investigated steel structures
3. Modelling issue
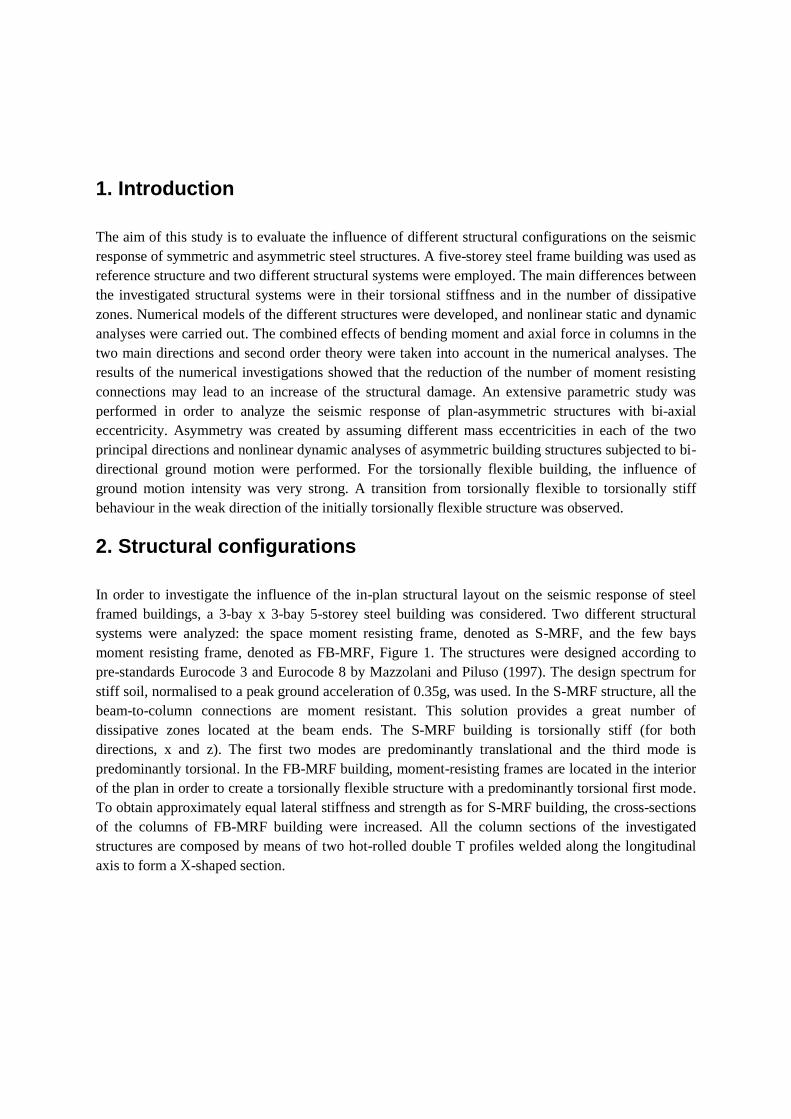
Numerical analyses on the steel structures were carried out using the nonlinear structural analysis
program Ruaumoko (Carr, 2006), based on a lumped plasticity approach for the structural members.
A schematic view of the numerical models developed for the investigated steel structures is presented
in Figure 2. The structural steel beams and columns have been modelled using elastic beam finite
elements, while all the inelastic behaviour of the system is lumped in rotational springs (plastic
hinges) placed at the beam and column ends. The moment-rotation relationship of the springs is
defined by an elastic-plastic hysteretic rule, able to describe the cyclic behaviour of the steel
members, Figure 3. Second order effects were taken into account in the numerical analyses as they
may affect the structural response at the very high seismic intensity levels applied in this study.
Figure 2. Schematic view of the numerical model of the investigated steel structure
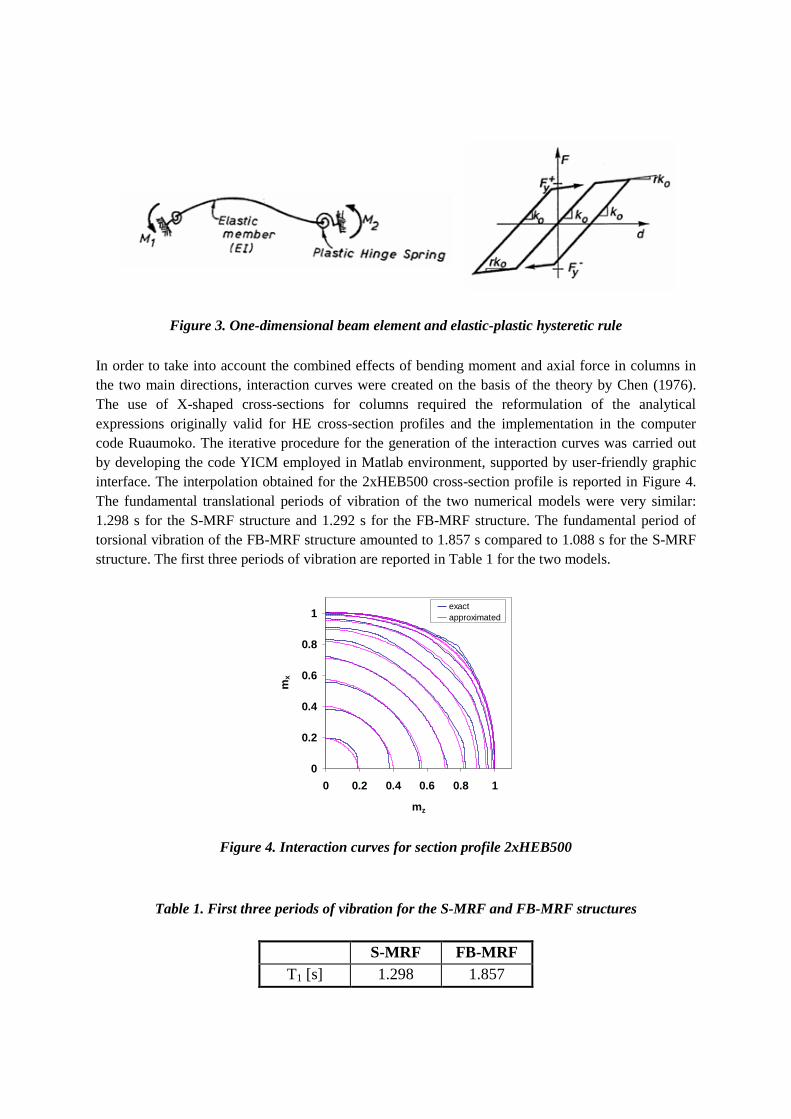
Figure 3. One-dimensional beam element and elastic-plastic hysteretic rule
In order to take into account the combined effects of bending moment and axial force in columns in
the two main directions, interaction curves were created on the basis of the theory by Chen (1976).
The use of X-shaped cross-sections for columns required the reformulation of the analytical
expressions originally valid for HE cross-section profiles and the implementation in the computer
code Ruaumoko. The iterative procedure for the generation of the interaction curves was carried out
by developing the code YICM employed in Matlab environment, supported by user-friendly graphic
interface. The interpolation obtained for the 2xHEB500 cross-section profile is reported in Figure 4.
The fundamental translational periods of vibration of the two numerical models were very similar:
1.298 s for the S-MRF structure and 1.292 s for the FB-MRF structure. The fundamental period of
torsional vibration of the FB-MRF structure amounted to 1.857 s compared to 1.088 s for the S-MRF
structure. The first three periods of vibration are reported in Table 1 for the two models.
0
0.2
0.4
0.6
0.8
1
0 0.2 0.4 0.6 0.8 1
mz
mx
exact
approximated
Figure 4. Interaction curves for section profile 2xHEB500
Table 1. First three periods of vibration for the S-MRF and FB-MRF structures
S-MRF FB-MRF
T1 [s] 1.298 1.857
T2 [s] 1.298 1.292
T3 [s] 1.088 1.194
4. Symmetric structures
A simplified assessment procedure was adopted for the seismic verification of the global structural
behaviour of the two steel structures. According to the requirements of Eurocode 8 Part 3, the level of
damage in the structure was evaluated with reference to three Limit States (LS): Damage Limitation
(LSDL), Significant Damage (LSSD) and Near Collapse (LSNC). In the structural model, each limit
state is achieved once a specific chord rotation is attained in one of the members of the structure. For
beams and columns, the inelastic deformation capacity is expressed in terms of the plastic rotation at
the end of the member, as a multiple of the chord rotation at yielding, θy. According to Eurocode 8,
the LSDL, the LSSD and the LSNC correspond to the first attainment of θy, 6θy and 8θy, respectively.
The expression of the chord rotation at yielding θy is reported by the Code. In this study the most
critical member was conservatively assumed to control the behaviour of the structures.
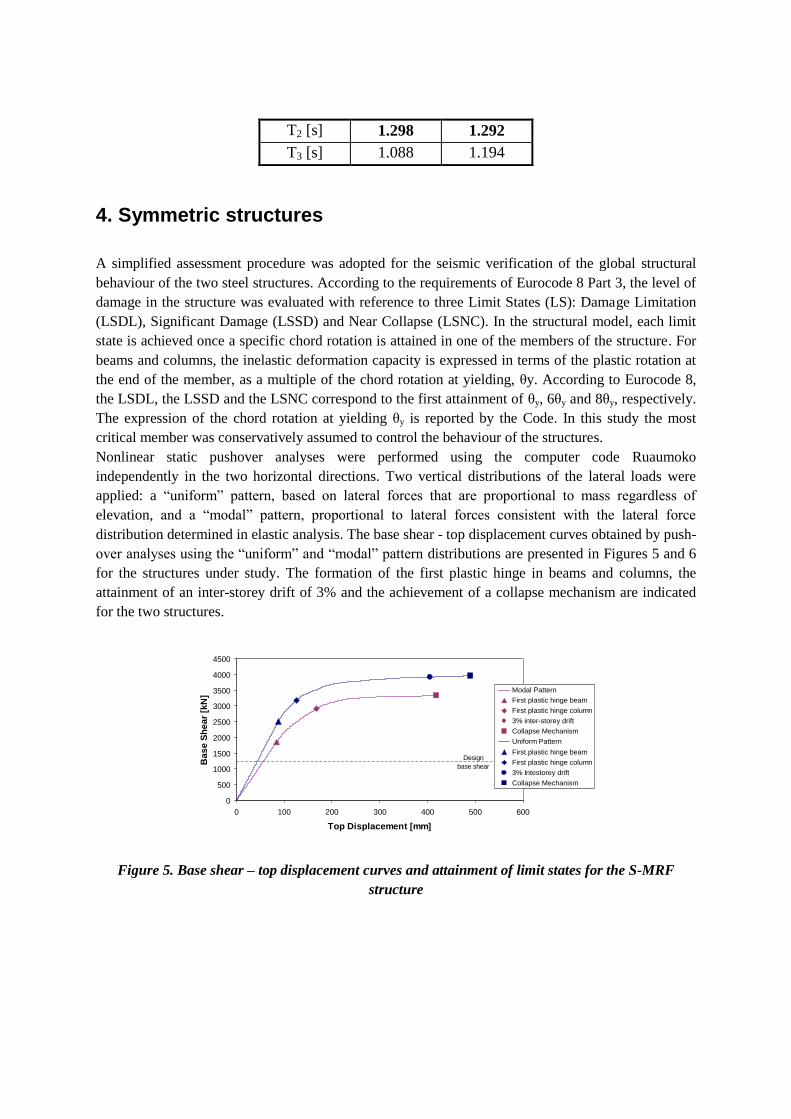
Nonlinear static pushover analyses were performed using the computer code Ruaumoko
independently in the two horizontal directions. Two vertical distributions of the lateral loads were
applied: a “uniform” pattern, based on lateral forces that are proportional to mass regardless of
elevation, and a “modal” pattern, proportional to lateral forces consistent with the lateral force
distribution determined in elastic analysis. The base shear - top displacement curves obtained by push-
over analyses using the “uniform” and “modal” pattern distributions are presented in Figures 5 and 6
for the structures under study. The formation of the first plastic hinge in beams and columns, the
attainment of an inter-storey drift of 3% and the achievement of a collapse mechanism are indicated
for the two structures.
Serie11Design
base shear
0
500
1000
1500
2000
2500
3000
3500
4000
4500
0 100 200 300 400 500 600
Top Displacement [mm]
Ba
se
Sh
ea
r [k
N]
Modal Pattern
First plastic hinge beam
First plastic hinge column
3% inter-storey drift
Collapse Mechanism
Uniform Pattern
First plastic hinge beam
First plastic hinge column
3% Intestorey drift
Collapse Mechanism
Figure 5. Base shear – top displacement curves and attainment of limit states for the S-MRF
structure
Serie11Design
base shear
0
500
1000
1500
2000
2500
3000
3500
4000
4500
0 100 200 300 400 500 600
Top Displacement [mm]
Ba
se
Sh
ea
r [k
N]
Modal Pattern
First plastic hinge beam
First plastic hinge column
3% Inter-storey drift
Collapse Mechanism
Uniform Pattern
First plastic hinge beam
First plastic hinge column
3% Inter-storey drift
Collapse Mechanism
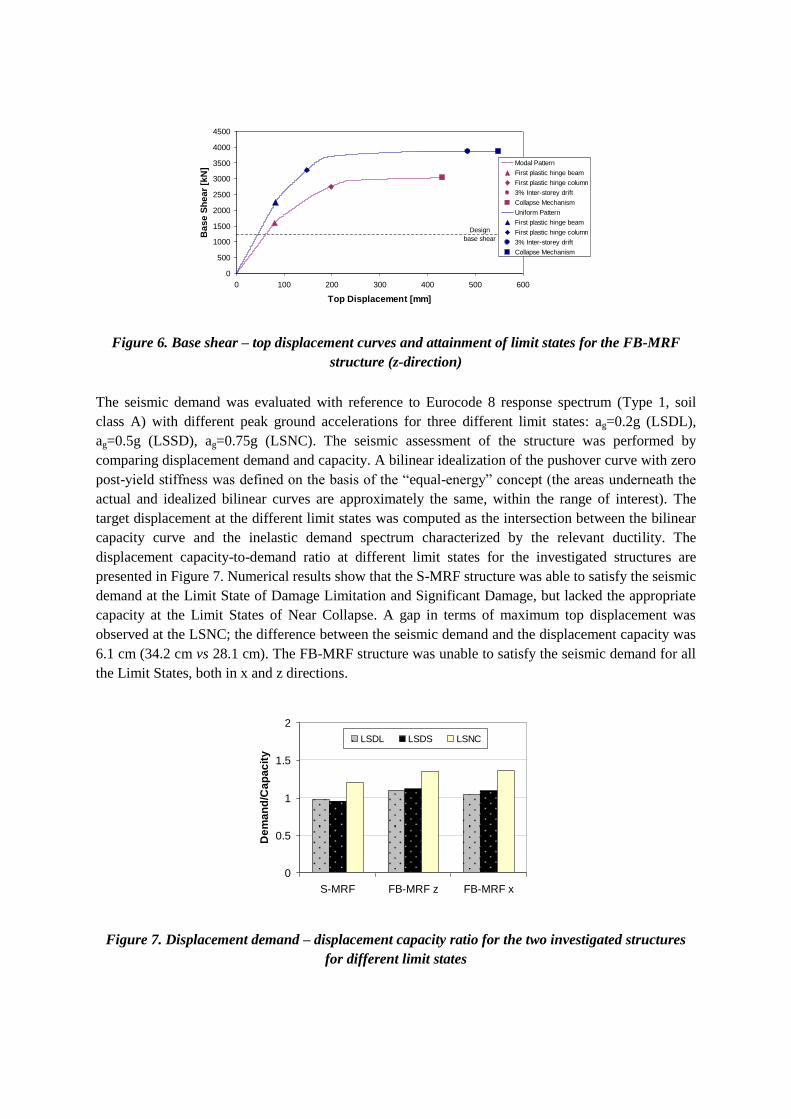
Figure 6. Base shear – top displacement curves and attainment of limit states for the FB-MRF
structure (z-direction)
The seismic demand was evaluated with reference to Eurocode 8 response spectrum (Type 1, soil
class A) with different peak ground accelerations for three different limit states: ag=0.2g (LSDL),
ag=0.5g (LSSD), ag=0.75g (LSNC). The seismic assessment of the structure was performed by
comparing displacement demand and capacity. A bilinear idealization of the pushover curve with zero
post-yield stiffness was defined on the basis of the “equal-energy” concept (the areas underneath the
actual and idealized bilinear curves are approximately the same, within the range of interest). The
target displacement at the different limit states was computed as the intersection between the bilinear
capacity curve and the inelastic demand spectrum characterized by the relevant ductility. The
displacement capacity-to-demand ratio at different limit states for the investigated structures are
presented in Figure 7. Numerical results show that the S-MRF structure was able to satisfy the seismic
demand at the Limit State of Damage Limitation and Significant Damage, but lacked the appropriate
capacity at the Limit States of Near Collapse. A gap in terms of maximum top displacement was
observed at the LSNC; the difference between the seismic demand and the displacement capacity was
6.1 cm (34.2 cm vs 28.1 cm). The FB-MRF structure was unable to satisfy the seismic demand for all
the Limit States, both in x and z directions.
0
0.5
1
1.5
2
S-MRF FB-MRF z FB-MRF x
De
ma
nd
/Ca
pa
cit
y
LSDL LSDS LSNC
Figure 7. Displacement demand – displacement capacity ratio for the two investigated structures
for different limit states
Nonlinear dynamic analyses were carried out by using a set of artificial accelerograms with different
intensity levels. The set was composed of seven artificial spectrum-compatible accelerograms with
duration of 20 s for each Limit State and meeting the requirements defined by Euorcode 8. The
damage distribution in the structures was analyzed using the Park & Ang damage index, which
combines maximum deformation and hysteretic energy dissipation. This index, widely used to
estimate damage in reinforced concrete ductile members, is a linear combination of the maximum
ductility and the hysteretic energy dissipation demand imposed by the earthquake on the structure and
is defined as, (Park, 1985):
m h
u y u
EDI
F
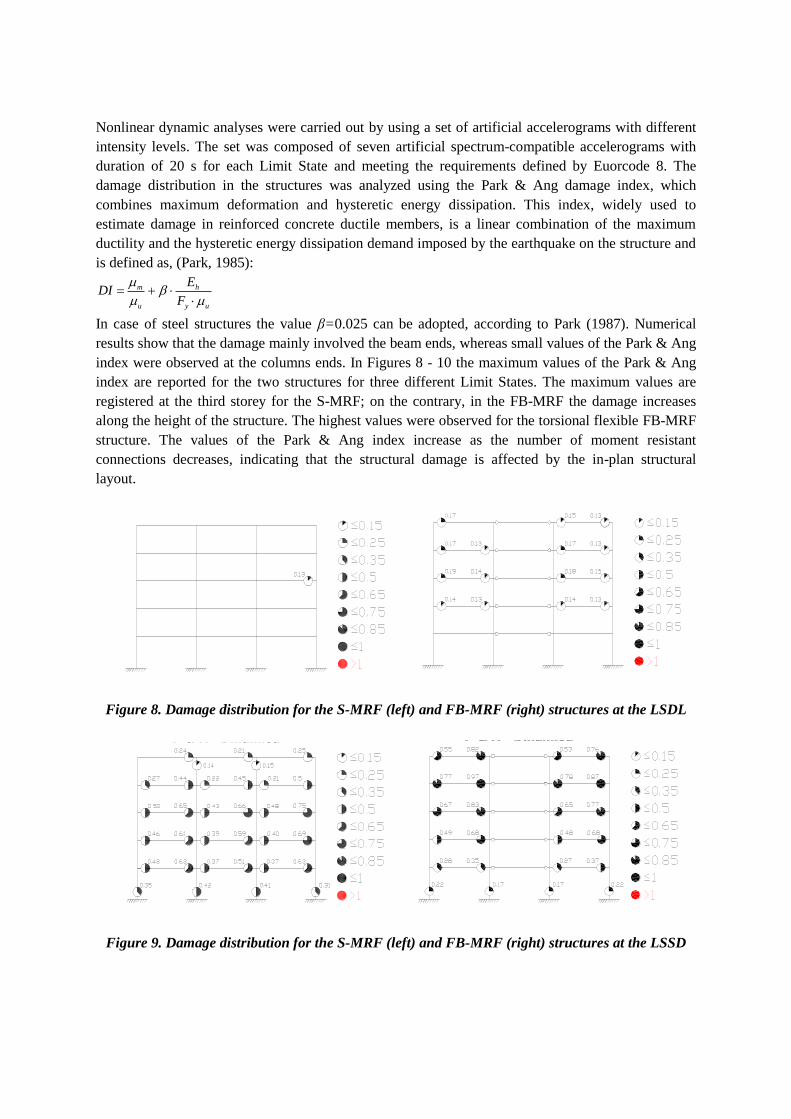
In case of steel structures the value β=0.025 can be adopted, according to Park (1987). Numerical
results show that the damage mainly involved the beam ends, whereas small values of the Park & Ang
index were observed at the columns ends. In Figures 8 - 10 the maximum values of the Park & Ang
index are reported for the two structures for three different Limit States. The maximum values are
registered at the third storey for the S-MRF; on the contrary, in the FB-MRF the damage increases
along the height of the structure. The highest values were observed for the torsional flexible FB-MRF
structure. The values of the Park & Ang index increase as the number of moment resistant
connections decreases, indicating that the structural damage is affected by the in-plan structural
layout.
D - Pushover D - Dinamica P & A - Dinamica
D - Pushover D - Dinamica P & A - Dinamica
Figure 8. Damage distribution for the S-MRF (left) and FB-MRF (right) structures at the LSDL
D - Pushover D - Dinamica P & A - Dinamica
D - Pushover D - Dinamica P & A - Dinamica
Figure 9. Damage distribution for the S-MRF (left) and FB-MRF (right) structures at the LSSD
D - Pushover D - Dinamica P & A - Dinamica
D - Pushover D - Dinamica P & A - Dinamica
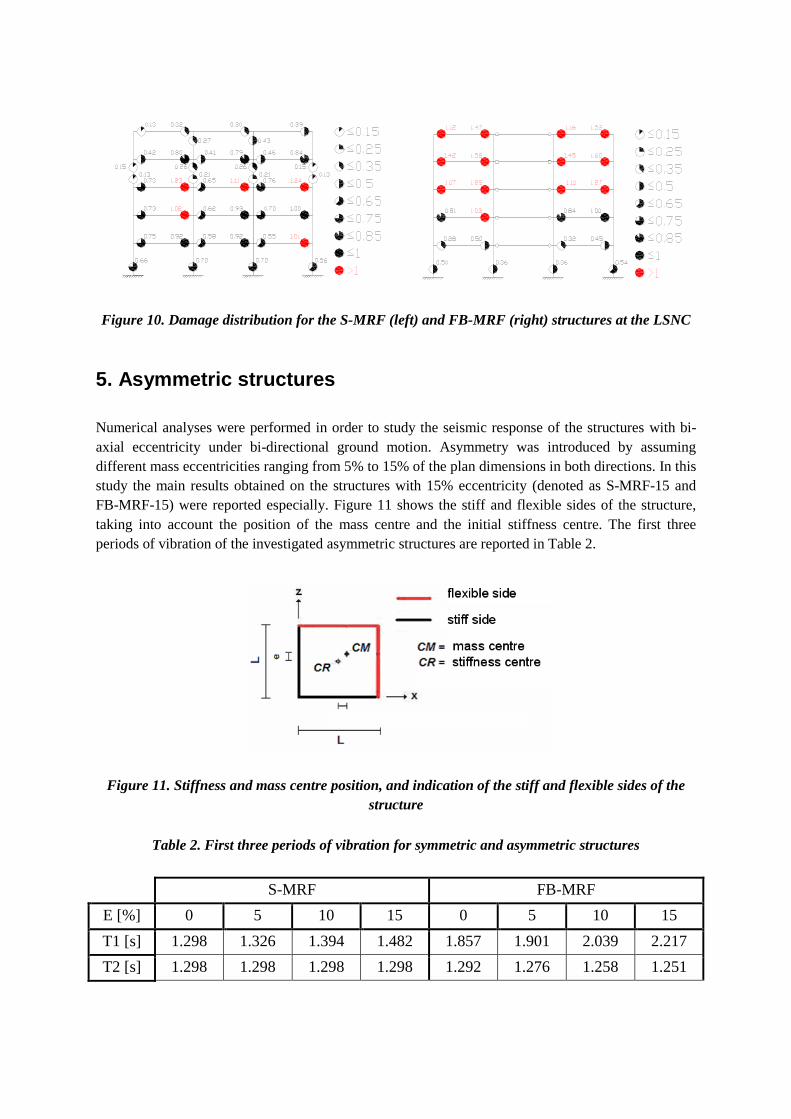
Figure 10. Damage distribution for the S-MRF (left) and FB-MRF (right) structures at the LSNC
5. Asymmetric structures
Numerical analyses were performed in order to study the seismic response of the structures with bi-
axial eccentricity under bi-directional ground motion. Asymmetry was introduced by assuming
different mass eccentricities ranging from 5% to 15% of the plan dimensions in both directions. In this
study the main results obtained on the structures with 15% eccentricity (denoted as S-MRF-15 and
FB-MRF-15) were reported especially. Figure 11 shows the stiff and flexible sides of the structure,
taking into account the position of the mass centre and the initial stiffness centre. The first three
periods of vibration of the investigated asymmetric structures are reported in Table 2.
Figure 11. Stiffness and mass centre position, and indication of the stiff and flexible sides of the
structure
Table 2. First three periods of vibration for symmetric and asymmetric structures
S-MRF FB-MRF
E [%] 0 5 10 15 0 5 10 15
T1 [s] 1.298 1.326 1.394 1.482 1.857 1.901 2.039 2.217
T2 [s] 1.298 1.298 1.298 1.298 1.292 1.276 1.258 1.251
T3 [s] 1.088 0.997 0.949 0.892 1.194 1.177 1.120 1.041
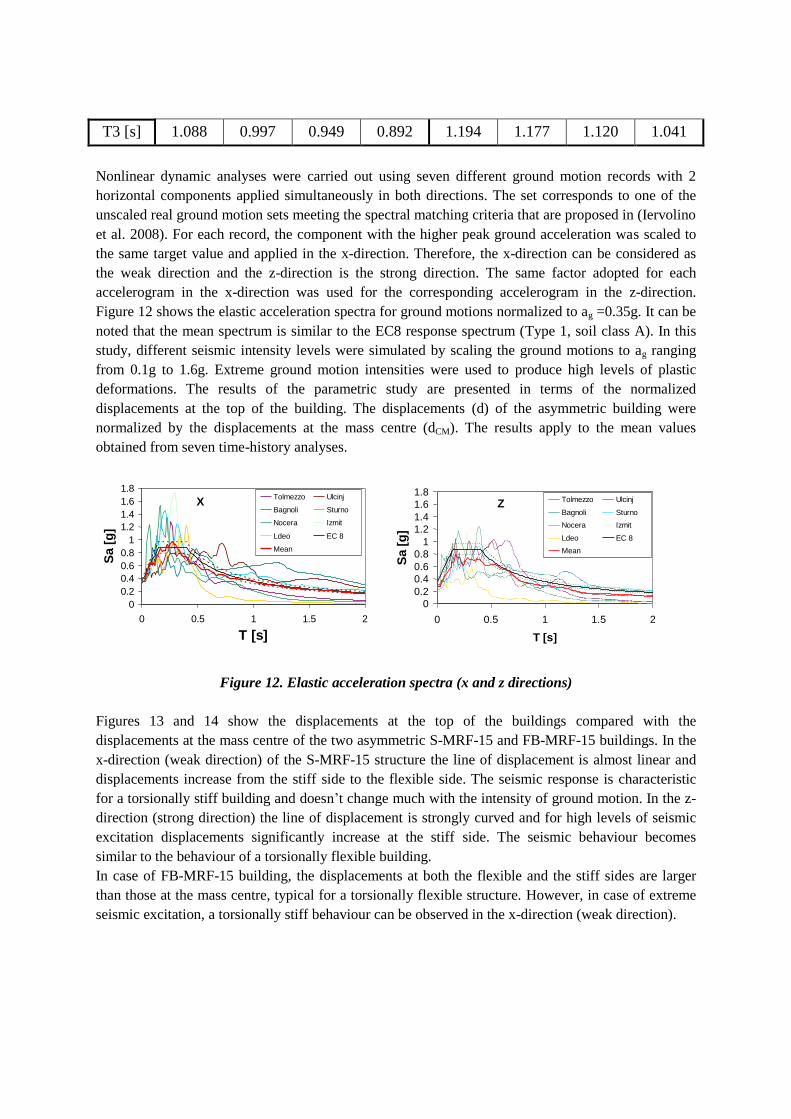
Nonlinear dynamic analyses were carried out using seven different ground motion records with 2
horizontal components applied simultaneously in both directions. The set corresponds to one of the
unscaled real ground motion sets meeting the spectral matching criteria that are proposed in (Iervolino
et al. 2008). For each record, the component with the higher peak ground acceleration was scaled to
the same target value and applied in the x-direction. Therefore, the x-direction can be considered as
the weak direction and the z-direction is the strong direction. The same factor adopted for each
accelerogram in the x-direction was used for the corresponding accelerogram in the z-direction.
Figure 12 shows the elastic acceleration spectra for ground motions normalized to ag =0.35g. It can be
noted that the mean spectrum is similar to the EC8 response spectrum (Type 1, soil class A). In this
study, different seismic intensity levels were simulated by scaling the ground motions to ag ranging
from 0.1g to 1.6g. Extreme ground motion intensities were used to produce high levels of plastic
deformations. The results of the parametric study are presented in terms of the normalized
displacements at the top of the building. The displacements (d) of the asymmetric building were
normalized by the displacements at the mass centre (dCM). The results apply to the mean values
obtained from seven time-history analyses.
X
0
0.2
0.4
0.6
0.8
1
1.2
1.4
1.6
1.8
0 0.5 1 1.5 2
T [s]
Sa [
g]
Tolmezzo Ulcinj
Bagnoli Sturno
Nocera Izmit
Ldeo EC 8
Mean
Z
0
0.2
0.4
0.6
0.8
1
1.2
1.4
1.6
1.8
0 0.5 1 1.5 2
T [s]
Sa [
g]
Tolmezzo Ulcinj
Bagnoli Sturno
Nocera Izmit
Ldeo EC 8
Mean
Figure 12. Elastic acceleration spectra (x and z directions)
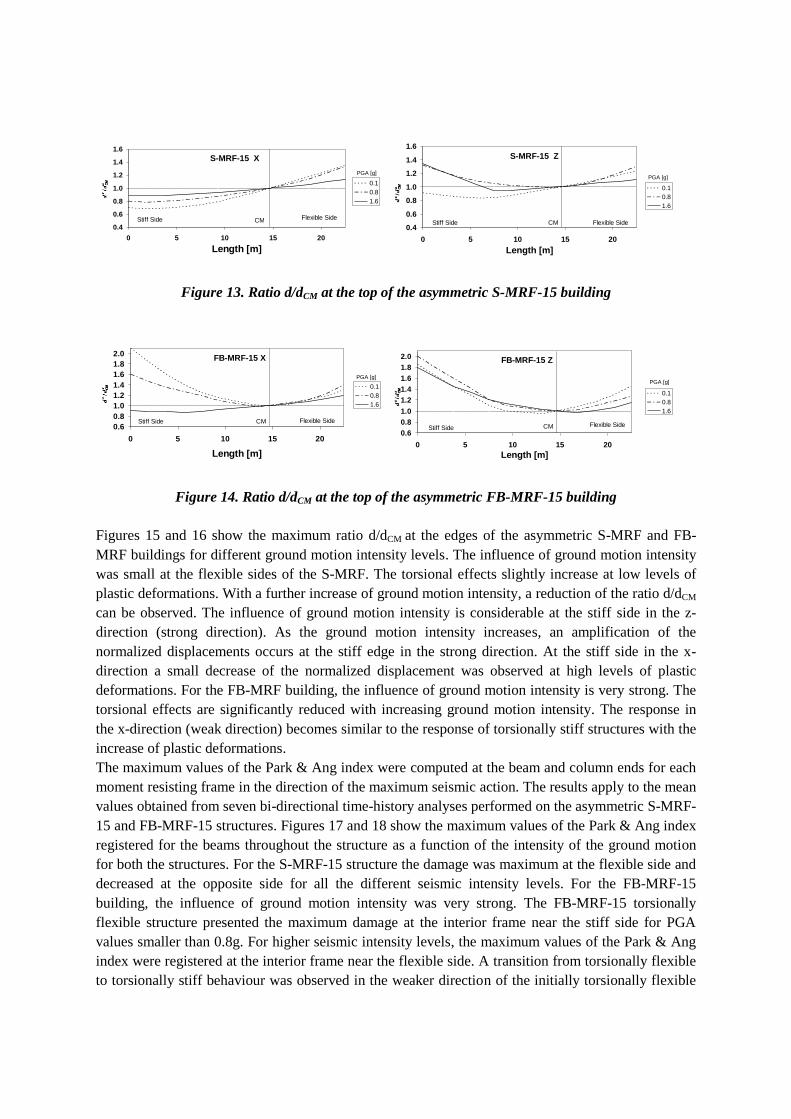
Figures 13 and 14 show the displacements at the top of the buildings compared with the
displacements at the mass centre of the two asymmetric S-MRF-15 and FB-MRF-15 buildings. In the
x-direction (weak direction) of the S-MRF-15 structure the line of displacement is almost linear and
displacements increase from the stiff side to the flexible side. The seismic response is characteristic
for a torsionally stiff building and doesn’t change much with the intensity of ground motion. In the z-
direction (strong direction) the line of displacement is strongly curved and for high levels of seismic
excitation displacements significantly increase at the stiff side. The seismic behaviour becomes
similar to the behaviour of a torsionally flexible building.
In case of FB-MRF-15 building, the displacements at both the flexible and the stiff sides are larger
than those at the mass centre, typical for a torsionally flexible structure. However, in case of extreme
seismic excitation, a torsionally stiff behaviour can be observed in the x-direction (weak direction).
S-MRF-15 X
0.4
0.6
0.8
1.0
1.2
1.4
1.6
0 5 10 15 20
Length [m]
0.1
0.8
1.6
PGA [g]
CM Flexible Side Stiff Side
rigido
S-MRF-15 Z
0.4
0.6
0.8
1.0
1.2
1.4
1.6
0 5 10 15 20
Length [m]
0.1
0.8
1.6
CM Stiff Side Flexible Side
PGA [g]
Figure 13. Ratio d/dCM at the top of the asymmetric S-MRF-15 building
FB-MRF-15 X
0.6
0.8
1.0
1.2
1.4
1.6
1.8
2.0
0 5 10 15 20
Length [m]
0.1
0.8
1.6
PGA [g]
CM Flexible Side Stiff Side
FB-MRF-15 Z
0.6
0.8
1.0
1.2
1.4
1.6
1.8
2.0
0 5 10 15 20
Length [m]
0.1
0.8
1.6
CM Flexible Side
PGA [g]
Stiff Side
Figure 14. Ratio d/dCM at the top of the asymmetric FB-MRF-15 building
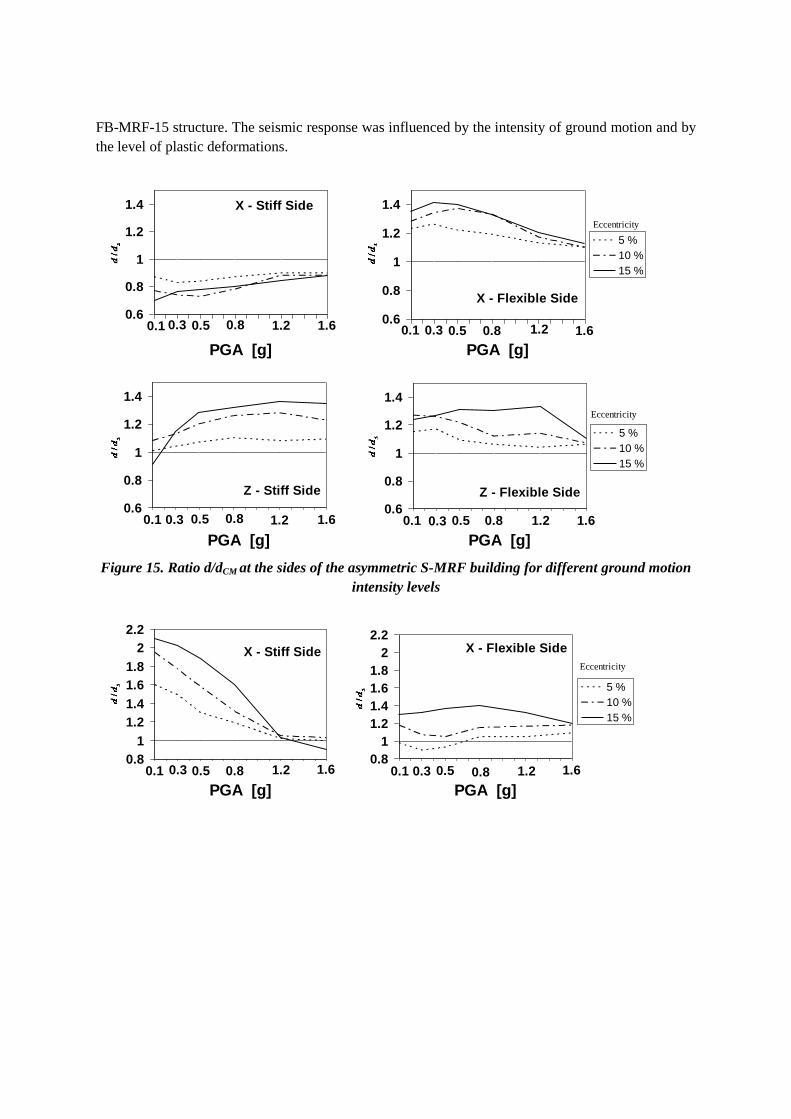
Figures 15 and 16 show the maximum ratio d/dCM at the edges of the asymmetric S-MRF and FB-
MRF buildings for different ground motion intensity levels. The influence of ground motion intensity
was small at the flexible sides of the S-MRF. The torsional effects slightly increase at low levels of
plastic deformations. With a further increase of ground motion intensity, a reduction of the ratio d/dCM
can be observed. The influence of ground motion intensity is considerable at the stiff side in the z-
direction (strong direction). As the ground motion intensity increases, an amplification of the
normalized displacements occurs at the stiff edge in the strong direction. At the stiff side in the x-
direction a small decrease of the normalized displacement was observed at high levels of plastic
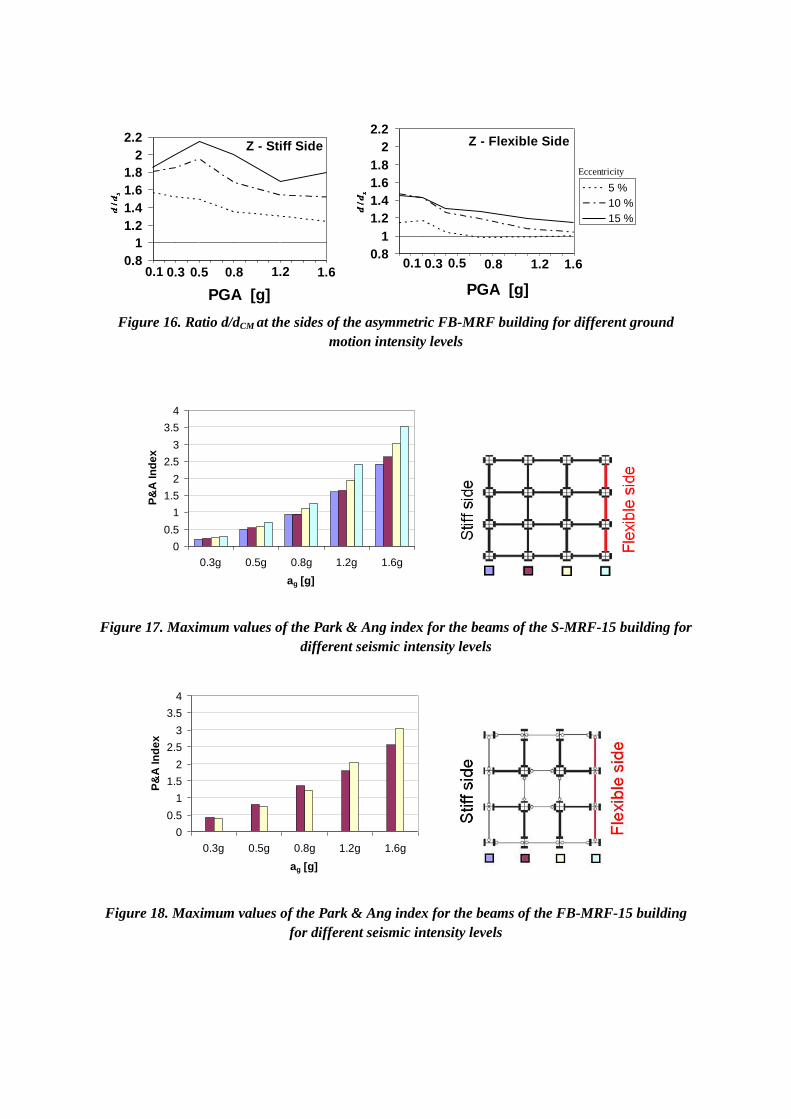
deformations. For the FB-MRF building, the influence of ground motion intensity is very strong. The
torsional effects are significantly reduced with increasing ground motion intensity. The response in
the x-direction (weak direction) becomes similar to the response of torsionally stiff structures with the
increase of plastic deformations.
The maximum values of the Park & Ang index were computed at the beam and column ends for each
moment resisting frame in the direction of the maximum seismic action. The results apply to the mean
values obtained from seven bi-directional time-history analyses performed on the asymmetric S-MRF-
15 and FB-MRF-15 structures. Figures 17 and 18 show the maximum values of the Park & Ang index
registered for the beams throughout the structure as a function of the intensity of the ground motion
for both the structures. For the S-MRF-15 structure the damage was maximum at the flexible side and
decreased at the opposite side for all the different seismic intensity levels. For the FB-MRF-15
building, the influence of ground motion intensity was very strong. The FB-MRF-15 torsionally
flexible structure presented the maximum damage at the interior frame near the stiff side for PGA
values smaller than 0.8g. For higher seismic intensity levels, the maximum values of the Park & Ang
index were registered at the interior frame near the flexible side. A transition from torsionally flexible
to torsionally stiff behaviour was observed in the weaker direction of the initially torsionally flexible
FB-MRF-15 structure. The seismic response was influenced by the intensity of ground motion and by
the level of plastic deformations.
X - Stiff Side
1.61.20.80.50.30.10.6
0.8
1
1.2
1.4
PGA [g]
X - Flexible Side
0.1 0.3 0.5 0.8 1.2 1.60.6
0.8
1
1.2
1.4
PGA [g]
5 %
10 %
15 %
Eccentricity
Z - Stiff Side
1.61.20.80.50.30.10.6
0.8
1
1.2
1.4
PGA [g]
Z - Flexible Side
0.1 0.3 0.5 0.8 1.2 1.60.6
0.8
1
1.2
1.4
PGA [g]
5 %
10 %
15 %
Eccentricity
Figure 15. Ratio d/dCM at the sides of the asymmetric S-MRF building for different ground motion
intensity levels
X - Stiff Side
0.1 0.3 0.5 0.8 1.2 1.60.8
1
1.2
1.4
1.6
1.8
2
2.2
PGA [g]
X - Flexible Side
1.61.20.80.50.30.10.8
1
1.2
1.4
1.6
1.8
2
2.2
PGA [g]
5 %
10 %
15 %
Eccentricity
Z - Stiff Side
0.1 0.3 0.5 0.8 1.2 1.60.8
1
1.2
1.4
1.6
1.8
2
2.2
PGA [g]
Z - Flexible Side
0.1 0.3 0.5 0.8 1.2 1.60.8
1
1.2
1.4
1.6
1.8
2
2.2
PGA [g]
5 %
10 %
15 %
Eccentricity
Figure 16. Ratio d/dCM at the sides of the asymmetric FB-MRF building for different ground
motion intensity levels
0
0.5
1
1.5
2
2.5
3
3.5
4
0.3g 0.5g 0.8g 1.2g 1.6g
ag [g]
P&
A In
de
x
Figure 17. Maximum values of the Park & Ang index for the beams of the S-MRF-15 building for
different seismic intensity levels
0
0.5
1
1.5
2
2.5
3
3.5
4
0.3g 0.5g 0.8g 1.2g 1.6g
ag [g]
P&
A In
de
x
Figure 18. Maximum values of the Park & Ang index for the beams of the FB-MRF-15 building
for different seismic intensity levels
6. Conclusions
The influence of the structural typology and the effects of bi-axial mass-eccentricity on the seismic
response of a steel frame structure were investigated through nonlinear static and dynamic analyses.
The results of the numerical investigations on symmetric steel structures showed that the reduction of
the number of moment resisting connections may lead to an increase of the structural damage. High
values of damage were computed for the torsionally flexible structure with moment resisting frames
located mainly in the interior of the plan. Asymmetric variants of the structures were created by
introducing different values of mass eccentricity in each of the two principal directions and an
extensive parametric study was carried out performing nonlinear dynamic analyses under bi-
directional ground motion. For the torsionally flexible building, the influence of ground motion
intensity was very strong. A transition from torsionally flexible to torsionally stiff behaviour in the
weaker direction of the initially torsionally flexible structure was observed for high levels of ground
motion intensity. The change of the stiffness of the structure in one direction due to high levels of
plastic deformations affected the structural response in the orthogonal direction. Torsional effects may
decrease in case of severe seismic excitations and high levels of plastic deformations. The reduction
of torsional effects observed in the elastic range on the stiff side of torsionally stiff buildings may
disappear in the inelastic range.
References
Carr A.J., (2006). Ruaumoko Program for Inelastic Dynamic Analysis. Department of Civil
Engineering, University of Canterbury, Christchurch, New Zealand.
CEN (2004) European Standard EN 1993-1. Eurocode 3: Design of steel structures. European
Committee for Standardization, Brussels.
CEN (2004) European Standard EN 1998-1. Eurocode 8: Design of structures for earthquake
resistance. Part 1: General rules, seismic action and rules for buildings. European Committee for
Standardization, Brussels.
CEN (2005) European Standard EN 1998-3. Eurocode 8: Design of structures for earthquake
resistance. Part 3: Assessment and retrofitting of buildings. European Committee for
Standardization, Brussels.
Chen W.-F., Atsuta T., (1976). Theory of beam-columns. Volume 2: Space behavior and design. J.
Ross Publishing.
De La Llera J.C., Chopra A.K., (1996). Inelastic behaviour of asymmetric multistory buildings,
Journal of Structural Engineering, ASCE, 122: 597– 606.
Fajfar P., Gaspersic P., (1996), The N2 method for the seismic damage analysis of RC buildings,
Earthquake Engineering and Structural Dynamics, vol. 25: 23-67.
Gasparini D.A., Vanmarcke E.H., (1976). Simulated earthquake motions compatible with prescribed
response spectra. Massachussets Institute of Technology, Cambridge, Massachussets.
Iervolino I., Maddaloni G., Cosenza E., (2008). Eurocode 8 compliant real record sets for seismic
analysis of structures. Journal of Earthquake Engineering, 12(1): 54-90.
Matlab: Release 7.0, The MathWorks Inc., 2007.
Marusic D., Fajfar P., (2005). On the inelastic seismic response of asymmetric buildings under bi-
axial excitation. Earthquake Engineering and Structural Dynamics, 34: 943-963.

Mazzolani F.M., Piluso V., (1997). The influence of the design configuration on the seismic response
of moment-resisting frames. Behaviour of Steel Structures in Seismic Areas: STESSA 1997,
Kyoto.
Park Y.J., Ang A.H.S., (1985). Mechanistic seismic damage model for reinforced concrete. Journal of
Structural Engineering, ASCE, 111: 722–739.
Park Y.J., Ang A.H.S., Wen Y.K., (1987). Damage-limiting aseismic design of buildings. Earthquake
Spectra, 3(1): 1-26.