Influence of the degree of polymerisation and of the ...macromolchem.com/papers/Paper57.pdf · the...
13
Influence of the degree of polymerisation and of the architecture on the elastic properties of new polyurea elastomers† Antoni S ´ anchez-Ferrer,‡ * a Daniel Rogez b and Philippe Martinoty * b The elastic properties of new polyurea elastomers have been studied by varying the segmental molecular weight and the chemical nature of the polymer end groups. Three different types of elastomers were synthesized leading to three different types of response. The elastomers with a high degree of polymerisation and primary amines as terminal groups show two plateaus: at high temperature, the common permanent plateau related to the rubber behaviour of elastomeric systems and, at low temperature, a transient plateau associated with the hydrogen bonding of the urea motives occurring in the interfacial zone between the soft polyetheramine and the hard crosslinker domains. The elastomers with a low degree of polymerization and primary amines as terminal groups show that the transient plateau is masked by the glassy plateau because the hydrogen bonds occur in the same temperature range as the glass transition effects, except for very slow heating rates for which the transient network can be resolved. Lastly, the elastomers with no hydrogen bonding just show the common step in the elastic behaviour from the rubbery to the glassy state. Introduction Polyurethane, polyurethane/polyurea, and polyurea materials can be found in several day-to-day applications in the medical eld, 1–4 i.e., cardiovascular applications, reconstructive surgery, gynaecology and obstetrics, organ regeneration in tissue engi- neering, and medical supplies, which can be formed by machine moulding, liquid moulding and bre spinning for tubing, coatings, foams, bres, sheets and lm production. 5 Polyurea chemistry is based on a chemical reaction between the electrophilic isocyanate group and the nucleophilic amine group to form urea motives which establish hydrogen bonds. Polyurea elastomers are very attractive materials due to their enhanced mechanical properties and their chemical resistance when compared to polyurethanes. Unlike the latter, the fast reaction between isocyanates and amines does not require a catalyst. 6,7 Moreover, the chemical structure and molecular weight of both the phase-separated so (amino compound) and hard (isocyanate compound) domains, as well as the stoichio- metric ratio, control the nal mechanical and chemical prop- erties of the engineered polyurea material. When chemically crosslinked, polyurea elastomers combine the mechanical properties of chemical (covalent bonds) and physical (hydrogen bonds) networks in one single material. 8–11 The reaction between a diamino- or triamino-terminated polymer melt and a polyisocyanate leads to polyurea elasto- mers characterized by both so domains coming from the low glass transition temperature segment of the amino- functionalised polymer, and hard domains from the poly- isocyanate core and urea motives appearing during the reac- tion. 12 These urea groups have the ability of establishing hydrogen bonds in a mono- or bidentated fashion 13,14 which act both as llers and physical crosslinking sites. The correspond- ing reinforcement of the polymer network due to these hydrogen bonds grants polyurea systems the ability to act as high performance polymers with better mechanical and chem- ical resistance, exibility, toughness, excellent electrical insulating, and good adhesion properties than standard polyurethanes. 15–21 Numerous experiments were performed to study the behav- iour of the complex shear modulus at different temperatures and frequencies. For example, dynamic mechanical analysis (DMA) experiments were carried out on a huge variety of poly- urethane 22–25 and polyurea 26–32 elastomers, which are charac- terized by a glassy plateau stemming from the so domains followed, when the temperature is increased, by a short rubbery a Institute of Supramolecular Science and Engineering, University Louis Pasteur, 8 all´ ee Gaspard Monge, Strasbourg, F-67083, France. E-mail: a.sanchez-ferrer@ isis.u-strasbg.fr b Institute Charles Sadron, UPR 22 CNRS, 23 rue du Loess, Strasbourg Cedex, F-67034, France. E-mail: [email protected] † Electronic supplementary information (ESI) available: Chemical structures of the polymer backbones and the corresponding segmental molecular weight, temperature dependent FTIR experiments, DSC thermograms, stress–strain measurements. See DOI: 10.1039/c4ra09879j ‡ Present address: Department of Health Sciences and Technology, ETH Zurich, Schmelzbergstrasse 9, CH-8092, Zurich, Switzerland. E-mail: antoni.sanchez@ hest.ethz.ch. Cite this: RSC Adv. , 2015, 5, 6758 Received 5th September 2014 Accepted 17th December 2014 DOI: 10.1039/c4ra09879j www.rsc.org/advances 6758 | RSC Adv. , 2015, 5, 6758–6770 This journal is © The Royal Society of Chemistry 2015 RSC Advances PAPER
Transcript of Influence of the degree of polymerisation and of the ...macromolchem.com/papers/Paper57.pdf · the...

RSC Advances
PAPER
Influence of the
aInstitute of Supramolecular Science and E
allee Gaspard Monge, Strasbourg, F-670
isis.u-strasbg.frbInstitute Charles Sadron, UPR 22 CNRS, 23
France. E-mail: philippe.martinoty@ics-cnrs
† Electronic supplementary informationthe polymer backbones and the corresptemperature dependent FTIR experimemeasurements. See DOI: 10.1039/c4ra098
‡ Present address: Department of HealthSchmelzbergstrasse 9, CH-8092, Zurich,hest.ethz.ch.
Cite this: RSC Adv., 2015, 5, 6758
Received 5th September 2014Accepted 17th December 2014
DOI: 10.1039/c4ra09879j
www.rsc.org/advances
6758 | RSC Adv., 2015, 5, 6758–6770
degree of polymerisation and ofthe architecture on the elastic properties of newpolyurea elastomers†
Antoni Sanchez-Ferrer,‡*a Daniel Rogezb and Philippe Martinoty*b
The elastic properties of new polyurea elastomers have been studied by varying the segmental molecular
weight and the chemical nature of the polymer end groups. Three different types of elastomers were
synthesized leading to three different types of response. The elastomers with a high degree of
polymerisation and primary amines as terminal groups show two plateaus: at high temperature, the
common permanent plateau related to the rubber behaviour of elastomeric systems and, at low
temperature, a transient plateau associated with the hydrogen bonding of the urea motives occurring in
the interfacial zone between the soft polyetheramine and the hard crosslinker domains. The elastomers
with a low degree of polymerization and primary amines as terminal groups show that the transient
plateau is masked by the glassy plateau because the hydrogen bonds occur in the same temperature
range as the glass transition effects, except for very slow heating rates for which the transient network
can be resolved. Lastly, the elastomers with no hydrogen bonding just show the common step in the
elastic behaviour from the rubbery to the glassy state.
Introduction
Polyurethane, polyurethane/polyurea, and polyurea materialscan be found in several day-to-day applications in the medicaleld,1–4 i.e., cardiovascular applications, reconstructive surgery,gynaecology and obstetrics, organ regeneration in tissue engi-neering, and medical supplies, which can be formed bymachine moulding, liquid moulding and bre spinning fortubing, coatings, foams, bres, sheets and lm production.5
Polyurea chemistry is based on a chemical reaction betweenthe electrophilic isocyanate group and the nucleophilic aminegroup to form urea motives which establish hydrogen bonds.Polyurea elastomers are very attractive materials due to theirenhanced mechanical properties and their chemical resistancewhen compared to polyurethanes. Unlike the latter, the fastreaction between isocyanates and amines does not require acatalyst.6,7 Moreover, the chemical structure and molecular
ngineering, University Louis Pasteur, 8
83, France. E-mail: a.sanchez-ferrer@
rue du Loess, Strasbourg Cedex, F-67034,
.unistra.fr
(ESI) available: Chemical structures ofonding segmental molecular weight,nts, DSC thermograms, stress–strain79j
Sciences and Technology, ETH Zurich,Switzerland. E-mail: antoni.sanchez@
weight of both the phase-separated so (amino compound) andhard (isocyanate compound) domains, as well as the stoichio-metric ratio, control the nal mechanical and chemical prop-erties of the engineered polyurea material. When chemicallycrosslinked, polyurea elastomers combine the mechanicalproperties of chemical (covalent bonds) and physical (hydrogenbonds) networks in one single material.8–11
The reaction between a diamino- or triamino-terminatedpolymer melt and a polyisocyanate leads to polyurea elasto-mers characterized by both so domains coming from the lowglass transition temperature segment of the amino-functionalised polymer, and hard domains from the poly-isocyanate core and urea motives appearing during the reac-tion.12 These urea groups have the ability of establishinghydrogen bonds in a mono- or bidentated fashion13,14 which actboth as llers and physical crosslinking sites. The correspond-ing reinforcement of the polymer network due to thesehydrogen bonds grants polyurea systems the ability to act ashigh performance polymers with better mechanical and chem-ical resistance, exibility, toughness, excellent electricalinsulating, and good adhesion properties than standardpolyurethanes.15–21
Numerous experiments were performed to study the behav-iour of the complex shear modulus at different temperaturesand frequencies. For example, dynamic mechanical analysis(DMA) experiments were carried out on a huge variety of poly-urethane22–25 and polyurea26–32 elastomers, which are charac-terized by a glassy plateau stemming from the so domainsfollowed, when the temperature is increased, by a short rubbery
This journal is © The Royal Society of Chemistry 2015
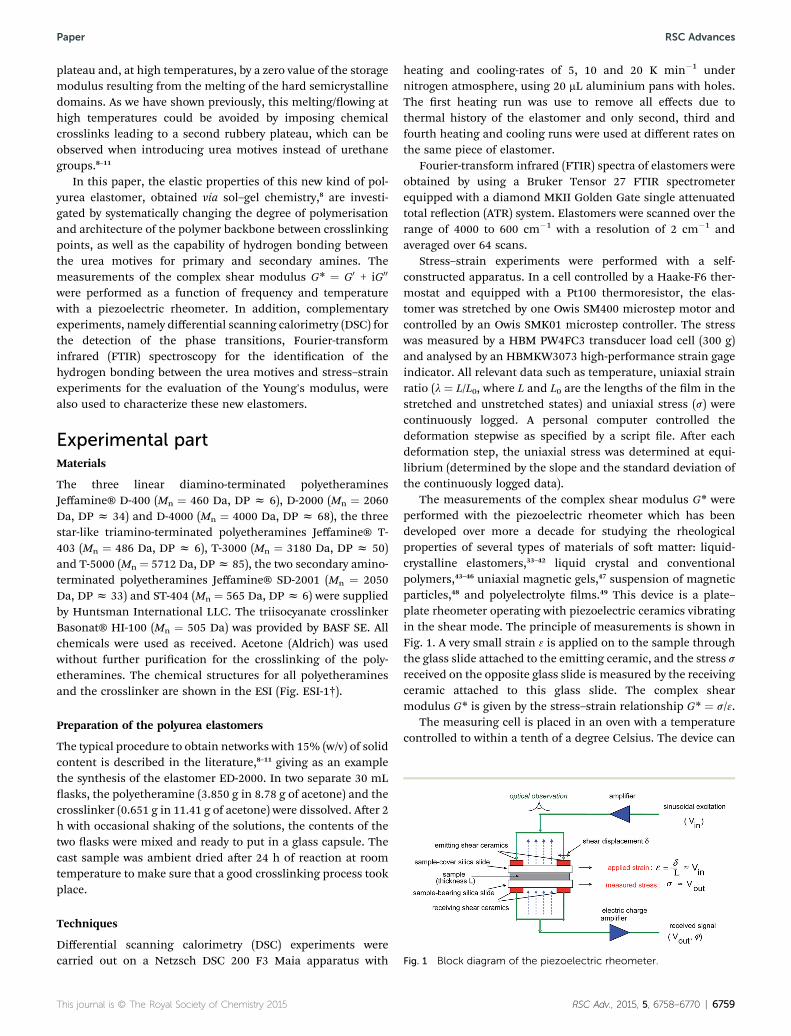
Fig. 1 Block diagram of the piezoelectric rheometer.
Paper RSC Advances
plateau and, at high temperatures, by a zero value of the storagemodulus resulting from the melting of the hard semicrystallinedomains. As we have shown previously, this melting/owing athigh temperatures could be avoided by imposing chemicalcrosslinks leading to a second rubbery plateau, which can beobserved when introducing urea motives instead of urethanegroups.8–11
In this paper, the elastic properties of this new kind of pol-yurea elastomer, obtained via sol–gel chemistry,8 are investi-gated by systematically changing the degree of polymerisationand architecture of the polymer backbone between crosslinkingpoints, as well as the capability of hydrogen bonding betweenthe urea motives for primary and secondary amines. Themeasurements of the complex shear modulus G* ¼ G0 + iG00
were performed as a function of frequency and temperaturewith a piezoelectric rheometer. In addition, complementaryexperiments, namely differential scanning calorimetry (DSC) forthe detection of the phase transitions, Fourier-transforminfrared (FTIR) spectroscopy for the identication of thehydrogen bonding between the urea motives and stress–strainexperiments for the evaluation of the Young's modulus, werealso used to characterize these new elastomers.
Experimental partMaterials
The three linear diamino-terminated polyetheraminesJeffamine® D-400 (Mn ¼ 460 Da, DP z 6), D-2000 (Mn ¼ 2060Da, DP z 34) and D-4000 (Mn ¼ 4000 Da, DP z 68), the threestar-like triamino-terminated polyetheramines Jeffamine® T-403 (Mn ¼ 486 Da, DP z 6), T-3000 (Mn ¼ 3180 Da, DP z 50)and T-5000 (Mn ¼ 5712 Da, DPz 85), the two secondary amino-terminated polyetheramines Jeffamine® SD-2001 (Mn ¼ 2050Da, DP z 33) and ST-404 (Mn ¼ 565 Da, DP z 6) were suppliedby Huntsman International LLC. The triisocyanate crosslinkerBasonat® HI-100 (Mn ¼ 505 Da) was provided by BASF SE. Allchemicals were used as received. Acetone (Aldrich) was usedwithout further purication for the crosslinking of the poly-etheramines. The chemical structures for all polyetheraminesand the crosslinker are shown in the ESI (Fig. ESI-1†).
Preparation of the polyurea elastomers
The typical procedure to obtain networks with 15% (w/v) of solidcontent is described in the literature,8–11 giving as an examplethe synthesis of the elastomer ED-2000. In two separate 30 mLasks, the polyetheramine (3.850 g in 8.78 g of acetone) and thecrosslinker (0.651 g in 11.41 g of acetone) were dissolved. Aer 2h with occasional shaking of the solutions, the contents of thetwo asks were mixed and ready to put in a glass capsule. Thecast sample was ambient dried aer 24 h of reaction at roomtemperature to make sure that a good crosslinking process tookplace.
Techniques
Differential scanning calorimetry (DSC) experiments werecarried out on a Netzsch DSC 200 F3 Maia apparatus with
This journal is © The Royal Society of Chemistry 2015
heating and cooling-rates of 5, 10 and 20 K min�1 undernitrogen atmosphere, using 20 mL aluminium pans with holes.The rst heating run was use to remove all effects due tothermal history of the elastomer and only second, third andfourth heating and cooling runs were used at different rates onthe same piece of elastomer.
Fourier-transform infrared (FTIR) spectra of elastomers wereobtained by using a Bruker Tensor 27 FTIR spectrometerequipped with a diamond MKII Golden Gate single attenuatedtotal reection (ATR) system. Elastomers were scanned over therange of 4000 to 600 cm�1 with a resolution of 2 cm�1 andaveraged over 64 scans.
Stress–strain experiments were performed with a self-constructed apparatus. In a cell controlled by a Haake-F6 ther-mostat and equipped with a Pt100 thermoresistor, the elas-tomer was stretched by one Owis SM400 microstep motor andcontrolled by an Owis SMK01 microstep controller. The stresswas measured by a HBM PW4FC3 transducer load cell (300 g)and analysed by an HBMKW3073 high-performance strain gageindicator. All relevant data such as temperature, uniaxial strainratio (l ¼ L/L0, where L and L0 are the lengths of the lm in thestretched and unstretched states) and uniaxial stress (s) werecontinuously logged. A personal computer controlled thedeformation stepwise as specied by a script le. Aer eachdeformation step, the uniaxial stress was determined at equi-librium (determined by the slope and the standard deviation ofthe continuously logged data).
The measurements of the complex shear modulus G* wereperformed with the piezoelectric rheometer which has beendeveloped over more a decade for studying the rheologicalproperties of several types of materials of so matter: liquid-crystalline elastomers,33–42 liquid crystal and conventionalpolymers,43–46 uniaxial magnetic gels,47 suspension of magneticparticles,48 and polyelectrolyte lms.49 This device is a plate–plate rheometer operating with piezoelectric ceramics vibratingin the shear mode. The principle of measurements is shown inFig. 1. A very small strain 3 is applied on to the sample throughthe glass slide attached to the emitting ceramic, and the stress sreceived on the opposite glass slide is measured by the receivingceramic attached to this glass slide. The complex shearmodulus G* is given by the stress–strain relationship G* ¼ s/3.
The measuring cell is placed in an oven with a temperaturecontrolled to within a tenth of a degree Celsius. The device can
RSC Adv., 2015, 5, 6758–6770 | 6759

Fig. 2 Comparison between the temperature dependence at f ¼ 1 Hzof G0 for the elastomer ED-2000 (primary amino-terminated poly-etheramine which reacts forming disubstituted urea groups withbidentated hydrogen bonds) and the elastomer ESD-2001 (secondaryamino-terminated polyetheramine which reacts forming trisubstitutedurea groups without bidentated hydrogen bonds) both at dT/dt ¼ 3 Kh�1. The data for the elastomer ED-2000 show the presence of atransient network associated with the formation and breaking ofhydrogen bonds. The solid lines represent the classical kBT behaviour.
RSC Advances Paper
acquire data in a very wide frequency range from f¼ 2� 10�2 to104 Hz, by imposing very low strains, from 3 ¼ 10�6 to 10�2, tosamples whose thickness, L, can vary from about ten microm-eters (liquid) to a few centimetres (so solid). The amount ofsample required to perform measurements is very small andconstitutes another advantage of this device. The temperaturerange studied can vary from T ¼ �60 to +150 �C.
In the present study, the various samples were rst heated upto 100 �C outside the piezoelectric rheometer cell, and thenplaced in the piezoelectric rheometer cell at room temperature.The cell was heated to high temperature (�+100 �C), and themeasurements were taken in a wide temperature range, rst bydecreasing the temperature down to a low temperature (��50�C), and then by increasing the temperature up to the initialtemperature. The cooling and heating rates between twotemperatures where the data were taken were 1 h (3 K h�1), andthe time required for taking a frequency spectrum at eachtemperature of measurement was 1 h. Slower (dT/dt¼ 1.5 K h�1)and faster (dT/dt ¼ 18 K h�1) cooling/heating rates were alsoused for one elastomer (ED-400). G* was determined forfrequencies ranging from f ¼ 0.2 up to 104 Hz. The appliedstrain was very small 3 � 10�4, and the validity of the linearresponse checked experimentally. A PC monitoring themeasuring system allowed the measurements to be carried outautomatically. The samples were lms with thickness around300 mmand a surface area A around 1 cm2. To be certain that themechanical response was not affected by the thickness of thelm, samples with higher thickness (750 mm for EST-404 and1000 mm for ED-400) were also studied.
Results and discussionMechanical and thermodynamic behaviour of the elastomerscontaining diamino-terminated polyetheramines as afunction of temperature
A series of four polyurea elastomers containing diamino-terminated polyetheramine (linear polymer) was synthesizedby varying the molecular weight of the polymers belonging tothe so domain and the degree of substitution of the aminegroup. This series includes three samples with primary aminogroups ED-400, ED-2000 and ED-4000, which lead to disubsti-tuted urea motives, and one sample with secondary aminogroups ESD-2001, which led to trisubstituted urea motives. Thischoice was done in order to monitor the effect induced by thedegree of polymerisation of the polyetheramine as well as theability to form hydrogen bonds as function of the degree ofsubstitution in the urea motive.
Fig. 2 shows the temperature dependence of G0, at thefrequency of 1 Hz, for the elastomer ED-2000. At high temper-atures, the behaviour of G0 is that of a conventional elastomer(G0 � kBT, where kB is the Boltzmann constant). As we will seelater in the section dealing with the behaviour of the elastomersas a function of frequency, G0 is frequency independent andG00 f f; for the frequencies below �300 Hz. This frequencybehavior is the one expected for the mechanical response of anelastomer in the hydrodynamic regime. The material is there-fore chemically crosslinked at high temperature, which
6760 | RSC Adv., 2015, 5, 6758–6770
supports our previous statement indicating that the tempera-ture dependence of G0 in the high temperature range is that of aconventional elastomer. By decreasing the temperature, astrong increase in G0 of about two orders of magnitude isobserved between T � +45 and 0 �C. Given that the FTIRmeasurements have revealed the presence of hydrogen bonds inthis temperature range,8 and no sign of crystallinity wasobserved from X-ray experiments in the wide-angle regionproving the amorphous nature of the samples,8 the mechanicalreinforcement of the elastomer can be attributed to a transientnetwork formed by these hydrogen bonds. By increasing thetemperature, the data of Fig. 2 show that the mechanical rein-forcement disappears at T � +70 �C. This temperature cantherefore be considered as the melting temperature of thetransient network formed by the hydrogen bonds. This meltingtemperature is clearly much higher than the temperature offormation. The large difference between the two temperaturescomes from the fact that the hydrogen bonds formation is moredifficult to achieve than their breaking. Indeed, upon cooling,the molecules must nd each other in order to form the clustersthat are at the origin of the network. This effect does not exist inthe heating process, leading thus to the large hysteresisobserved between the heating and cooling processes.
In order to denitely ascertain that the transient network iscaused by the presence of hydrogen bonds, the elastomer ESD-2001, which exhibits no hydrogen bonds, was studied. Thetemperature dependence of G0 is also plotted in Fig. 2 to allowfor a direct comparison with the behaviour observed for theelastomer ED-2000. The results show that the strong increase inG0 observed by cooling the temperature between T � +45 and0 �C has disappeared and is replaced by the classical kBTbehaviour. This result conrms that the transient network of
This journal is © The Royal Society of Chemistry 2015

Paper RSC Advances
the elastomer ED-2000 comes from the formation of hydrogenbonds. The data also show that the value associated with the kBTcontribution is higher than that of the elastomer ED-2000,which could be due to the difference in the architecture or inthe crosslinking density during sample preparation between thetwo elastomers. Finally, the strong increase in G0 that occursbelow T � �20 �C reects the inuence of the glass transitionthat is located around Tg � �65 �C. This inuence of the glasstransition could also be observed on the G0 behaviour of theelastomer ED-2000.50–52
Furthermore, elastomers containing both a lower (ED-400)and a higher (ED-4000) molecular weight diamino-terminatedpolyetheramine polymer (as compared to ED-2000) were alsostudied. Fig. 3a shows that the behaviour observed for theelastomer ED-4000 is similar to that for the elastomer ED-2000,demonstrating that the response of the elastomer results fromthe contribution of two components: the classical one (chem-ical) occurring at high temperature, and a transient one (phys-ical) associated with the formation and the breaking ofhydrogen bonds occurring at low temperature. The resultsobtained for the elastomer ED-400 are shown on Fig. 3b at slow
Fig. 3 Temperature dependence at f ¼ 1 Hz of G0 for (a) the elastomerED-4000 (long primary amino-terminated polyetheramine) at dT/dt ¼3 K h�1, and for (b) the elastomer ED-400 (short primary amino-terminated polyetheramine) at dT/dt ¼ 1.5 and 18 K h�1. The solid linesrepresent the classical kBT behaviour.
This journal is © The Royal Society of Chemistry 2015
(dT/dt ¼ 1.5 K h�1) and fast (dT/dt ¼ 18 K h�1) cooling/heatingrates. It can be seen that the cooling curve is independent of thesmall or high value of the cooling rate and does not reveal thepresence of the transient network. In contrast, the heatingcurves depend on the heating rate, and the plateau associatedwith the transient network is revealed only by the slow heatingrate. These observations indicate that short polymers havereduced mobility when crosslinked, which rstly increases theTg value, and secondly reduces the time for the reformation ofany interaction between the urea motives.
The same conclusion is supported by the stress–strainexperiments performed at 25 �C on the pristine elastomer andaer annealing the sample at 100 �C (Fig. 4). It can be seen thatthe Young modulus of the elastomer ED-400 aer annealing(E100/25 ¼ 3.58 � 106 Pa) is smaller than that of the pristineelastomer (E25 ¼ 2.55 � 107 Pa). This difference in the thermalhistory of the sample shows that the annealed elastomerbecomes soer due to the removal of the hydrogen bonds whichcannot be reformed during the time scale of the experiment(i.e., the time for annealing and for heating and decreasing thetemperature, which is typically less than 1 h). This is consistentwith the G0 values obtained at low cooling rate (G0 � 106 Pa) andat low heating rate (G0 � 107 Pa). DSC experiments at dT/dt ¼ 10K min�1 also showed the removal of the hydrogen bonds uponheating the elastomer ED-400, which only reappeared aerleaving the elastomer for long time at room temperature. Fig. 5shows that the rst scan on the elastomer ED-400 reveals thepresence of hydrogen bonds by the two peaks at THB� 64 and 81�C (DHHB � 5.2 J g�1), but aer cooling down the sample, thesecond and posterior heating curves do not show any signal ofhydrogen bonds indicating that at this time scale the ureamotives could not nd each other. Aer one day at 25 �C, therst heating scan shows one peak at THB � 68 �C with 25% ofthe initial enthalpy (DHHB � 1.3 J g�1), and only aer threeweeks the two peaks emerge again at THB � 68 and 76 �Crecovering 60% of the initial energy (DHHB � 3.2 J g�1). In
Fig. 4 Stress–strain curves for the elastomers ED-400 at T ¼ 25 �Cafter annealing the sample at 100 �C ( ) and directly measured fromthe synthesis ( ). The solid straight lines are the fits of the databelonging to the purely elastic region.
RSC Adv., 2015, 5, 6758–6770 | 6761

Fig. 5 (a) Different heating and cooling DSC thermographs for theelastomers ED-400 at 20 K min�1 showing the presence of enthalpicpeaks. (b) Zoom in on the heating thermographs on the same elas-tomer ED-400 sample directly after the synthesis (THB � 64 and 81 �C,DHHB � 5.2 J g�1), after 1 day (THB �68 �C, DHHB �1.3 J g�1) and 3weeks later (THB � 68 and 76 �C, DHHB � 3.2 J g�1). Note: the secondheating curves do not show any enthalpic peak, indicating that thehydrogen bonds have not enough time to reform during the experi-mental time scale.
RSC Advances Paper
conclusion, this short segmental molecular weight polymer (DP¼ 6) needs very slow temperature variation in order to makevisible the reversible removal of hydrogen bonds. The presenceof the two DSC peaks observed when the time is enough forforming the H-bonds suggested that the formation of H-bondsis sensitive to the environment.
The presence of the transient networks can also beconrmed by FTIR experiments performed on the four elasto-mers at different temperatures ranging from 25 to 150 �C. Theevolution of four absorption peaks was monitored from 1400 to1800 cm�1: (i) the isocyanurate peak (NCO)3 from the cross-linker at nNCO ¼ 1690 cm�1; (ii) the amide I peak correspondingto the C]O stretching of the urea motives from 1630 to 1660cm�1; (iii) the amide II peak corresponding mainly to the N–Hbending of the urea motives from 1505 to 1570 cm�1; and (iv)the CH2 bending at nCH2
¼ 1460 cm�1 (Fig. ESI-2†).53 It should benoted the reversible character of the samples aer heating at150 �C and cooling back to 25 �C, which demonstrates the
6762 | RSC Adv., 2015, 5, 6758–6770
stability of both the isocyanurate and urea functional groupswith no dissociation or further reactions. The results show thatboth non-urea-related peaks have small shis upon heating: theisocyanurate peak has an upshi of DnNCO ¼ +3 cm�1, and themethylene peak has a downshi of DnCH2
¼�3 cm�1, though wecan consider them as constant peaks. The amide I peak showsan upshi and the amide II peak a downshi upon heating ofthe sample. Both peaks strongly depend on the chemicalstructure of the so polymer backbone. The network containingthe low molecular weight polymer (ED-400) or the network withnon-hydrogen bonding (ESD-2001) show shis of around Dn ¼�15 cm�1, while the networks containing hydrogen bondedhigh molecular weight polymer (ED-2000 and ED-4000) showbroader shis of around Dn ¼ �25 cm�1.54 The most relevantdifference comes when comparing the peak positioning of bothamide I and II at room temperature. Elastomers with a transientnetwork (ED-400, ED-2000 and ED-4000) have the amide I peakaround naI ¼ 1630 cm�1 and the amide II peak at naII ¼ 1566cm�1, whereas the sample with no transient network (ESD-2001) have the peaks at naI ¼ 1640 cm�1 and naII ¼ 1521cm�1, respectively, which conrms the presence of orderedhydrogen bonds for the disubstituted urea motives and disor-dered hydrogen bonds for the trisubstituted urea motives. Allpeaks at 25 �C together with the corresponding shis uponheating the samples at 150 �C are collected in Table 1.
The presence or absence of the urea motives can be deducedfrom the analysis of the DSC curves of Fig. ESI-3† obtained onthe four elastomers. The curves corresponding to the elasto-mers ED-2000 and ED-4000 (i.e., the elastomers with disubsti-tuted urea motives and long segmental molecular weight of thepolymer) show a low glass transition temperature, Tg � �65 �Cand �71 �C, respectively, and an endothermic peak related tothe hydrogen bonding of the urea groups around THB � 40 and60 �C, which might be associated to different nature – biden-tated or monodentated – of the hydrogen bond between theurea groups. The observation of an endothermic peak for theelastomers ED-2000 and ED-4000 is consistent with the jumpsobserved in G0.
In contrast, the DSC curves (second and posterior heatingcurves) of the elastomer ED-400 (i.e., the elastomer withdisubstituted urea motives and short segmental molecularweight of the polymer) only show a change in the slope of thecurves revealing the presence of a glass transition with a glasstransition temperature Tg ��24 �C due to the reduced mobilityof the short polymer leading to a greater difficulty for the ureamotives to interact as explained before. Finally, the DSC curvesof the elastomer ESD-2001 (i.e., the elastomer with trisubsti-tuted urea motives and long segmental molecular weight of thepolymer) show a glass transition temperature at Tg��74 �C butno endothermic peak. This is consistent with the absence of theincrease observed in G0 that indicates that trisubstituted ureamotives cannot form hydrogen bonds. To close this section itshould be noted that the DSC curves obtained by cooling do notreveal the presence of the hydrogen bonds, in contrast to theshear measurements which shows a huge increase in the G0
behaviour.
This journal is © The Royal Society of Chemistry 2015
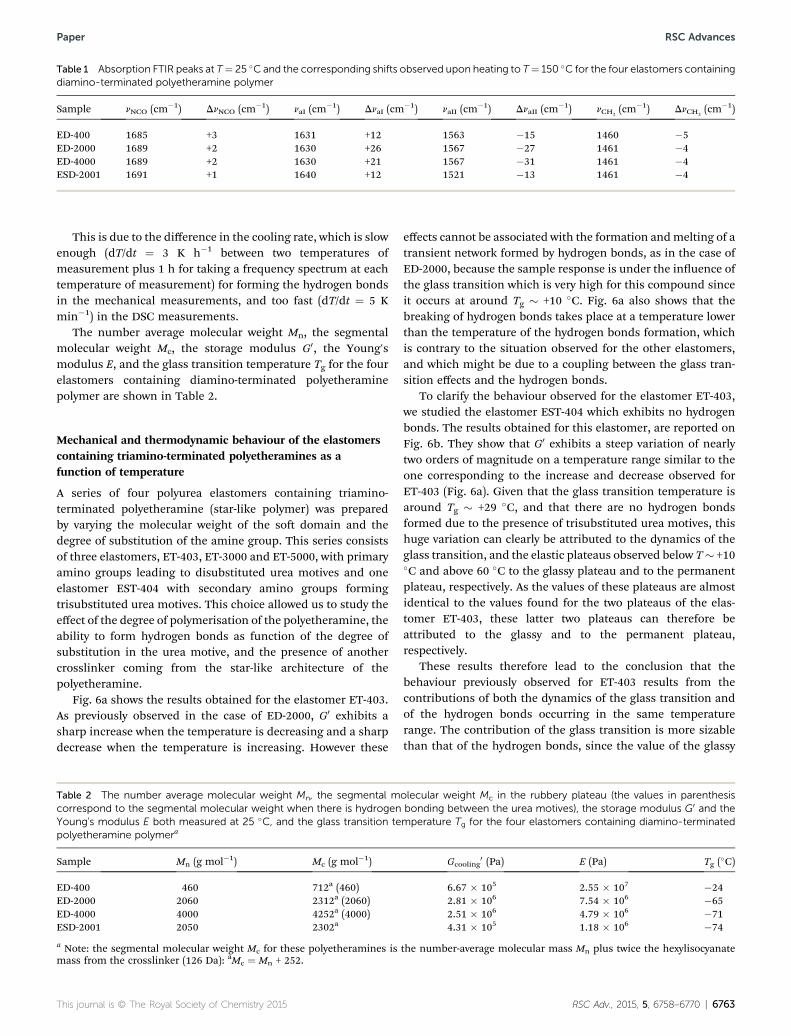
Table 1 Absorption FTIR peaks at T¼ 25 �C and the corresponding shifts observed upon heating to T¼ 150 �C for the four elastomers containingdiamino-terminated polyetheramine polymer
Sample nNCO (cm�1) DnNCO (cm�1) naI (cm�1) DnaI (cm
�1) naII (cm�1) DnaII (cm
�1) nCH2(cm�1) DnCH2
(cm�1)
ED-400 1685 +3 1631 +12 1563 �15 1460 �5ED-2000 1689 +2 1630 +26 1567 �27 1461 �4ED-4000 1689 +2 1630 +21 1567 �31 1461 �4ESD-2001 1691 +1 1640 +12 1521 �13 1461 �4
Paper RSC Advances
This is due to the difference in the cooling rate, which is slowenough (dT/dt ¼ 3 K h�1 between two temperatures ofmeasurement plus 1 h for taking a frequency spectrum at eachtemperature of measurement) for forming the hydrogen bondsin the mechanical measurements, and too fast (dT/dt ¼ 5 Kmin�1) in the DSC measurements.
The number average molecular weight Mn, the segmentalmolecular weight Mc, the storage modulus G0, the Young'smodulus E, and the glass transition temperature Tg for the fourelastomers containing diamino-terminated polyetheraminepolymer are shown in Table 2.
Mechanical and thermodynamic behaviour of the elastomerscontaining triamino-terminated polyetheramines as afunction of temperature
A series of four polyurea elastomers containing triamino-terminated polyetheramine (star-like polymer) was preparedby varying the molecular weight of the so domain and thedegree of substitution of the amine group. This series consistsof three elastomers, ET-403, ET-3000 and ET-5000, with primaryamino groups leading to disubstituted urea motives and oneelastomer EST-404 with secondary amino groups formingtrisubstituted urea motives. This choice allowed us to study theeffect of the degree of polymerisation of the polyetheramine, theability to form hydrogen bonds as function of the degree ofsubstitution in the urea motive, and the presence of anothercrosslinker coming from the star-like architecture of thepolyetheramine.
Fig. 6a shows the results obtained for the elastomer ET-403.As previously observed in the case of ED-2000, G0 exhibits asharp increase when the temperature is decreasing and a sharpdecrease when the temperature is increasing. However these
Table 2 The number average molecular weight Mn, the segmental mcorrespond to the segmental molecular weight when there is hydrogenYoung's modulus E both measured at 25 �C, and the glass transition tepolyetheramine polymera
Sample Mn (g mol�1) Mc (g mol�1)
ED-400 460 712a (460)ED-2000 2060 2312a (2060)ED-4000 4000 4252a (4000)ESD-2001 2050 2302a
a Note: the segmental molecular weight Mc for these polyetheramines ismass from the crosslinker (126 Da): aMc ¼ Mn + 252.
This journal is © The Royal Society of Chemistry 2015
effects cannot be associated with the formation andmelting of atransient network formed by hydrogen bonds, as in the case ofED-2000, because the sample response is under the inuence ofthe glass transition which is very high for this compound sinceit occurs at around Tg � +10 �C. Fig. 6a also shows that thebreaking of hydrogen bonds takes place at a temperature lowerthan the temperature of the hydrogen bonds formation, whichis contrary to the situation observed for the other elastomers,and which might be due to a coupling between the glass tran-sition effects and the hydrogen bonds.
To clarify the behaviour observed for the elastomer ET-403,we studied the elastomer EST-404 which exhibits no hydrogenbonds. The results obtained for this elastomer, are reported onFig. 6b. They show that G0 exhibits a steep variation of nearlytwo orders of magnitude on a temperature range similar to theone corresponding to the increase and decrease observed forET-403 (Fig. 6a). Given that the glass transition temperature isaround Tg � +29 �C, and that there are no hydrogen bondsformed due to the presence of trisubstituted urea motives, thishuge variation can clearly be attributed to the dynamics of theglass transition, and the elastic plateaus observed below T� +10�C and above 60 �C to the glassy plateau and to the permanentplateau, respectively. As the values of these plateaus are almostidentical to the values found for the two plateaus of the elas-tomer ET-403, these latter two plateaus can therefore beattributed to the glassy and to the permanent plateau,respectively.
These results therefore lead to the conclusion that thebehaviour previously observed for ET-403 results from thecontributions of both the dynamics of the glass transition andof the hydrogen bonds occurring in the same temperaturerange. The contribution of the glass transition is more sizablethan that of the hydrogen bonds, since the value of the glassy
olecular weight Mc in the rubbery plateau (the values in parenthesisbonding between the urea motives), the storage modulus G0 and themperature Tg for the four elastomers containing diamino-terminated
Gcooling0 (Pa) E (Pa) Tg (�C)
6.67 � 105 2.55 � 107 �242.81 � 106 7.54 � 106 �652.51 � 106 4.79 � 106 �714.31 � 105 1.18 � 106 �74
the number-average molecular mass Mn plus twice the hexylisocyanate
RSC Adv., 2015, 5, 6758–6770 | 6763

Fig. 6 Temperature dependence at f¼ 1 Hz of G0 for (a) the elastomerET-403 (primary amino-terminated polyetheramine which formsdisubstituted urea groups with bidentated hydrogen bonds) at dT/dt ¼3 K h�1, and for (b) the elastomer EST-404 (secondary amino-termi-nated polyetheramine which forms trisubstituted urea groups withoutbidentated hydrogen bonds) at dT/dt ¼ 3 K h�1. The step variationcomes from the contribution of the glass transition for EST-404, andfrom the simultaneous contribution of the glass transition and of thehydrogen bonds for ET-403. For both elastomers, the solid linesrepresent the classical kBT behaviour.
Fig. 7 Temperature dependence at f ¼ 1 Hz of G0 for the elastomerscontaining primary amino-terminated polyetheramines at dT/dt ¼ 3 Kh�1: (a) the elastomer ET-3000, and (b) the elastomer ET-5000. Thesolid lines represent the classical kBT behaviour.
RSC Advances Paper
plateau of ET-403 is of the same order of magnitude than theone of EST-404. The contribution of the hydrogen bonds isreected by the thermal hysteresis observed between the heat-ing and the cooling processes.
We consider now the elastomers ET-3000 and ET-5000,which exhibit very low glass transition temperatures, Tg ��60 �C for ET-3000 and Tg � �67 �C for ET-5000. The glasstransition effects should therefore not interfere with theformation or breaking of the hydrogen bond network. Fig. 7a(ET-3000) and 7b (ET-5000), respectively, show that this iseffectively the case since for both elastomers the temperature offormation of the transient network is located well above theglass transition temperature, as it is the case for the elastomersED-2000 and ED-4000. It can also be seen that the variation of G0
as a function of temperature when the glass transition isapproached, is different from that of the diamino-terminatedpolymer-based elastomers. This difference in behaviour
6764 | RSC Adv., 2015, 5, 6758–6770
reects the difference in the chemical composition and archi-tecture (trifunctionalized vs. bifunctionalized polymers) of thesamples.
FTIR experiments conrmed the presence or the absence of atransient network as discussed before (Fig. ESI-4†). The twoelastomers containing the low molecular weight polymer (ET-403 and EST-404) show shis of around Dn ¼ �15 cm�1 forboth amide absorption bands, while the two elastomers con-taining the high molecular weight polymer (ET-3000 and ET-5000) show bigger shis of around Dn ¼ �25 cm�1. The threeelastomers with the transient network (ET-403, ET-3000 and ET-5000) have the amide I peak around naI ¼ 1634 cm�1 and theamide II peak at naII ¼ 1563 cm�1, whereas the elastomer withno transient network (EST-404) has the peaks located at naI ¼1631 cm�1 and naII ¼ 1525 cm�1, respectively, differentiatingthe ordered disubstituted urea motives from the disorderedtrisubstituted urea motives. All peaks at T¼ 25 �C together withthe corresponding shis observed upon heating the elastomersto T ¼ 150 �C are collected in Table 3.
Similar observations can be deduced from the analysis of theDSC curves taken for the four elastomers. Indeed, Fig. ESI-5†shows that the elastomers ET-3000 and ET-5000 with
This journal is © The Royal Society of Chemistry 2015
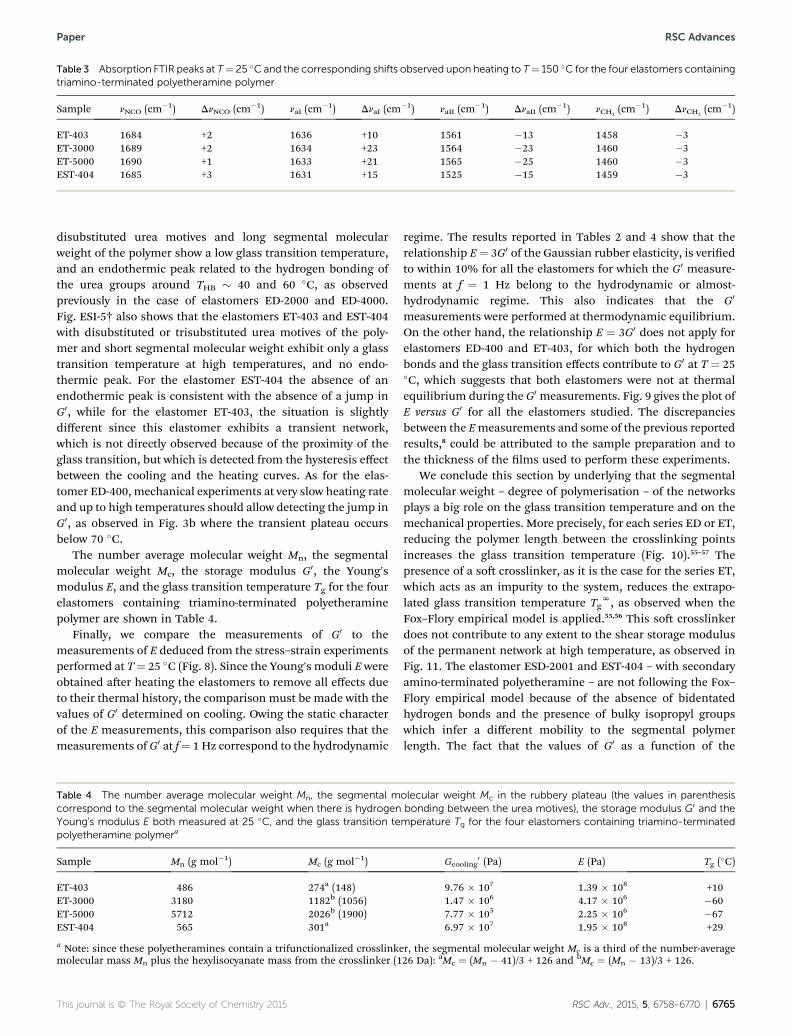
Table 3 Absorption FTIR peaks at T¼ 25 �C and the corresponding shifts observed upon heating to T¼ 150 �C for the four elastomers containingtriamino-terminated polyetheramine polymer
Sample nNCO (cm�1) DnNCO (cm�1) naI (cm�1) DnaI (cm
�1) naII (cm�1) DnaII (cm
�1) nCH2(cm�1) DnCH2
(cm�1)
ET-403 1684 +2 1636 +10 1561 �13 1458 �3ET-3000 1689 +2 1634 +23 1564 �23 1460 �3ET-5000 1690 +1 1633 +21 1565 �25 1460 �3EST-404 1685 +3 1631 +15 1525 �15 1459 �3
Paper RSC Advances
disubstituted urea motives and long segmental molecularweight of the polymer show a low glass transition temperature,and an endothermic peak related to the hydrogen bonding ofthe urea groups around THB � 40 and 60 �C, as observedpreviously in the case of elastomers ED-2000 and ED-4000.Fig. ESI-5† also shows that the elastomers ET-403 and EST-404with disubstituted or trisubstituted urea motives of the poly-mer and short segmental molecular weight exhibit only a glasstransition temperature at high temperatures, and no endo-thermic peak. For the elastomer EST-404 the absence of anendothermic peak is consistent with the absence of a jump inG0, while for the elastomer ET-403, the situation is slightlydifferent since this elastomer exhibits a transient network,which is not directly observed because of the proximity of theglass transition, but which is detected from the hysteresis effectbetween the cooling and the heating curves. As for the elas-tomer ED-400, mechanical experiments at very slow heating rateand up to high temperatures should allow detecting the jump inG0, as observed in Fig. 3b where the transient plateau occursbelow 70 �C.
The number average molecular weight Mn, the segmentalmolecular weight Mc, the storage modulus G0, the Young'smodulus E, and the glass transition temperature Tg for the fourelastomers containing triamino-terminated polyetheraminepolymer are shown in Table 4.
Finally, we compare the measurements of G0 to themeasurements of E deduced from the stress–strain experimentsperformed at T¼ 25 �C (Fig. 8). Since the Young's moduli E wereobtained aer heating the elastomers to remove all effects dueto their thermal history, the comparison must be made with thevalues of G0 determined on cooling. Owing the static characterof the E measurements, this comparison also requires that themeasurements of G0 at f¼ 1 Hz correspond to the hydrodynamic
Table 4 The number average molecular weight Mn, the segmental mcorrespond to the segmental molecular weight when there is hydrogenYoung's modulus E both measured at 25 �C, and the glass transition tepolyetheramine polymera
Sample Mn (g mol�1) Mc (g mol�1)
ET-403 486 274a (148)ET-3000 3180 1182b (1056)ET-5000 5712 2026b (1900)EST-404 565 301a
a Note: since these polyetheramines contain a trifunctionalized crosslinkemolecular mass Mn plus the hexylisocyanate mass from the crosslinker (1
This journal is © The Royal Society of Chemistry 2015
regime. The results reported in Tables 2 and 4 show that therelationship E¼ 3G0 of the Gaussian rubber elasticity, is veriedto within 10% for all the elastomers for which the G0 measure-ments at f ¼ 1 Hz belong to the hydrodynamic or almost-hydrodynamic regime. This also indicates that the G0
measurements were performed at thermodynamic equilibrium.On the other hand, the relationship E ¼ 3G0 does not apply forelastomers ED-400 and ET-403, for which both the hydrogenbonds and the glass transition effects contribute to G0 at T ¼ 25�C, which suggests that both elastomers were not at thermalequilibrium during the G0 measurements. Fig. 9 gives the plot ofE versus G0 for all the elastomers studied. The discrepanciesbetween the Emeasurements and some of the previous reportedresults,8 could be attributed to the sample preparation and tothe thickness of the lms used to perform these experiments.
We conclude this section by underlying that the segmentalmolecular weight – degree of polymerisation – of the networksplays a big role on the glass transition temperature and on themechanical properties. More precisely, for each series ED or ET,reducing the polymer length between the crosslinking pointsincreases the glass transition temperature (Fig. 10).55–57 Thepresence of a so crosslinker, as it is the case for the series ET,which acts as an impurity to the system, reduces the extrapo-lated glass transition temperature Tg
N, as observed when theFox–Flory empirical model is applied.55,56 This so crosslinkerdoes not contribute to any extent to the shear storage modulusof the permanent network at high temperature, as observed inFig. 11. The elastomer ESD-2001 and EST-404 – with secondaryamino-terminated polyetheramine – are not following the Fox–Flory empirical model because of the absence of bidentatedhydrogen bonds and the presence of bulky isopropyl groupswhich infer a different mobility to the segmental polymerlength. The fact that the values of G0 as a function of the
olecular weight Mc in the rubbery plateau (the values in parenthesisbonding between the urea motives), the storage modulus G0 and themperature Tg for the four elastomers containing triamino-terminated
Gcooling0 (Pa) E (Pa) Tg (�C)
9.76 � 107 1.39 � 108 +101.47 � 106 4.17 � 106 �607.77 � 105 2.25 � 106 �676.97 � 107 1.95 � 108 +29
r, the segmental molecular weight Mc is a third of the number-average26 Da): aMc ¼ (Mn � 41)/3 + 126 and bMc ¼ (Mn � 13)/3 + 126.
RSC Adv., 2015, 5, 6758–6770 | 6765

Fig. 8 Stress–strain curves at T ¼ 25 �C for the elastomers ED-400,ED-2000, ED-4000 and ESD-2001 (a), and for the elastomers ET-403,ED-3000, ET-5000 and EST-404 (b). The solid straight lines are the fitsof the data belonging to the purely elastic region.
Fig. 9 E versus G0 at T ¼ 25 �C for the various elastomers studied. TheE and G0 measurements were taken after cooling the elastomers. Thedata are consistent with the relationship E ¼ 3G0 represented by thesolid straight line, except for elastomers ED-400 and ET-403, forwhich both glass transition effects and hydrogen bonds contribute toG0 at this temperature.
Fig. 10 (a) Linear–linear plot and (b) log–log plot for the variation ofthe glass transition temperature Tg as function of the segmentalmolecular weightMc for the eight elastomers, showing for each seriesED and ET that the short polymers raise the glass transition temper-ature due to the low mobility of the polymer segments betweencrosslinking points. Tg
N is the extrapolated glass transition tempera-ture at infinitum segmental molecular weight from the Fox–Floryempirical model. The elastomers ESD-2001 and EST-404 do notfollow the Fox–Flory laws for the ED and ET series because of theirdifferent architecture.
6766 | RSC Adv., 2015, 5, 6758–6770
RSC Advances Paper
segmental molecular weight Mc lay on a straight line for all theelastomers belonging to the ED and ET series shows the goodagreement between the mechanical experiments and thechemistry of these elastomers. It also shows that the differencein the architecture of the ED and ET elastomers plays a minorrole on their elasticity. In contrast, the large difference betweenthe G0 values of the EST-404 and ESD-2001 with respect to thecorresponding hydrogen bond-containing elastomers (ET-403and ED-2000, respectively) indicates that the architecture ofthe EST-404 and EST-2001 elastomers strongly differs from thatof the ET-403 and ED-2000 elastomers. One possible explana-tion can be the presence of defects – dangling chains or longerchains – due to a mismatch in the stoichiometric ratio betweenthe isocyanate and the amino groups, which gives an apparentsegmental molecular weight bigger than the theoretical one
This journal is © The Royal Society of Chemistry 2015

Fig. 11 log–log plot of the shear storage modulus G0 as a function ofthe segmental molecular weightMc for the eight elastomers at T ¼ 80�C, where the measurements correspond to the elastic plateau of thechemical network. For each series ED and ET, the data are consistentwith the relationship G0 f Mc
�1 represented by the solid straight lines.The fact that the data of the elastomers EST-404 and ESD-2001 arenot on the solid straight lines associated with the ED and ET seriesshows that the architecture of these two elastomers strongly differsfrom that of the elastomers of each series.
Fig. 12 (a) Master curve for the sample ESD-2001 (long secondaryamino-terminated polyetheramine) showing the frequency responseof the system from the hydrodynamic region up to the glassy region.The reference temperature is Tref ¼ �45.7 �C, and the temperatureused to build the curve is T ¼ �3.6 �C. (b) Master curve for the sampleEST-404 (short secondary amino-terminated polyetheramine)showing the frequency response of the system from the hydrody-namic region up to the glassy region. The reference temperature is Tref¼ 27.5 �C and the temperatures used to build the curve are T ¼ +53.1�C and +79.3 �C.
Paper RSC Advances
while keeping unchanged the relationship E ¼ 3G0. This couldalso explain why the elastomers EST-404 and ESD-2001 do notfollow the Fox–Flory law observed for the ED and ET series(Fig. 10b). Moreover, the presence of the disubstituted ureamotives allow for the formation of well-ordered hydrogen bondswhich lead to the formation of a transient network. This tran-sient network vanishes upon heating the elastomers above T �60 �C, as shown by the mechanical response of the samples andthe shi of the amide I and amide II absorption peaks in theFTIR spectra (Fig. ESI-6†). Only samples with bidentated ureamotives (ED-400, ED-2000, ED-4000, ET-403, ET-3000 and ET-5000) show the presence of such behaviour. The transientnetwork cannot be mechanically detected from the G0 values forET-403 elastomer with low segmental molecular weight andordered bidentated hydrogen bonds due to the proximity of theglass transition temperature, but from the hysteresis effectwhen comparing cooling and heating curves. Finally, trisubsti-tuted urea groups show no effect in the mechanical propertiesof the corresponding polymer networks ESD-2001 and EST-404.
Mechanical behaviour of the various elastomers as a functionof frequency
In this section, the frequency-response of the various elasto-mers will be presented and discussed. Firstly, we consider theelastomers that exhibit no hydrogen-bonds, i.e., the elastomerESD-2001 and EST-404 based on a diamino-terminated polymerand on a triamino-terminated polymer, respectively. Fig. 12a(ESD-2001) and 12b (EST-404) show that a master curve can beconstructed for each elastomer by applying the time–tempera-ture superposition method, which allows determining the
This journal is © The Royal Society of Chemistry 2015
frequency-response of each elastomer in their hydrodynamic,viscoelastic and glassy regimes. It should be noted that thesemaster curves were obtained without making a shi along theG-axis. The differences in the hydrodynamic values of the shearmodulus (G0 � 4 � 105 Pa for ESD-2001 compared to G0 � 2 �106 Pa for EST-404), and in the width of the viscoelastic regime(ranging from f � 10�3 Hz to 102 Hz for ESD-2001, and from10�3 Hz to 10�1 Hz for EST-404) reect the difference in thearchitectures of the elastomers (differences in the segmentalmolecular weight and in the nature and concentration of thecrosslinkers).8 Note that the viscoelastic behaviour is Rouse type(G0 ¼ G00) for both elastomers.
Secondly, we consider elastomers which exhibit a physical(transient) network due to hydrogen bonds and occurring at atemperature much higher than the glass transition tempera-ture. These elastomers are the long segmental molecularweight elastomers ED-2000, ED-4000, ET-3000 and ET-5000,
RSC Adv., 2015, 5, 6758–6770 | 6767

Fig. 13 Behaviour of G0 and G00 as a function of frequency for theelastomer ED-2000 at a temperature located above the temperatureof formation of the transient elastomer showing that the lowfrequency response of the material is that of a chemically crosslinkedelastomer and not that of a long chain polymer.
Fig. 15 Behaviour of the loss angle 4 as a function of frequency for theelastomer ET-403. The temperatures of measurement are T ¼ +50.1�C and +61.9 �C. The last curve has been shifted along the frequencyaxis to show that the time–temperature superposition method doesnot work.
RSC Advances Paper
which are based on a diamino-terminated or triamino-terminated polymer.
The experiments performed as a function of frequency onthese elastomers above the temperature where the transientelastomer forms show that the frequency response is composedof two regions: a low frequency region, which corresponds to thehydrodynamic behaviour for which G0 is frequency independentand G00 f f, and a high frequency region characterized by adeparture of G0 and G00 from these laws. A typical example of theresponse is illustrated by Fig. 13 relative to ED-2000. Thefrequency-independent behavior of G0 conrms that the mate-rial is an elastomer and not a relaxing liquid. Fig. 14 shows theresults obtained as a function of frequency for the same
Fig. 14 Behaviour of G0 and G00 as a function of the frequency for theelastomer ED-2000 showing that the time–temperature superposi-tion method does not work. The shift factor corresponds to the oneused to obtain the master curve for the loss angle 4, represented in theinsert of the figure. A shift factor of 17 along the G-axis would beneeded to obtain a master curve for G0 and G00.
6768 | RSC Adv., 2015, 5, 6758–6770
elastomer at two temperatures, which, as a result of the widefrequency range given by the piezorheometer, are sufficientlyclose to cover the frequency response from the rubbery plateauto the glass transition.
It can be seen that a single curve for the loss angle 4 can beobtained by making a shi along the frequency-axis, but thisshi does not allow obtaining single curves for G0 and G00. Thisdemonstrates that the time–temperature superposition methoddoes not work for G0 and G00. In contrast to the samples withouthydrogen bonds, an additional shi, along the G-axis, is neededto obtain a single curve for G0 and G00. Note that vertical shisare in fact generally allowed, but these shis must be smallsince they correspond to density variations.58 The analysis of theelastomers ED-4000, ET-3000 and ET-5000 also shows that thetime–temperature superposition method does not apply forthese elastomers. This comes from the fact that the hydrogen-bonds and the polymer chains do not follow the same temper-ature dependence. As a result, the viscoelastic behaviour isclearly not of the Rouse-type, in contrast to the one for ESD-2001and EST-404.
Finally, we consider the elastomer for which the contribu-tions of the glass transition and of the hydrogen bonds occur inthe same temperature range. This elastomer is ET-403 withshort segmental molecular weight triamino-terminated poly-mer. Fig. 15 shows the frequency-variation of the loss angle 4
for the sample ET-403 at T ¼ +50.1 and +61.9 �C. The lack ofsuperposition of the two curves demonstrates that the time–temperature superposition method does not work because ofthe simultaneous presence of the hydrogen bonds and glasstransition effects.
Conclusions
We have studied the mechanical properties of a new kind ofpolyurea elastomers prepared by sol–gel chemistry, as a
This journal is © The Royal Society of Chemistry 2015
Paper RSC Advances
function of the segmental molecular weight and the chemicalnature of the polymer end groups. We show that theirmechanical response depends on the temperature rangeinvestigated. At high temperatures, where the hydrogen bondsare not present, the response of the elastomers is the one ofconventional elastomers, while at lower temperatures, when theurea motives are become hydrogen-bonded, the response of theelastomers corresponds to that of physical elastomers.
In addition to the glassy plateau, the elastomers withprimary amines as terminal groups and segmental molecularweight bigger than Mc z 1000 g mol�1 (ED-2000, ED-4000, ET-3000 and ET-5000) show two well separated elastic plateausrespectively corresponding to the chemical and the physicalcomponents of the elastomers, while the elastomers with lowersegmental molecular weight show either only the chemicalplateau because the contribution of the hydrogen bonds over-laps with that of the glass transition (ET-403), or again the twoplateaus (chemical and physical), but only when the heatingrate is low enough for the hydrogen bonds to have time to break(ED-400). When the terminal group is a secondary amine (EST-404 and ESD-2001), which leads to the formation of trisubsti-tuted urea motives, the corresponding elastomers show only thechemical plateau, as for the common rubber-like materials.
All elastomers from the ET series have a so crosslinker inthe chemical composition. At low temperatures, the inuence ofthis second crosslinker has an impact on the glass transitiontemperature Tg, as shown by the lower value of the extrapolatedglass transition temperature obtained when compared to theED series. In contrast, at high temperatures, this so cross-linker has almost no effect on the hydrodynamic mechanicalresponse of the elastomers, and both ED and ET elastomers fallonto the G0 versus Mc straight line.
For all elastomers with bidentated ureamotives and segmentalmolecular weights higher thanMc z 1000 g mol�1, the rigidity ofthe elastomers is reinforced by hydrogen bonds by more than oneorder of magnitude. These systems combine the mechanicalproperties of physical and chemical elastomers which form in thetemperature range investigated, and can therefore be consideredas selective composite materials, due to the presence of micro-phase separation of the hard (crosslinker) and so (polymerchain) domains. Thus, further NMR relaxometry and MultipleQuantum NMR (MQ-NMR) experiments will be performed inorder to elucidate the change in the segmental molecular weightfrom the transient to the purely chemical network, and thedynamical and topological inuence of constraints to the polymerchains in the different polyurea elastomers.
Acknowledgements
We are grateful to Huntsman International LLC and BASF SE forkindly providing all the chemicals. We thank Dominique Collinfor his friendly help during some measurements.
References
1 S. Braley, J. Macromol. Sci., Part A: Pure Appl.Chem., 1970, 4,529.
This journal is © The Royal Society of Chemistry 2015
2 P. K. Weathersby, T. Kolobow and E. W. Stool, J. Biomed.Mater. Res., 1975, 9, 561.
3 J. H. Boretos and W. S. Pierce, Science, 1967, 158, 1481.4 R. W. Hergenrother, X. H. Yut and S. L. Cooper, Biomaterials,1994, 15, 635.
5 P. Vermette, H. J. Griesser, G. Laroche and R. Guidoin,Biomedical Applications of Polyurethanes, Landes Bioscience,Georgetown, Texas, USA, 2001.
6 D. M. Berger and D. J. Primeaux II, Thick-Film ElastomericPolyurethanes and Polyureas, in The Inspection of Coatingsand Linings, The Society for Protective Coatings, Pittsburgh,2nd edn, 2003.
7 W. D. Vilar, Chemistry and Technology of Polyurethanes, VilarPolyurethanes, Rio de Janeiro, 2nd edn, 2002.
8 A. Sanchez-Ferrer, D. Rogez and P. Martinoty, Macromol.Chem. Phys., 2010, 211, 1712.
9 A. Sanchez-Ferrer, M. Reufer, R. Mezzenga,P. Schurtenberger and H. Dietsch, Nanotechnology, 2010,21, 185603.
10 A. Sanchez-Ferrer, R. Mezzenga and H. Dietsch, Macromol.Chem. Phys., 2011, 212, 627.
11 A. M. Mihut, A. Sanchez-Ferrer, J. J. Crassous,J. J. L. A. Hirschi, R. Mezzenga and H. Dietsch, Polymer,2013, 54, 4194.
12 S. Das, I. Yilgor, E. Yilgor and G. L. Wilkes, Polymer, 2008, 49,174.
13 L. Ning, W. De-Ning and Y. Sheng-Kangt, Polymer, 1996, 37,3577.
14 J. Mattia and P. Painter, Macromolecules, 2007, 40, 1546.15 R. Hill and E. E. Walker, J. Polym. Sci., 1948, 3, 609.16 I. A. Mahammad, V. Mahadevan and M. Srinivasan, Eur.
Polym. J., 1989, 25, 427.17 X. T. Tao, T. Watanabe, D. C. Zou, S. Shimoda, H. Sato and
S. Miyata, Macromolecules, 1995, 28, 2637.18 J. L. Stanford, R. H. Still and A. N. Wilkinson, Polym. Int.,
1996, 41, 283.19 S. Wataru, C. Koki and T. Naoto, J. Polym. Sci., Part B: Polym.
Phys., 2001, 39, 247.20 I. Yilgor, E. Yilgor, S. Das and G. L. Wilkes, J. Polym. Sci., Part
B: Polym. Phys., 2009, 47, 471.21 S. K. Jewrajka, J. Kang, G. Erdodi, J. P. Kennedy, E. Yilgor and
I. Yilgor, J. Polym. Sci., Part A: Polym. Chem., 2009, 47, 2787.22 R. F. Harris, M. D. Joseph, C. Davidson, C. D. Deporter and
V. A. Dais, J. Appl. Polym. Sci., 1990, 41, 487.23 L. T. J. Korley, B. D. Pate, E. L. Thomas and P. T. Hammond,
Polymer, 2006, 47, 3073.24 B. Pukanszky Jr, K. Bagdi, Z. Tovolgyi, J. Varga, L. Botz,
S. Hudak, T. Doczi and B. Pukanszky, Eur. Polym. J., 2008,44, 2431.
25 M. A. Hood, B. Wang, J. M. Sands, J. J. L. Scala, F. L. Beyerand C. Y. Li, Polymer, 2010, 51, 2191.
26 C. Z. Yang, C. Li and S. L. Cooper, J. Polym. Sci., Part B: Polym.Phys., 1991, 29, 75.
27 A. Marcos, A. Rodrıguez and L. Gonzalez, J. Non-Cryst. Solids,1994, 172–174, 1125.
28 N. Samcon, F. Mechin and J. P. Pascault, J. Appl. Polym. Sci.,1997, 65, 2265.
RSC Adv., 2015, 5, 6758–6770 | 6769
RSC Advances Paper
29 J. P. Sheth, E. Yilgor, B. Erenturk, H. Ozhalici, I. Yilgor andG. L. Wilkes, Polymer, 2005, 46, 8185.
30 J. Yi, M. C. Boyce, G. F. Lee and E. Balizer, Polymer, 2006, 47,319.
31 S. Das, I. Yilgor, E. Yilgor, B. Inci, O. Tezgel, F. L. Beyer andG. L. Wilkes, Polymer, 2007, 48, 290.
32 S. Das, D. F. Cox, G. L. Wilkes, D. B. Klinedinst, I. Yilgor,E. Yilgor and F. L. Beyer, J. Macromol. Sci., Part B: Phys.,2007, 46, 853.
33 J. L. Gallani, L. Hilliou, P. Martinoty, F. Doublet andM. Mauzac, J. Phys. II, 1996, 6, 443.
34 J. Weilepp, P. Stein, N. Assfalg, H. Finkelmann, P. Martinotyand H. R. Brand, Europhys. Lett., 1999, 47, 508.
35 J. Weilepp, J. Zanna, N. Assfalg, P. Stein, L. Hilliou,M. Mauzac, H. Finkelmann, H. R. Brand and P. Martinoty,Macromolecules, 1999, 32, 4566.
36 P. Stein, N. Assfalg, H. Finkelmann and P. Martinoty, Eur.Phys. J. E, 2001, 4, 255.
37 J. J. Zanna, P. Stein, D. Marty, M. Mauzac and P. Martinoty,Macromolecules, 2003, 35, 5459.
38 P. Martinoty, P. Stein, H. Finkelmann, H. Pleiner andH. R. Brand, Eur. Phys. J. E, 2004, 14, 311.
39 D. Rogez, H. Brandt, H. Finkelmann and P. Martinoty,Macromol. Chem. Phys., 2006, 207, 735.
40 D. Rogez, G. Francius, H. Finkelmann and P. Martinoty, Eur.Phys. J. E, 2006, 20, 369.
41 D. Rogez and P. Martinoty, Eur. Phys. J. E, 2011, 34, 69.42 D. Rogez, F. Brommel, H. Finkelmann and P. Martinoty,
Macromol. Chem. Phys., 2011, 212, 2667.
6770 | RSC Adv., 2015, 5, 6758–6770
43 P. Martinoty, L. Hilliou, M. Mauzac, L. Benguigui andD. Collin, Macromolecules, 1999, 32, 1746.
44 D. Collin and P. Martinoty, Phys. A, 2003, 320, 235.45 D. Collin and P. Martinoty, Eur. Phys. J. E, 2006, 19, 87.46 O. Pozo, D. Collin, H. Finkelmann, D. Rogez and
P. Martinoty, Phys. Rev. E: Stat., Nonlinear, So MatterPhys., 2009, 80, 031801.
47 D. Collin, G. K. Auernhammer, O. Gavat, P. Martinoty andH. R. Brand, Macromol. Rapid Commun., 2003, 24, 737.
48 G. K. Auernhammer, D. Collin and P. Martinoty, J. Chem.Phys., 2006, 124, 204907.
49 D. Collin, P. Lavalle, J. Mendez-Garcıa, J. C. Voegel, P. Schaafand P. Martinoty, Macromolecules, 2004, 37, 10195.
50 A. Fuith, M. Reinecker, A. Sanchez-Ferrer, R. Mezzenga,A. Mrzel, M. Knite, I. Aulika, M. Dunce and W. Schranz,Sens. Transducers J., 2011, 12, 71.
51 M. Reinecker, A. Fuith, V. Soprunyuk, A. Sanchez-Ferrer,A. Mrzel, R. Torre and W. Schranz, Phys. Status Solidi A,2013, 11, 2348.
52 M. Reinecker, V. Soprunyuk, M. Fally, A. Sanchez-Ferrer andW. Schranz, So Matter, 2014, 10, 5729–5738.
53 E. Yilgor, E. Burgaz, E. Yurtsever and I. Yilgor, Polymer, 2000,41, 849.
54 N. S. Myshakina, Z. Ahmed and S. A. Asher, J. Phys. Chem. B,2008, 112, 11873.
55 T. G. Fox and P. J. Flory, J. Appl. Phys., 1950, 21, 581.56 T. G. Fox and P. J. Flory, J. Polym. Sci., 1954, 14, 315.57 T. G. Fox and S. Loshaek, J. Polym. Sci., 1955, 15, 371.58 J. D. Ferry, Visco-Elastic Properties of Polymers, Wiley, New
York, 2nd edn, 1970.
This journal is © The Royal Society of Chemistry 2015