ALGAL BIOMASS AND RENEWABLE ENERGY: CO 2 EFFECTS ON GROWTH AND LIPID COMPOSITION OF MICROALGAE
HAL Id: hal-01053366https://hal.archives-ouvertes.fr/hal-01053366
Submitted on 25 Sep 2014
HAL is a multi-disciplinary open accessarchive for the deposit and dissemination of sci-entific research documents, whether they are pub-lished or not. The documents may come fromteaching and research institutions in France orabroad, or from public or private research centers.
L’archive ouverte pluridisciplinaire HAL, estdestinée au dépôt et à la diffusion de documentsscientifiques de niveau recherche, publiés ou non,émanant des établissements d’enseignement et derecherche français ou étrangers, des laboratoirespublics ou privés.
Influence of the chemical composition of mortars onalgal biofouling
Estelle Dalod, Alexandre Govin, René Guyonnet, Philippe Grosseau,Christine Lors, Denis Damidot
To cite this version:Estelle Dalod, Alexandre Govin, René Guyonnet, Philippe Grosseau, Christine Lors, et al.. Influenceof the chemical composition of mortars on algal biofouling. International Conference on CalciumAluminates, May 2014, Palais des Papes, Avignon, France. pp. 523 - 534. �hal-01053366�
Calcium Aluminates: Proceedings of International Conference, Avignon, 18 –21 May 2014. Fentiman CH, Mangabhai RJ and Scrivener KL (Editors). IHS BRE Press, 2014, EP104. ISBN 978-1-84806-316-7.
INFLUENCE OF THE CHEMICAL COMPOSITION OF MORTARS ON ALGAL BIOFOULING E. DALOD, A. GOVIN, R. GUYONNET and P. GROSSEAU SPIN-EMSE, CNRS:UMR5307, LGF, Ecole Nationale Supérieure des Mines de Saint Etienne, France Correspondence: [email protected] C. LORS and D. DAMIDOT LGCgE-GCE, Ecole Nationale Supérieure des Mines de Douai, France
SUMMARY: The main cause of building-facade biodeterioration is the growth of microorganisms. The state of surface is among parameters which affects the most biofouling kinetics. The main objective of this study is to highlight the influence of mortar chemistry and its physical properties on algal growth. The green algae Klebsormidium flaccidum has been chosen for this work because of its representativeness. In order to characterize the influence of the mortar chemistry on biofouling, Portland cement (CEMI) and aluminate cement (CAC) were used. The biofouling kinetics was followed on samples tested in a laboratory bench, where the mortar specimens were exposed to a sprinkling of algal suspension. The algal growth was daily monitored by image analysis. The colonization rate was given by the ratio of colonized area to the total surface. In our case, the surface roughness doesn’t seem to affect the algal colonization. The experimental method highlights that surface pH and chemistry of cement used in mortar formulations have an influence on algal fouling. In fact, the colonization kinetics of CAC mortars is lower than that of CEMI mortars. Keywords: algae, biofouling, calcium aluminate cement, carbonation, Klebsormidium flaccidum, mortar, Portland cement.
INTRODUCTION
Spots observed on building facades arise from a recurring phenomenon of deterioration. The facades ageing causes a change of the surface state which favours the development of black, red or green spots, in particular in the place where the rainwater flows. These spots are actually an association of microorganisms and their secretions called biofilm
[1]. The biofouling is a priority in the current frame of materials sustainable
development. Understanding of the interactions driving biodeterioration is a prerequisite
Dalod, Govin ,Guyonnet, Grosseau, Lors and Damidot
for control of material ageing in real conditions. Organic materials such as paints and polymers, and also mineral materials such as mortar, concrete, natural stones and clay bricks are sensitive to biodeterioration. Barberousse [1] showed that the organic materials resist generally better to the colonization by algae and Cyanobacteria than mineral materials. The microorganisms observed are more diversified and more plentiful on mineral materials than on organic substrates.
Cementitious materials are heterogeneous, porous and their surface roughness can be an important parameter. All these properties define their bioreceptivity [2–4]. Previous studies have determined the influence of mortars’ physical characteristics on their biofouling. Among them, the roughness of the surface [5–9] and the porosity [4,6,10] seem to be the most important parameters of biodeterioration.
Besides the intrinsic characteristics of minerals materials, the environment determines the type of microorganism which colonizes a façade [6,7]. The climate, in particularly temperature and moisture, determines which microorganism will mainly grow. The rain and the wind favour the transport of microorganisms. The orientation of facades also impacts the biological development. An exposure facing to North will be characterized by higher humidity and an absence of direct sunshine. These conditions favour the biofouling [1,9,11].
Cementitious matrix partially weather because of the presence of carbon dioxide in the atmosphere. The natural carbonation of the mineral matrix leads to a decrease in surface pH and favours the microbiological colonization [6,11]. An alkaline surface pH can totally inhibit the colonization of a material by microorganisms. The carbonation thus favours the biological colonization by decreasing the latent period by half [8]. Indeed the pH affects the microorganisms because it regulates the ionization mechanism of metabolites [12]. Their anchorage as well as their growth is then considerably influenced.
The main colonizing microorganisms are microalgae, fungi and bacteria (such as Cyanobacteria) [1,3,7]. Barberousse [1] identified the micro-algae Klebsormidium flaccidum as the major microorganism developed on facades. Klebsormidium flaccidum is considered as a ground species. It is a green alga with wide ecological amplitude [13]. It can be found in the ground, on rocks, stone walls, and bark of trees. It is known for its wide broadcasting in temperate regions [9,14,15].
The main objective of this study is to highlight the substrate chemical composition influence on the biofouling kinetics. Particular attention will be devoted to the mineralogy of cements that were used.
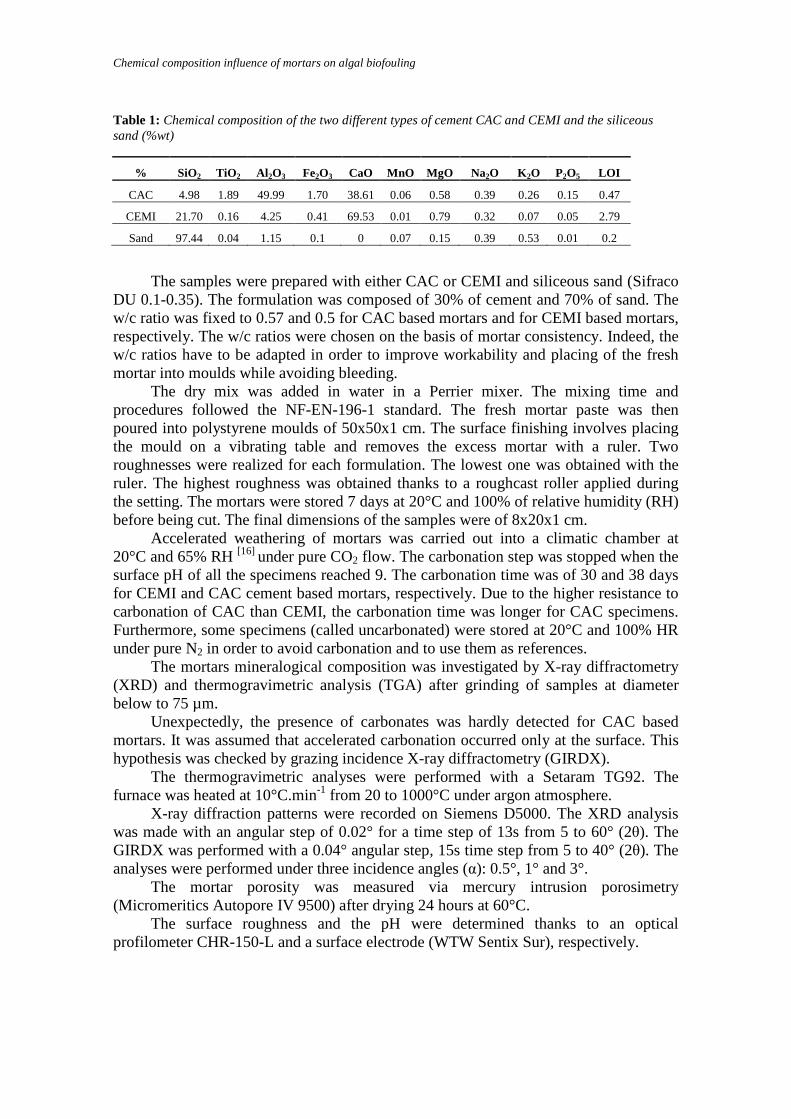
MATERIALS AND METHODS Mortars formulation In order to study the influence of the mineral chemistry on biofouling, two types of cement were selected: one Portland cement and one calcium aluminate cement. The Portland cement was a CEM I 52.5 N CE CP2 NF “SB” (coded CEMI) (provided by Italcementi) and the calcium aluminate cement (coded CAC) was the Ternal White (provided by Kerneos). The chemical compositions obtained by X-Ray fluorescence are given in Table 1.
Chemical composition influence of mortars on algal biofouling
Table 1: Chemical composition of the two different types of cement CAC and CEMI and the siliceous sand (%wt)
% SiO2 TiO2 Al2O3 Fe2O3 CaO MnO MgO Na2O K2O P2O5 LOI
CAC 4.98 1.89 49.99 1.70 38.61 0.06 0.58 0.39 0.26 0.15 0.47
CEMI 21.70 0.16 4.25 0.41 69.53 0.01 0.79 0.32 0.07 0.05 2.79
Sand 97.44 0.04 1.15 0.1 0 0.07 0.15 0.39 0.53 0.01 0.2
The samples were prepared with either CAC or CEMI and siliceous sand (Sifraco
DU 0.1-0.35). The formulation was composed of 30% of cement and 70% of sand. The w/c ratio was fixed to 0.57 and 0.5 for CAC based mortars and for CEMI based mortars, respectively. The w/c ratios were chosen on the basis of mortar consistency. Indeed, the w/c ratios have to be adapted in order to improve workability and placing of the fresh mortar into moulds while avoiding bleeding.
The dry mix was added in water in a Perrier mixer. The mixing time and procedures followed the NF-EN-196-1 standard. The fresh mortar paste was then poured into polystyrene moulds of 50x50x1 cm. The surface finishing involves placing the mould on a vibrating table and removes the excess mortar with a ruler. Two roughnesses were realized for each formulation. The lowest one was obtained with the ruler. The highest roughness was obtained thanks to a roughcast roller applied during the setting. The mortars were stored 7 days at 20°C and 100% of relative humidity (RH) before being cut. The final dimensions of the samples were of 8x20x1 cm.
Accelerated weathering of mortars was carried out into a climatic chamber at 20°C and 65% RH [16] under pure CO2 flow. The carbonation step was stopped when the surface pH of all the specimens reached 9. The carbonation time was of 30 and 38 days for CEMI and CAC cement based mortars, respectively. Due to the higher resistance to carbonation of CAC than CEMI, the carbonation time was longer for CAC specimens. Furthermore, some specimens (called uncarbonated) were stored at 20°C and 100% HR under pure N2 in order to avoid carbonation and to use them as references.
The mortars mineralogical composition was investigated by X-ray diffractometry (XRD) and thermogravimetric analysis (TGA) after grinding of samples at diameter below to 75 µm.
Unexpectedly, the presence of carbonates was hardly detected for CAC based mortars. It was assumed that accelerated carbonation occurred only at the surface. This hypothesis was checked by grazing incidence X-ray diffractometry (GIRDX).
The thermogravimetric analyses were performed with a Setaram TG92. The furnace was heated at 10°C.min-1 from 20 to 1000°C under argon atmosphere.
X-ray diffraction patterns were recorded on Siemens D5000. The XRD analysis was made with an angular step of 0.02° for a time step of 13s from 5 to 60° (2θ). The GIRDX was performed with a 0.04° angular step, 15s time step from 5 to 40° (2θ). The analyses were performed under three incidence angles (α): 0.5°, 1° and 3°.
The mortar porosity was measured via mercury intrusion porosimetry (Micromeritics Autopore IV 9500) after drying 24 hours at 60°C.
The surface roughness and the pH were determined thanks to an optical profilometer CHR-150-L and a surface electrode (WTW Sentix Sur), respectively.
Dalod, Govin ,Guyonnet, Grosseau, Lors and Damidot
Algal culture Strains of Klebsormidium flaccidum were supplied by the Museum National
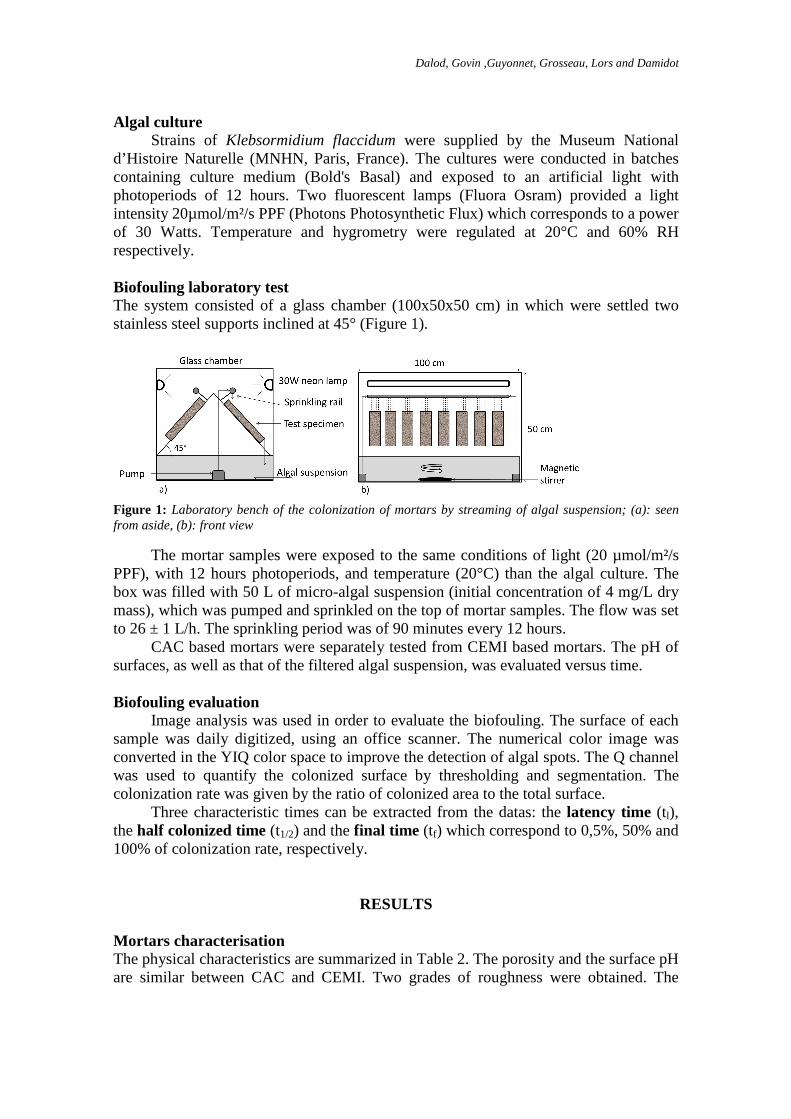
d’Histoire Naturelle (MNHN, Paris, France). The cultures were conducted in batches containing culture medium (Bold's Basal) and exposed to an artificial light with photoperiods of 12 hours. Two fluorescent lamps (Fluora Osram) provided a light intensity 20µmol/m²/s PPF (Photons Photosynthetic Flux) which corresponds to a power of 30 Watts. Temperature and hygrometry were regulated at 20°C and 60% RH respectively. Biofouling laboratory test The system consisted of a glass chamber (100x50x50 cm) in which were settled two stainless steel supports inclined at 45° (Figure 1).
Figure 1: Laboratory bench of the colonization of mortars by streaming of algal suspension; (a): seen from aside, (b): front view
The mortar samples were exposed to the same conditions of light (20 µmol/m²/s PPF), with 12 hours photoperiods, and temperature (20°C) than the algal culture. The box was filled with 50 L of micro-algal suspension (initial concentration of 4 mg/L dry mass), which was pumped and sprinkled on the top of mortar samples. The flow was set to 26 ± 1 L/h. The sprinkling period was of 90 minutes every 12 hours.
CAC based mortars were separately tested from CEMI based mortars. The pH of surfaces, as well as that of the filtered algal suspension, was evaluated versus time. Biofouling evaluation
Image analysis was used in order to evaluate the biofouling. The surface of each sample was daily digitized, using an office scanner. The numerical color image was converted in the YIQ color space to improve the detection of algal spots. The Q channel was used to quantify the colonized surface by thresholding and segmentation. The colonization rate was given by the ratio of colonized area to the total surface.
Three characteristic times can be extracted from the datas: the latency time (tl), the half colonized time (t1/2) and the final time (tf) which correspond to 0,5%, 50% and 100% of colonization rate, respectively.
RESULTS
Mortars characterisation The physical characteristics are summarized in Table 2. The porosity and the surface pH are similar between CAC and CEMI. Two grades of roughness were obtained. The

Chemical composition influence of mortars on algal biofouling
reference is the uncarbonated CEMI based mortar which exhibits the highest surface pH. Table 2: Mortars characteristics
Cement w/c % porosity Surface pH Roughness Code
Carbonated CAC 0.57 (10±2)% 9.3±0,2
Smooth : (35±6) µm CAC 05 SC Rough : (138±17) µm CAC 05 RC
CEMI 0.5 (12±2)% 9.1±0.3 Smooth : (40±6) µm CEMI 05 SC Rough : (179±20) µm CEMI 05 RC
Uncarbonated CAC 0.57 (10±2)% 11.3±0,2
Smooth : (35±6) µm CAC 05 SUC Rough : (138±17) µm CAC 05 RUC
CEMI 0.5 (11±2)% 11.8±0.2 Smooth : (38±12) µm CEMI 05 SUC Rough : (150±25) µm CEMI 05 RUC
Accelerated carbonation of Portland based mortars Figure 2 represents the thermograms of carbonated (C) and uncarbonated (UC) CEMI based mortars. Table 3 summarized the weight losses detected by TGA, with their identification and quantification.
Table 3 : Thermogravimetric analysis of the uncarbonated and carbonated CEMI based mortars
T max (°C)
T range (°C)
Weight loss (%)
Phase
UC
140 60-160 4.5 CSH gel + E
180 160-200 1.3 Ms
490 450-520 2.3 Ca(OH)2
780 600-850 2.3 CaCO3
C
140 60-160 2.4 CSH gel + E
180 160-200 1 Ms
490 450-520 1.6 Ca(OH)2
700 520-760 2.6 CaCO3
840 760-900 3.3 CaCO3
Figure 2: DTG-TG curves of uncarbonated (solid line) and carbonated (long dashed line) CEMI based mortars; E: Ettringite; Ms: Monosulfoaluminate
The ATG curves of the uncarbonated CEMI mortar displays four peaks: two
peaks below 200°C assigned to the dehydration of CSH and ettringite and another corresponding to dehydration of monosulfoaluminate, a third peak ranging from 450 to 520°C assigned to deshydroxylation of portlandite and a fourth peak corresponding to the calcium carbonate decomposition (> 600°C).
In contrast, the ATG curve of carbonated mortar shows five endothermic peaks: the dehydration of CSH and ettringite below 200°C, same as uncarbonated sample, the dehydration of Ms, around 180°C, the dehydroxylation of portlandite (around 490°C) and decarbonation above 520°C. Two carbonates decomposition was detected: one in temperature range 520-760°C which corresponds to vaterite (a metastable phase of calcium carbonate) decarbonation and the second between 760°C and 900°C, which is assigned to calcite decomposition.
The CSH and ettringite decomposition for carbonated sample presents a lower weight loss than for the uncarbonated sample (2.4% vs 4.5%). The weight loss assigned to portlandite dehydroxylation is lower for carbonated mortar than for uncarbonated
Dalod, Govin ,Guyonnet, Grosseau, Lors and Damidot
one. No peak of vaterite decarbonation for uncarbonated sample was detected, indicating the formation of this phase during accelerated carbonation cure. The decarbonation of calcite in carbonated mortar appears at slightly higher temperature (840°C vs. 780°C).
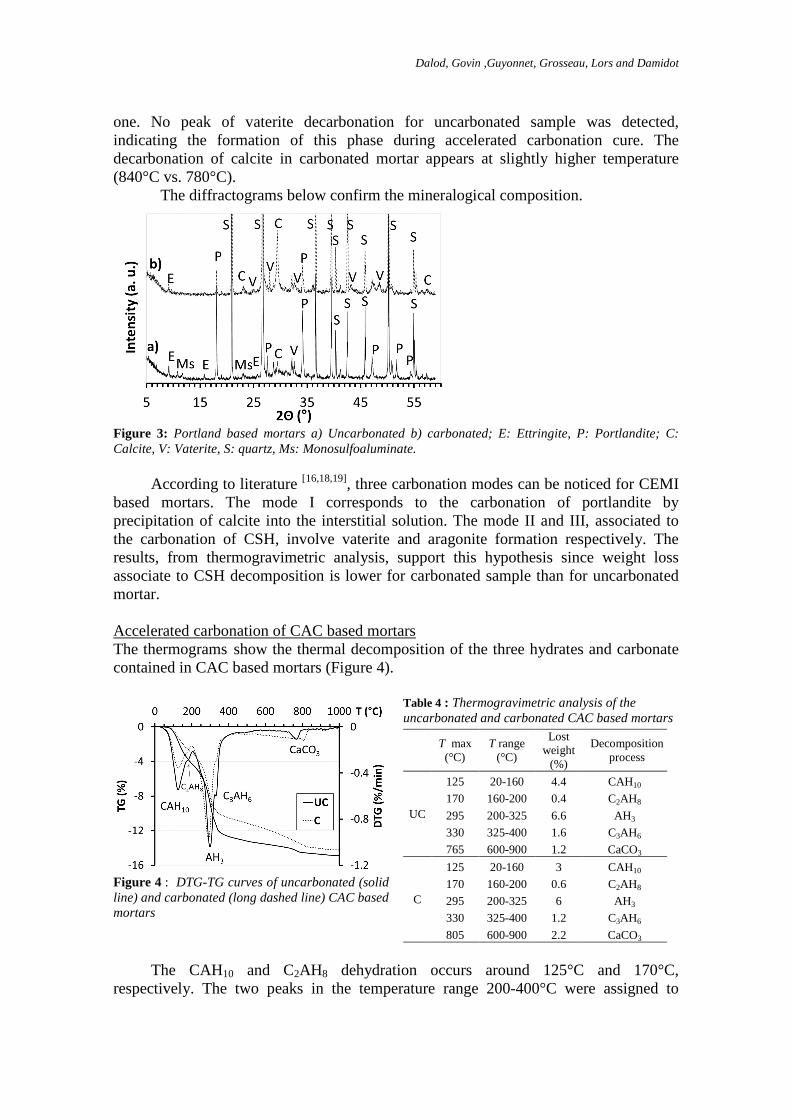
The diffractograms below confirm the mineralogical composition.
Figure 3: Portland based mortars a) Uncarbonated b) carbonated; E: Ettringite, P: Portlandite; C: Calcite, V: Vaterite, S: quartz, Ms: Monosulfoaluminate.
According to literature [16,18,19], three carbonation modes can be noticed for CEMI
based mortars. The mode I corresponds to the carbonation of portlandite by precipitation of calcite into the interstitial solution. The mode II and III, associated to the carbonation of CSH, involve vaterite and aragonite formation respectively. The results, from thermogravimetric analysis, support this hypothesis since weight loss associate to CSH decomposition is lower for carbonated sample than for uncarbonated mortar.
Accelerated carbonation of CAC based mortars The thermograms show the thermal decomposition of the three hydrates and carbonate contained in CAC based mortars (Figure 4).
Table 4 : Thermogravimetric analysis of the uncarbonated and carbonated CAC based mortars
T max (°C)
T range (°C)
Lost weight
(%)
Decomposition process
UC
125 20-160 4.4 CAH10
170 160-200 0.4 C2AH8
295 200-325 6.6 AH3
330 325-400 1.6 C3AH6
765 600-900 1.2 CaCO3
C
125 20-160 3 CAH10
170 160-200 0.6 C2AH8
295 200-325 6 AH3
330 325-400 1.2 C3AH6
805 600-900 2.2 CaCO3
Figure 4 : DTG-TG curves of uncarbonated (solid line) and carbonated (long dashed line) CAC based mortars
The CAH10 and C2AH8 dehydration occurs around 125°C and 170°C,
respectively. The two peaks in the temperature range 200-400°C were assigned to
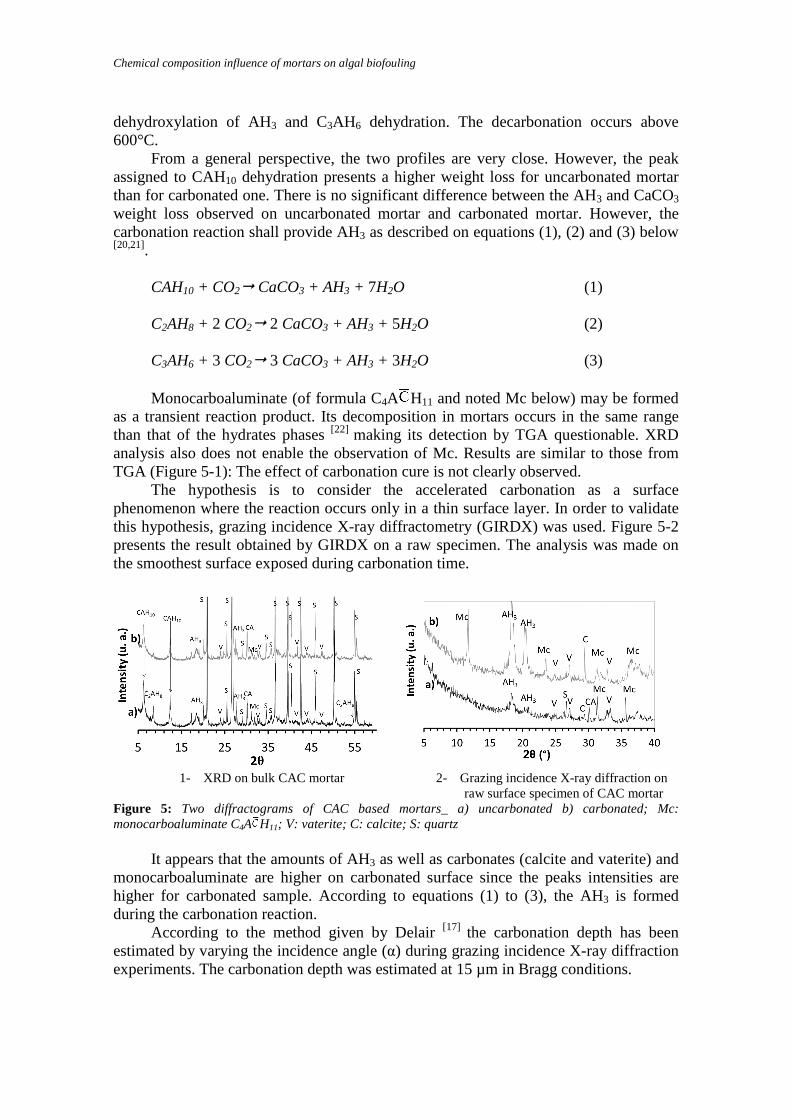
Chemical composition influence of mortars on algal biofouling
dehydroxylation of AH3 and C3AH6 dehydration. The decarbonation occurs above 600°C.
From a general perspective, the two profiles are very close. However, the peak assigned to CAH10 dehydration presents a higher weight loss for uncarbonated mortar than for carbonated one. There is no significant difference between the AH3 and CaCO3 weight loss observed on uncarbonated mortar and carbonated mortar. However, the carbonation reaction shall provide AH3 as described on equations (1), (2) and (3) below [20,21].
CAH10 + CO2� CaCO3 + AH3 + 7H2O (1) C2AH8 + 2 CO2� 2 CaCO3 + AH3 + 5H2O (2) C3AH6 + 3 CO2� 3 CaCO3 + AH3 + 3H2O (3)
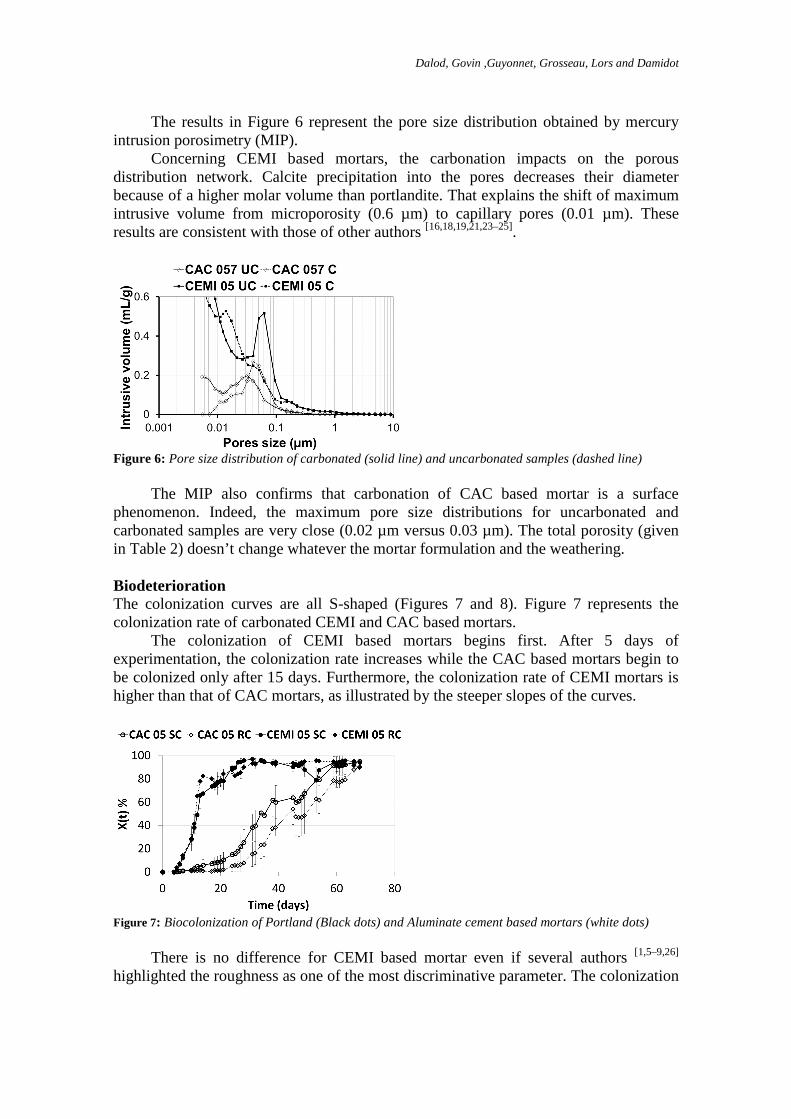
Monocarboaluminate (of formula C4A H11 and noted Mc below) may be formed
as a transient reaction product. Its decomposition in mortars occurs in the same range than that of the hydrates phases [22] making its detection by TGA questionable. XRD analysis also does not enable the observation of Mc. Results are similar to those from TGA (Figure 5-1): The effect of carbonation cure is not clearly observed.
The hypothesis is to consider the accelerated carbonation as a surface phenomenon where the reaction occurs only in a thin surface layer. In order to validate this hypothesis, grazing incidence X-ray diffractometry (GIRDX) was used. Figure 5-2 presents the result obtained by GIRDX on a raw specimen. The analysis was made on the smoothest surface exposed during carbonation time.
1- XRD on bulk CAC mortar 2- Grazing incidence X-ray diffraction on
raw surface specimen of CAC mortar Figure 5: Two diffractograms of CAC based mortars_ a) uncarbonated b) carbonated; Mc: monocarboaluminate C4A H11; V: vaterite; C: calcite; S: quartz
It appears that the amounts of AH3 as well as carbonates (calcite and vaterite) and
monocarboaluminate are higher on carbonated surface since the peaks intensities are higher for carbonated sample. According to equations (1) to (3), the AH3 is formed during the carbonation reaction.
According to the method given by Delair [17] the carbonation depth has been estimated by varying the incidence angle (α) during grazing incidence X-ray diffraction experiments. The carbonation depth was estimated at 15 µm in Bragg conditions.
Dalod, Govin ,Guyonnet, Grosseau, Lors and Damidot
The results in Figure 6 represent the pore size distribution obtained by mercury intrusion porosimetry (MIP).
Concerning CEMI based mortars, the carbonation impacts on the porous distribution network. Calcite precipitation into the pores decreases their diameter because of a higher molar volume than portlandite. That explains the shift of maximum intrusive volume from microporosity (0.6 µm) to capillary pores (0.01 µm). These results are consistent with those of other authors [16,18,19,21,23–25].
Figure 6: Pore size distribution of carbonated (solid line) and uncarbonated samples (dashed line)
The MIP also confirms that carbonation of CAC based mortar is a surface
phenomenon. Indeed, the maximum pore size distributions for uncarbonated and carbonated samples are very close (0.02 µm versus 0.03 µm). The total porosity (given in Table 2) doesn’t change whatever the mortar formulation and the weathering.
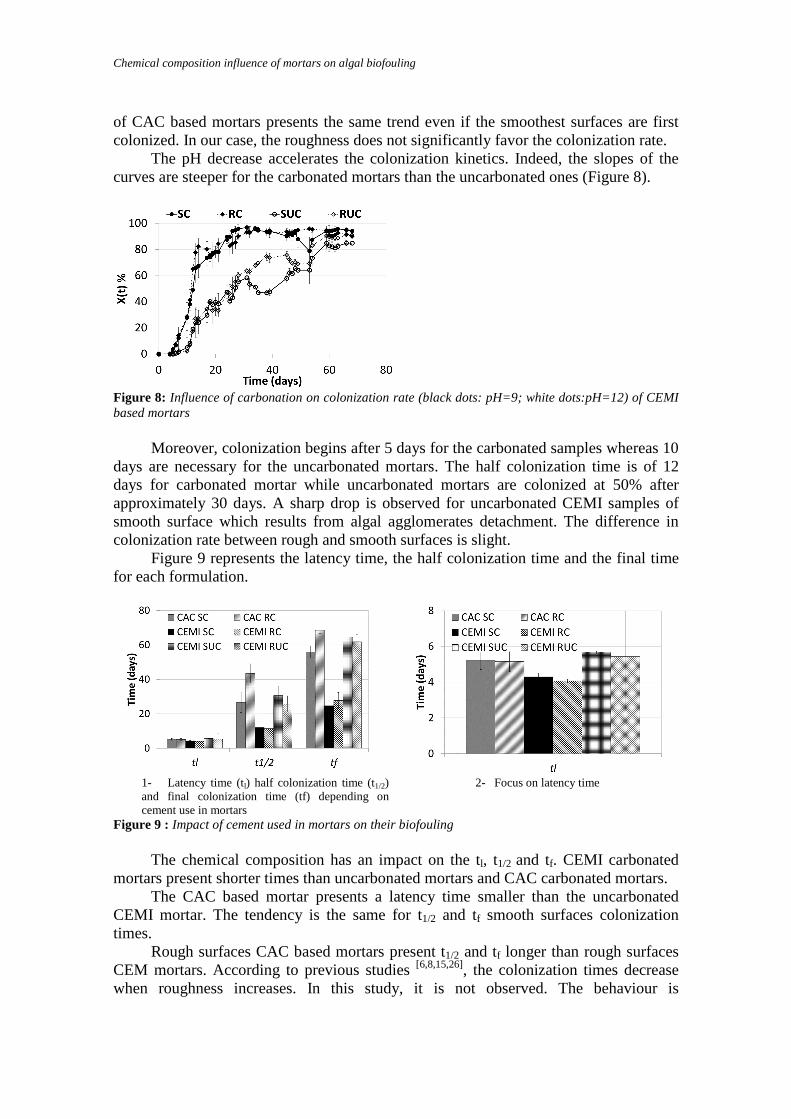
Biodeterioration The colonization curves are all S-shaped (Figures 7 and 8). Figure 7 represents the colonization rate of carbonated CEMI and CAC based mortars.
The colonization of CEMI based mortars begins first. After 5 days of experimentation, the colonization rate increases while the CAC based mortars begin to be colonized only after 15 days. Furthermore, the colonization rate of CEMI mortars is higher than that of CAC mortars, as illustrated by the steeper slopes of the curves.
Figure 7: Biocolonization of Portland (Black dots) and Aluminate cement based mortars (white dots)
There is no difference for CEMI based mortar even if several authors [1,5–9,26]
highlighted the roughness as one of the most discriminative parameter. The colonization
Chemical composition influence of mortars on algal biofouling
of CAC based mortars presents the same trend even if the smoothest surfaces are first colonized. In our case, the roughness does not significantly favor the colonization rate.
The pH decrease accelerates the colonization kinetics. Indeed, the slopes of the curves are steeper for the carbonated mortars than the uncarbonated ones (Figure 8).
Figure 8: Influence of carbonation on colonization rate (black dots: pH=9; white dots:pH=12) of CEMI based mortars
Moreover, colonization begins after 5 days for the carbonated samples whereas 10
days are necessary for the uncarbonated mortars. The half colonization time is of 12 days for carbonated mortar while uncarbonated mortars are colonized at 50% after approximately 30 days. A sharp drop is observed for uncarbonated CEMI samples of smooth surface which results from algal agglomerates detachment. The difference in colonization rate between rough and smooth surfaces is slight.
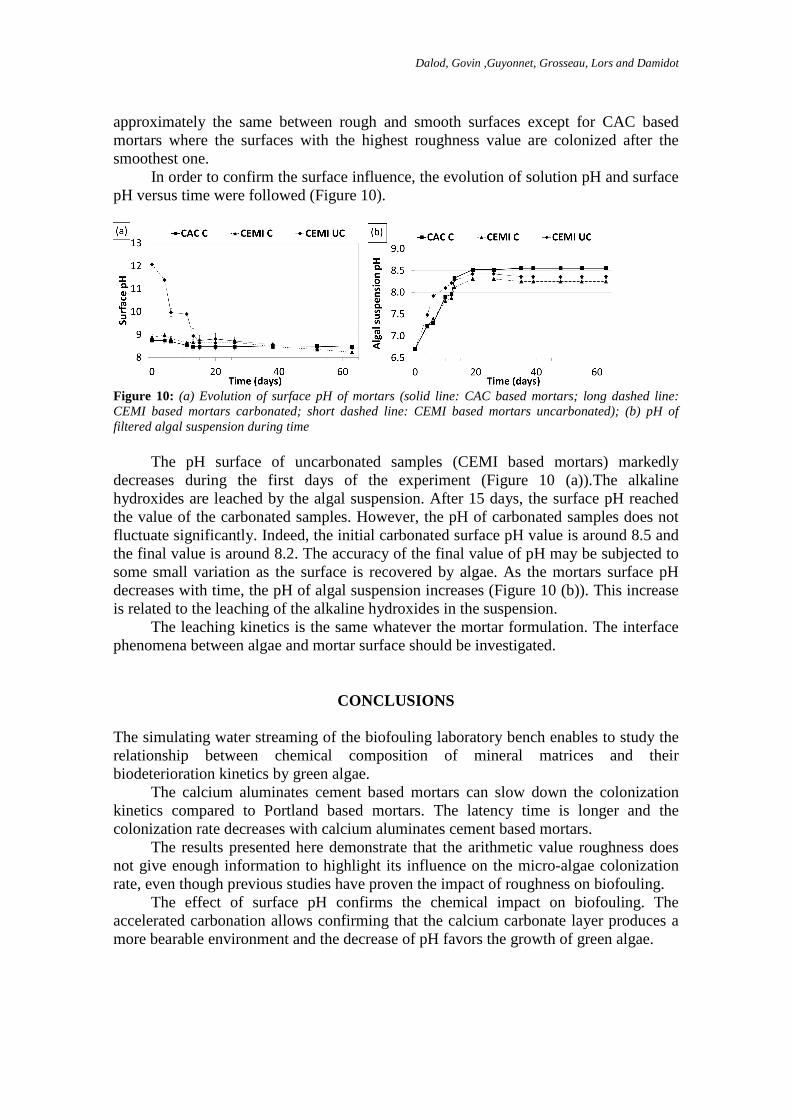
Figure 9 represents the latency time, the half colonization time and the final time for each formulation.
1- Latency time (tl) half colonization time (t1/2) and final colonization time (tf) depending on cement use in mortars
2- Focus on latency time
Figure 9 : Impact of cement used in mortars on their biofouling The chemical composition has an impact on the tl, t1/2 and tf. CEMI carbonated
mortars present shorter times than uncarbonated mortars and CAC carbonated mortars. The CAC based mortar presents a latency time smaller than the uncarbonated
CEMI mortar. The tendency is the same for t1/2 and tf smooth surfaces colonization times.
Rough surfaces CAC based mortars present t1/2 and tf longer than rough surfaces CEM mortars. According to previous studies [6,8,15,26], the colonization times decrease when roughness increases. In this study, it is not observed. The behaviour is
Dalod, Govin ,Guyonnet, Grosseau, Lors and Damidot
approximately the same between rough and smooth surfaces except for CAC based mortars where the surfaces with the highest roughness value are colonized after the smoothest one.
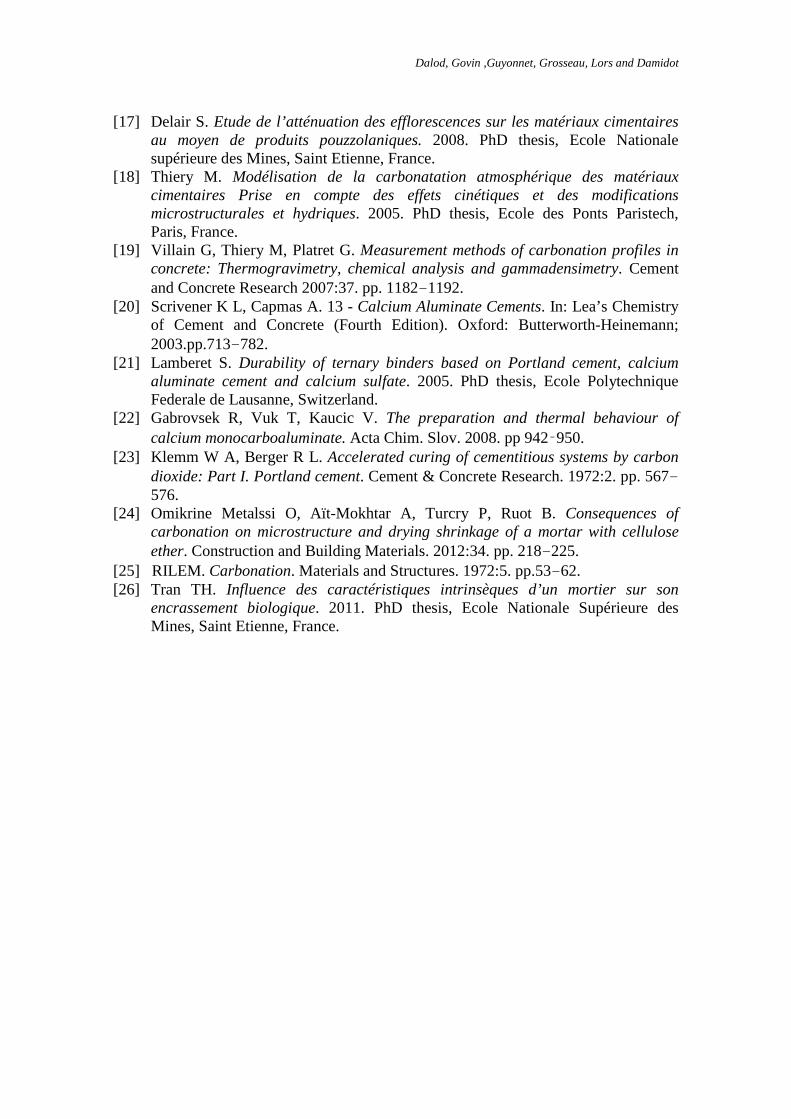
In order to confirm the surface influence, the evolution of solution pH and surface pH versus time were followed (Figure 10).
Figure 10: (a) Evolution of surface pH of mortars (solid line: CAC based mortars; long dashed line: CEMI based mortars carbonated; short dashed line: CEMI based mortars uncarbonated); (b) pH of filtered algal suspension during time
The pH surface of uncarbonated samples (CEMI based mortars) markedly
decreases during the first days of the experiment (Figure 10 (a)).The alkaline hydroxides are leached by the algal suspension. After 15 days, the surface pH reached the value of the carbonated samples. However, the pH of carbonated samples does not fluctuate significantly. Indeed, the initial carbonated surface pH value is around 8.5 and the final value is around 8.2. The accuracy of the final value of pH may be subjected to some small variation as the surface is recovered by algae. As the mortars surface pH decreases with time, the pH of algal suspension increases (Figure 10 (b)). This increase is related to the leaching of the alkaline hydroxides in the suspension.
The leaching kinetics is the same whatever the mortar formulation. The interface phenomena between algae and mortar surface should be investigated.
CONCLUSIONS The simulating water streaming of the biofouling laboratory bench enables to study the relationship between chemical composition of mineral matrices and their biodeterioration kinetics by green algae.
The calcium aluminates cement based mortars can slow down the colonization kinetics compared to Portland based mortars. The latency time is longer and the colonization rate decreases with calcium aluminates cement based mortars.
The results presented here demonstrate that the arithmetic value roughness does not give enough information to highlight its influence on the micro-algae colonization rate, even though previous studies have proven the impact of roughness on biofouling.
The effect of surface pH confirms the chemical impact on biofouling. The accelerated carbonation allows confirming that the calcium carbonate layer produces a more bearable environment and the decrease of pH favors the growth of green algae.

Chemical composition influence of mortars on algal biofouling
REFERENCES
[1] Barberousse H. Etude de la diversité des algues et cyanobactéries colonisant les revêtements de façade en France et recherche des facteurs favorisant leur implantation. 2006. PhD thesis, Museum National d’Histoire Naturelle, Paris, France
[2] Dubosc A, Escadeillas G, Blanc P. Characterization of biological stains on external concrete walls and influence of concrete as underlying material. Cement and Concrete Research 2001:31. pp. 1613-1617.
[3] Saiz-Jimenez C. Biodeteriorationvs biodegradation: the role of microorganisms in the removal of pollutants deposited on historic buidlings. International Biodeterioration & Biodegradation. 1997:40. pp.225-232.
[4] Guillitte O. Bioreceptivity: a new concept for building ecologies studies. The Science of the total environnement. 1995:167. pp. 215-220.
[5] Morton L H G, Greenway D L A, Gaylarde C C, Surman S B. Consideration of some implications of the resistance of biofilms to biocides. International Biodeterioration & Biodegradation. 1998:41. pp. 247-259.
[6] Warscheid T, Braams J. Biodeterioration of stone: a review. International Biodeterioration & Biodegradation.2000:46. pp. 343-368.
[7] Gaylarde C, Ribas Silva M, Warscheid T. Microbial impact on building materials: an overview. Materials and structure. 2003:36. pp. 342-352.
[8] Tran T H, Govin A, Guyonnet R, Grosseau P, Lors C, Garcia-Diaz E, et al. Influence of the intrinsic characteristics of mortars on biofouling by Klebsormidium flaccidum. International Biodeterioration & Biodegradation. 2012:70. pp. 31-39.
[9] Ortega-Calvo J J, Hernandez-Marine M, Saiz-Jimenez C. Biodeterioration of building materials by Cyanobacteria and algae. International Biodeterioration. 1991:28. pp. 165-185.
[10] Gaylarde C C, Gaylarde P M. A comparative study of the major microbial biomass of biofilms on exteriors of buildings in Europe and Latin America.International biodeterioration & biodegradation. 2005:55. pp.131-139.
[11] Barberousse H, Ruot B, Yéprémian C, Boulon G. An assessment of facade coatings against colonisation by aerial algae and Cyanobacteria.Building and Environment. 2007:42. pp. 2555-2561.
[12] Fogg GE. Algal adaptation to stress - Some general remarks. In: Algal adaptation to environnemental stresses. 2001. pp. 1-19.
[13] Rindi F, Guiry M D, Lopez-Bautista JM. Distribution, morphology and phylogeny of Klebsormidium (Klebsormidiales, Charophyceae) in urban environments in Europe. Journal of Phycology. 2008:44. pp.1529-1540.
[14] Rindi F, Guiry M D. Composition and spatial variability of terrestrial algal assemblagesoccuring at the bases of urban walls in Europe. Phycol. 2004:43. pp. 225-235.
[15] Gaylarde C C, Morton L H G, Loh K, Shirakawa M A. Biodeterioration ofexternal architectural paint films – A review. International Biodeterioration&Biodegradation. 2011:65. pp.1189-1198.
[16] Chaussadent T. Analyse des mécanismes de carbonatation du béton. 1997. pp. 75-87.
Dalod, Govin ,Guyonnet, Grosseau, Lors and Damidot
[17] Delair S. Etude de l’atténuation des efflorescences sur les matériaux cimentaires au moyen de produits pouzzolaniques. 2008. PhD thesis, Ecole Nationale supérieure des Mines, Saint Etienne, France.
[18] Thiery M. Modélisation de la carbonatation atmosphérique des matériaux cimentaires Prise en compte des effets cinétiques et des modifications microstructurales et hydriques. 2005. PhD thesis, Ecole des Ponts Paristech, Paris, France.
[19] Villain G, Thiery M, Platret G. Measurement methods of carbonation profiles in concrete: Thermogravimetry, chemical analysis and gammadensimetry. Cement and Concrete Research 2007:37. pp. 1182-1192.
[20] Scrivener K L, Capmas A. 13 - Calcium Aluminate Cements. In: Lea’s Chemistry of Cement and Concrete (Fourth Edition). Oxford: Butterworth-Heinemann; 2003.pp.713-782.
[21] Lamberet S. Durability of ternary binders based on Portland cement, calcium aluminate cement and calcium sulfate. 2005. PhD thesis, Ecole Polytechnique Federale de Lausanne, Switzerland.
[22] Gabrovsek R, Vuk T, Kaucic V. The preparation and thermal behaviour of calcium monocarboaluminate. Acta Chim. Slov. 2008. pp 942‑950.
[23] Klemm W A, Berger R L. Accelerated curing of cementitious systems by carbon dioxide: Part I. Portland cement. Cement & Concrete Research. 1972:2. pp. 567-576.
[24] Omikrine Metalssi O, Aït-Mokhtar A, Turcry P, Ruot B. Consequences of carbonation on microstructure and drying shrinkage of a mortar with cellulose ether. Construction and Building Materials. 2012:34. pp. 218-225.
[25] RILEM. Carbonation. Materials and Structures. 1972:5. pp.53-62. [26] Tran TH. Influence des caractéristiques intrinsèques d’un mortier sur son
encrassement biologique. 2011. PhD thesis, Ecole Nationale Supérieure des Mines, Saint Etienne, France.