Influence of Temperature on Light Scattering of poly-N
106
Influence of Temperature on Light Scattering of poly-N- isopropylacrylamide Hydrogels Synthesized by Two Different Cross-Linking Methods Doctoral Thesis Saadet Dogu
Transcript of Influence of Temperature on Light Scattering of poly-N

Influence of Temperature on Light Scattering of poly-N-
isopropylacrylamide Hydrogels Synthesized by Two
Different Cross-Linking Methods
Doctoral Thesis
Saadet Dogu

Influence of Temperature on Light Scattering of poly-N-
isopropylacrylamide Hydrogels Synthesized by Two
Different Cross-Linking Methods
Doctoral Thesis
(Dissertation)
to be awarded the degree of
Doctor rerum naturalium (Dr. rer. nat.)
submitted by
Saadet Dogu
from Üsküdar / Istanbul
approved by the Faculty of Natural and Materials Sciences
Clausthal University of Technology
Date of Oral Examination
18.06.2013

Chair Person of the Board of Examiners: Prof. Dr. D. E. Kaufmann
Chief Reviewer: Prof. Dr. W. Oppermann
Reviewer: PD Dr. J. Adams


Name, Vorname: Datum:
Dogu, Saadet 14.03.2013
EIDESSTATTLICHE ERKLÄRUNG
Hiermit erkläre ich an Eides Statt, dass ich die bei der Fakultät für Natur- und
Materialwissenschaften der Technischen Universität Clausthal eingereichte
Dissertation selbständig und ohne unerlaubte Hilfe verfasst und die benutzten
Hilfsmittel vollständig angegeben habe.
Unterschrift

Part of this thesis was published in:
Dogu, S., Oppermann, W.:
Influence of observation temperature on light scattering of poly-N-
isopropylacrylamide hydrogels, Soft Matter, 2012, 8, 2705-2713.

FOREWORD
I would first like to express my deepest gratitude to my supervisor, Prof. W. Oppermann, for
his precious guidance and support in every aspect of my studies at TU-Clausthal. I also thank
to PD Dr. J. Adams for reviewing my thesis, his helps and nice advices during my study.
I am grateful to Dr. A. Langhoff for his excellent and endless help and patience in this work. I
thank to the secretary, Andrea Kornhardt, for her willingness to help at all the times. Further I
would like to thank to former and current people at the Institute of Physical Chemistry at
Clausthal University of Technology for the cheerful atmosphere.
I want to thank to Dr. S. Grube, Dr. M. Susoff, Dr. A. Langhoff and Volkan Can for
proofreading of this manuscript.
I am deeply grateful to Volkan Can for his willingness to provide help, support, interesting
discussions and friendship during the study.
I appreciate the encouragements and strong friendship from Ayse Ertekin during my study. I
also thank to all my friends that support me during this study.
Special thanks go to Dr. M. Susoff who has always been with me during my Ph.D. study. His
endless support, advice, help and encouragement were always with me to overcome the
difficulties during the study.
I gratefully acknowledge financial support received from the German Research Foundation
(DFG) through my Ph.D. study.
Finally I would like to express my appreciation to my family for their love, endless support
and patience in every stage of my life.

TABLE OF CONTENTS
1 Introduction ........................................................................................................................... 1
2 Theoretical Background ....................................................................................................... 4
2.1 Polymer Solutions ............................................................................................................. 4
2.1.1 The semi-dilute regime .............................................................................................. 6
2.1.2 Thermodynamics of Polymer Solutions ..................................................................... 7
2.1.2.1 PNIPA as Thermo-Responsive Polymer ............................................................... 10
2.2 Polymer Gels .................................................................................................................. 12
2.2.1 Fundamentals ........................................................................................................... 12
2.2.2 Theory of Gelation ................................................................................................... 14
2.2.3 Theory of Rubber Elasticity ..................................................................................... 15
2.2.4 Structural Inhomogeneity ......................................................................................... 18
2.2.4.1 Spatial Inhomogeneity in Free Radical Cross-linking Gels .................................. 19
2.2.4.2 Photo Cross-linking Polymerization to Obtain More Homogeneous Gels ........... 20
2.2.5 Photo Cross-linkable Matrix .................................................................................... 21
2.2.5.1 Photo Chemical [2+2]-Cycloaddition ................................................................... 22
3 Methods ................................................................................................................................ 24
3.1 Light Scattering .............................................................................................................. 24
3.1.1 Static Light Scattering .............................................................................................. 25
3.1.2 Dynamic Light Scattering ........................................................................................ 28
3.1.2.1 Non-Ergodic Method ............................................................................................ 31
3.1.2.2 Partial Heterodyne Method ................................................................................... 34
3.2 Rheology ......................................................................................................................... 36
3.2.1 Introduction .............................................................................................................. 36
3.2.2 Viscoelastic Behavior of Polymer Gels ................................................................... 36
4 Experimental Section .......................................................................................................... 40
4.1 Substances ...................................................................................................................... 40
4.1.1 Compounds used for Free Radical Cross-linking Copolymerization ...................... 40
4.1.2 Compounds used for Photo Cross-linking Polymerization ...................................... 41
4.1.2.1 Synthesis of DMMIAAm ...................................................................................... 41
4.1.2.2 Copolymerization of NIPA with DMMIAAm ...................................................... 42
4.1.2.3 Sodium thioxanthone-2,7-disulfonate (TXS) ........................................................ 43
4.2 Preparation of Hydrogels ............................................................................................... 44
4.2.1 Free Radical Cross-linking Copolymerization ......................................................... 44
4.2.2 Photo Cross-linking Polymerization ........................................................................ 45
4.3 Characterization ............................................................................................................. 47
4.3.1 UV-VIS Measurements ............................................................................................ 47
4.3.2 Viscosimetry Measurements .................................................................................... 48
4.3.3 NMR Measurements ................................................................................................ 48

4.4 Light Scattering Measurements ...................................................................................... 49
4.5 Rheological Measurements ............................................................................................. 50
5 Results and Discussion ........................................................................................................ 51
5.1 Free Radical Cross-linking Hydrogels ........................................................................... 51
5.1.1 Mechanical Properties .............................................................................................. 51
5.1.2 Microstructure .......................................................................................................... 53
5.1.2.1 Static Light Scattering ........................................................................................... 54
5.1.2.2 Dynamic Light Scattering ..................................................................................... 55
5.1.3 Summary .................................................................................................................. 64
5.2 Comparison of FRC Gels with PC Gels by Scattering Methods .................................... 65
5.2.1 LCST of PNIPA solutions and PNIPA gels ............................................................. 66
5.2.2 Macroscopic Properties ............................................................................................ 67
5.2.3 Light Scattering Measurements ............................................................................... 70
5.2.3.1 Dynamic Light Scattering ..................................................................................... 70
5.2.3.2 Static Light Scattering ........................................................................................... 76
5.2.3.3 Data Evaluation ..................................................................................................... 78
5.2.3.4 Comparison of DLS and SLS of the FRC and PC gels ......................................... 80
5.2.3.5 Inhomogeneity of Polymer Solutions ................................................................... 82
5.2.3.6 Influence of Observation Temperature on Correlation Length ............................. 83
6 Summary and Conclusion .................................................................................................. 85
7 References ............................................................................................................................ 88

Introduction
1
1 Introduction
Polymer gels are cross-linked systems composed of polymer networks and solvent. Since they
have many practical applications such as in contact lenses, super absorbents, tissue
engineering, drug delivery systems, sensors and actuators etc. many research groups
concentrate on characterizing them and improving their properties.
It is well established that polymer gels generally possess some kind of structure on length
scales larger than the mesh size of the network. This is due to an uneven topological or spatial
distribution of cross-links and, accordingly, polymer concentration, commonly referred to as
spatial gel inhomogeneity and can be caused by cyclization reactions, micro-gel formation
during preparation, differences between the reactivities of functional groups, and diffusion
controlled reactions [1,2]. Although it is of considerable interest and attempts to attain
detailed insight have been ongoing for decades, it is still not fully understood. Light scattering
and neutron scattering techniques are most frequently applied to investigate the structure and,
in particular, the spatial inhomogeneities in gels. In the light scattering regime (low q-range,
q << 0.1 nm-1
), the scattering intensity from gels is generally markedly larger than that from a
corresponding polymer solution, while the differences between gel and solution diminish
significantly in the higher q-range (q >> 0.1 nm-1
) covered by small angle neutron scattering.
The excess scattering is related to spatial inhomogeneity, and a number of theoretical
approaches or models have been proposed for its interpretation [3-11]. Another manifestation
of the inhomogeneity is the appearance of a speckle pattern when a gel is illuminated with
coherent light. In dynamic light scattering experiments, it is then observed that different
locations within a gel scatter differently [12-16]. Procedures to divide the total scattering
intensity into two parts originating from thermal concentration fluctuations and from spatial
network heterogeneity were developed in the early 90s [15,17].
Poly-N-isopropylacrylamide (PNIPA) is a well-suited model substance to form polymer gels,
in which heterogeneity can easily be influenced. PNIPA in water forms a temperature
sensitive polymer-solvent system with a lower critical solution temperature (LCST) around
33 °C. It is the prime example of a stimuli-responsive polymer, and an extensive literature
exists covering studies of, e.g., its phase behavior, [18-20] its potential in creating
‘‘intelligent’’ materials or devices, [21-23] etc. Likewise, investigations on PNIPA gels by
scattering methods are numerous. SHIBAYAMA et al. demonstrated that the spatial
inhomogeneities increased with raising cross-link concentration and with raising preparation

Introduction
2
temperature of the gels [24]. They also showed that the ensemble-average light scattering
intensity increased when the gels were swollen, while the fluctuating part of the scattering
intensity seemed to decrease upon swelling [25]. The same group studied the effect of
pressure at gel preparation, [26,27] and they explored the influence of weak ionization of the
polymer on the structure factor [28-30]. WU et al. studied the properties of PNIPA hybrid gels
formed when a sufficiently concentrated dispersion of micro-gels was cooled from
temperatures above the LCST to below the LCST [31,32]. Their light scattering investigations
showed that the static scattering component of the macroscopic gel attained by close-packing
of the swollen micro-gel particles was due to large voids. These could be avoided when the
temperature change occurred very slowly [31].
Although there have been many studies about PNIPA gels, researchs focusing on a detailed
inspection of the dependence of scattering behavior on the observation temperature in the one-
phase region, below the LCST, are rather scarce. The main emphasis was focused on a study
of the critical behavior and the collapse. Already in 1994, TANAKA et al. pointed out that the
static spatial fluctuations reversibly increased with raising temperature and diverged at the
spinodal line [13]. This statement was applied to measurements close to the LCST
(T > 25 °C), while data at lower temperatures were somewhat ambiguous. Later, SHIBAYAMA
et al. confirmed the observation that the static (frozen-in) and the fluctuating (thermal) part of
light scattering intensity, as well as the cooperative diffusion coefficient, are strongly
dependent on the observation temperature [14]. While this was expected for the latter two
quantities, the authors concluded that there must be a strong coupling between static and
fluctuating components. KOIZUMI et al. deduced from neutron scattering and spin echo data
that, as the temperature was raised towards the LCST, the static scattering intensity increased
more rapidly than the thermal component [33]. They explained this behavior via the excluded
volume parameter in the PANYUKOV RABIN theory, even though the theory was derived for
gels made by instantaneous cross-linking of semi-dilute polymer solutions, which does not
apply to the PNIPA gels studied.
The first part of the present study aims at a careful inspection of the influence of temperature
on the static and thermal scattering components of PNIPA gels synthesized by free radical
cross-linking copolymerization, FRC, in the range 10-27.5 °C, i.e. below LCST by means of
static and dynamic light scattering methods. It is expected to obtain PNIPA gels which are
reversible with the temperature changes. Specifically, for a gel synthesized at 25 °C, light
scattering measurements were performed at 25, 20, 15, 10, 12.5, 17.5, and 27.5 °C (in that
Introduction
3
sequence) in order to verify that the scattering properties are fully reversible with regard to a
temperature variation within the range studied. Obviously, the thermal scattering should raise
when the LCST is approached from lower temperatures. The dependence of the static
scattering on temperature is not so clear and the few literature data diverge to some extent. In
order to extract the excess part from dynamic light scattering experiments, the non-ergodic
[15-17] and partial heterodyne [34-38] approaches were applied, thus separating the
contributions of the dynamic or thermal concentration fluctuations and of the static
inhomogeneities to the total scattering intensity. The much simpler approach based on static
scattering is also used for comparison. It will be shown that both dynamic light scattering
(DLS) and static light scattering (SLS) methods agree very well and that the static scattering
varies with temperature to the same degree or slightly stronger than the thermal scattering.
Many studies have shown that structures of networks obtained by FRC generally seem to be
inhomogeneous in the q-range << 0.1 nm-1
. An alternative approach to obtain homogeneous
gels is UV induced photo cross-linking polymerization, PC. Cross-links are expected to be
introduced randomly in space for photo cross-linked gels.
The purpose of the second part of this study is to compare network structures i.e.
inhomogeneity, of the free radical cross-linking PNIPA gels (FRC gels)
prepared at 25 °C to photo gels (PC gels) synthesized by photo
cross-linking polymerization of (N-isopropylacrylamid)-2-(dimethylmaleimido)-N-ethyl-
acrylamide, poly(NIPA-co-DMMIAAm) at observation temperatures 25, 20, 15, 10, 30 °C (in
that sequence). It is expected that photo gels starting from semi-dilute polymer solution are
more homogenous than free radical gels prepared by free radical cross-linking
copolymerization starting from monomers and cross-linkers.

Methods
4
2 Theoretical Background
2.1 Polymer Solutions
For a given polymer, there are solvents that dissolve the polymer and solvents that do not
dissolve the polymer . The former solvents are called “good solvents” and the latter “non-
solvent”. Monomer-monomer interactions are replaced by monomer-solvent interactions in a
situation that polymer dissolves in a good solvent. As a result, the polymer coils swell and
large excluded volume appears. By contrast, poor solvents cause coil-shrinkage leading to
phase separation in order to enhance monomer-monomer interactions. The theta ()
conditions occur at a particular temperature known as the theta or FLORY temperature
T = Under theta conditions the dilute solution behaves as an ideal solution and the polymer
coil has its ideal unperturbed conformation. A solvent that gives the theta condition of a given
polymer is called a theta solvent, e.g., PNIPA in water at LCST (33 °C). Coils at -conditions
exhibit their ideal unperturbed random conformations, and -solvents stay in a transition
region between good and poor solvents.
There are several characteristic measures for the coil dimensions in solution, e.g., the
hydrodynamic radius, RH, the end to end distance, < r2
>0.5
, or the radius of gyration, RG, as
shown in Figure 1. FLORYHUGGINS interaction parameters [39,40] and the HILDEBRAND
solubility parameters [41] are among the most common parameters that give the effective
interaction potentials between solvents and polymer chains.
Polymer solutions can be divided into three different regimes according to their concentration:
the dilute, the semi-dilute and the concentrated solutions [42]. A schematic illustration of the
state of polymer molecules in the solutions with different polymer concentrations is given in
Figure 1. At low concentrations, c < c*, the polymer coils are separated from each other and
behave more or less independently. The solution is called dilute. The polymer chains occupy a
certain amount of space in the solution. If the concentration of polymer coils increases to a
critical concentration they fill the whole volume and start to interpenetrate each other. This
concentration is called the critical overlap concentration, c* (Fig. 1, c c*). At this overlap
threshold the coils begin to be densely packed. The properties of the polymer solution change
at concentrations above c*. The solution in this regime is called semi-dilute. At this
concentration, chains are overlapped and entangled. Their mobility is greatly reduced
compared to dilute solutions.

Methods
5
R ~ RG H
<r >2 0.5
c < c* c c* c > c*
Figure 1 Concentration regimes for solutions of linear flexible polymers: dilute solution, c < c*;
solution at the overlap concentration c c*; semi-dilute solution c > c*. Adapted from [42].
There are several descriptions that have been reported for the overlap threshold, c* [43,44],
e.g.
A
3
G
w
4
3*
NR
Mc
(1)
and
][
1*
c (2)
where Mw is the weight average molecular weight, RG the radius of gyration, NA the Avogadro
number, and [] the intrinsic viscosity, which is explained below.
The intrinsic viscosity, [], is a quantity that is characteristic of polymers. It represents an
increase in the solution viscosity when the concentration is raised to a certain level. It is
expressed by the MARKHOUWINKSAKURADA equation.
α][ KM
The parameter K is a constant and is the so-called MARKHOUWINKSAKURADA exponent.
The exponents are different from polymer to polymer and depend on the solvents as well.
They are tabulated for many pairs of polymers and solvents [45]. The value of is around
0.7-0.8 for flexible chains in a good solvent and exceeds unity for rigid chains. In the theta
solvent, the flexible chain has

Methods
6
2.1.1 The semi-dilute regime
In semi-dilute solutions, the chains are congested and highly overlapping with other chains as
shown in Figure 1. The blob model is widely used to predict various properties of semi-dilute
solutions and to find out how these properties depend on the concentration and molar mass of
polymers. In dilute solutions, the single chain dynamics which involve all the interactions,
such as excluded volume and hydrodynamic interactions, are referred to all monomers in the
same chain. However, in semi-dilute solutions, interactions between monomers of different
chains come into effect. In semi-dilute polymer solutions, the intermolecularly and
intramolecularly coupled many chain dynamics can be renormalized into independent
motions. These independent motions are described by so-called blobs depicted in Figure 2b.
correlation bloba) b)
Figure 2 a) the average mesh size, , in an entangled semi-dilute solution, b) a polymer chain
with so-called blobs, being the correlation length. Adapted from [42].
Physically, the blobs can be treated as spheres of size of the correlation length, , as shown in
Figure 2b. Inside the blob, dynamic behavior resembles the single chain dynamics. The sites
of interactions between different chains are called the entanglement points. There is only a
small chance for monomers of other chains to sneak in. In this way, the entire solution can be
regarded as to be filled up with blobs.
A characteristic parameter for the average mesh size in an entangled semi-dilute solution is
the correlation length, , (Fig. 2a). DE GENNES and EDWARDS have shown that in semi-dilute
solutions, the correlation length, , scales as the average distance between interchain contacts
(Fig. 2a) [42,46]. If cross-linking occurs in these interchain contacts to form a gel,also
describes the mesh size of the gel network. At the overlap concentration, (c ≈ c*), coils have
contact but not strongly interpenetrate each other. At this regime can be compared to the

Methods
7
size of one coil as measured by the radius of gyration, RG. The correlation length in a semi-
dilute solution (c > c*) decreases with increasing amount of coil overlap as given by eq. 4
[42]
1v3
v
is the volume fraction of the polymer and is the FLORY exponent [40]. The scaling
assumption suggests that the functional dependence of correlation length, , on concentration,
c, is universal if c is properly scaled to a fundamental scale which is assumed to be the
overlap concentration, c*. Consider that approaches RG at c*, therefore
γ
G )/*( ccR (5)
where γ = 0.75, = 0.6 in a good solvent, and γ = 1, = 0.5 in -solvents.
The scaling theory clearly shows that the blob size is closely related to the correlation length
2.1.2 Thermodynamics of Polymer Solutions [47]
Mixtures are systems that are formed by two or more different chemical species. Binary
mixtures consist of only two different species. If the mixture is uniform and all components
are mixed on a molecular scale, the mixture is called homogeneous. If the mixture has
different phases, it is called heterogeneous. Both types of mixtures in the equilibrium state
have a dependency on entropy and energy changes during mixing. While entropy always
favours mixing, energetic interactions between species can either promote or inhibit mixing.
In general, two species will mix if the GIBBS energy, G, is decreased.
mixmixmix STHG (6)

Methods
8
∆Hmix is the enthalpy of mixing and mixS is the entropy of mixing. If ∆Gmix < 0 the polymer
will dissolve in the solvent and form a solution. As in most experimental situations the
pressure is constant, the energy of binary mixing is described by using the enthalpic
interactions. In the FLORY-HUGGINS theory it is assumed that there is no volume change on
mixing, hence instead of analyzing the enthalpic interactions, the energy of interactions are
used to describe the energy of mixing by the change of the Helmholtz free energy of mixing
F.
mixmixmix STUF (7)
Volume VA of species A is mixed with volume VB of species B to make a mixture of volume
VA+VB. The volume fractions of the two components in the binary mixture are A and B
BA
AA
VV
V
, A
BA
BB 1
VV
V
(8)
he entropy, S, can be calculated from the BOLTZMANN equation
lnBkS (9)
kB is the BOLTZMANN constant with natural logarithm of the number of possibilities to
arrange molecules on the lattice (FLORYHUGGINS theory).

Methods
9
For the polymer solution entropy is given as
BBA
Amix lnln
NkS (10)
with the degree of polymerization.
The FLORY interaction parameter is defined to characterize the difference of interaction
energies in the mixture (eq. 11).
kT
uuuz BBAAAB2
2
(11)
uAA, uBB, uAB are the interaction energies between adjacent lattice sites occupied by the two
species, z is the coordination number, the number of nearest neighbors for a lattice site, each
one occupied by one chain segment or a solvent molecule. is a dimensionless measure of the
differences in the strength of pairwise interaction energies between species in a mixture. Thus
the energy of mixing is given by eq. 12.
kTU 1mix (12)
Combining the entropy of mixing (eq.10) with the energy of mixing (eq.12), HELMHOLTZ free
energy of mixing is obtained for polymer solutions (eq. 13).
mixmixmix STUF
)1()1ln()1(ln
NkT
This equation is called the FLORYHUGGINS equation. The interaction parameter is used to
indicate whether a solvent is good or poor for the polymer. A good solvent has a low value of
Methods
10
0.5while a poor solvent has a high value of 0.5Since theta solvents lie in the
transition region between good and poor solvents, the interaction parameter = 0.5. In good
solvents, the polymer network chains are in the extended conformation due to the strong
molecular interaction between polymer and the solvent. A positive denotes that the
polymer-solvent contacts are less favored compared to the polymer-polymer and the solvent-
solvent contacts. A negative means that polymer-solvent contacts are preferred, promoting
solvation of the polymer.
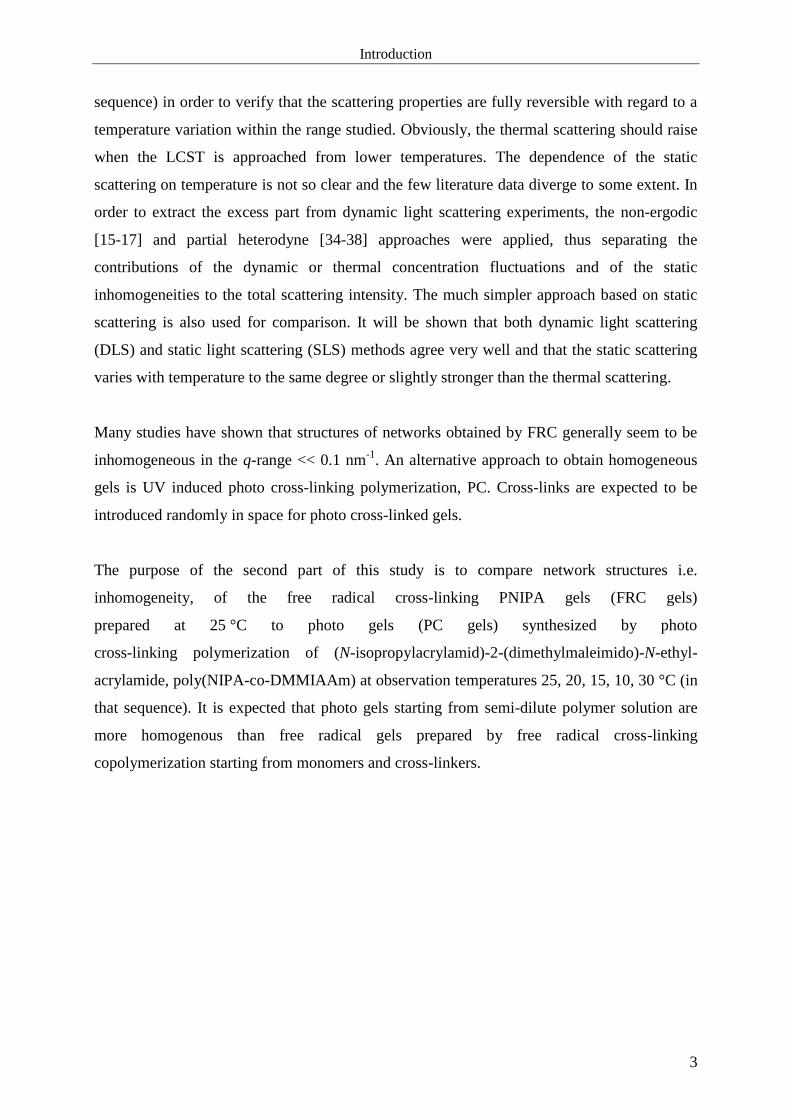
2.1.2.1 PNIPA as Thermo-Responsive Polymer
Thermo-responsive polymers are the most common smart polymers applied to responsive
systems like actuators and valves in vitro as well as in vivo in biomedical applications.
Thermo-responsive polymers in solution possess a unique critical solution temperature. If a
thermo-responsive polymer solution is miscible below the critical temperature and is phase-
separated above the critical temperature, the critical temperature is called a lower critical
solution temperature (LCST) of the polymer. On the other hand, if a miscible solution exists
above the critical temperature and the solution is phase-separated below the critical
temperature, it is an upper critical solution temperature (UCST) [48].
Since PNIPA was first synthesized in the 1950s, it has been studied and utilized as the most
common intelligent polymer. PNIPA exhibits a volume phase transition at the LCST around
33 °C [49-54]. Below its LCST, this thermo-responsive polymer is hydrated and represents a
swollen coil-like conformation. Above the LCST, it becomes dehydrated and adopts a folded
structure. The structure of PNIPA is shown in Figure 3. Its thermo-responsiveness is thought
to be resulting from the presence of the hydrophobic carbon backbone, a hydrophobic
isopropyl group and a hydrophilic amide group along the side chain in each monomer unit.
Figure 3 Chemical structure of Poly-N-isopropylacrylamide, PNIPA.

Methods
11
The research on temperature dependent interactions between PNIPA and water revealed the
possible mechanisms for the PNIPA’s LCST phase transition or the hydrophobic-hydrophilic
transition. It is generally thought that entropy is the driving force for the LCST phase
transition in aqueous solution [55-61]. When temperature is below its LCST, the enthalpic
contribution including hydrogen-bonding interactions between the amide groups on PNIPA
and water dominates so that PNIPA possesses a hydrophilic coil-like conformation. However,
when the temperature is above its LCST, the solvation entropy of the hydrophobic isopropyl
groups and the carbon backbone dominates and PNIPA exhibits a hydrophobic folded
structure.

Methods
12
2.2 Polymer Gels
2.2.1 Fundamentals
Gels are three-dimensional macroscopic polymer networks that are swollen in a solvent. They
are formed by linear polymer strands which are flexibly connected by cross-linking points. A
gel cannot dissolve in a solvent, but swell in it. Gels have the ability to reversibly swell or
shrink (up to a factor 1000 in volume) because of small changes in their environment (pH,
temperature, electric field). Due to these properties they are used in particular as
superabsorbents, sensors and actuators. In contrast to liquids, gels possess a non-zero shear
modulus that means, they are not able to flow. The mechanical properties of gels correspond
to those of solids although they have a disordered structure, and usually a large amount of
solvent. They can be described by the theory of rubber elasticity [47,62].
According to the nature of the cross-links connecting the network strands, gels are divided
into two classes; chemical and physical gels. Different types of gelation are gathered in
Figure 4.
Figure 4 Scheme for the classification of gelation transitions. Adapted from RUBINSTEIN [47].
Gels from physical networks have only intramolecular covalent bonds. Since the
intermolecular bond is not covalent they can break or re-bond by changes in thermodynamic
parameters. It is useful to distinguish between strong and weak physical gels. Strong physical
gels that are effectively permanent can be formed if the polymer chains partially crystallize
Gelation
Physical Chemical
Weak Strong Reacting
monomers
Cross-linking
polymers
(vulcanization)
Polycondensation Radical
Polymerization
End-
linking
Random
cross-linking

Methods
13
[63,64], form micelles [65,66] or helical structures [67,68]. They are analogous to chemical
gels, e.g., thermoplastic elastomers, e.g., thermoplastic polyurethanes. In contrast weak
physical gelation arises due to the hydrogen bonding, formation of block copolymer micelles
above their glass transition temperature, and ionic associations which have finite lifetimes,
breaking and reforming continuously. Whether a physical gel is strong or weak depends only
on the observation time [47,62].
Chemical gels are created when monomers form permanent covalent bonds which irreversibly
connect the network chains. They always result in a strong gel. There are three main chemical
gelation processes:
condensation; by step growth polymerization of multifunctional monomers,
vulcanization; by cross-linking of long linear chains,
addition polymerization; by free radical cross-linking chain reactions.
In this study addition polymerization and vulcanization are employed for cross-linking.
Figure 5 shows a type of vulcanization (random cross-linking) and addition polymerization.
a
b
Figure 5 Vulcanization of polymers (a) and addition polymerization (b); X shows cross-linker, \
shows monomer and shows initiator.

Methods
14
2.2.2 Theory of Gelation
To describe the sol-gel transition, some models have been developed such as mean field
gelation, critical percolation theory and scaling model theory. All theories are well described
in the literature [47]. The sol-gel transition is described here by the critical percolation model
since the reacting structures are just at overlap.
At the percolation threshold or gel point, pc, the system undergoes a connectivity transition.
Shortly before the gel point, the system is a polydisperse mixture of branched polymers.
Shortly after reaching the gel point, the system still has a large proportion of polydisperse
branched polymers, but one structure percolates through the entire system thus forming a
coherent structure. This is the initial gel fraction in which an infinite cluster of bonded
monomers is formed and spans the whole lattice from side to side. Since bonds are randomly
formed between monomers, intramolecular bonding is allowed. The gel fraction can be
regarded as an order parameter for the entire gelation process. The growth of the gel fraction
is accompanied by a simultaneous decay of the sol fraction, beyond the gel point, pc. The sol-
gel transition is very similar to a continuous phase transition. While the bond formation is
continous, the macroscopic properties, e.g., the rheological behavior, change in an abrupt
manner. This gelation process is described by the percolation theory [47,62].
The classical theory from FLORY and STOCKMAYER assumes a mean-field approach of the
gelation process. The whole gelation is seen as a branching process of multifunctional
monomers. It is assumed that this branching takes place on an infinite Bethe lattice with
monomers possessing a functionality of f. This lattice is also called “CAYLEY tree”. In this
classical model, loops that are formed by intramolecular cross-linking are not considered. The
gel point is reached in this model at a critical conversion, pc. The prediction for the gel point
is [47,62] given by eq. 14.
(14)
This equation is applicable to step-growth polymerization. If one assumes the functionality of
the cross-linker, f = 4, the gelation point, pc, is reached at a conversion 0.33%. While the
number average molecular weight does not diverge at the critical conversion, pc, the weight
average molecular weight goes infinity.
1
1
fpC

Methods
15
In the cross-linking of long linear polymer chains with the degree of polymerization, N0, a
very high number of cross-linkable group functionality f can be set equal with the degree of
polymerization. This applies for example to the vulcanization process of rubber with sulphur
according to GOODYEAR’s famous process which can be described by mean-field theory. It is
applied to the gel point in the following relationship
0
C
1
1
1
Nfp
10 N
(15)
The gel point corresponds to an average of one cross-link per chain.
2.2.3 Theory of Rubber Elasticity
Rubbers are cross-linked networks whose glass transition and melting temperature are below
room temperature. They have a lot of applications like rubber bands, adhesives and tires.
Their outstanding properties are due to the entropic nature of rubber elasticity [47,62]. The
macroscopic mechanical properties of those rubbers are described by the theory of rubber
elasticity. There exist two fundamental network models based on mean-field approaches
relating the molecular and macroscopic strain-stress behavior: a) the affine network model, b)
the phantom network model. These models use the analogy between the elastic properties of
an ideal GAUSSIAN chain and a classical elastic spring to calculate the overall network free
energy F.
The main assumption of the affine network theory is that the cross-link junction points move
affinely with macroscopic deformation. The fluctuation of the junction points about their
mean positions is restricted by the neighboring chains sharing the same region of space.
Summing up the entropy changes of all network strands during deformation yields the overall
entropy change of the entire network. This entropy change is calculated as follows
)3(2
z2
y2
x2B
nkS (16)
withxy and z the relative deformations in x-, y-, and z-direction, and kB the BOLTZMANN
constant, n the number of elastically effective network strands.

Methods
16
In the case of an uniaxial deformation in x-direction the entropy change is calculated with the
following equation (eq. 17).
)32
(2
2B
nk
S (17)
As the main contribution to the free energy is due to entropic changes, the enthalpic
contributions can be ignored. The change in free energy, ∆F, due to a uniaxial deformation is
thus calculated by
)32
(2
2B
Tnk
STF (18)
From the stress, , defined as the ratio of force and cross-sectional area, and deformation, ,
the shear modulus, G, is obtained. It follows the important relation [47,62]
S
BB
M
RTTvk
V
TnkG
(19)
with number of network strands per unit volume, Ms the average molecular weight of the
strands, the network density (mass per unit volume) and R the gas constant. It can be seen
that the shear modulus depends on temperature and the number of network chains. The
modulus G equals kBT per network strand. This equation relates the elastic property of each
network chain to the macroscopic mechanical behavior of the whole network.
Another model in the field of rubber elasticity is the phantom network theory. In contrast to
the affine network model, the phantom network theory allows fluctuations of the junction
points around their mean position due to Brownian motion. The cross-links can move freely
and the chains can pass through each other. Hence, the phantom network model is a more
realistic approach than the affine network model. The fluctuations of the junction points lead
to a net decrease of the free energy of the system by reducing the cumulative stretching of the
network. The shear modulus for the phantom network model is calculated from the equation

Methods
17
of the affine network model by adding a factor that contains the functionality f of the cross-
linking points
)2
1(2
S
BfM
RT
f
fTvkG
(20)
So, the enabling of fluctuations of the junction points lead to a lowered shear modulus of the
gel by a factor of (1-2/f). Compared to the affine network model, gels described by the
phantom network model are softer because of a lower G. If the functionality f is increasing or
even goes to infinity, the prediction of the affine network model is reached.
For real networks, the shear modulus is normally higher than that predicted by the phantom
and the affine network model. In these classical models, the monomers other than chain ends
do not feel any restriction potential. However, real networks show that the network chains
impose topological constraints because they cannot penetrate each other. These topological
constraints are called entanglements implemented by EDWARDS using the tube model as the
essence of those entanglements. The modulus of the entangled polymer network is calculated
by summing the contributions arising from the cross-links, Gx, and the contributions arising
from the entanglements, Ge, [47].
ex
ex
11
MMRTGGG
(21)
with Mx the molecular mass between cross-links and Me the molecular mass between
entanglements. In the case of networks with very short chains (Mx < Me), G is dominated by
permanent cross-links. But it is almost independent of the molecular mass of the network
strands between cross-links in the case of high molecular mass strands between cross-links in
the limit of very long strands (Mx > Me).

Methods
18
2.2.4 Structural Inhomogeneity
In the phantom network and the affine network models only network chains that run between
cross-linking points are considered as elastically active and therefore they can change their
conformation by the outer dimensions of the network. Chain segments which are connected to
only one point of the network are considered as inactive network chains. They are called
network malfunctions. These topological network defects include loops and dangling chains
as shown in Figure 6.
.
Figure 6 Network (f = 4) with topological network defects (loops and dangling chains).
Polymer gels are generally spatially inhomogenous, as well [69]. In these cases the
concentrations of network chains and junctions points are non-uniform. They exhibit an
inhomogeneous cross-link density distribution known as spatial gel inhomogeneity [3,69].
Figure 7 shows a schematic representation of an ideal gel and a spatially inhomogeneous real
gel. In ideal gels, the length of network chains between the cross-links is constant and all the
cross-linker molecules are consumed by effective cross-linking reactions. However, real gels
exhibit a wide distribution of chain lengths between the network junction points. There are
areas that possess a very high chain density, other areas that possess low network chain
density. The areas that have a high network chain density are quite stiff and therefore exhibit a
higher shear modulus and a lower degree of swelling compared to ideal gels [5]. They can
resist relatively high stresses under deformation. The regions that have low network chain
density are much less stiff and highly swellable. They are not strong enough to resist high
stresses under deformation. Hence, regarding deformation, these sections are weak points of

Methods
19
spatially inhomogeneous gels [70]. As a result concerning application, it may be therefore
desirable to obtain a gel that is as homogenous as possible.
Figure 7 Schematic representation of a homogenous ideal gel (left hand side) and a spatially
inhomogenous real gel (right hand side).
The spatial inhomogeneity is widely investigated through a number of modern analytical
techniques such as small angle neutron scattering (SANS), small angle X-ray scattering
(SAXS), nuclear magnetic resonance (NMR), dynamic light scattering (DLS) and static light
scattering (SLS) [3,5,69,71-73]. In this study, DLS and SLS are used to analyze the structure
of hydrogels (chapter 3.1).
2.2.4.1 Spatial Inhomogeneity in Free Radical Cross-linking Gels
The existence of spatial inhomogeneities on sub-micrometer scales in hydrogels is mainly a
result of the gel formation mechanism by free radical cross-linking copolymerization, FRC,
i.e. a monovinyl monomer (repeating unit) with a divinyl monomer (cross-linker). The
different reactivities of the functional groups lead to different morphologies of the networks.
If the reactivity of cross-linker is greater than that of monomer, the reaction of the vinyl
groups of the cross-linker is preferred. Additionally, the probability of the reaction with the
cross-linker is higher due to the fact that every cross-linker molecule carries at least two vinyl
groups. Thus the growing chains in the pre-gel stage are rich in cross-linker units. As a
consequence of this unequal vinyl group reactivity, the cross-link density of gels fluctuates.
The computer simulations made by SCHRÖDER and OPPERMANN also showed that there is an
influence of the cross-linker reactivity on the extent of the concentration fluctuations in gels
[74].

Methods
20
During the FRC, cyclization reactions occur when the macroradical attacks the pendant vinyl
groups in the same kinetic chain. The cyclization reactions, which predominate in the early
stage of polymerization, increase as the dilution increases or as the cross-linker concentration
increases. The cycles formed due to the cyclization are elastically ineffective intramolecular
links and therefore, they reduce the effective cross-link density of gels [1,75,76].
The solvent quality also affects the spatial inhomogeneity. The spatial inhomogeneity of a gel
increases as the solvent quality decreases. If the polymer-solvent interaction is good during
cross-linking, pendant vinyl groups will be found more difficult by radicals due to the
thermodynamic excluded volume effect. Thus, the presence of larger coils in the
polymerization system will reduce the cross-linking and multiple cross-linking reactions. If
the polymer-solvent interaction is poor, the chains will coil more than stretch out, and the
probability of cross-linking and multiple cross-linking is greater due to increased proximity of
the pendant double bonds. As a result, a decrease of the solvent quality during the formation
increases both the elastic and the spatial inhomogeneity of gels [77, 78].
2.2.4.2 Photo Cross-linking Polymerization to Obtain More Homogeneous Gels [163]
In this study, gels were also synthesized by the photo cross-linking polymerization, PC, as an
alternative method to the free radical cross-linking copolymerization, FRC. PC gels are
formed by using functionalized linear polymers, i.e. N-(N’-Acryloyl-2-aminoethyl)-
dimethyl maleimide (DMMIAAm). In this method cross-linking occurs gradually so that a
higher control of reaction can be achieved. This method is called “random cross-linking” and
has the following advantages compared to the free radical cross-linking copolymerization:
- improved control of critical conversion and gelation time.
- adjusting a desired viscosity of the system before cross-linking reaction.
- easy to introduce certain functionalites into the network.
- Spatially more homogeneous gels are formed in the case of random cross-linking when
compared to free radical cross-linking copolymerization [81,82].
Photo chemical cross-linking reactions represent a perceptive method to obtain polymer gels.
There are several examples in the literature about photo chemically synthesized gels and
networks. Cinnamates were employed by PROCTOR et al. [83]. JONES et al. carried out
Methods
21
photochemical cross-linking by the dimerization reaction of anthracene units of copolymers
consisting of poly(ethylene terephthalate) and 2,6-anthracenedicarbocxlate [84]. WOLFF and
SCHINNER used photo chemical dimerization of indenes [85-87]. KUZNETSOVA et al. and NGAI
et al. synthesized polymeric precursors with coumarins for photo cross-linking [88,89].
SUSOFF employed sensitized photo cross-linking for functionalized poly(styrene-co-
aminomethyl styrene) gels which resulted in highly homogenous gels [90].
ZWEIFEL, KUCKLING, GANSEL and SEIFFERT describe the [2+2] cycloaddition of dimethyl
maleimide to form permanent network knots [91-96]. The photo chemical cross-linking of
functionalized PNIPA using [2+2] cycloaddition of dimethyl maleimide such as Poly(N-
isopropylacrylamide-co-dimethylmaleimido acrylamide) poly(NIPA-co-DMMIAAm) is used
in this study to generate PNIPA gels. The synthesis of PNIPA gels by means of photo cross-
linking is described in the literature [97].
In this work, the photo cross-linking of poly(NIPA-co-DMMIAAm) is used in the presence of
thioxanthone in water to gradually synthesize PNIPA gels (chapter 4.2.2).
2.2.5 Photo Cross-linkable Matrix [98]
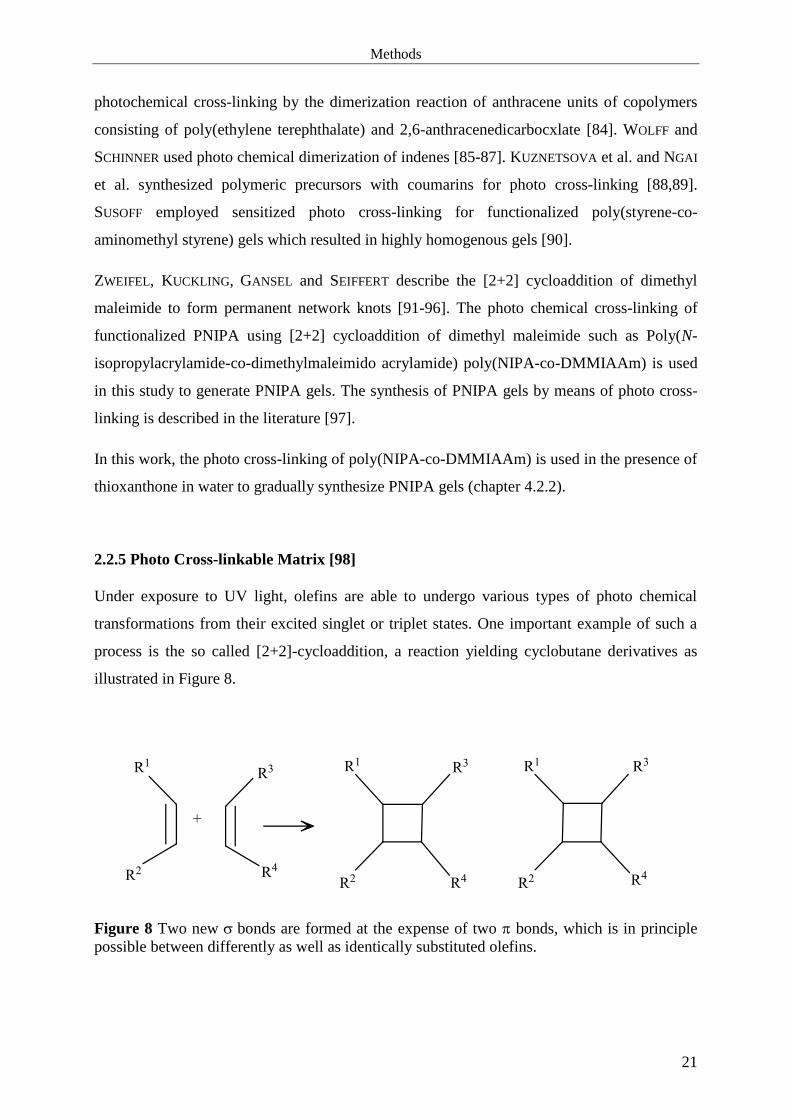
Under exposure to UV light, olefins are able to undergo various types of photo chemical
transformations from their excited singlet or triplet states. One important example of such a
process is the so called [2+2]-cycloaddition, a reaction yielding cyclobutane derivatives as
illustrated in Figure 8.
Figure 8 Two new bonds are formed at the expense of two bonds, which is in principle
possible between differently as well as identically substituted olefins.
Methods
22
Suitable groups which undergo photo dimerization and can therefore be used for photo cross-
linking of accordingly functionalized polymers, e.g., comprising cinnamate (and related)
moieties [99-105], coumarins [-], and maleic acid derivatives like dimethyl maleimide
(DMMI) [110-115]. One of the major drawbacks of cinnamates, besides advantageous
features such as controlled reversibility of the dimerization [104], is the photo chemically
induced cis / trans isomerization resulting in a noticeable decrease of the quantum yield of
photo cross-linking [111]. A second shortcoming is their sensitivity to radical reactions,
which prevents them from being used in radical copolymerisations. Coumarins and DMMIs
do not show these disadvantages.
For the present work, the DMMI functionality was chosen to be employed because of the
higher polarity and water solubility of this group, and because of favorable spectroscopic and
electronic properties in comparison to coumarins.
2.2.5.1 Photo Chemical [2+2]-Cycloaddition
Photo chemical [2+2]-cycloaddition reactions can basically start from both the excited singlet
(S1) and triplet (T1) state of one of the two molecules eventually forming a dimer. In the first
case, the reaction occurs in a concerted action and yields cyclo-dimers in the stereospecific cis
form, whereas the reaction from the T1 state proceeds in a stepwise manner, and dimeric
products thus obtained are a mixture of cis and (favored) trans isomers.
The energy of the excited singlet state of DMMI is considerably higher than that of the triplet
state. Direct excitation of DMMI requires short-wavelength UV light which might as well
cause unwanted degradation of the polymer chains. It is therefore advantageous to proceed
from the T1 state, which can be reached by energy transfer from an excited, suitably chosen
sensitizer [116-120]. The S1 and T1 states of the sensitizer molecule have to be closer together
with their energies between those of the S1 and the T1 states of DMMI. Figure 9 shows a
scheme of such a sensitized process. After excitation of the sensitizer to its S1 state by
comparatively long-wave UV light, it can undergo intersystem crossing to its slightly lower
T1 state and subsequently transfer the triplet energy to the substrate (DMMI), from which the
dimerization reactions proceed. This way of effectively achieving a high population of the T1
state as a starting point for photochemical reactions was described by HAMMOND et al. [116-
120]. Suitable sensitizer molecules are aromatic ketones since they generally show a
combination of strong spin-orbit coupling, leading to high quantum yield of intersystem
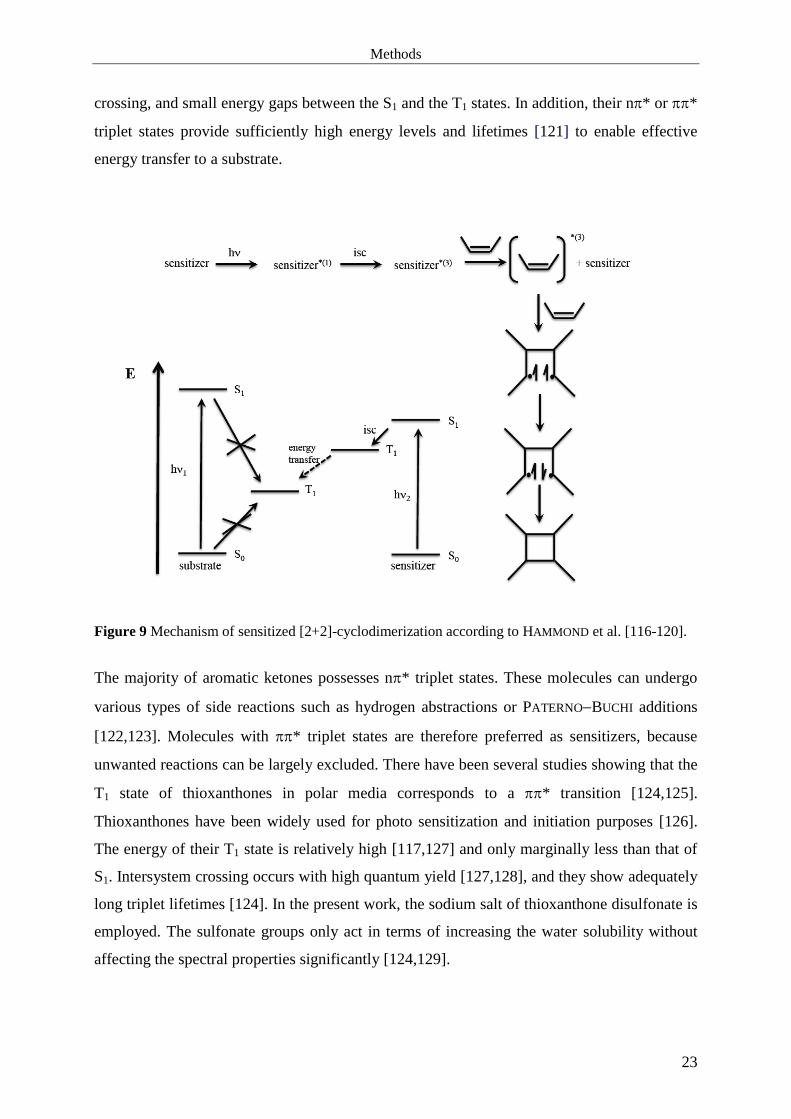
Methods
23
crossing, and small energy gaps between the S1 and the T1 states. In addition, their n* or *
triplet states provide sufficiently high energy levels and lifetimes [121] to enable effective
energy transfer to a substrate.
Figure 9 Mechanism of sensitized [2+2]-cyclodimerization according to HAMMOND et al. [116-120].
The majority of aromatic ketones possesses n* triplet states. These molecules can undergo
various types of side reactions such as hydrogen abstractions or PATERNOBUCHI additions
[122,123]. Molecules with * triplet states are therefore preferred as sensitizers, because
unwanted reactions can be largely excluded. There have been several studies showing that the
T1 state of thioxanthones in polar media corresponds to a * transition [124,125].
Thioxanthones have been widely used for photo sensitization and initiation purposes [126].
The energy of their T1 state is relatively high [117,127] and only marginally less than that of
S1. Intersystem crossing occurs with high quantum yield [127,128], and they show adequately
long triplet lifetimes [124]. In the present work, the sodium salt of thioxanthone disulfonate is
employed. The sulfonate groups only act in terms of increasing the water solubility without
affecting the spectral properties significantly [124,129].
Methods
24
3 Methods
3.1 Light Scattering
Light scattering is a process which covers a wide range of interactions of electromagnetic
radiation with particles. Therefore, the analysis of the scattered radiation arising from these
interactions is an important physical method. Light scattering can be classified as elastic (no
absorption) and inelastic (absorption, e.g., fluorescence, phosphorescence) light scattering.
Light scattering normally refers to light scattering of nonabsorbing macromolecules or
colloidal particles. When monochromatic light is incident onto a dilute macromolecule
solution, due to the difference in refractive index of solvent and solute, the incident light is
scattered by the illuminated macromolecule into all directions [130,131]. This scattered light
contains information of the macromolecule or particles in solution, such as the size, the molar
mass, and the conformation of the macromolecules or particles.
The extent of light scattered by a polymer network strongly depends on its structure. Liquids
and gases scatter light to a small extent caused by density fluctuations due to thermal motion
of the particles. In a solution, e.g., of a polymer in a good solvent, there are additional
concentration fluctuations of the diffusing polymer coils that exceed the density fluctuations
of the solvent itself and yield a much stronger scattering. If the coils can diffuse freely this is
called an ergodic system. In an ergodic system the time‐average of the scattered light intensity
is the same as the ensemble‐average.
A polymer gel is obtained by fixing the polymer coils by introducing cross-links in a polymer
solution. In this case, the concentration fluctuations within the solution become frozen‐in.
Hence, polymer coils cannot move freely, resulting in a non-ergodic system. In polymer gels,
there are parts exhibiting high polymer concentrations and low polymer concentrations. This
concentration difference leads to a spatially inhomogeneous structure. Intensity of light
scattered from polymer gels is stronger than scattering of corresponding uncross-linked
polymer solutions [77,81,132‐136].
In the present work only the elastic light scattering is employed. Light scattering can be
classified as dynamic light scattering (DLS) and static light scattering (SLS). The light
scattering intensity can be monitored either in the microsecond or in the second time range
domain. This is the main difference between SLS and DLS. The fluctuations of the intensity

Methods
25
of the light scattered by a small volume of a solution in the microsecond time range are
directly related to the Brownian motion of the sample. The fluctuation rate can be related to
different kinds of relaxation process such as diffusion and internal motions of the
macromolecules. Static light scattering measures the time-average scattered intensity, whereas
the dynamic light scattering measures the intensity fluctuations. In dynamic light scattering,
the frequency broadening (≈105-10
7 Hz) is quite small in comparison with the incident light
frequency (≈1015
Hz), so the detection of DLS in frequency domain is very difficult. But it
can be effectively recorded in the time domain through a time correlation function. That is
why DLS is sometimes called photon correlation spectroscopy (PCS).
In static light scattering the time-average scattered intensities are measured at different angles
and concentrations, from which three parameters of macromolecules for dilute polymer
solutions, namely the weight-average molecular weight, Mw, the z-average root-mean-square
radius of gyration ,<RG2>
0.5, simply RG, and the second osmotic virial coefficient, A2, can be
obtained. On the other hand, dynamic light scattering is designed to measure the fluctuation of
scattered intensity. Relaxation rate, Γ can be obtained from dynamic light scattering.
Translational diffusion coefficient, Dtrans, and hydrodynamic radius, RH, can be calculated
with the appropriate equations related with the relaxation rate.
3.1.1 Static Light Scattering
Scattering intensities obtained by SLS are usually reported in relative ratio as RAYLEIGH
ratios, R(q). Here
2
sin4
0
nq (22)
is the amplitude of the scattering vector with being the scattering angle, 0 the wavelength
of the incident light in vacuum and n the refractive index of the medium, respectively.
Figure 10 schematically shows a typical light scattering set up.

Methods
26
monochromaticlaser light incident light I0
scattered light I
sample chamber
r
detector
polarizor
I
Figure 10 Schematic illustration of light scattering. I0 is the intensity of the incident light, I is the
intensity of the scattered light measured at the angle and I is the intensity of light that passes through
the sample without any scattering.
For gels [5-11]
)()()( CF qRqRqR (23)
where the total scattering intensity, R(q), has been split into two contributions: RF(q), termed
the dynamic or fluctuating part, is due to thermal concentration fluctuations and RC(q), termed
the static (frozen-in) part, is due to spatial inhomogeneities possibly resulting from the cross-
linking process. The latter is the quantity of interest to characterize the microstructure of the
gels. In a common SLS device, the detector has a wide aperture or slit, collecting the scattered
light in a rather large solid angle (typically of the order of 10-3
). This results in a
correspondingly small coherence area of order 2/, [137] which is much smaller than the
cross-section of the scattering volume. As a consequence, SLS measurements automatically
report the scattering intensity as an ensemble-average over the scattering volume. This comes
usually pretty close to the macroscopic ensemble. Therefore, all quantities in eq. 23 represent
ensemble-averages.
In an experimental approach to determine RC(q) from SLS measurements, one often presumes
that the thermal fluctuations in a gel are practically identical with those in a solution of the
linear polymer,[6] hence RF(q) ≈ RSOL(q), and RC(q) ≈ R(q) RSOL(q). RSOL(q) becomes
available by separately measuring the scattering intensity of a (semi-dilute or concentrated)

Methods
27
solution of the uncross-linked polymer under conditions equivalent to those in the gel.
Although this seems to be a plausible assumption, it is not generally valid. GEISSLER et al.
showed by a series of carefully devised experiments based on a thorough theoretical treatment
that RF(q) is generally some 30% larger than RSOL(q) [138-140]. In many cases, however, the
static scattering intensity is so much larger than the dynamic scattering that the appreciable
error in RF(q) becomes irrelevant or is plainly accepted. On the other hand, it is frequently
difficult or even impossible to prepare a solution of the linear polymer. Either a polymer of
exactly the same composition as that in the gel is not available, or the preparation of a
homogeneous solution proves impractical because the viscosity becomes too high.
By determining the static scattering, RC(q), one can directly draw conclusions on the
inhomogeneities which were formed during gelation. These spatial inhomogeneities typically
occur on a length scale on the order of 10-100 nm [30,35,141]. A good overview of the
formation of inhomogeneities in gels is given by SHIBAYAMA [35]. According to
DEBYEBUECHE theory RC(q) provides a statement about the mean square fluctuation of
refractive index, <²>, and a static correlation length, The static scattering is given
by DEBYEBUECHE theory
222
23
C
1
8
q
KqR
(24)
K is a constant in which n is the refractive index of the medium and the wavelength of the
incident radiation in vacuum
4
0
224
nK
(25)

Methods
28
3.1.2 Dynamic Light Scattering
Unlike static light scattering which measures the time-averaged scattered intensity, dynamic
light scattering measures the fluctuation of the scattered intensity with time. These
fluctuations arise from the fact that the particles undergo random thermal (Brownian) motion.
Therefore, the distance between them is continuously varying. The fluctuation of the intensity
of scattered light at the detector is due to the constructive and destructive interference of light
scattered by the randomly moving particles within the illuminated sample volume. The time
dependent changes of the intensity contain information about this Brownian motion. DLS
measures the temporal correlations of these statistical fluctuations of the scattered intensity.
The light scattering set up was already shown in Figure 8. In order to perform dynamic light
scattering experiments, additionally a correlator is used to analyze the intensity fluctuations
that are monitored by the detector.
In DLS, the detection optics is designed to achieve a large coherence factor. Modern
instruments employ single-mode or few-mode light guides for this purpose [142,143]. As a
consequence, minor changes in the position or orientation of a gel sample produce marked
variations of the measured scattering intensity, forming a so-called speckle pattern. This
behavior is typical of non-ergodic samples such as gels or disordered solids, it does not appear
in fluids.
It is common in the literature on DLS to denote the scattering intensity by I(q). This custom is
important for this study, these intensities will be reported in absolute units to enable direct
comparison with data measured by SLS. Hence, I(q) and R(q) are equal quantities, the
different letters just refer to distinct measuring methods. Since it is the major purpose of DLS
to measure intensities on the scale of microseconds and to analyze temporal intensity
fluctuations, time average is explicitly indicated here by ...T.
As stated above, the time-averaged scattering intensity, I(q) measured on a gel sample
varies markedly with sample position or orientation. I(q)T has two contributions which can
be written as [15, 17, 35]
)()()( CTFTqIqIqI (26)

Methods
29
Eq. 26 looks very similar to eq. 23, but there is a significant difference. Whereas eq. 23
applies to the sample as a whole because the intensities are ensemble averages, eq. 26 applies
only to one particular speckle, i.e. a definite location in the sample observed under a definite
scattering vector. IF(q)T is the time-average of the fluctuating component arising from
dynamic, liquid-like concentration fluctuations. Because this contribution is ergodic,
IF(q)T = RF(q). On the other hand, the static component of the scattering intensity, IC(q), is
independent of time, but depends on the position [144]. That is why generally IC(q) ≠ RC(q)
and I(q)T ≠ R(q). The remainder of this section is therefore concerned with determining the
ensemble-averages I(q)E or IC(q)Erespectively
I(q)E can of course be obtained by taking measurements of the scattering intensity on a
sufficiently large number of positions and subsequent averaging, or by rotating the sample
while the measurement is running. But these procedures alone do not allow for a separation of
the different contributions i.e. fluctuating part and static (frozen-in) part. For that purpose, it is
necessary to make use of the intensity correlation functions.
The normalized time-average intensity correlation function (ICF), gT(2)
(q,), of the scattered
intensity determined from a single DLS experiment is given as
2
T
T)2(
T)0,(
),()0,(),(
qI
qIqIqg
(27)
where denotes the time, I the the scattered intensity. The scattered intensity is the square of
the absolute value of the electric field of the scattered light at the detection (eq. 28).
2
),(),( tqEtqI (28)
The square of the electric field, E, of the light scattered is proportional to the corresponding
scattered intensity. For an ergodic system, the scattered intensity contains only a fluctuating
component, i.e. qt = Fqt = Fqt, where EF(q,t) is a zero-mean complex
GAUSSIAN variable in the time domain and independent of position. gT(2)
(q,) is then
equivalent to an ensemble-averaged ICF, gE(2)
(q,), and can be related to the normalized

Methods
30
scattering function or the scattering field time correlation function gT(1)
(q,) via the SIEGERT
relation [131].
2
)1(
T2
E
E)2(
E
)2(
T ),(1)0,(
),()0,(),(),(
qg
qI
qIqIqgqg
(29)
where is the coherence factor of the instrument and ...E indicates an ensemble-average
over all possible configurations of the medium.
The scattering field time correlation function, gT(1)
(q,), can be approximated by a single
rexponential decaying function
)exp(),()1(
T qg (30)
is a characteristic decay time
12
trans qD (31)
where Dtrans is a translational diffusion coefficient and q is the scattering vector (eq. 22).
Dynamic light scattering mainly is a convenient method to detect the hydrodynamic radii of
polymer coils or other particles in dilute solution. The size of a particle or hydrodynamic
radius, RH, is calculated from the translational diffusion coefficient, Dtrans, which describes the
center of mass movement of the whole coil by using the STOKESEINSTEIN equation (eq. 32),
with the viscosity of the solvent, kB BOLTZMAN’s constant, T absolute temperature [47].
trans
BH
6 D
TkR
(32)
For a non-ergodic system containing an infinite network or having a “frozen-in” structure, the
scattered intensity also contains another contribution, i.e. the frozen-in (or static) component,
(q,t)T = F(q,t)T + IC(q) (eq. 26) and IC(q) = |EC(q)|2. The frozen-in component, IC(q), is
independent of time but depends on the position of the scattering volume within the sample.

Methods
31
Different regions in one sample scatter differently, a fact leading to the so-called “speckle
pattern” in DLS measurements. In this case, the SIEGERT relation (eq. 29) does not hold.
There are basically two different approaches to analyze the fluctuating part, IF(q)T, and the
static part, IC(q), of polymer gels in the literature. In the following two chapters these two
methods will be explained.
3.1.2.1 Non-Ergodic Method
Polymer gels generally have more or less inhomogenous structures. Inside the gel there are
two different behaviors. One of them arises from liquid-like structures while the other one
comes from solid-like structures. The fluctuating part, IF(q)T, corresponds to liquid-like
concentration fluctuations, thus being ergodic [144]. On the other hand, the static part of the
scattered intensity, IC(q), arises from spatial inhomogeneities resulting from the cross-linking
process. The total ensemble average scattering intensity, I(q)E, is the sum of these two
contributions. If IF(q)T = I(q)E the gel doesn’t exhibit static scattering from spatial
inhomogeneities. Hence, the gel is seemingly ergodic and exhibits no static fluctuations. Since
in polymer solutions IF(q)T = I(q)E, they are called ergodic. The non-ergodic method
proposed by PUSEY and VAN MEGEN [17] stresses the importance to take the ensemble-
average of the scattered intensity, I(q)E, by measuring scattered intensities at a large number
of sample positions from which the degree of inhomogeneity and the diffusion coefficient can
be evaluated. I(q)E can be obtained by taking measurements of scattering intensity by
rotating the sample while the measurement is running. Figure 11 describes here how an
experiment according to non-ergodic method is run. Due to the non-ergodicity of the gels
frozen-in inhomogeneities exist which are observed as a speckle pattern. Thus, at different
sample positions different time-average scattering intensities, I(q)T, are measured.
Measurements were usually done at = 90° because average of the particle sizes is observed
better at this angle.

Methods
32
<I>T / KHz
Sample position
0 20 40 60 80 1000
40
80
120
160
Sample position
0 25 50 75 1000
40
80
120
160
<I>E = <I>F <I>
T time average
<I>E ensemble average
<I>F fluctuating part
Figure 11 Time-average scattering intensity, IT, ensemble-average scattering intensity, IE, and
intensity of fluctuating part, IFT, can be determined through the non-ergodic method. Left hand side:
solution without cross-linker, right hand side: gel structure; = 90°.
According to PUSEY and VAN MEGEN [17] (non-ergodic method), the intensity of the
fluctuating part, IF(q)T, is related to time-average scattering intensity, I(q)T, via
),(1)()()( EEFTF qfqIqIqI (33)
f(q,) is the normalized intermediate ensemble-averaged scattering function (the letter f is
used to clearly distinguish the intermediate scattering function of non-ergodic medium from
the field correlation function, gT(1)
, of ergodic meduim) and f(q,∞) its asymptotic value at
→ ∞ which shows the static scattering fraction. f(q,) can in turn be calculated from the
time-averaged intensity correlation function measured at a particular position, gT(2)
11
1),(
)(
)(1),(
2)2(
T
E
T qg
qI
qIqf
(34)
with 2 = gT
(2)(q,0) 1, the initial amplitude of the time-averaged intensity correlation
function. By converting the time-averaged intensity correlation function, gT(2)
, into the
normalized intermediate ensemble-averaged scattering function, f(q,), it is “shifted” up to a
ordinate intercept with the value of one resulting in an offset, f(q,∞), different from zero
(Figure 12).

Methods
33
/ ms
10-4 10-3 10-2 10-1 100 101 102 103 104
gT (2
) (q
, )
- 1
0.0
0.1
0.2
0.3
0.4
/ ms
10-4 10-3 10-2 10-1 100 101 102 103 104
f(q
, )
0.0
0.2
0.4
0.6
0.8
1.0
Static fraction
Figure 12 In order to obtain f(q,) by the non-ergodic method gT(2)
(q,) 1 is shifted to a ordinate
intercept of 1 according to eq. 33.
From the fitted curve the asymptotic value, f(q,∞), and the correlation time, , is calculated
according to eq. 35. The amplitude A = 1 f(q,∞).
)exp(),(),(
t
Aqfqf (35)
While the asymptotic value, f(q,∞), indicates the static fraction of the polymer gel, (IC(q)T),
the amplitude, A, of the curve corresponds the fluctuating part, (IF(q)T). The lower the
asymptotic value, the more homogenous is the polymer gel. In the non-ergodic method the
aim is to separate the static and fluctuating part of the investigated polymer gel as
percentages. The accuracy of this method, often termed the non-ergodic approach (NE), has
also been assessed [145].
In addition, it is possible to obtain the dynamic correlation length, by means of the
cooperative diffusion coefficient, D, which defines the relaxation of network chain segments
according to eq. 36. This equation is partially different from the STOKESEINSTEIN equation
(eq. 32). The correlation length shows the distance between cross-links that are connected by
network chains and the cooperative diffusion coefficient is used instead of the translational
diffusion coefficient.

Methods
34
D
kT
6
(36)
3.1.2.2 Partial Heterodyne Method
The alternative method, the partial heterodyne method (PH) proposed by JOOSTEN et al. [15]
is applicable if intensity correlation functions have been determined on a (large) number of
positions. It is assumed that the scattered intensity for a non-ergodic medium can be given by
the sum of fluctuating and static intensity components and ergodicity can be applied to the
fluctuating part. Apparent diffusion coefficients, DA, can be estimated according to
1,lnlim2
1 )2(
T02A
qg
qD
(37)
For different sample positions, different values of DA are obtained, and these come along with
different local scattering intensities, I(q)T. A fully fluctuating, ergodic and thus
homogeneous and homodyne system (IF(q)T = I(q)T) yields D = DA. In a predominantly
static, non-ergodic, inhomogeneous and heterodyne system (IF(q)T << I(q)T) it is D = 2DA.
A relationship between DA and the cooperative diffusion coefficient, D, has been derived:
A
T
TF
)(
)(2 D
qI
qID
(38)
Eq. 38 applies to each sample position. For different sample positions, different values of DA
and I(q)T are obtained. According to the eq. 38a, which is simply a rearrangement of eq. 38,
a plot of I(q)T / DA versus I(q)T should yield a straight line, from the slope and intercept of
which the fluctuating component of the scattering intensity, IF(q)T, and D can be obtained. A
sufficiently large number of data points are needed in order to define the straight line with
adequate accuracy.
D
qI
D
qI
D
qI TFT
A
T )()(2
)(
(38a)

Methods
35
Figure 13 shows the typical decomposition plots for the gel samples. For each system 100
data points are plotted. From the linear regression cooperative diffusion coefficient, D, as well
as the fluctuating component, IF(q)T, are evaluated.
<I>T + k / kHz
0 5 10 15 20
(<I>
T/D
A )
* 1
0-1
4 / k
Hz.s
.m-2
0
1
2
3
4
Figure 13 Decomposition plots according to eq. 38a for different gel samples. k is an arbitrarily
chosen additive constant for each gel in order to separate the corresponding plots.
Both approaches described allow separation of the ensemble-averaged scattering intensity,
I(q)E, into its components, IF(q)E and IC(q)E.

Methods
36
3.2 Rheology
3.2.1 Introduction
While the microstructure of the gels is analyzed using light scattering methods, the
characterization of the polymeric matrix, in which the diffusion takes place, is done by means
of rheometry.
Rheology is defined as the science of flow and deformation matter. It investigates the
relationship between force, deformation and time. The material that is investigated in
rheology can be everything from an elastic solid to a viscous liquid. This material property is
known as viscoelasticity. The rheology is therefore a suitable method to determine the
macroscopic properties of gels [47,146-148].
3.2.2 Viscoelastic Behavior of Polymer Gels
Polymers are viscoelastic materials, since they show strongly viscous and elastic behavior at
the same time. Viscoelastic behavior accordingly consists of a combination of the laws of
NEWTON and HOOKE The relationship between stress and strain is called constitutive
equation. The simplest constitutive equation which describes the elastic behavior of an ideal
solid, is HOOKE's law. According to HOOKE's law the stress is proportional to the deformation.
G (39)
is the force per unit area or stress, is the relative length change or stress. The
proportionality factor, G is the shear modulus which shows the resistance of a material against
deformation.
On the other hand, for liquids the constitutive equation is NEWTONS’s law of viscosity which
states that the shear stress, is no longer proportional to the deformation, but proportional to
the rate of deformation. The ratio of stress and deformation rate is referred to as viscosity, or
resistance to flow . It is NEWTON's law
(40)
Liquids that follow this law are referred to as Newtonian fluids.

Methods
37
These constitutive equations do not hold for viscoelastic materials. Oscillatory measurements
are ideal to investigate viscoelastic behavior. The principal advantage is that the viscoelastic
response of any material can be measured directly on different time scales while the angular
frequency, is varied. For purely Hookean solid the shear stress is “in-phase” with applied
strain. For ideal elastic solids, the following equation gives the relation between stress and
deformation
tGt (41)
with G the elastic shear modulus. For a harmonic periodic, the time-dependent deformation
can be expressed as
tt sinA (42)
is the deformation amplitude and is the angular frequency. For elastic materials the shear
stress and shear deformation curve are “in-phase” and correspond to a sinusoidal curve.
On the other hand, for ideal viscous liquids according to NEWTON,
tt (43)
The shear stress in a Newtonian liquid still oscillates with the same angular frequency, but is
out-of-phase with the strain by /2. The course of deformation is shown as a sinus curve,
resulting for the shear stress and the deformation speed a cosinusoidal course.
More generally, the linear response of a viscoelastic material always shows the stress leading
the strain by a phase angle
tt sin0 (44)

Methods
38
where the phase angle, is frequency dependent and can take values between 0 and /2. For
solids that obey to HOOKE’s law = 0 and for a Newtonian fluid = /2 at all frequencies. By
separation of the resulting shear stress into two mutually orthogonal functions which oscillate
with the same frequency, one in-phase with the strain and the other out-of-phase with the
strain by /2
tGtGt cos''sin'A (45)
the shear modulus is separated into two values, G' being elastic the modulus and G'' the
viscous modulus. G' is also called the storage modulus which is a measure for the deformation
energy stored during the shear process. G'' is the loss modulus characterizing the energy
dissipated by deformation. They can be regarded as the real and the imaginary part,
respectively, of a complex shear modulus, G*
''i'* GGG (46)
The ratio of loss and storage modulus is the tangent of the phase angle, which is called loss
tangent
'
''tan
G
G
(47)
is also called loss angle or loss factor and can be used for characterization of solids and gels.
During the gelation process the gel point is reached when the weight average molar mass, Mw,
diverges and thus goes to almost infinity [149]. In this gel point (G'= G'') the sample turns
from liquid to solid behavior. CHAMBON and WINTER found out that G' and G'' are only equal
if they both show an identical frequency dependence. An indication of the gel point in terms
of rheology has been proposed with the formulation
nGG ~''~' (48)

Methods
39
n is called relaxation exponent and 0 < n < 1 [150].
This relation does not mean that the gelation point is exactly the same as the intersection point
G' = G'' [151,152]. However, the crossover point is a good estimate for the sol-gel transition.
All of these considerations are only valid as long as the analyses are carried out in the so
called linear viscoelastic regime. In this regime, the elastic and the loss modulus is
independent of the applied deformation or shear stress.
The cross-linking reaction can be monitored in a time course experiment at constant
frequency and strain. When G' and G'' intersect the gelation threshold is reached (Figure 14).
For liquid-like materials G'' is much higher than G' and for solid-like material G' is much
higher than G''.
time / min.
0 40 80 120
G', G
" /
Pa
0.1
1
10
100
1000
G'
G"
Figure 14 Elastic modulus, G', and viscous modulus, G'', are plotted against reaction time of a cross-
linking polymerization. The gel point is considered as intersection of the curves where the sample
turns from solution to gel.

Experimental Section
40
4 Experimental Section
4.1 Substances
4.1.1 Compounds used for Free Radical Cross-linking Copolymerization
N-isopropylacrylamide (NIPA, ACROS), N,N’-methylenebis(acrylamide) (MBA, Sigma),
ammonium persulfate (APS, Sigma), and N,N,N’,N’-tetramethylethylenediamine (TEMED,
Sigma) were used as received. PNIPA gels were prepared by free radical cross-linking
copolymerization of NIPA and MBA in aqueous solution. NIPA is used as a monomer, MBA
is used as a cross-linker.
NIPA MBA
Figure 15 Monomers; left hand side: N-isopropylacrylamide; right hand side: N,N’-methylenebis(acrylamide).
Ammonium persulfate is used as an initiator and N,N,N’,N’-tetramethylethylenediamine is
used as an accelerator in the polymerization reactions.
TEMED APS
Figure 16 Left hand side; N,N,N’,N’-tetramethylethylenediamine; right hand side: ammonium
persulfate.

Experimental Section
41
4.1.2 Compounds used for Photo Cross-linking Polymerization
NIPA was copolymerized with N-(N’-Acryloyl-2-aminoethyl)-dimethyl maleimide
(DMMIAAm) by means of TEMED and APS.
NH
O
NH
O
N
O
O
K2S2O8
TEMED
H2O, HCOONa
25°C
* CH2 CH
OHN
CH2
HC
OHN
*
NO O
n m
O
NH
O
NH
O
NH
O
NH
O
NH
DMMIDimer
O
NH
O
NH
O
NH
O
NH
O
NH
hv, sens.
Figure 17 PNIPA functionalized with pendant DMMI-groups was synthesized by free radical
copolymerization of NIPA and DMMIAAm according to Figure 17.
4.1.2.1 Synthesis of DMMIAAm
AAm was functionalized by DMMI (DMMIAAm) [153] according to [154]: one amine group
of 2-diaminoethane was blocked with Boc (tert-Butyldicarbonat), the other one reacted with
dimethylmaleic anhydride, and after removing the protecting group, the amine group reacted
with acryloyl chloride. The reaction scheme and the detailed conditions are given in Figure
18.

Experimental Section
42
H2N
NH2
H2N
BOC
N
O
O
BOC
N
O
O
HN
O
N
O
O
NH2
a) b)
c)
d)
(a) (Boc)2O/1,4-dioxane, 25 °C, 48 h
(b) Dimethylmaleic anhydride/toluene, 130 °C, 2.5 h
(c) CF3COOH/CH2Cl2, RT, 1 h
(d) CH2=CHCOCl, Na2CO3/CH2Cl2, 0-5 °C, 2 h
Figure 18 Synthesis of dimethylmaleimido acrylamide, DMMIAAm.
The following purification steps for the intermediate compounds and the final product were
applied:
BocNH-(CH2)2-NH2 was purified by vacuum distillation at 64 °C / 0.1 mbar, BocNH-(CH2)2-
DMMI was re-crystallized from water/ethanol (1:1), H2N-(CH2)2-DMMI was intensively
washed with methylene chloride, and DMMIAAm was purified by re-crystallization from
hexane/ethyl acetate (1:1).
4.1.2.2 Copolymerization of NIPA with DMMIAAm
Two copolymers of poly(NIPA-co-DMMIAAm), abbreviated here as PNIPA-DMMI, with
different molecular weights and with 1 mol-% DMMI were prepared by free radical cross-
linking copolymerization as shown in Figure 17 in the following manner adopted from
SEIFFERT [97].
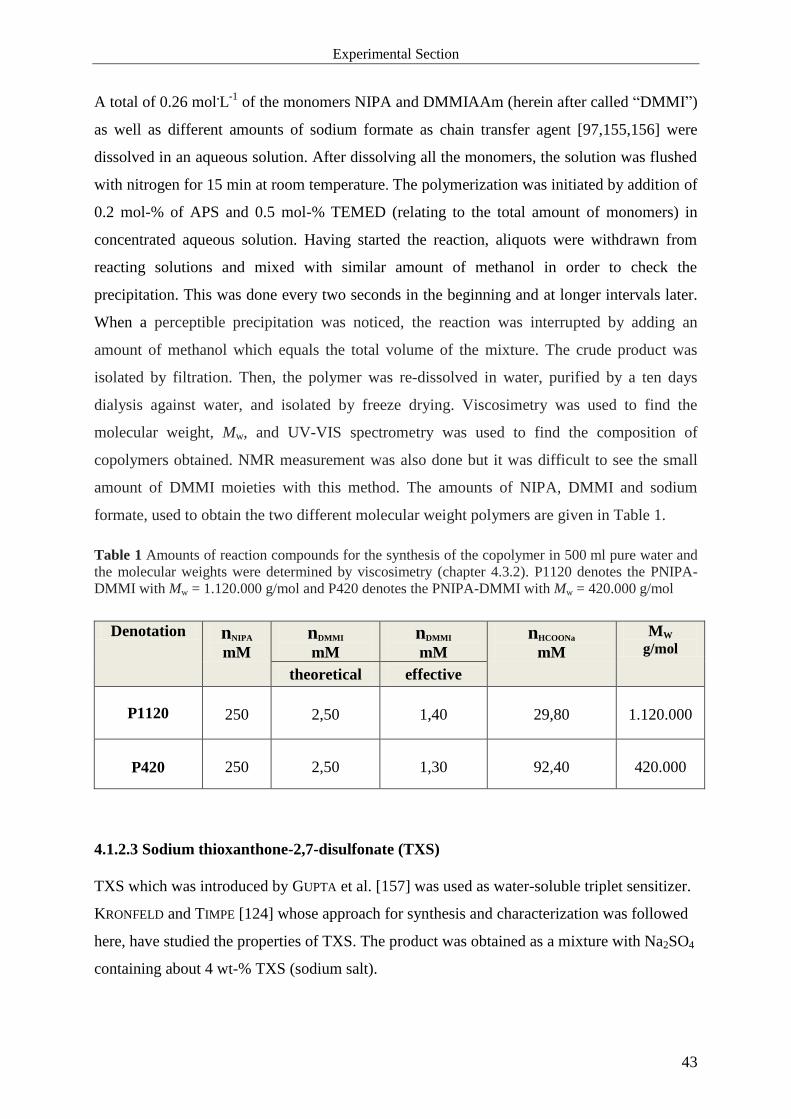
Experimental Section
43
A total of 0.26 mol.L
-1 of the monomers NIPA and DMMIAAm (herein after called “DMMI”)
as well as different amounts of sodium formate as chain transfer agent [97,155,156] were
dissolved in an aqueous solution. After dissolving all the monomers, the solution was flushed
with nitrogen for 15 min at room temperature. The polymerization was initiated by addition of
0.2 mol-% of APS and 0.5 mol-% TEMED (relating to the total amount of monomers) in
concentrated aqueous solution. Having started the reaction, aliquots were withdrawn from
reacting solutions and mixed with similar amount of methanol in order to check the
precipitation. This was done every two seconds in the beginning and at longer intervals later.
When a perceptible precipitation was noticed, the reaction was interrupted by adding an
amount of methanol which equals the total volume of the mixture. The crude product was
isolated by filtration. Then, the polymer was re-dissolved in water, purified by a ten days
dialysis against water, and isolated by freeze drying. Viscosimetry was used to find the
molecular weight, Mw, and UV-VIS spectrometry was used to find the composition of
copolymers obtained. NMR measurement was also done but it was difficult to see the small
amount of DMMI moieties with this method. The amounts of NIPA, DMMI and sodium
formate, used to obtain the two different molecular weight polymers are given in Table 1.
Table 1 Amounts of reaction compounds for the synthesis of the copolymer in 500 ml pure water and
the molecular weights were determined by viscosimetry (chapter 4.3.2). P1120 denotes the PNIPA-
DMMI with Mw = 1.120.000 g/mol and P420 denotes the PNIPA-DMMI with Mw = 420.000 g/mol
Denotation nNIPA
mM
nDMMI
mM
nDMMI
mM nHCOONa
mM
MW g/mol
theoretical effective
P1120
250
2,50
1,40
29,80
1.120.000
P420
250
2,50
1,30
92,40
420.000
4.1.2.3 Sodium thioxanthone-2,7-disulfonate (TXS)
TXS which was introduced by GUPTA et al. [157] was used as water-soluble triplet sensitizer.
KRONFELD and TIMPE [124] whose approach for synthesis and characterization was followed
here, have studied the properties of TXS. The product was obtained as a mixture with Na2SO4
containing about 4 wt-% TXS (sodium salt).

Experimental Section
44
4.2 Preparation of Hydrogels
4.2.1 Free Radical Cross-linking Copolymerization
Two series of PNIPA hydrogels were prepared. In the first series, the initial NIPA
concentration C0 was kept constant at 704.2 mmol.L
-1 (80 g
.L
-1) while the cross-linker
concentration was varied between 2.81 mmol.L
-1 (0.4 mol-% of monomer) and 10.0 mmol
.L
-1
(~1.5 mol-% of monomer). A corresponding solution of the linear polymer was prepared
under identical conditions without addition of MBA. Redox initiation system consisting of
3.5 mmol.L
-1 APS and 16.7 mmol
.L
-1 TEMED were used. Gels were prepared at Tprep = 10, 15,
20, and 25 °C. This thesis will focus on the gels made at 25 °C unless otherwise stated. The
results obtained for gels made at the other preparation temperatures show essentially similar
behavior.
Another series consisting of just four gels was prepared to allow for direct comparison with
the photo cross-linked gels. It was intended to make gels by different synthetic route that were
identical with regard to polymer concentration as well as to their macroscopic properties; i.e.
same elastic modulus. In order to obtain the same elastic modulus, free radically cross-linked
samples were prepared from solutions of NIPA and MBA (NIPA concentrations were 5 and
6.5 wt-% while MBA concentrations changed from 350 mmol.L
-1 to 574 mmol
.L
-1; ratios of
NIPA and MBA as detailed in the Table 2) by adding 3.5 mmol.L
-1 APS and 16.7 mmol
.L
-1
TEMED and polymerizing overnight at 25 °C.
Table 2 Concentrations of the monomers cNIPA and cMBA used in the second series of the FRC. FRC-5
and FRC-6.5 are the abbreviations of the free radical hydrogels which have 5 wt-% and 6.5 wt-%
NIPA, respectively.
NIPA, MBA and TEMED were dissolved in distilled water and then the solution was purged
with nitrogen gas for 10 min. After addition of the required amount of an APS solution, one
NIPA
Concentration
441 mM - (5 wt-%)
(FRC-5)
574 mM - (6.5 wt-%)
(FRC-6.5)
CMBA / mM
4.41 (1 mol-%)
3.50 (1.64 mol-%)
CMBA / mM
5.74 (1 mol-%)
4.60 (1.25 mol-%)
Experimental Section
45
part of the mixture was transferred between the plates of the rheometer maintained at the
desired preparation temperature, Tprep, (10, 15, 20, or 25°C ± 0.2 °C), and the remaining part
was filtered through Teflon membrane filters (pore size: 0.45 mm) directly into NMR tubes
serving as light scattering vials. Polymerization took place in these tubes being submerged in
a water bath kept at the particular Tprep. NMR tubes were chosen because of their small wall
thickness of 0.6 mm, thus ensuring good heat transfer preventing a temperature rise due to the
large negative enthalpy of polymerization.
The LCST was checked by visual inspection and UV-VIS spectrometry of several samples
while slowly increasing their temperature in a water bath. The polymer solution became
turbid at 33 °C with a sharp transition, while for the gels more gradual transitions were
observed with the onset of barely visible turbidity at 29-30 °C followed by a noticeable
increase of turbidity at 33.5 -34.5 °C.
In supplemental experiments, in the first part of this study weighed FRC gel samples were
immersed in a large excess of water for 3 weeks to extract any soluble species. The water was
replaced every second day. Eventually, the gels were dried in an oven at 55 °C and weighed
again. The gel fraction was determined as final weight of the dry sample divided by the mass
of monomer plus cross-linker in the initial gel sample. The gel fractions were found to be
90 ± 1 %.
4.2.2 Photo Cross-linking Polymerization
The two PNIPA-DMMI samples P1120 and P420 were cross-linked by UV irradiation. The
concentrations of PNIPA-DMMI copolymers were 5 and 6.5 wt-% (441 mmol.L
-1 and 574
mmol.L
-1) for each series of photo gels. PNIPA-DMMI was dissolved in water containing 10
mol L-1
TXS (to ensure transmittance 90 % at 380 nm) and stirred for 2 days until a clear
solution was formed in the dark. One part of the reaction mixture was transferred between the
plates of the rheometer maintained at the desired preparation temperature, around Tprep, 25 °C,
and the remaining part was filtered through Teflon membrane filters (pore size: 0.45 mm)
directly into NMR tubes serving as light scattering vials. To cross-link the precursor chains in
the photo-gelling systems, all tubes containing the semi-dilute precursor solutions were
exposed to UV light providing spatially homogeneous irradiation with a relatively broad
spectrum in the range of 380 nm at around Tprep 25 °C. The copolymers that were employed in
photo cross-linking systems are denoted as P1120-5, P1120-6.5, P420-5, P420-6.5.

Experimental Section
46
Table 3 Photo gels and free radical gels, which have the same elastic modulus, are compared with
each other. In the table the compared pairs are given.
Hydrogels made by
Photo cross-linking Free radical
cross-linking
P1120-5
FRC-5_4.41mM
P1120-6.5
FRC-6.5_3.50mM
P420-5
FRC-5_5.74mM
P420-6.5
FRC-6.5_4.60mM
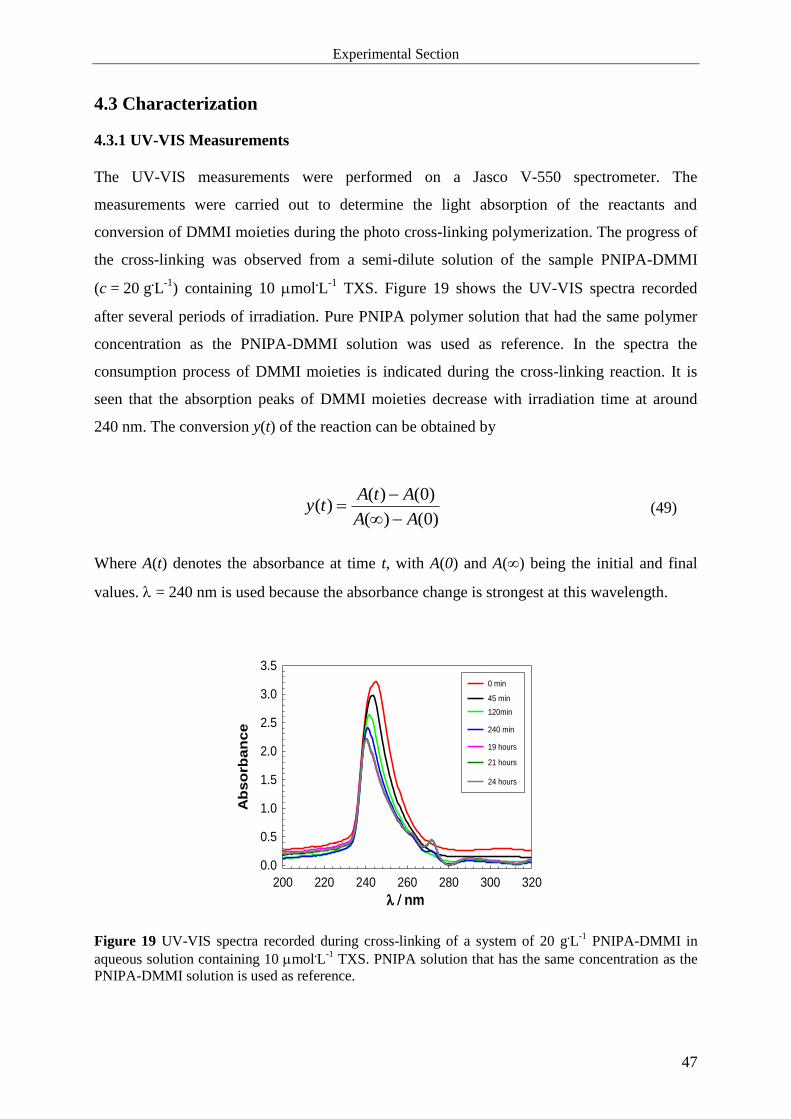
Experimental Section
47
4.3 Characterization
4.3.1 UV-VIS Measurements
The UV-VIS measurements were performed on a Jasco V-550 spectrometer. The
measurements were carried out to determine the light absorption of the reactants and
conversion of DMMI moieties during the photo cross-linking polymerization. The progress of
the cross-linking was observed from a semi-dilute solution of the sample PNIPA-DMMI
(c = 20 g.L
-1) containing 10 mol
.L
-1 TXS. Figure 19 shows the UV-VIS spectra recorded
after several periods of irradiation. Pure PNIPA polymer solution that had the same polymer
concentration as the PNIPA-DMMI solution was used as reference. In the spectra the
consumption process of DMMI moieties is indicated during the cross-linking reaction. It is
seen that the absorption peaks of DMMI moieties decrease with irradiation time at around
240 nm. The conversion y(t) of the reaction can be obtained by
)0()(
)0()()(
AA
AtAty
(49)
Where A(t) denotes the absorbance at time t, with A(0) and A(∞) being the initial and final
values. = 240 nm is used because the absorbance change is strongest at this wavelength.
nm
200 220 240 260 280 300 320
Ab
so
rban
ce
0.0
0.5
1.0
1.5
2.0
2.5
3.0
3.5
0 min
45 min 120min
240 min
19 hours
21 hours
24 hours
Figure 19 UV-VIS spectra recorded during cross-linking of a system of 20 g.L
-1 PNIPA-DMMI in
aqueous solution containing 10 mol.L
-1 TXS. PNIPA solution that has the same concentration as the
PNIPA-DMMI solution is used as reference.

Experimental Section
48
4.3.2 Viscosimetry Measurements
The viscosimetry method was used to find out the molecular weight of the synthesized
polymers. Measurements of solution-viscosity were made on polymer solutions with
concentrations of 0.5, 0.75, 1, 1.5 g.L
-1 at 25 °C using an Ubbelohde-viscometer with a
capillary diameter of 0.36 mm. Intrinsic viscosities were obtained with the help of HUGGINS
plots. For calculation of the viscosity average molecular weight, MARK
HOUWINKSAKURADA [158] parameters were used.
4.3.3 NMR Measurements
High-resolution 1H spectra were recorded on a Bruker Avance 600 digital FT spectrometer at
400 MHz. After the DMMIAAm synthesis NMR spectrometry was used to characterize the
polymer. NMR results agreed with data from the literature perfectly [159]. PNIPA-DMMI
was also measured in NMR but it was hard to see the DMMI moieties since the concentration
of DMMI was very low in PNIPA-DMMI.
NMR results:
1H NMR (400 MHz, CDCI3): ppmCH3CH2NH6,
CH2NCH2=CH=CH2=NH
Experimental Section
49
4.4 Light Scattering Measurements
SLS and DLS measurements were carried out for two types of gels (FRC and PC gels) at
observation temperatures, Tobs., between 10 °C and 30 °C. Specifically, in the first part of this
study, the FRC gels were synthesized at Tprep = 25 °C, light scattering measurements were
performed at 25, 20, 15, 10, 12.5, 17.5, 27.5, 30 °C (in that sequence). Similar experiments
were performed on FRC gels synthesized at Tprep = 20 °C and 15 °C for. In the second part of
the study PC gels and FRC gels were only synthesized at Tprep = 25 °C and measured at 25,
20, 15, 10 and 30 °C. Both light scattering apparatuses were equipped with a He-Ne laser
operating at = 633 nm and were calibrated against a toluene standard for absolute intensity.
SLS was performed on a goniometer SLS-2 (Fica). For DLS, an ALV/CGS-3 compact
goniometer (ALV, Langen, Germany) was used equipped with a cuvette rotation/translation
unit (CRTU). A fiber optical detection unit based on three-mode detection was used, which
includes an appropriate collimator/GRIN-lens fiber and the ALV/STATIC and DYNAMIC
enhancer. Ideally, the three-mode detection unit gives an intercept in the time-averaged
intensity autocorrelation function (ICF) gT (2)
(q,0) 1 of 0.33; i.e. should be 0.33. An
experimental check with a polystyrene latex suspension gave a coherence factor of
0.36 ± 0.01, and this value was used for the evaluation of the DLS measurements. To protect
the detector, the intensity of the incident light is automatically attenuated at each
measurement by an eight-step automatic software-controlled attenuator and measured with a
monitor diode. Thus, the intensity of incident light can be different within a series of
measurements. When discussing scattering intensities, therefore the data that is used was
rescaled to a preset value of the monitor diode assuming linear count rate dependence.
Toluene was used as the index matching liquid. The temperature was controlled with an
external thermostat. The time-averaged ICFs were acquired at 100 different sample positions
selected by randomly moving the CRTU before each run. The acquisition time for each run
was 30s. The ensemble-averaged scattering intensity, I(q)E, was determined by continuously
moving the sample vial with the CRTU, and the acquisition time for I(q)E was 2 min.

Experimental Section
50
4.5 Rheological Measurements
In the first part of the study the shear modulus of the FRC gels were measured with a parallel-
plate rheometer (CVO Rheometer, Bohlin Instruments) equipped with a Peltier device for
temperature control. In the second part the shear modulus of the FRC and PC gels were
measured again with plate-plate rheometer and a modified quartz glass bottom plate with a
violet LED‐lamp below it exhibiting a wavelength of 380 nm (Figure 20). Note that the UV-
lamp was just switched on for PC gels. The plates (diameter 40 mm) were set to a distance of
500 m before the onset of the reactions. During all rheological measurements, a solvent trap
was used to minimize solvent evaporation. A frequency of 1 Hz and a deformation amplitude
of = 0.01 were selected to ensure that the oscillatory deformation was within the linear
regime. The polymerization process was monitored in situ by measuring the storage modulus
G' and loss modulus G'' as a function of time with the temperature being maintained at the
desired Tprep. While both moduli for all FRC gels reached final constant values after a few
hours, this time extended to 18 hours for PC gels indicating completion of the polymerization.
In the first part of the study, the measurement temperature was changed during the rheology
measurements of free radical samples in steps of 5 °C and the modulus was determined at
temperatures different from Tprep to obtain data at 15, 20, and 25 °C.
sample
quartz plate
array of diodes
Figure 20 Schematic illustration of the rheometer with plate-plate geometry and irradiation apparatus
for photo chemical cross-linking of the sample during the measurement.

Results and Discussion
51
5 Results and Discussion
In the first part of this study, the aim is to characterize the microstructure of gels i.e.
inhomogeneity, synthesized by free radical cross-linking copolymerization of N-
isopropylacrylamide (NIPA) by means of static and dynamic light scattering methods as well
as macro-characterization by rheometry. Scattering behavior of FRC gels by changing
observation temperature as well as preparation temperature below LCST were studied.
In the second part, the effect of the cross-linking method on the microstructure of the
hydrogels has been investigated. For this purpose linear PNIPA-DMMI was synthesized in
different Mw and cross-linked via a photo cross-linking reaction. The inhomogeneities of the
resultant gels were compared to the analogous FRC gels that were synthesized by
conventional free radical copolymerization of NIPA monomer with MBA as cross-linker.
5.1 Free Radical Cross-linking Hydrogels
5.1.1 Mechanical Properties
In order to have a general overview on the microstructure of the hydrogels some mechanical
measurements have been performed to estimate the effective cross-link density and average
chain length between the cross-link points. The hydrogels considered in the first part were
synthesized via free radical copolymerization of NIPA and MBA in an aqueous solution. The
initial NIPA concentration C0 was kept constant at 704.2 mmol·L-1
(80 g·L-1
) while the cross-
linker concentration was varied between 2.81 mmol·L-1
(0.4 mol-% of monomer) and 10.0
mmol·L-1
(~1.5 mol-% of monomer). Gels were prepared at Tprep = 10, 15, 20, and 25 °C. In
the subsequent discussion, the gels made at 25 °C will be focused on unless otherwise stated.
The results obtained for gels synthesized at the other preparation temperatures show
essentially similar behavior.
The shear modulus was measured and evaluated according to rubber elasticity theory yielding
an estimate of the effective network density, eff, according to equation 49 [40,160]. For the
case of thermo-responsive PNIPA gels, the elastic modulus is calculated by using a modified
form of equation 20.

Results and Discussion
52
0
2
2
eff
' 21
r
rRT
fvG (50)
Here f is the functionality of the cross-links, hence for tetra-functional cross-links 1−2/f = 0.5;
R is the gas constant, and T the absolute temperature. <r2> is the mean-square end-to-end
distance of network chains and <r2>0 the corresponding quantity for free chains. The
calculation according to eq. 50 assumes that G', which is measured at 1 Hz, is identical to the
equilibrium modulus within experimental error. This fact was substantiated by the finding that
G'' / G' ≤ 0.01 in each case. However, G' showed an unusually strong temperature
dependence, decreasing about 12% when the measurement temperature was lowered from
25 °C to 15 °C. Similar dependencies were found for gels obtained at 15 and 20 °C. The
change with temperature was fully reversible. Possibly, this is due to a decrease of <r2>0
when the temperature approaches the LCST from below. Formation of associations represents
another possibility that cannot be excluded. (G' raises even stronger above the LCST.) To
estimate eff, G' measured at 25 °C is used and the ratio of <r2> / <r
2>0 is assumed 1 at
preparation conditions.
Table 4 contains a listing of the shear moduli of the gels prepared with different cross-linker
concentrations and the quantities derived thereof. In addition to the effective network
density,eff, the average molar mass of the network chains, MC, has been calculated according
to MC = /eff, where is the mass concentration. The large values obtained for MC indicate
that an effective network chain is likely to consist of branched and cycled structures.
It is useful to compare the effective network density, eff, with the hypothetical network
density, th, of a network where all cross-links are perfectly interconnected by elastically
effective network chains. This latter quantity was calculated from the molar concentration of
the cross-linker in the system, CMBA, by assuming that all cross-linker molecules have
completely reacted as tetra-functional junction points:th = 2CMBA. In fact, the cross-linkers
may not have completely reacted and the real network may contain a variety of defects, a
wide distribution of chain lengths between junction points, and inhomogeneities of cross-link
density and connectivity. The ratio eff / th (cross-linking efficiency) can serve as a measure
for the extent of perfection. It is included in Table 4 as well. The values obtained are almost
independent of cross-linker concentration. They are considerably smaller than 1 indicating a
preponderance of network imperfections.

Results and Discussion
53
Table 4 Rheological data obtained on gels synthesized with different cross-linker concentrations.
Monomer concentration CNIPA = 704.2 mM corresponding to 7.15 vol-%.
5.1.2 Microstructure
An aqueous system containing linear PNIPA has a lower critical solution temperature (LCST)
around 33 °C. Below the LCST, it forms a homogeneous solution. However, concentration
fluctuations increase when the temperature gets closer to the miscibility gap. Stated otherwise,
water is a good solvent for PNIPA at low temperature, but the solvent quality drops
significantly with increasing temperature. This thermodynamic behavior gives rise to an
increase of scattering intensities when the temperature approaches the LCST from below. The
refractive index increment, dn / dc, measured for dilute PNIPA solutions, does not change
perceptibly with temperature; it was found to be 0.181 mL·g-1
at 15 °C and 0.182 mL·g-1
at
25 °C. So the intensities are a good measure for concentration fluctuations. When PNIPA is
cross-linked to form a gel, the determined LCST rises slightly and does not appear as sharp as
in solution (cf. experimental section). In PNIPA gels, the thermodynamic fluctuations are
superimposed by static concentration fluctuations that are independent of time, but depend on
location. The influence of temperature on these static fluctuations is of particular interest in
this first part of the study. Therefore the information obtained by light scattering on the
microstructure of the hydrogels and the influence of temperature thereon will be discussed.
The length scale probed by light scattering is of the order of 1/q (cf. eq. 22), corresponding to
40-90 nm when the scattering angle is in the range 50°-140° at 630 nm. This length scale
should be compared with the mean distance between cross-links, which is around 5-10 nm
based on CMBA. Hence structural characteristics appreciably larger than the mesh size of the
network were investigated.
CMBA
(mmol/L)
G’(25°C)
(kPa)
eff
(mol/m3)
MC
(g/mol)
eff /th
(%)
2.81 0.93 0.75 100,000 13.2
4.69 1.80 1.44 55,000 15.4
7.04 2.37 1.91 42,000 13.5
8.80 2.94 2.36 34,000 13.4
10.0 3.25 2.60 31,000 13.1

Results and Discussion
54
5.1.2.1 Static Light Scattering
As mentioned further above, SLS measurements, by the design of measurements, report the
scattering intensity as an ensemble average over a large scattering volume, being close to a
macroscopic ensemble. This was verified by repetition of the measurements after turning or
shifting the sample and checking for reproducibility. Usually an average over five different
positions was taken.
To investigate the influence of observation temperature on the microstructure of PNIPA
hydrogels, static light scattering experiments were carried out in the range
10 °C ≤ Tobs. ≤ 27.5 °C on these gels as well as on the corresponding solution. The scattered
light intensities, R(q), were recorded at scattering angles from 50° to 140°, which corresponds
to a scattering vector range of q = 1.1·105 - 2.5·10
5 cm
-1.
Figure 21 shows the total scattering intensity R(q) = RC(q) + RSOL(q) plotted against the square
of the scattering vector, q2, for the hydrogels prepared at 25 °C with various amounts of MBA
at different observation temperatures. Increasing the MBA concentration and observation
temperature increases the total scattering intensity, R(q), of the hydrogels. The change with
temperature is fully reversible. It should be mentioned that RSOL(q) raises from 1.02·10-4
cm-1
at 15 °C to 1.82·10-4
cm-1
at 25 °C. These results obviously show that the static portion of the
scattered light from the PNIPA hydrogels is strongly temperature dependent. The angular
dependence is too small to be exploited.

Results and Discussion
55
q2 .10
-10 / cm
-2
2 4 60.0
0.5
1.0
1.5
Tobs.
= 15 °C Tobs.
= 20 °C
q2 .10
-10 / cm
-2
2 4 6
Tobs.
= 25 °C
q2 .10
-10 / cm
-2
2 4 6
R(q
).10
3 /
cm
-1
X = 10.0 mM
X = 2.81 mM
X = 4.69 mM
X = 7.04 mM
X = 8.80 mM
solution
Figure 21 Total scattering intensity, R(q), plotted versus the square of the scattering vector, q2, for
PNIPA hydrogels at different measurement temperatures, Tobs., and MBA concentrations, X, as
indicated. Tprep = 25 °C.
5.1.2.2 Dynamic Light Scattering
Figure 22 shows the results of DLS measurements made at 90° on several gels having
different cross-linker contents (b-d), and on a solution of the linear polymer (a). For each
sample, 100 measurements were conducted at different sample positions. The observation
temperature was 25 °C, identical to the preparation temperature. Fig. 23 clearly demonstrates
that the gels exhibit the typical speckle pattern, becoming more pronounced when the cross-
linker content was increased, while the scattering intensity observed on the solution is
independent of position. This behavior is well known and has been reported repeatedly. Note
that q is not given since the scattering angle that is used in measurements is 90°.

Results and Discussion
56
0 25 50 75
<I>T
. 103 / cm
-1
0
1
2
3
4
0 25 50 75
Sample position
0 25 50 75 100
Sample position
0 25 50 75
Sample positionSample position
a b c d
Figure 22.Variation of time-averaged scattering intensity, IT, with sample position for PNIPA
hydrogels with (a) 0, (b) 4.69, (c) 8.80, and (d) 10.0 mM MBA concentration. The solid lines represent
the ensemble-averaged scattered intensity, IEThe fluctuating components of the scattering intensity,
IFT, are represented by the dashed and dotted lines. Tobs. = Tprep = 25 °C; 90°
The solid horizontal lines represent the ensemble-average of scattered intensity, IE, obtained,
on the one hand, by calculating the mean value of the data obtained at 100 positions (thin
line), and, on the other hand, the value measured while the cuvette was steadily rotated (thick
line). There is a slight difference between the two values reflecting experimental uncertainty.
The dashed line indicates the fluctuating component of the scattered intensity,IFT, estimated
by the partial heterodyne method (based on 100 positions, eq. 37), while the dotted line gives
the result for IFT when the non-ergodic method was applied on just 15 positions (eq. 32),
with subsequent averaging. The essential features deduced from Fig. 23 are as follows: There
is no appreciable discrepancy between the two methods of data evaluation (it will be
elaborated on this point further below). While the ensemble-average scattered intensity,
IE,increases significantly with rising cross-link density, the fluctuating component,IFT,
remains practically constant and is identical to the scattering intensity of a solution 1.8·10-4
cm-1
.
To analyze the influence of observation temperature on the scattering behavior, the sample
containing 8.8 mmol·L-1
MBA was focused on, shown in Fig. 22c. Fig. 23 shows the
corresponding data measured at 10, 15, 20, and 25 °C at 90°. It is obvious that the spatial
fluctuations of the time-average scattered intensity, IT, grow significantly with raising
temperature, and so do the ensemble-averages, IE. The change with temperature is fully
reversible.

Results and Discussion
57
Sample position
0 25 50 75
Sample position
0 25 50 75
b c
Sample position
0 25 50 750.0
0.5
1.0
1.5
2.0
2.5a
Sample position
0 25 50 75 100
d
<I>T . 10
3 / cm-1
Figure 23 Variations of the time-averaged scattering intensity, IT, with sample position at 4 different
observation temperatures, (a) 10, (b) 15, (c) 20, and (d) 25 °C, for a gel prepared at 25 °C with 8.8 mM
MBA. The solid lines represent the ensemble-averaged scattered intensity, IE. The fluctuating
components of the scattering intensity, IFT, are represented by the dashed and dotted lines. 90°
Closer inspection shows that the fluctuating component, IFT, also slightly raises with
temperature. This is easier seen in a compilation of the data given in Table 5. Equation 50 is
applied in order to convert the values obtained by DLS into the same order of SLS values. By
this way, the ensemble average scattered light intensity, IE, was obtained as a Rayleigh ratio,
R(q), to compare them in the same scale.
Tol
ETolsample
I
IRR (51)
RTol and ITol are the intensities of toluene from SLS and DLS, respectively.
Columns 2 and 3 represent the fluctuating part,IFT, determined by the partial heterodyne
method and the non-ergodic method, respectively. Columns 4 and 5 show, for comparison, the
scattering intensity, of a PNIPA solution measured in the two apparatuses. All 4 values agree
to within ± 20% at each temperature, while there is a distinct increase with raising
temperature. This increase is expected, of course, because the thermal fluctuations become
stronger when the LCST is approached.
The last three columns in Table 5 show the constant component of the static scattering
intensity, IC, obtained via the partial heterodyne method and the non-ergodic method,
respectively, as well as RC, obtained by SLS (eq. 23). Again, the data agree satisfactorily at
each temperature. However, there is a marked increase with increasing temperature,

Results and Discussion
58
seemingly even stronger than that of the fluctuating component of the scattering intensity,
IFT. This observation requires further discussion.
Table 5 Intensity values (in 10-4
cm-1
) of the fluctuating (IF) and frozen (IC) part in dynamic and static
light scattering at different observation temperatures. 90°, CMBA = 8.80 mM, Tprep = 25 °C. PH:
partial heterodyne method, NE: non-ergodic method.
If one erroneously assumed that the static scattering was due to some permanently fixed,
solid-like heterogeneity, there would be no influence of temperature on IC. Obviously, this is
not correct. In fact, the increase of the static scattering intensity, IC, with increasing
temperature for PNIPA gels below the LCST was already reported by Tanaka et al. [13] and
SHIBAYAMA et al. [14,35] but without giving an in-depth explanation. They showed that
above the LCST (36-50 °C) for weakly charged PNIPA gels, the static scattering intensity, IC,
raises markedly with increasing observation temperature due to the progressive formation of a
two-phase structure, while the intensity of fluctuating part, IFT, remains essentially constant
[29].
Considering the scattering behavior in the homogeneous region below the LCST, it is
proceeded from the notion that a given polymer network generally has an inhomogeneous
distribution of cross-links. Hence, the local cross-link density (in an area defined by the static
correlation length) is fixed through synthesis. This local cross-link density is controlling the
local polymer concentration depending on thermodynamic conditions. It is predominantly the
Tobs. IF
(PH)
IF
(NE)
IF,SOL
(DLS)
RF,SOL
(SLS)
IC
(PH)
IC
(NE)
RC
(SLS)
10 °C
1.23
1.03
1.04
0.76
1.95
2.17
1.92
15 °C
1.31
1.14
1.27
1.02
2.82
2.93
2.70
20 °C
1.74
1.46
1.71
1.50
3.73
4.36
4.24
25 °C
2.37
1.92
1.87
1.82
6.99
8.65
7.17

Results and Discussion
59
polymer density correlation function that determines the scattering properties of the gel, not
the (fixed!) cross-link density correlation function (unless the refractive index increment of
the cross-linking moieties is by far greater than that of the polymer). The temperature
dependence of the static scattering intensity, IC(q), therefore arises from the thermodynamics
of variable local swelling.
The swelling pressure of a gel is given by the osmotic pressure of a semi-dilute solution of the
uncross-linked polymer plus the negative pressure due to chain elasticity [47]. The osmotic
pressure, as a crude approximation, changes in proportion with excluded volume, or (1-2),
where is the Flory interaction parameter. For PNIPA, varies strongly with temperature
and approaches 0.5 near the LCST. On the other hand, the pressure due to chain elasticity is
nearly independent of solvent quality, but proportional to cross-link density. Now consider
regions of high cross-link density in equilibrium with regions of lower cross-link density. At a
given temperature, say 20 °C, this equilibrium results in distinct variations of local polymer
concentration. As the temperature is increased, the osmotic part of the swelling pressure gets
smaller while the elastic part becomes more dominant. This means that the more densely
cross-linked regions deswell at the expense of the less densely cross-linked ones. The overall
volume is kept constant, of course; the gel is not in macroscopic equilibrium with pure
solvent. As a result, the characteristic length scales of the structure do not change, but the
scattering contrast is enhanced, resulting in larger static scattering intensity.
By this argument, the temperature dependence of the static scattering intensity, IC(q), is traced
back to the same origin as that of the fluctuating component of the scattering intensity,
IF(q)T, namely solvent quality. This does not necessarily mean, however, that the form of the
dependence is similar. Thermal fluctuations, giving raise to IF(q)T, are governed by the
course of the spinodal, while the static concentration contrast, giving raise to IC(q), results
from local swelling equilibrium.
In order to compare the temperature dependencies of the two components, it is worthwhile to
look at the normalized intermediate scattering functions calculated from the measured
gT(2)
(q,) by eq. 34. Figure 24 shows the averaged f(q,t-functions for q = 1.9·105 cm
-1
corresponding to a scattering angle of 90°. At long times they reach asymptotic plateau values
that increase slightly with rising measuring temperature and are indicative of the frozen-in
(static) inhomogeneity. According to the theory derived by PUSEY and VAN MEGEN, the
f(q, t)-curves measured at one temperature on a given gel should be identical irrespective of
sample position. Actually, there is quite some scatter in these plateau values. Table 6 therefore

Results and Discussion
60
shows a listing of the average values together with their standard deviations derived from
measurements at 15 positions. They were obtained by fitting of the data to the expression
(35)
using a nonlinear least-squares fitting procedure.
time / ms.
10-4 10-3 10-2 10-1 100 101 102 103 104
f (t
)
0.6
0.7
0.8
0.9
1.0
15°C
25°C
10°C
20°C
Figure 24 Normalized intermediate ensemble-averaged scattering functions, f(t), calculated from
gT2() values according the eq. 33 for different observation temperatures, Tprep = 25 °C.
f(q,), i.e. the (ensemble-averaged) fraction of scattered light which is due to static
inhomogeneities, increases moderately from around 70% to around 80% when the measuring
temperature is raised from 10 °C to 25 °C. This raise is clearly beyond experimental
uncertainty and proves that the static scattering component is affected by temperature to a
greater extent than the fluctuating component
)exp(),(),(
tAqftqf

Results and Discussion
61
Table 6 Listing of the average values of the ensemble-average fraction of the scattering intensity,
f(q,∞), together with their standard deviations derived from measurements at 15 positions.
Tobs. f (q,)
10 °C
0.68 ± 0.057
15 °C
0.71 ± 0.047
20 °C
0.74 ± 0.035
25 °C
0.80 ± 0.036
The correlation time, , is around 70 µs corresponding to cooperative diffusion coefficients,
D, between 35 and 43 µm2/s. D raises moderately with increasing cross-link density, while the
influence of temperature is amazingly small (less than 5% change when the observation
temperature was increased from 10 to 25 °C, i.e. within experimental error). Since the
viscosity of water and that of a PNIPA solution drops by 30% in that range, there is likely an
opposing effect based on some structural rearrangement. The correlation lengths in the range
5-7 nm compare well with the mean distance between cross-links.
Figure 25 shows a side-by-side comparison of the temperature dependences of scattering
intensity measured by SLS and DLS for a range of cross-link densities for gels prepared at 25,
20 and 15 °C. Note that IFT corresponds to RF, and IE corresponds to R(q). The DLS and
SLS graphs are closely identical for the all preparation temperatures. This is of course taken
for granted as far as the ensemble-averaged total scattering intensities are concerned. In this
case, the two methods just differ in the fact that the SLS apparatus yields the ensemble-
average directly, while with the DLS apparatus, the averaging must be performed deliberately
either by rotating the cuvette during the measurement or by taking the average over a
sufficiently large number of measurements taken at different sample positions. The
procedures applied to obtain the fluctuating components, however, are fundamentally
different. In SLS, the polymerization was carried out without a cross-linker, and the scattering
intensity of the resulting solution is assumed to represent the fluctuating component of

Results and Discussion
62
correspondingly synthesized gels. In DLS, the intensity correlation functions obtained on the
gels were used to extract the fluctuating part. This could be done for each degree of cross-
linking. Fig. 25 shows that the fluctuating component of the scattering intensity data, IFT, of
the studied gels coincide and form one single line (open symbols in Fig. 25a, 25c, 25e). These
lines are pretty much the same as that of the solution (open symbols in Fig. 25b, 25d, 25f).
These observations strongly support the notion that the two experimental approaches are
equivalent. Fig. 25 further demonstrates that the discussion about the slightly different
temperature dependences of IFT and IC (or RF and RC) is a general phenomenon with PNIPA
networks, irrespective of the degree of cross-linking.
It would be interesting to exploit the q-dependence of the static scattering component in order
to obtain some information on the length scale of static inhomogeneities. As recognized from
Fig. 21, the variation of scattering intensities in the experimentally accessible q-range is too
small to be quantified with some confidence. The slope of the intensity vs. q2-plot seems
negative (as expected) in some instances, but positive slopes and slopes close to zero are also
found. Similar behavior was found by DLS measurements (not shown). This means that the
static correlation length does not exceed 10-15 nm, and light scattering experiments are not
suited to obtain information at smaller scale.
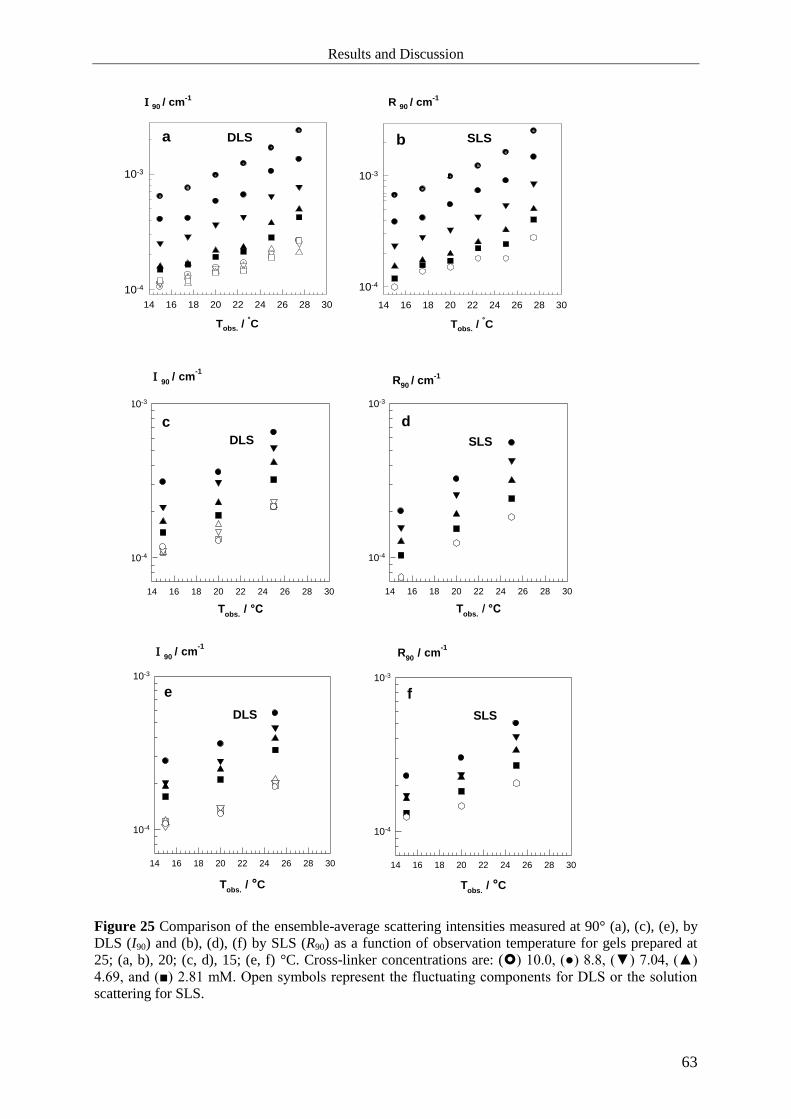
Results and Discussion
63
SLS
Tobs. / °C
14 16 18 20 22 24 26 28 30
90 / cm-1
10-4
10-3
DLS
Tobs. / °C
14 16 18 20 22 24 26 28 30
R 90 / cm-1
10-4
10-3
SLSa b
Tobs.
/ °C
14 16 18 20 22 24 26 28 30
90 / cm
-1
10-4
10-3
SLS
Tobs.
/ °C
14 16 18 20 22 24 26 28 30
R90
/ cm-1
10-4
10-3
DLS
dc
Tobs.
/ °C
14 16 18 20 22 24 26 28 30
90 / cm
-1
10-4
10-3
SLS
Tobs.
/ °C
14 16 18 20 22 24 26 28 30
R90
/ cm-1
10-4
10-3
DLS
e f
Figure 25 Comparison of the ensemble-average scattering intensities measured at 90° (a), (c), (e), by
DLS (I90) and (b), (d), (f) by SLS (R90) as a function of observation temperature for gels prepared at
25; (a, b), 20; (c, d), 15; (e, f) °C. Cross-linker concentrations are: () 10.0, (●) 8.8, (▼) 7.04, (▲)
4.69, and (■) 2.81 mM. Open symbols represent the fluctuating components for DLS or the solution
scattering for SLS.

Results and Discussion
64
5.1.3 Summary
In the first part of this thesis static and dynamic light scattering measurements were
performed on free radically cross-linked PNIPA hydrogels in order to carefully compare
different methods of dividing the total scattering intensity into two parts: thermal scattering
due to Brownian motion of the network chains and static scattering due to topological or
spatial inhomogeneity. The major emphasis of the first part was on a detailed inspection of the
dependence mainly on the observation temperature and partially on the preparation
temperature of the thermal and static scattering components of a given gel. Earlier
publications [13, 14, 35] showed that both parts seem to increase when the temperature was
raised, but this became evident only in a rather narrow temperature range, from 30-33 °C,
close to the LCST. The results presented here clearly show that both components also increase
perceptibly in the range 10 °C Tobs. 25 °C, much further away from the LCST of PNIPA in
water. Comparison of dynamic and static light scattering methods was also done and
consistent results were obtained.

Results and Discussion
65
5.2 Comparison of FRC Gels with PC Gels by Scattering Methods
In the second part of the study the network structure of hydrogels which are synthesized by
free radical cross-linking copolymerization, FRC, are compared to networks that are formed
by photo chemical cross-linking reaction. Photo chemical cross-linking, PC, provides the
opportunity of controlling the rate and extent of the reaction at will. Cross-links are supposed
to be introduced randomly in space for PC gels, whereas the distribution of cross-linking
points of FRC gels are more inhomogeneous due to differences in the reactivity ratios of
monomers and cross-linkers [161,162]. Therefore it is supposed that PC gels are more
homogeneous from the microscopic point of view than FRC gels starting from monomers and
cross-linkers.
Two kinds of PNIPA-DMMI copolymers that have different molecular weights for the PC
were synthesized. One of them has an average molecular mass of Mw =1.120.000 g/mol
(P1120) and the other one has a Mw = 420.000 g/mol (P420), both determined by
viscosimetry. The concentration of photo cross-linkable groups is set to 1 mol-% for both PC
copolymers. This means for the copolymers with molar masses of 420.000 and 1.200.00 there
are theoretically approximately 37 and 98 cross-linkable groups available at one chain,
respectively. The effective number of cross-linkable groups, shown in Table 1, is the half of
the theoretical values. Having this concentration of DMMI group highly cross-linkable gels
are obtainable. Since the cross-linking process starts from linear polymers in the semi-dilute
regime, it is expected to obtain highly homogeneous structures of these in photo gels. In dilute
solutions, it is known that polymers with high molecular weights show higher scattering
intensities compared to solutions of low molecular weight chains. Theoretically this behavior
is not true for semi-dilute solutions because the intensity of scattering should not depend on
the molecular weight in this regime. However it is possible that other factors depending on the
molecular weight like the dissolution or the aggregation behavior can influence the scattering
properties of the polymer solutions. These effects should also be considered when comparing
two PC gels starting from Mw = 420.000 and Mw = 1.200.000 g/mol. Additionally copolymers
having different chemical sites can also show higher scattering because of incompatibility
effects.

Results and Discussion
66
5.2.1 LCST of PNIPA solutions and PNIPA gels
Before starting the fundamental experiments, the LCST of PC and FRC gels were determined.
The LCST of the P420 solution at 5 wt-% polymer concentration and its gel (P420-5), the
analogous FRC solution and its gel at the same polymer concentration (FRC-5) were checked
by the transmittance measurements carried out in UV-VIS spectrometry at 500 nm while
slowly raising the temperature from 25 °C until the transition is observed (Figure 26). The
transmittance of the both P420 and FRC solutions showed an abrupt decrease, becoming
turbid at 33 °C with a sharp transition, while for both P420 and FRC gels more gradual
transition was observed with the onset of barely visible turbidity at 29-30 °C followed by a
noticeable increase of turbidity and decrease of transmittance at 34-34.5 °C.
Tobs./ °C
24 26 28 30 32 34 36
Tra
ns
mit
tan
ce
%
0
20
40
60
80
100
Figure 26 Transmittances of P420-5 sol and gel as well as analogous FRC-5 sol and gel are plotted
against different observation temperatures, Tobs.. (▲) P420-5 gel, (∆) P420-5 sol, (■) FRC-5 gel,
(□) FRC-5 sol.
It was shown that both types of gels and solutions have the same temperature dependent
behavior showing similar LCST transitions. It can be concluded that the incorporation of
DMMI-groups does not affect the typical thermo-responsive property of pure PNIPA.

Results and Discussion
67
5.2.2 Macroscopic Properties
In order to have a reliable comparison between the two network structures synthesized by two
different methods, first it had to be ensured that both hydrogels have the same effective cross-
link densities, i.e. the same elastic moduli. Gels that have the same elastic moduli show
similar macroscopic behavior. As the elastic modulus originates from chemically effective
network strands, the microstructures of the gels are responsible for the macroscopic
properties. But different kinds of microstructure can lead to one and the same behavior as
long as only the numbers of elastically active strands are the same. In this case that means a
gel containing a high degree of inhomogeneity can show the same macroscopic behavior as a
very homogenous gel, because the effective cross-link density is the same. In sum, adjusting
elastic moduli to the same value is a reasonable starting point to compare the gels made by
photo cross-linking and free radical cross-linking reactions. For this purpose, the elastic
modulus of photo gel systems was investigated first and then the cross-linker (MBA) content
of FRC gels was adjusted in the reaction mixture such to obtain the same elastic modulus as in
the photo gel systems.
PNIPA hydrogels are obtained in an efficient and controlled manner by means of sensitized
photo cross-linking of linear PNIPA chains which are functionalized with dimethylmaleimide
(DMMI) groups. Concentration of PNIPA-DMMI polymers was 5 and 6.5 wt-% for both
series of photo gels. The solutions prepared at concentrations higher than 6.5 wt -% were
quiet viscous and filtration was quite difficult. Hence concentration of polymers was fixed at
5 and 6.5 wt-%. They were irradiated by a LED-lamp from below of the quartz glass bottom
plate of rheometer at the room temperature around 25 °C. Thus the cross-linking process
could proceed under rheological monitoring. The measurements lasted until the G' reached the
plateau value.
The hydrogels made by free radical cross-linking were synthesized using initial NIPA
concentrations of 5 and 6.5 wt-% while the cross-linker (MBA) content varied in order to
obtain the same elastic modulus with the described photo gels above (Table 2). The reaction
mixture was transferred between the plates of the rheometer maintained at the desired
preparation temperature, Tprep = 25 °C ± 0.2 °C. Reaction proceeded without irradiation by the
LED-lamp, accelerated by the redox initiation system.
Figure 27 shows the course of the elastic and viscous modulus during the reaction time of
photo cross-linked systems with an initial molecular weight of 420.000 g/mol linear polymer

Results and Discussion
68
at the concentrations of 5 and 6.5 wt-% and of analogous free radical cross-linked systems
with 5 and 6.5 wt-% as well, synthesized by different amounts of MBA. The differences
between the progress of the elastic modulus of PC gels and analogous FRC gels are seen in
the graphs. Note that the scale of the abscissa is different for both graphs.
P420
time / min.
0 500 1000
G', G
'' / P
a
0.1
1
10
100
1000
FRC
time / min.
0 100 200 300
G'' G''
G' G'
Figure 27 Elastic modulus, G', and viscous modulus, G'', are plotted versus time measured by
rheometry. Left hand side: data for the photo cross-linking polymerization reaction; (□) P420-5, (○),
(●) P420-6.5. Right hand side: data for to the free radical cross-linking copolymerization reaction; (□)
FRC-5_4.41 mM MBA, (○), (●) FRC-6.5_3.5 mM MBA. Tobs. = 25 °C, frequency: 1Hz.
It can be clearly seen that the elastic modulus increases while the reaction proceeds until a
steady state value of G' is reached. This value corresponds to the elastic equilibrium modulus
G0' for 0. In the case of free radical cross-linked hydrogels the steady state is already
reached after 10 min whereas the elastic modulus of the photo cross-linked systems needs
more than 9 hours to level off. FRC gels reach their final moduli significantly faster than PC
gels. This is due to the different reaction mechanism of both types of gels and the intensity of
the UV-lamp used during photo cross-linking reaction. The same behavior is obtained from
P1120 gels and their analogous FRC gels. In the case of radically polymerized systems, cross-
linking occurs fast and uncontrolled across the whole sample whereas polymers like the
PNIPA-DMMI copolymer can only react if cross-linkable groups interact. So for the
formation of hydrogels made by photo cross-linking the concentration of the preformed
polymers has to exceed the overlap concentration which means that cross-linking through the
whole sample just occurs in semi-dilute and concentrated regime. In dilute solutions only
micro-gels can be formed. Hence the polymer concentration has also an influence on the
cross-linking efficiency. In this case the overlap concentration, c*, of the copolymer with

Results and Discussion
69
Mw = 420.000 g/mol is 0.016 g/ml which means the polymer concentration is more than 3
times higher than the critical value. This means, that in both cases the polymer coils overlap
sufficiently and the polymer chains are sufficiently entangled to allow formation of
macroscopic gels. The overlap concentration of the copolymer with Mw = 1.200.00 g/mol is
c*= 0.0065 g/ml so the polymer concentration is more than 7.5 times higher than the critical
value which means excessive entanglements of the chains.
In Table 7 the elastic moduli of four different PC and FRC gel pairs are shown with their
corresponding cross-linking efficiencies. Increasing the molecular weight and weight fraction
of PNIPA-DMMI increases the elastic modulus and the cross-linking efficiency of the photo
gels. Generally, the efficiency of cross-linking in the case of FRC gels is lower than that of
PC gels. This is due to undesirable reactions during gelation of FRC gels such as formation of
loops, dangling chains and living unreacted functional groups. On the other side, in the case
of photo gelation, semi-dilute solutions of functionalized linear PNIPA molecules are cross-
linked by selectively connecting the functional groups. It is the advantage of photo gelation
that in this case cross-linking occurs in a random manner so cross-linking efficiency
increases. Increasing the polymer concentration also leads to a higher cross-linking efficiency.
Table 7 Elastic modulus and cross-linking efficiency of photo cross-linking hydrogels and analogous
free radical cross-linking hydrogels are given.
G'
(PC/FRC Pair)
/Pa
PC gels and analogous FRC gels Efficiency of
cross-linking
(veff/vth) %
400 P420 - 5 7.40
FRC-5_4.41 mM MBA 3.70
800 P420 - 6.5 11.30
FRC-6.5_3.5 mM MBA 9.20
600 P1120 - 5 11.0
FRC-5_5.74 mM MBA 4.20
1100 P1120 - 6.5 15.60
FRC-6.5_4.6 mM MBA 9.70
Results and Discussion
70
It was successful to find pairs of hydrogels synthesized by free radical cross-linking and photo
cross-linking that show the same elastic modulus, meaning comparable macroscopic behavior.
Now it is possible to analyze the hydrogels concerning their microstructure. In the following
chapter the network inhomogeneities of these pairs of systems will be investigated.
5.2.3 Light Scattering Measurements
5.2.3.1 Dynamic Light Scattering
After obtaining the same macroscopic properties for both types of gels, their microstructure
was analyzed. Dynamic light scattering is a suitable method to obtain information about
homogeneity of gels. The non-ergodic method has been employed to analyze DLS data on 15
positions. From the measured intensity data, the time and ensemble-average scattering
intensities are determined. The calculated autocorrelation function is then used to get
information about the microstructure by applying suitable methods. Due to the non-ergodicity
of gels, the fluctuating part and the frozen-in (static) part can be calculated from normalized
intermediate ensemble-averaged scattering functions (eq. 35). The fluctuating part describes
the sol fraction whereas the gel fraction is related to the frozen-in part of the autocorrelation
function. By comparing the fluctuating and frozen-in parts of different measurements,
statements in concern of the network inhomogeneity can be made. (Note that q is not given
since the scattering angle that is used in all measurements is 90°.) Figure 28 shows the results
of DLS measurements performed at 90° on the P1120-6.5 gel and the analogous FRC-6.5
gel at different observation temperatures (10 °C ≤ Tobs. ≤ 30 °C). As mentioned in the first part
of this study, the solid horizontal line represents the ensemble-average of the scattering
intensity, IE, obtained while the cuvette was steadily rotated and the dashed line indicates the
fluctuating component of the scattered intensity, IFT. It is clear that with decreasing
observation temperature, spatial fluctuations of the time-average intensity, IT (open circles),
and ensemble-average intensity, E, decrease significantly for both types of gels. The
fluctuating component, IFT, is also diminishing with decreasing temperature as expected. It
is an important fact that the P1120-6.5 is formed by the copolymer with the highest molecular
weight at the highest concentration investigated in this study. From these graphs in Figure 28
one can see that PC gels are not more homogeneous than FRC gels having the same
mechanical properties. The ensemble-average scattering intensities, IE, and time-average
intensities, IT, of P1120-6.5 gel are higher than those of the analogous FRC gel while

Results and Discussion
71
intensities of the fluctuating part, IFT, are nearly same for both. This behavior becomes more
obvious especially for the measurements below 30 °C. Additionally, intensities of the
fluctuating values, IFT, are given in Table 8 because it is difficult to see the exact values
clearly from Figure 28 and Figure 29. Such a high inhomogeneous structure of P1120-6.5 gel
is due to some reasons. First, the high molecular weight of the starting copolymer, PNIPA-
DMMI, which is used for P1120 gels. Second, high polymer concentration which is 10 times
higher than c*. And the third one, the interactions between the DMMI units and solvent which
show different interactions behavior than the PNIPA units and solvent. As a result of these
facts even the solution of the corresponding P1120-6.5 gel was already quite viscous
indicating an undesired amount of intermolecular interactions. Thus, an initial inhomogeneity
of the sample seems to exist even before cross-linking occurred. This is probably due to the
very high molecular weight of the starting copolymer that makes it difficult to homogeneously
dissolve the polymer even after two days. The inhomogeneity of the solutions is discussed in
more detailed in chapter 5.2.3.5. These facts could be the reason for the result that the P1120-
6.5 gel is more inhomogeneous than analogous FRC-6.5 gel.
On the other hand, another parameter for the solubility of the polymer is the solvent quality
which significantly changes with temperature for PNIPA. At higher temperatures the solvent
water turns from a good solvent to a poor solvent for PNIPA as observed by LCST. Hence the
PNIPA units of the copolymer, PNIPA-DMMI, have a lower tendency of attractive
interactions with water. In contrast, the DMMI units prefer higher temperatures because these
groups are dissolved easier at these conditions. There is an opposed tendency of both groups
in the case of PC gels. As a result the change of the scattering intensity values of PC gels
(IE, IT) with temperature is not as high as in the case of the FRC gels. For both, PC and
FRC gels, the osmotic part of the swelling pressure gets smaller while the elastic part
becomes more dominant as the temperature is increased. This is due to the fact that highly
cross-linked regions of a gel lead to deswelling of these regions at the expense of the low
cross-linked regions. As already explained earlier, the larger scattering with increasing
temperature is due to a more pronounced scattering contrast whereas the characteristic length
scales of the structure are not altered.

Results and Discussion
72
Sample position
0 25 50 75 100
Tobs
= 10 °C FRCTobs
= 10 °C P1120
Sample position
0 25 50 75
Sample position
0 25 50 75
Tobs
= 20 °C FRCTobs
= 20 °C P1120
Sample position
0 25 50 750
100
200
300
400
Tobs
= 25 °C FRC
Sample position
0 25 50 75 100
Tobs
= 25 °C P1120
Sample position
0 25 50 75
P1120-6.5 / FRC-6.5
Tobs
= 30 °C P1120
Sample position
0 25 50 750
100
200
300
400T
obs= 30 °C FRC
Sample position
0 25 50 75
<>
T / k
Hz
<>
T / k
Hz
Figure 28 Variations of time-averaged scattering intensity, IT, with sample position at 4 different
observation temperatures 30, 25, 20, 10 °C, for P1120-6.5 and analogous FRC-6.5 hydrogels. The
solid line represents the ensemble-averaged scattered intensity, IE. The fluctuating component of the
scattering intensity, IFT, is represented by the dashed line, 90°.
Except P1120-6.5 gels, the ensemble-average scattered intensity, IE, and the fluctuating
intensity, IFT, are very close in the case of the other PC and FRC gel pairs. Figure 29 shows
the DLS results of the P420-6.5 gel and its analogous FRC-6.5 gel at different Tobs.. There is a
significant increase of all the intensity values for both types of gels when the temperature
raises from 25 °C to 30 °C whereas the raise is smaller at temperatures between 10 to 25 °C.
Since 34 °C is the LCST of NIPA, the inhomogeneity of the PNIPA gels increases drastically
when the temperature approaches to this LCST. As can be seen from the graphs both type of
gels show similar intensity values at different Tobs..

Results and Discussion
73
P420-6.5 / FRC-6.5
Tobs
= 30 °C FRC
Sample position
0 25 50 75
Sample position
0 25 50 750
50
100
150
200
Tobs
= 30 °C P420 Tobs
= 25 °C P420
Sample position
0 25 50 75
Tobs
= 25 °C FRC
Sample position
0 25 50 75 100
Sample position
0 25 50 75
<I>
T / k
Hz
0
50
100
150
200
Tobs
= 20 °C P420 Tobs
= 20 °C FRC
Sample position
0 25 50 75
Tobs
= 10 °C P420
Sample position
0 25 50 75
Tobs
= 10 °C FRC
Sample position
0 25 50 75 100
<I>
T / k
Hz
Figure 29 Variations of the time-averaged scattering intensity, IT, with sample position at 4 different
observation temperatures 30, 25, 20, 10 °C, for P420-6.5 and analogous FRC-6.5 hydrogels. The solid
line represents the ensemble-averaged scattered intensity, IE. The fluctuating component of the
scattering intensity, IFT, is represented by the dashed line, 90°.
The intensities of the fluctuating data, IFT, from Figure 28 and Figure 29 are shown in the
Table 8. As mentioned above, IFT values are nearly same for both PC and analogous FRC
gels at all observation temperatures.

Results and Discussion
74
Table 8 Intensity values of the fluctuating, IFT, part at different observation temperatures.
Tobs.
IFT (P420-6.5)
IFT (FRC-6.5)
analogous to P420
IFT
(P1120-6.5)
IFT (FRC-6.5)
analogous to P1120
°C kHz kHz kHz kHz
30
38.25
36.07
30.50
30.35
25
18.94
17.91
16.07
18.62
20
13.36
13.11
11.40
13.44
15
9.88
8.62
7.66
9.03
Figure 30 presents the ensemble-average scattering intensities for all the PC and FRC gel
pairs. Increasing the observation temperature increases the ensemble-average scattering
intensities and the standard deviations of all gel samples. The standard deviation gives us
information about the range of IT values on the speckle pattern measured at 100 positions
and hence about the structural inhomogenity. In Figure 30a, IE and its standard deviation for
P420-5 and analogous FRC-5 gel samples are given. FRC-5 is more inhomogeneous than
P420-5, but only slightly. When the polymer concentration increases the inhomogeneity of the
P420-6.5 gel becomes higher than the analogous FRC-6.5 gel as it can be seen in Figure 30b.
The ensemble-average scattering intensity of the P420 gels remains nearly constant with
increasing polymer concentration whereas the ensemble-average scattering intensity of FRC
gels decreases i.e. FRC-5 gel has higher IE than FRC-6.5. A critical polymer network
concentration was found where the degree of inhomogeneity in PAAm gels formed by free
radical reaction attains a maximum value [135]. This phenomenon was explained as a result
of two opposite effects of the initial monomer concentration on the gel inhomogeneity.
Increasing monomer concentration increases both effective cross-link density and polymer
concentration of the hydrogels. While the inhomogeneity becomes more pronounced due to
the first effect, the latter effect decreases the apparent gel inhomogeneity. The theory
proposed by PANYUKOV and RABIN also predicts the appearance of a maximum degree of
spatial gel inhomogenity at a critical polymer network concentration [10]. The intensity of the
ensemble-average increases significantly for the case of PC gels formed by high molecular
weight polymer. As can be seen from Figure 30c-d the photo gels P1120-5 and P1120-6.5
show significantly higher ensemble-average intensities and standard deviations than the photo

Results and Discussion
75
gels P420 due to the higher molecular weight of the starting copolymer, PNIPA-DMMI. This
behavior is due to the fact that increasing the molecular weight of the copolymer while the
relative amount of DMMI units stays constant (1%) results in a higher probability of
intermolecular interactions between the DMMI units. Hence, cross-links are formed easier.
This effect is also seen in the efficiency of cross-linking from the rheology results (Table 7).
But these interactions can also cause agglomerations i.e. clusters, in the sol state which
diminish the dissolution process of the copolymer. This can also be another reason of speckle
pattern formation in the sol state for the P1120-6.5 sample. On the other side, as mentioned
before, the polymer concentrations of the P1120-5 and P1120-6.5 gels are 7.5 and 10 times
higher than the overlap concentration (c* = 0.016 g/ml) which means excessive
entanglements of the chains. The solutions of these gels have already quite high polymer
concentration which results in rather high intensities of ensemble-averages and standard
deviations for P1120 gels.
0 10 20 30
<I>
E /
kH
z
P1120-6.5
FRC-6.5
0 10 20 30
P420-6.5
FRC-6.5
0 10 20 30
P1120-5
FRC-5
Tobs. / °C
0 10 20 300
40
80
120
160
200
240
P420-5
FRC-5
Tobs. / °CTobs. / °CTobs. / °C
(a) (b) (c) (d)
Figure 30 Ensemble-average intensity, IE, and standard deviations of all pairs of gels, plotted against
the observation temperature 10°C ≤ Tobs. ≤ 30°C. Note that the observation temperatures of the FRC
gels are shifted 1 °C to see the results clearly.
The P1120-5 gel shows higher inhomogeneity than the analogous FRC-5 gel except at 30 °C.
Increasing the polymer concentration from P1120-5 to P1120-6.5 raises the ensemble-average
intensity and standard deviation significantly. Concerning P1120-6.5 and analogous FRC-6.5
gels, there is quite a big difference in the intensity of ensemble-averages and standard
deviations between both types of gels. The P1120-6.5 gel is considerably more
inhomogeneous than the analogous FRC-6.5 gel.

Results and Discussion
76
The copolymer shows easier dissolution if its molecular weight as well as the concentration is
decreased. Hence, more homogenous solutions are obtained in general for lower Mw. Those
solutions should give also more homogeneous gels after cross-linking. Since P420 gel
samples are more homogenous than P1120 gel samples it is better to compare
inhomogeneities of the free radical gels to those of P420 gels.
It is observed that the molecular weight of the copolymer plays an important role in
determining the microstructure of the gel networks. The PC gels formed by the high
molecular weight copolymer (P1120 gels) are significantly more inhomogeneous than their
analogous FRC gels. However, the PC gels formed by the relatively low molecular weight
copolymer (P420 gels) have nearly the same structural inhomogeneity as their analogous FRC
gels. Actually, the results that are obtained from the dynamic light scattering experiments
were not expected because photo cross-linking gels are predicted to be spatially more
homogeneous than gels synthesized by free radical cross-linking mechanisms.
5.2.3.2 Static Light Scattering
SLS is also utilized to compare the homogeneity of both types of gels. To obtain correct
spatial averaging across the sample, successive measurements at 5 different positions were
made by turning the sample. Figure 31 demonstrates the total scattering intensity, R(q), vs. the
square of scattering vector, q2, for the P1120 gels and their analogous FRC gels at observation
temperatures between 10 °C ≤ Tobs. ≤ 30 °C. Dynamic light scattering measurements showed
that photo cross-linking gels are less homogenous than free radical cross-linking gels in the
case of this study. As can be seen here, the same explanation holds true for the results
obtained by static light scattering measurements. Since photo gels have DMMI units which
make them less sensitive to the increasing temperature, the total scattering intensity, R(q), of
free radical gels increases more strongly with raising temperature. This behavior is also seen
in DLS measurements when the data are analyzed thoroughly. DMMI becomes more soluble
with increasing temperature unlike NIPA and two contrary behaviors occur in the photo gel
state. This leads to less increase of R(q) of photo gels (P1120) with raising temperature. From
the graphs it is clearly seen that there is a strong angular dependency for the photo cross-
linking gels which indicates inhomogeneity of the networks. The total scattering intensity of
the FRC-5 sample is higher than that of the FRC-6.5 sample due to the critical value of initial
monomer concentration [135] which is also observed from DLS results. Note that R(q)
reflects only the scattering intensity of gel, it doesn’t give information about the change of

Results and Discussion
77
scattering upon gelation. The P1120-5 gel is more homogeneous than the P1120-6.5 gel as
expected. It doesn’t show strong angular dependence like the P1120-6.5 gel due to the low
polymer concentration. The total scattering intensity of the P1120-5 gel is quite similar to its
analogous FRC-5 gel except for Tobs. = 10 °C. As mentioned above the temperature changes
affect the P1120 gels less than FRC gels, so at low temperatures FRC gels are more
homogeneous than PC gels but with increasing temperature the total intensity of FRC gels
comes closer to that of the PC gels. The total scattering intensity of the P1120-6.5 gel has
quite strong angular dependency when compared to the analogous FRC-6.5 gel. It is observed
that the inhomogeneity of the P1120-6.5 gel is considerably higher than the analogous FRC-
6.5 gel.
2e+10 4e+10
Tobs.
= 25 oC
2e+10 4e+10 2e+10 4e+10 6e+10
R(q
).1
03/ c
m-1
P1120 - FRC
q2 / cm
-2
2e+10 4e+10
0.0
1.5
3.0
4.5
Tobs.
= 30 oC T
obs. = 20
oC T
obs. = 10
oC
q2 / cm
-2q
2 / cm
-2q
2 / cm
-2
Figure 31 Total scattering intensities, R(q), of P1120 and analogous FRC hydrogels are plotted versus
square of the scattering vector, q2, at different measurement temperatures Tobs. (▲) P1120-5,
(▼) P1120-6.5, (∆) FRC-5, () FRC-6.5.
The total scattering intensities of P420 gels and their analogous FRC gels are also plotted vs.
the square of the scattering vector in Figure 32. The static light scattering results of these gels
also fit quite well with those of the dynamic light scattering measurements. The angular
dependency is less pronounced in the case of the P420 hydrogels and the intensity of the
scattering light is quite similar for both PC and FRC gels at all the temperatures except
Tobs. = 30 °C. The scattering intensity of the FRC-5 gel is again higher than that of the FRC-
6.5 gel due to the effect of the critical initial monomer concentration.

Results and Discussion
78
P420 - FRC
q2 / cm
-2
2e+10 4e+10
R(q
).10
3 / c
m-1
Tobs.
= 20 °CTobs.
= 25 °C
q2 / cm
-2
2e+10 4e+10
Tobs.
= 10 °C
q2 / cm
-2
2e+10 4e+10 6e+10
Tobs.
= 30 °C
q2 / cm
-2
2e+10 4e+100.0
0.4
0.8
1.2
FRC-6.5
FRC-5
P420-5
P420-6.5
Figure 32 Total scattering intensities, R(q), of P420 and analogous FRC hydrogels plotted versus the
square of the scattering vector, q2, at different measurement temperatures, Tobs..
In the beginning it is assumed that photo cross-linking gels are more homogeneous than free
radical cross-linking gels. Since photo gels are cross-linked from linear polymer and can react
only from DMMI units, formation of more homogeneous gels are expected. However, this
assumption is not supported by the results which are obtained from the static and dynamic
light scattering experiments. This is because of the high molecular weight of the copolymers
that were synthesized in the beginning.he solutions of these polymers were already dense
and inhomogeneous so the PC gels that are obtained from these polymer solutions are not
more homogeneous than FRC gels.
5.2.3.3 Data Evaluation
The absolute scattered intensities that are obtained from DLS and SLS alone are not sufficient
to understand the spatial inhomogeneity of gels. Higher intensity cannot be exactly attributed
to a more inhomogeneous network structure. Hence, relative terms are compared to gain a
better understanding. As a measure of network inhomogeneity, the ratio of the fluctuating part
of the network intensity, IFT, and the corresponding ensemble-average intensity, IE, which
are obtained from DLS measurements is used. (eq. 52)
10E
TF
I
I (52)

Results and Discussion
79
The highest value, one, represents the fully fluctuating, ergodic system without any frozen-in
components having an ideal homogeneous network structure that is not obtainable for real
networks. The lowest value, zero, indicates networks being entirely frozen without any
fluctuating component.
Figure 33 shows IFT/ IE values from all the photo gels and analogous free radical gels
versus observation temperatures. P420 samples and analogous FRC samples are given at the
left hand side and P1120 samples and analogous FRC samples are given at the right hand side.
Except for the P1120 gels, all other gels demonstrate a tendency of decreasing homogeneity
(IFT / IE) with increasing temperature as expected. P420 gels and analogous FRC gels
exhibit quite homogenous network structure at Tobs. = 10 °C. The ratio of IFT / IE is pretty
close to one which corresponds to a nearly ideal homogeneous gel structure. One can also see
that the homogeneity of P420 gels and their analogous FRC gels is similar at all temperatures.
For the P1120-6.5 gel, the homogeneity seems to increase with increasing temperature from
10 to 30 °C. As mentioned in chapter 4.2.2.1, with increasing Mw and polymer concentration
intermolecular hydrophobic interactions between DMMI units increase. Dissolution of DMMI
increases with raising temperature contrary to PNIPA and this causes two contrary behaviors.
Especially for the P1120-6.5 gel, the effect of DMMI units upon the temperature increase
seems more dominant than the effect of deteriorating solvent quality of the PNIPA chains
giving more homogenous gels at higher temperatures. In the right graph of Figure 33, it can
be clearly seen that P1120 gels are more inhomogeneous than their analogous FRC gels
except for Tobs. = 30 °C.

Results and Discussion
80
P1120 - FRC
5 10 15 20 25 30 35
0.0
0.2
0.4
0.6
0.8
1.0
5 10 15 20 25 30 35
<I>
F /
<I>
E
0.0
0.2
0.4
0.6
0.8
1.0
Tobs. / °C
<I>
F /
<I>
E
P420 - FRC
Tobs. / °C
Figure 33IFT/ IE of the all gel samples are plotted vs. observation temperature, Tobs.. Left
hand side: comparison of P420 with analogous FRC gels; (■) P420-6.5, (□) FRC-6.5, (▲) P420-5, (∆)
FRC-5; right hand side: comparison of P1120 with analogous FRC gels; (■) P1120-6.5, (□)
FRC-6.5, (▲) P1120-5, (∆) FRC-5.
The results that are obtained from IFT/ IE values fit well with the DLS and SLS results.
Homogeneity of P1120 gels dependence on the temperature seems clear from the relative
results.
5.2.3.4 Comparison of DLS and SLS of the FRC and PC gels
In the first part of this study it is shown that SLS and DLS results agree well and two
experimental approaches are equivalent for the free radical PNIPA gels. Intensity of static
scattering values from SLS and DLS results were also compared in the case of PC and
analogous FRC gels. Note that IC corresponds to RC which describes only the frozen part of
the gel network; IC = IE IFT. Equation 51 is applied in order to convert the values
obtained by DLS in the same order of SLS values. The total scattering intensity values of the
gels are already shown above. Figure 34 depicts a comparison of the temperature dependences
of the scattering intensities (IC, RC) measured by SLS and DLS for the P420 gels and their
analogous FRC gels at the angle 90°. In Figure 34a and 34b SLS and DLS values of the
analogous FRC-5 gel seem fairly identical while for the P420-5 gel, SLS and DLS values do
not seem similar. It is also shown that FRC-5 gel exhibits higher static intensity than P420-5
gel in both DLS and SLS measurements at 25 and 30 °C. (No data for P420-5 gel from SLS at
10 °C was obtained due to some experimental errors). In Figure 34c and 34d static intensity
values of the analogous FRC-6.5 gel from SLS and DLS results seem nearly identical while

Results and Discussion
81
these intensity values do not seem similar in the case of P420-6.5 gel. Static intensities of the
P420-6.5 gel from DLS results are higher than from SLS results. Furthermore frozen
intensities of P420-6.5 gel are a bit higher than those of the analogous FRC-6.5 gel nearly at
all temperatures.
In general the static intensities, IC and RC, of both type of gels from SLS and DLS show a
similar behavior with increasing temperature.
Figure 34 Comparison of the static scattering intensities measured at 90° by DLS (IC) and SLS (RC) as
a function of observation temperature for P420-5 gel and analogous FRC-5 gel; (a), (b) and P420-6.5
gel, FRC420-6.5 gel; (c), (d). Open symbols represent the FRC gels while closed symbols show the
P420 gels.
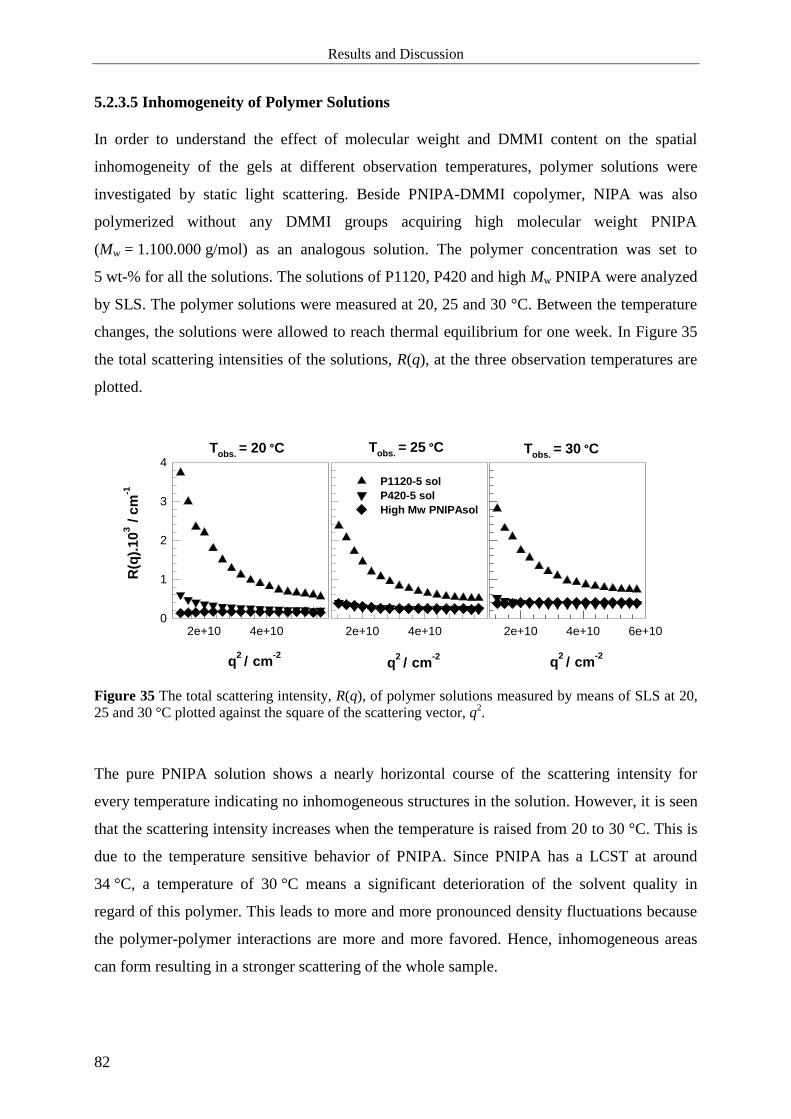
Results and Discussion
82
5.2.3.5 Inhomogeneity of Polymer Solutions
In order to understand the effect of molecular weight and DMMI content on the spatial
inhomogeneity of the gels at different observation temperatures, polymer solutions were
investigated by static light scattering. Beside PNIPA-DMMI copolymer, NIPA was also
polymerized without any DMMI groups acquiring high molecular weight PNIPA
(Mw = 1.100.000 g/mol) as an analogous solution. The polymer concentration was set to
5 wt-% for all the solutions. The solutions of P1120, P420 and high Mw PNIPA were analyzed
by SLS. The polymer solutions were measured at 20, 25 and 30 °C. Between the temperature
changes, the solutions were allowed to reach thermal equilibrium for one week. In Figure 35
the total scattering intensities of the solutions, R(q), at the three observation temperatures are
plotted.
Tobs.
= 20 °C
2e+10 4e+100
1
2
3
4
q2 / cm
-2
R(q
).10
3 /
cm
-1
2e+10 4e+10
P1120-5 sol
P420-5 sol
High Mw PNIPAsol
Tobs.
= 25 °C
q2 / cm
-2
2e+10 4e+10 6e+10
q2 / cm
-2
Tobs.
= 30 °C
Figure 35 The total scattering intensity, R(q), of polymer solutions measured by means of SLS at 20,
25 and 30 °C plotted against the square of the scattering vector, q2.
The pure PNIPA solution shows a nearly horizontal course of the scattering intensity for
every temperature indicating no inhomogeneous structures in the solution. However, it is seen
that the scattering intensity increases when the temperature is raised from 20 to 30 °C. This is
due to the temperature sensitive behavior of PNIPA. Since PNIPA has a LCST at around
34 °C, a temperature of 30 °C means a significant deterioration of the solvent quality in
regard of this polymer. This leads to more and more pronounced density fluctuations because
the polymer-polymer interactions are more and more favored. Hence, inhomogeneous areas
can form resulting in a stronger scattering of the whole sample.
Results and Discussion
83
The P420-5 solution which has lower molecular weight than the other two polymers shows
nearly the same behavior with the pure PNIPA solution. The total scattering intensity
increases with increasing temperature as expected. But there is also slight angular dependence
of the scattering intensity. In general, samples that show a distinct dependence of the
scattering intensity on the measuring angle are known to possess a certain spatial
inhomogeneity at a length scale /20 nm. The solution of P1120-5 shows a strong angular
dependence at all temperatures. This strong angular dependence indicates large
inhomogeneous regimes in the polymer solution. The expected increase of the total scattering
intensity on raising temperature is not observed clearly. It seems that this typical behavior of
PNIPA is superimposed by another effect. Compared to the high molecular weight pure
PNIPA solution, P1120-5 solution just differs in the incorporation of 1 mol-% DMMI units. It
is obvious that different scattering behavior is due to the statistically introduced DMMI units.
It can be assumed that the P1120-5 solution was not completely dissolved at all observation
temperatures because of attractive interactions between the DMMI units which result in
agglomerated regimes in the solution. These areas cause pronounced density fluctuations in
the solution resulting in a higher scattering intensity compared to homogeneous solutions.
Thus it can be concluded that the results obtained from P1120 copolymer solutions and gels
should be treated carefully. For more reliable comparisons it is better to use the P420
copolymer because it shows a similar scattering behavior as the pure PNIPA.
5.2.3.6 Influence of Observation Temperature on Correlation Length
Dynamic light scattering gives useful information about the dynamics of polymer solutions
and gels. In diluted solutions, the self diffusion coefficient, Ds, can be determined. It describes
the dynamic behavior of unperturbed molecules due to Brownian motion. After reaching the
overlap concentration, no more individual information like the self diffusion coefficient can
be obtained, but from this point on, a so called cooperative diffusion coefficient, D, can be
determined by DLS. The dynamic correlation length is connected to the cooperative diffusion
coefficient, D, as shown in eq. 36.

Results and Discussion
84
In the case of polymer gels this dynamic correlation length, , can be related to the networks
strands between junction points defining the whole mesh. Figure 36 shows the dependence of
the cooperative diffusion coefficient, D, on observation temperature for the P1120 and P420
copolymer gels as well as for the analogous FRC gels.
Figure 36 Cooperative diffusion coefficients, D, plotted against observation temperature, Tobs.. Left
hand side; P1120 gels and their analogous FRC gels, right hand side; P420 gels and their analogous
FRC gels.
In all cases, the gels formed at higher concentrations show higher diffusion coefficients, D,
meaning smaller spacings between cross-links. Since the length scale is quite small, nearly no
difference is observed by comparing the PC gels to the FRC gels. It can be seen clearly that
all curves show a sharp decrease of the diffusion coefficient with increasing observation
temperature from 25 to 30 °C. This decrease is related to the fact that all systems are
approaching the critical temperature typical for PNIPA polymers. At this temperature the
hydrodynamic screening length, , diverges and so the cooperative diffusion coefficient, D,
decreases drastically. It is important to understand that at temperatures close the LCST of a
polymer, the hydrodynamic screening length, , is no longer associated to the actual mesh size
of the polymer gel but it rather reflects the spatial extent of concentration fluctuations of the
network. Only at temperatures far below this critical temperature, the hydrodynamic screening
length is related to the network strands.

Summary and Conclusion
85
6 Summary and Conclusion
This study is composed of two parts. In the first part variations of the static and dynamic
components of the time-average and ensemble-average scattering intensities from PNIPA gels
synthesized by conventional FRC were analyzed as a function of temperature. SLS and DLS
results of the hydrogels were also compared and results fit perfectly together. All methods
investigated yield consistent results and, in the first place, confirm the well-known fact that
the static component raises strongly with increasing the cross-link density.
The results showed that contrary to the common assumption, the static component of the
ensemble-average scattering intensity strongly depends on the observation temperature below
the LCST. The increase of the thermal scattering is expected, of course, because thermal
fluctuations become stronger when the LCST is approached. However, the static component
of scattering intensity is affected by temperature to an even greater extent. This behavior is
interpreted by assuming local swelling equilibrium in a gel whose cross-link density features
some inhomogeneity. Equilibrium swelling is controlled by two competing factors, osmotic
pressure and chain elasticity. The osmotic pressure of a semi-dilute polymer solution given by
the FLORYHUGGINS equation scales, to a first approximation, with excluded volume, or
(12), where is the Flory interaction parameter. For PNIPA, increases with temperature
and approaches 0.5 near the LCST. Hence, the osmotic pressure decreases with raising
temperature, while the chain elasticity remains essentially constant. This means that upon
raising the temperature, more densely cross-linked regions deswell at the expense of the less
densely cross-linked ones. Accordingly, the scattering contrast is enhanced thus leading to a
larger static scattering intensity, as first pointed out by TANAKA et al [13]. By following this
argument it is supposed that both parts of the scattering intensity are governed by
thermodynamic quantity, namely quality of the solvent. However, different dependencies
apply thus leading to the fact that the static scattering seems to be slightly more sensitive to
temperature than the fluctuating part of the scattering intensity. The interpretation based on
local swelling equilibrium is in accordance with the view that polymer gels possess restricted
ergodicity [10]. They have an inhomogeneous distribution of cross-links, but their density
inhomogeneity is not fixed. Rather it is dependent on the establishment of local swelling
equilibrium controlled by a distinct network topology.

Summary and Conclusion
86
In the second part of this study inhomogeneities of PNIPA gels prepared at Tprep = 25 °C via
photo cross-linking reaction starting from linear PNIPA chains modified with DMMI
functionalities and their analogous FRC gels starting from NIPA monomers were compared at
different observation temperatures. The main difference between these two systems is the
cross-linking process. The PC gels are formed by random cross-linking which is supposed to
form homogeneous network structures. In contrast, FRC is generally assumed to yield more
inhomogeneous networks due to the formation of highly cross-linked clusters in the beginning
of the reaction. Two different linear polymers having different molecular weights, Mw, were
used for the PC process. At first the macroscopic mechanical behavior of the hydrogels, i.e.
the elastic modulus, was investigated. It was important to obtain the same elastic modulus for
both PC and FRC gels before comparing their microscopic structure by means of light
scattering methods. It was shown that FRC gels reach their steady state value of G' after 10
min while PC systems need more than 9 hours to level off. After finding the same elastic
modulus, hydrogels were analyzed concerning their microstructure.
Dynamic light scattering experiments showed that increasing the observation temperature
increases all the scattering values of both types of gels. Raising the molecular weight, Mw, of
the initial copolymer leads to an increase in the scattering intensity of PC gels and shows a
pronounced speckle pattern. In the first study, the non-ergodic method and partial heterodyne
method were applied and they both showed the same results for PNIPA gels. In the second
part of this study only the non-ergodic method was used to analyze the PC and FRC gels. It
was found that the PC gel that is synthesized by using a high molecular weight and high
polymer concentration (P1120-6.5) is more inhomogeneous than its analogous FRC gel. PC
gels starting from relatively low molecular weight polymers (P420) generally show nearly the
same scattering behavior as their analogous FRC gels. In general, static light scattering results
fit well with dynamic light scattering results. In the case of PC gels starting from low
molecular weight (P420) and their analogous FRC gels, the total scattering intensity, R(q),
increases significantly with increasing observation temperature. At low temperatures P420
gels and their analogous FRC gels show nearly same scattering intensity. A slight separation
of the scattering intensities is observed at Tobs. = 30 °C but it can still be concluded that PC
gels are not more or less inhomogeneous than FRC gels. All the analogous FRC-5 gels
showed higher scattering intensity than FRC-6.5 gels due to the critical polymer network
concentration which leads to a decrease of the scattering intensities by increasing polymer
concentrations. In addition SLS and DLS results of the PC and FRC gels were compared as a
function of observation temperature. In the case of FRC gels SLS and DLS results fit well

Summary and Conclusion
87
together whereas PC gels show a slight difference. DLS values of PC gels are generally a bit
higher than their SLS values.
A strong angular dependence is obtained in case of the P1120-6.5 gel indicating a remarkable
inhomogeneity. In order to understand the scattering behavior thoroughly, corresponding
polymer solutions of the gels were also examined by means of SLS. The high molecular
weight polymer solution which belongs to the P1120-5 gel explicitly shows a strong angular
dependency and a high scattering intensity at any observation temperature. The corresponding
solutions of these P1120 gels were already inhomogeneous before the cross-linking process.
The comparison of the PC gels that were formed from the low molecular weight copolymer to
the FRC gels yielded more reliable results.
In the beginning of the study it was supposed that PC gels are more homogenous than FRC
gels since PC gels are cross-linked randomly. In contrast to the general assumption the results
of this study showed that the formed PC gels are not more homogenous than their analogous
FRC gels. On the other hand the strong dependence of the inhomogeneity on the Mw of the
linear polymer precursors is revealed. Increasing Mw of a polymer and solutions as well
increases the inhomogeneity of the PC gels.
For the following studies it would be desirable to use copolymers carrying cross-linker groups
with molecular weights below 1.000.000 g/mol. It is supposed that these preformed polymers
form more homogeneous solutions before starting the cross-linking process.

References
88
7 References
[1] Funke, W.; Okay, O.; Joos-Muller, B. Adv. Polym. Sci., 1998, 136, 139-234.
[2] Okay, O. Progr. Polym. Sci., 2000, 25, 711-779.
[3] Bastide, J.; Candau, S.J. in: Cohen Addad, J.P; editor. Physical Properties of Polymeric
Gels. Wiley: London, 1996, p. 143.
[4] Debye, P.; Bueche, A. M. J. Appl. Phys., 1949, 20, 518-525.
[5] Bueche, F. J. Colloid Interface Sci., 1970, 33, 61-66.
[6] Soni, V. K.; Stein, R. S. Macromolecules, 1990, 23, 5257-5265.
[7] Bastide, J.; Leibler, L. Macromolecules, 1988, 21, 2647-2649.
[8] Panyukov, S.; Rabin, Y. Phys. Rep., 1996, 269, 1-131.
[9] Horkay, F.; Hecht, A. M.; Geissler, E. J. Chem. Phys., 1989, 91, 2706-2711.
[10] Panyukov, S.; Rabin, Y. Macromolecules, 1996, 29, 7960-7975.
[11] Rabin, Y.; Panyukov, S. Macromolecules, 1997, 30, 301-312.
[12] Ikkai, F.; Shibayama, M. Phys. Rev. Lett., 1999, 82, 4946-4949.
[13] Matsuo, E.S.; Orkisz, M.; Sun, S.-T.; Li, Y.; Tanaka, T. Macromolecules, 1994, 27,
6791-6796.
[14] Shibayama, M.; Takata, S.-I.; Norisuye, T. Physica A, 1998, 249, 245-252.
[15] Joosten, J. G. H.; McCarthy, J. L.; Pusey, P.N. Macromolecules, 1991, 24, 6690-6699.
[16] Moussaid, A.; Candau, S. J.; Joosten, J. G. H. Macromolecules, 1994, 27, 2102-2110.
[17] Pusey, P. N.; van Megen, W. Physica A, 1989, 157, 705-741.
[18] Boutris, C.; Chatzi, E. G.; Kiparissides, C. P. Polymer, 1997, 38, 2567-2570.
[19] Okada, Y.; Tanaka, F. Macromolecules, 2005, 38, 4465-4471.
[20] Kawaguchi, T.; Kobayashi, K.; Osa, M.; Yoshizaki, T. J. Phys. Chem. B, 2009, 113,
5440-5447.
[21] Arndt, K. -F.; Schmidt, T.; Richter, A.; Kuckling, D. Macromol. Symp., 2004, 207, 257-
268.
[22] Richter, A.; Howitz, S.; Kuckling, D.; Arndt, K. -F. Sensors Actuat. B, 2004, 99, 451-
458.
[23] Ballauf, M.; Lu, Y. Polymer, 2007, 48, 1815-1823.
[24] Takata, S.; Norisuye T.; Shibayama, M. Macromolecules, 2002, 35, 4779-4784.
[25] Shibayama, M.; Shirotani Y.; Shiwa, Y. J. Chem. Phys., 2000, 112, 442-449.
[26] Shibayama, M. Polymer J., 2011, 43, 18-34.
[27] Shibayama, M.; Takata, S.; Nakamoto, C. Macromol. Symp., 2004, 207, 31-36.

References
89
[28] Shibayama, M.; Isono, K.; Okabe, S.; Karino, T.; Nagao, M. Macromolecules, 2004, 37,
2909-2918.
[29] Shibayama, M.; Kawakubo, K.; Norisuye, T. Macromolecules, 1998, 31, 1608-1614.
[30] Ikkai, F.; Shibayama, M. J. Polym. Sci. B: Polym. Phys., 2005, 43, 617-628.
[31] Zhao, Y.; Zhang, G.; Wu, C. Macromolecules, 2001, 34, 7804-7808.
[32] Zhao, Y.; Yang, Y.; Wu, C. Macromolecules, 2003, 36, 855-859.
[33] Koizumi, S.; Monkenbusch, M.; Richter, D.; Schwahn, D.; Farago, B. J. Chem. Phys.,
2004, 121, 12721-12731.
[34] Joosten, J. G. H.; Gelade, E. T. F.; Pusey, P. N. Phys. Rev. A, 1990, 42, 2161-2173.
[35] Shibayama, M. Macromol. Chem. Phys., 1998, 199, 1-30.
[36] Fang, L.; Brown, W. Macromolecules, 1992, 25, 6897-6903.
[37] Tanaka, T.; Hocker, L. O.; Benedek, G. B. J. Chem. Phys., 1973, 59, 5151-5159.
[38] Rodd, A. B.; Dunstan, D. E.; Boger, D. V.; Schmidt, J.; Burchard, W. Macromolecules,
2001, 34, 3339-3352.
[39] Flory, P. J. J. Chem. Phys., 1942, 10, 51.
[40] Flory, P. J. Principles of Polymer Chemistry; Cornell University Press: Ithaka, New
York, 1953.
[41] Hildebrand, J. H.; Scott, R.L. The Solubility of Nonelectrolytes, 3rd
ed.; Van Nostrand
Reinhold: New York, 1959.
[42] De Gennes, P. G. Scaling Concepts in Polymer Physics; Cornell University Press: Ithaca
and London, 1979.
[43] Ying, Q.; Chu, B. Macromolecules, 1987, 20, 362.
[44] Des Cloizeaux, J.; Jannink, G. Polymers in solution; Their modeling and structure;
Clarendon Press: Oxford, 1990.
[45] Brandrup, J.; Immergut, E. H.; Grulke, E. A., editors. Polymer Handbook, 4th
ed.; Wiley:
New York, 1999.
[46] M. Doi, M.; Edwards, S.F. The theory of polymer dynamics, Clarendon Press: Oxford,
1989.
[47] Rubinstein, M.; Colby, R. Polymer Physics; Oxford University Press: New York, 2008.
[48] Costa, R. O. R.; Freitas, R. F. S. Polymer, 2002, 43, 5879-5885.
[49] Gil, E. S.; Hudson, S. M. Prog. Polym. Sci., 2004, 29, 1173-1222.
[50] Zhang, Y. J.; Furyk, S.; Bergbreiter, D. E.; Cremer, P. S. J. Am. Chem. Soc., 2005, 127,
14505-14510.

References
90
[51] Zhang, Y.; Furyk, S.; Sagle, L. B.; Cho, Y.; Bergbreiter, D. E.; Cremer, P. S.
J. Phys. Chem. C, 2007, 111, 8916-8924.
[52] Furyk, S.; Zhang, Y. J.; Ortiz-Acosta, D.; Cremer, P. S.; Bergbreiter, D. E.
J. Polym. Sci. Pol. Chem., 2006, 44, 1492-1501.
[53] Sagle, L. B.; Zhang, Y. J.; Litosh, V. A.; Chen, X.; Cho, Y.; Cremer, P. S.
J. Am. Chem. Soc., 2009, 131, 9304-9310.
[54] Gurau, M. C.; Lim, S. M.; Castellana, E. T.; Albertorio, F.; Kataoka, S.; Cremer,
P. S. J. Am. Chem. Soc., 2004, 126, 10522-10523.
[55] LunaBarcenas, G.; Gromov, D. G.; Meredith, J. C.; Sanchez, I. C.; dePablo, J. J.;
Johnston, K. P. Chem. Phys. Lett., 1997, 278, 302-306.
[56] Ahmed, Z.; Gooding, E. A.; Pimenov, K. V.; Wang, L. L.; Asher, S. A. J. Phys. Chem. B,
2009, 113, 4248-4256.
[57] Meersman, F.; Wang, J.; Wu, Y. Q.; Heremans, K. Macromolecules, 2005, 38,
8923-8928.
[58] ten Wolde, P. R.; Chandler, D. Proceedings of the National Academy of Sciences
of the United States of America (PNAS), 2002, 99, 6539-6543.
[59] Paricaud, P.; Galindo, A.; Jackson, G. Mol. Phys., 2003, 101, 2575-2600.
[60] Smith, G. D.; Bedrov, D. J. Phys. Chem. B, 2003, 107, 3095-3097.
[61] Esteve, A.; Bail, A.; Landa, G.; Dkhissi, A.; Brut, M.; Rouhani, M. D.; Sudor, J.;
Gue, A. M. Chem. Phys., 2007, 340, 12-16.
[62] Jones, R. A. L. Soft Condensed Matter; Oxford University Press: Oxford, 2002.
[63] Lin, Y.G.; Mallin, D. T.; Chien, J. C. W.; Winter, H. H. Macromolecules, 1991, 24,
850‐854.
[64] Gilbert, M. J. M.S‐Rev. Macromol. Chem. Phys., 1994, C34, 77‐135.
[65] Kleppinger, R.; van Es, M.; Mischenko, N.; Koch, M. H. J.; Reynaers, H.
Macromolecules, 1998, 31, 5805‐5809.
[66] Sato, T.; Watanabe, H.; Osaki, K. Macromolecules, 2000, 33, 1686‐1691.
[67] Crne, M.; Park, J. O.; Srinivasarao, M. Macromolecules, 2009, 42, 4353-4355.
[68] Itagaki, H.; Takahashi, I. Macromolecules, 1995, 28, 5477‐5486.
[69] Shibayama, M. Macromol. Chem. Phys., 1998, 199, 1‐30.
[70] Orakdogen, N.; Kizilay, M. Y.; Okay, O. Polymer, 2005, 46, 11407-11415.
[71] Stein, R. S. J. Polym. Sci.: Polym. Lett., 1969, 7, 657-660.
[72] Jong, L.; Stein, R. S. Macromolecules, 1991, 24, 2323-2329.
[73] Oppermann, W.; Lindemann, B.; Vögerl, B. Polym. Preprints, 2000, 41, 700.

References
91
[74] Schröder, U.P.; Oppermann, W. Makromol. Chemie, Macromol. Symp., 1993, 76, 63.
[75] Okay, O.; Kurz, M.; Lutz, K.; Funke, W. Macromolecules, 1995, 28, 2728.
[76] Okay, O. Nagash, H. J.; Capek, I. Polymer, 1995, 36, 2413.
[77] Cerid, H.; Okay, O. Eu. Polym. J., 2004, 40, 579‐587.
[78] Keskinel, M.; Okay, O. Polym. Bull., 1998, 40, 491-498.
[79] Dusek, K.; Duskova-Smrckova, M. Prog. Polym. Sci., 2000, 25, 1215-1260.
[80] Dusek, K. In Polymer Networks; Stepto, R. F. T., Ed.; Blackie Academic & Professional:
London, 1998, p 64.
[81] Liu, R. G.; Oppermann, W. Macromolecules, 2006, 39, 4159-4167.
[82] Shibayama, M. Bull. Chem. Soc. Jpn., 2006, 79, 1799-1819.
[83] Proctor, A. D.; Gilbert, A.; Mitchell, G. R. Makromolekulare Chemie – Macromol.
Chem. Phys., 1992, 193, 1499-1508.
[84] Jones, J. R.; Liotta, C. L.; Collard, D. M.; Schiraldi, D. A. Macromolecules, 2000, 33(5),
1640-1645.
[85] Schinner, R.; Wolff, T.; Kuckling, D. Berichte der Bunsen-Gesellschaft-Phys. Chem.
Chem. Phys., 1998, 102, 1710-1714.
[86] Schinner, R.; Wolff, T. Colloid. Polym. Sci., 2001, 279, 1225-1230.
[87] Hoffmann, F.; Wolff, T. J. Colloid Interface Sci., 2008, 322, 434-447.
[88] Kuznetsova, N. A.; Kaliya, O. L. Uspekhi Khimii, 1992, 61, 1243-1267.
[89] Ngai, T.; Wu, C. Macromolecules, 2003, 36, 848-854.
[90] Susoff, M.; Oppermann, W. Macromolecules, 2009, 42, 9195-9198.
[91] Seiffert, S.; Oppermann, W. Polymer, 2008, 49, 4115-4126.
[92] Zweifel, H. Photog. Sci. Eng., 1983, 27, 114-118.
[93] Finter, J.; Widmer, E.; Zweifel, H. Angew. Makromol. Chem., 1984, 128, 71-97.
[94] Berger, J.; Zweifel, H. Angew. Makromol. Chem., 1983, 115, 163-181.
[95] Gansel, J. Untersuchungen zur Dynamik in Polyacrylmid-Lösungen und –Gelen mittels
Fluoreszenzkorrelationsspektroskopie, Dissertation: Clausthal, 2009.
[96] Kuckling, D.; Vo, C. D.; Adler, H. J. P.; Volkel, A.; Colfen, H. Macromolecules, 2006,
39, 1585-1591.
[97] Seiffert, S.; Weitz, D. A. Soft Matter, 2010, 6, 3184-3190.
[98] Seiffert, S. Structure and Tracer Dynamics in Polyacrylamide Hydrogels, Dissertation:
Clausthal, 2007.
[99] Farnum, D. G.; Mostashari, A. J. Org Photochem Synth., 1971, 1, 103.
[100] Minsk, L. M.; Smith, I. G.; Wright, J. F. J. Appl. Polym. Sci., 1959, 2, 302.

References
92
[101] Rennert, J.; Ruggiero, E. M.; Rapp, J. Photochem. Photobiol., 1967, 6, 29.
[102] Tsuda, M. J. Chem. Soc. Jpn., 1969, 42, 905.
[103] Egerton, P. L.; Pitts, E.; Reiser, A. Macromolecules, 1981, 14, 95.
[104] Nakayama, Y.; Matsuda, T. J. Polym. Sci. A, 1992, 30, 2451.
[105] Coqueret, X. Macromol. Chem. Phys., 1999, 200, 1567.
[106] Schenck; G:O.; von Wilucki; I.; Krauch, C. H. Chem. Ber., 1962, 95, 1409.
[107] Hammond, G. S.; Stout, C. A.; Lamola, A. A. J. Am. Chem. Soc., 1964, 86, 3103.
[108] Chujo, Y.; Sada, K.; Saegusa, T. Macromolecules, 1990, 23, 2693.
[109] Ngai, T.; Wu, C. Macromolecules, 2003, 36, 848.
[110] De Schryver, F. C.; Feast, W. J.; Smets, G. J. Polym. Sci. A-1, 1970, 8, 1939.
[111] Zweifel, H. Photogr. Sci. Eng., 1983, 27, 114.
[112] Berger, J.; Zweifel, H. Angew. Makromol. Chem., 1983, 115, 163.
[113] Finter, J.; Haniotis, Z.; Lohse, F.; Meier, K.; Zweifel, H. Angew. Makromol. Chem.,
1985, 133, 147.
[114] Kuckling, D.; Adler, H. J. P.; Ling, L.; Habicher, W. D.; Arndt, K. F. Polym. Bull.,
2000, 44, 268.
[115] Kuckling, D.; Duan Vo, C.; Wohlrab, S. E. Langmuir, 2002, 18, 4263.
[116] Steinmetz, R. Fortschr. Chem. Forsch., 1967, 7, 445.
[117] Herkstroeter, W. G.; Lamola, A. A.; Hammond, G. S. J. Am. Chem. Soc., 1964, 86,
4537.
[118] Hammond, G. S.; Turro, N. J.; Leermakers, P. A. J. Phys. Chem., 1962, 66, 1144.
[119] Wilkinson, F. J. Phys. Chem., 1962, 66, 2569.
[120] Scharf, H. D. Fortschr. Chem. Forsch., 1969, 11, 216.
[121] Murov, S. L. Handbook of photochemistry, New York: Marcel Dekker Inc., 1973.
[122] Engel, P. S.; Monroe, B. M. Adv. Photochem., 1972, 8, 245.
[123] Lathioor, E. C.; Leigh, W. J. Photochem. Photobiol., 2006, 82, 291.
[124] Kronfeld, K. P.; Timpe, H. J. J. Prakt. Chem., 1988, 330, 571.
[125] Ferreira, G. C., Schmitt, C. C.; Neumann, M. G. J. Braz. Chem. Soc., 2006, 17, 905.
[126] Fouassier, J. P. Photoinitiation, photopolymerization and photocuring. Cincinnati:
Hanser Gardner, 1995.
[127] Allonas, X.; Ley, C.; Bibaut, C.; Jacques, P.; Fouassier, J. P. Chem. Phys. Lett., 2000,
322, 483.
[128] Lewis, F. D.; Saunders, W. H. J. Am. Chem. Soc., 1968, 90, 7033.
[129] Meier, K.; Zweifel, H. J. Photochem., 1986, 35, 353.

References
93
[130] Chu, B. Laser Light Scattering; Basic Principles and Practice, 2nd
ed.: Academic Press:
San Diego, 1991.
[131] Berne, B. J.; Pecora, R. Dynamic light scattering; Wiley: New York, 1976.
[132] Nie, J.; Du, B.; Oppermann, W. Macromolecules, 2004, 37, 6558‐6564.
[133] Shibayama, M.; Ikkai, F.; Shiwa, Y.; Rabin, Y. J. Chem. Phys., 1997, 107, 5227‐5235.
[134] Kuru, E. A.; Orakdogen, N.; Okay, O. Eu. Polym. J., 2007, 43, 2913‐2921.
[135] Kizilay, M. Y.; Okay, O. Macromolecules, 2003, 36, 6856‐6862.
[136] Abdurrahmanoglu, S.; Okay, O. J. Macromol. Sci. A. Pure Appl. Chem., 2008, 45, 769-
775.
[137] Berne, B. J.; Pecora, R. Dynamic Light Scattering, Dover Publ.; Mineola, New York,
2000, pp. 44-46.
[138] Hecht, A. -M.; Horkay, F.; Schleger, P.; Geissler, E. Macromolecules, 2002, 35, 8552-
8555.
[139] Geissler, E. in Dynamic Light Scattering; ed. W. Brown: Oxford University Press,
1993, pp. 471-511.
[140] Geissler, E.; Horkay, F.; Hecht A. -M. Phys. Rev. Lett., 1993, 71, 645-648.
[141] Orakdogen, N.; Okay, O. Polym. Bull., 2006, 57, 631-641.
[142] Ricka, J. Appl. Opt., 1993, 32, 2860-2875.
[143] Gisler, T.; Rüger, H.; Egelhaaf, S. U.; Tschumi, J.; Schurtenberger, P.; Ricka,
J. Appl. Opt., 1995, 34, 3546-3553.
[144] Norisuye, T.; Tran-Cong-Miyata, Q.;Shibayama, M. Macromolecules, 2004, 37, 2944-
2953.
[145] Schätzel, K. Appl. Opt., 1993, 32, 3880-3885.
[146] Mezger, T. G. Das Rheologie-Handbuch; Vol. 2, Vincentz Network: Hannover, 2007.
[147] Macosko, C. W. Rheology - Prinicples, Measurements, and Applications; VCH
Publishers: New York, 1994.
[148] Barnes, H. A. An Introduction to Rheology; Elsevier: New York, 1989.
[149] Winter, H. H. Polym Eng. Sci., 1987, 27, 1698‐1702.
[150] Scanlan, J. C.; Winter, H. H. Macromolecules, 1991, 24, 47‐54.
[151] Richter, S. Macromolecular Chemistry and Physics, 2007, 208, 1495-1502.
[152] Winter, H. H.; Mours, M. Neutron Spin Echo Spectroscopy Viscoelasticity Rheology,
1997, 134, 165-234.
[153] Ling, L.; Habicher, W. D.; Kuckling, D.; Adler, H. J. P. Des. Monom. Polym., 1999, 2,
351.

References
94
[154] Duan Vo, C.; Kuckling, D.; Adler, H. J. P.; Schönhoff, M. Colloid Polym. Sci., 2002,
280, 400.
[155] Pabon, M.; Selb, J.; Candau, F.; Gilbert, R. G. Polymer, 1999, 40, 3101.
[156] Fevola, M. J.; Hester, R. D.; McCormick, C. L. J. Polym. Sci.: Part A, 2003, 41, 560.
[157] Gupta, A.; Mukhtar, R.; Seltzer, S. J. Phys. Chem., 1990, 84, 2356.
[158] McCarthy, K. J.; Burkhardt, C. W.; Parazak, D. P. J. Appl. Polym. Sci., 1987, 33, 1699.
[159] Seiffert, S.; Oppermann, W.; Saalwächter, K. Polymer, 2007, 48, 5599-5611.
[160] Treloar, L. R. G. The Physics of Rubber Elasticity, 3rd
ed., Clarendon Press: Oxford,
UK, 1975.
[161] Naghash, H. J.; Okay, O. J. Appl. Polym. Sci., 1996, 60, 971.
[162] Patras, G.; Qiao, G. G.; Solomon, D. H. Macromolecules, 2001, 34, 6369.
[163] Susoff, M. Dynamik polymerer Sonden in halbverdünnten Polystyrol-Lösungen und
Gelen, Dissertation: Clausthal, 2009.

Curriculum Vitae
Name: Saadet Dogu
Address: August-Hölscher Str. 104
49080-Osnabrück
Mobile: 0049 176 38 95 1687
E-mail: [email protected]
Date, Place of Birth: 27.02.1984, Üsküdar / Istanbul
Nationality: Turkish
Education
June 2013 PhD student at the Institute of Physical Chemistry, Clausthal
University of Technology (advisor: Prof. W. Oppermann)
Doctoral Thesis: „Influence of Temperature on Light Scattering
of Poly-N-isopropylacrylamide Hydrogels Synthesized by Two
Different Cross-Linking Methods”
January 2009 M.Sc. in Polymer Science and Technology, Istanbul Technical
University, Faculty of Science Istanbul, (advisor: Prof.O.Okay, grade:
“very good”)
Master Thesis: „Organogels based on butyl rubber: effect of
preparation conditions“
June 2006 B.Sc. in Chemistry, Kocaeli University, Departement of Science and
Literature, Kocaeli , Turkey (grade: “good”)

Research Projects
2006 – 2007 Design of nano and micro – sized regions in polymeric gels
2007 – 2009 Synthesis and application of new sorbents for removal of oil spill
from sea ecosystem
2009 – 2012 Investigation of inhomogeneities in free-radical and photo-
crosslinked gels at different conditions
Publications
Dogu, S.; Okay, O. Tough organogels based on polyisobutylene with aligned porous
structures. Polymer, 2008, 49, 4626-4634.
Dogu, S.; Kilic, M.; Okay, O. Collapse of acrylamide-based polyampholyte hydrogels
in water. J. Appl. Polym. Sci., 2009, 113, 1375-1382.
Ceylan, D.; Dogu, S.; Karacik, B.; Yakan, S. D.; Okay, O. S.; Okay, O. Evaluation of
butyl rubber as sorbent material for the removal of oil and polycyclic aromatic
hydrocarbons from seawater. Environ. Sci. Technol., 2009, 43 (10), 3846-3852.
Dogu, S.; Oppermann, W. Influence of observation temperature on light scattering of poly-
N-isopropylacrylamide hydrogels. Soft Matter, 2012, 8, 2705-2713.