Influence of surface treatments on corrosion resistance ...
346
HAL Id: tel-02935735 https://tel.archives-ouvertes.fr/tel-02935735 Submitted on 10 Sep 2020 HAL is a multi-disciplinary open access archive for the deposit and dissemination of sci- entific research documents, whether they are pub- lished or not. The documents may come from teaching and research institutions in France or abroad, or from public or private research centers. L’archive ouverte pluridisciplinaire HAL, est destinée au dépôt et à la diffusion de documents scientifiques de niveau recherche, publiés ou non, émanant des établissements d’enseignement et de recherche français ou étrangers, des laboratoires publics ou privés. Influence of surface treatments on corrosion resistance properties of ultrafine grained Titanium alloys for implant applications Diego Godoy To cite this version: Diego Godoy. Influence of surface treatments on corrosion resistance properties of ultrafine grained Titanium alloys for implant applications. Material chemistry. Université Grenoble Alpes; Universidade federal de São Carlos, 2019. English. NNT : 2019GREAI040. tel-02935735
Transcript of Influence of surface treatments on corrosion resistance ...

HAL Id: tel-02935735https://tel.archives-ouvertes.fr/tel-02935735
Submitted on 10 Sep 2020
HAL is a multi-disciplinary open accessarchive for the deposit and dissemination of sci-entific research documents, whether they are pub-lished or not. The documents may come fromteaching and research institutions in France orabroad, or from public or private research centers.
L’archive ouverte pluridisciplinaire HAL, estdestinée au dépôt et à la diffusion de documentsscientifiques de niveau recherche, publiés ou non,émanant des établissements d’enseignement et derecherche français ou étrangers, des laboratoirespublics ou privés.
Influence of surface treatments on corrosion resistanceproperties of ultrafine grained Titanium alloys for
implant applicationsDiego Godoy
To cite this version:Diego Godoy. Influence of surface treatments on corrosion resistance properties of ultrafine grainedTitanium alloys for implant applications. Material chemistry. Université Grenoble Alpes; Universidadefederal de São Carlos, 2019. English. NNT : 2019GREAI040. tel-02935735

THÈSE
Pour obtenir le grade de
DOCTEUR DE L’UNIVERSITÉ GRENOBLE ALPES et DOUTOR EM ENGENHARIA DE MATERIAIS, UNIVERSIDADE FEDERAL DE SÃO CARLOS préparée dans le cadre d’une cotutelle entre l’Université Grenoble Alpes et Université Federal de São Carlos
Spécialité : Matériaux, Mécanique, Génie civil, Electrochimie Arrêté ministériel : le 6 janvier 2005 – 25 mai 2016
Présentée par
Diego GODOY
Thèse dirigée par Jean Claude LEPETRE (France) et Walter BOTTA (Brésil) et codirigée par Virginie ROCHE (France) et Alberto MOREIRA (Brésil)
préparée au sein des
• Laboratoire d’Electrochimie et de Physicochimie des Matériauxet des Interfaces (LEPMI), France
• Structural Characterization Laboratory (LCE), Brésildans l'École Doctorale Ingénierie - Matériaux, Mécanique, Environnement, Energétique, Procédés, Production (IMEP2)
Influence de traitements de surface sur les propriétés de résistance à la corrosion d'alliages de Titane à grains ultrafins pour des applications biomédicalesThèse soutenue publiquement le 9 août 2019, devant le jury composé de :
M. Jean-Claude LEPRETREProfesseur, Université Grenoble Alpes, Directeur de thèse
M. Walter JOSE BOTTA FILHOProfesseur, Université Fédérale de São Carlos, Brésil, Directeur de thèse Mme. Virginie ROCHEMaître de conférences, Université Grenoble Alpes, Co-encadrante de thèse
M. Alberto MOREIRA JORGE JUNIORProfesseur, Université Fédérale de São Carlos, Brésil, Co-encadrante de thèse
M. Ricardo NOGUEIRAProfesseur, The Petroleum Institute, Emirats arabe unis, Rapporteur et PrésidentM. Claudemiro BOLFARINIProfesseur, Université Fédérale de São Carlos, Brésil, Examinateur
M. Dilermando TRAVESSA NAGLEProfesseur, Université Fédérale de São Paulo, Brésil, Rapporteur
Mme. Katia REGINA CARDOSOProfesseur, Université Fédérale de São Paulo, Brésil, Examinateur


INFLUENCE OF SURFACE TREATMENTS ON CORROSION RESISTANCE
PROPERTIES OF ULTRAFINE GRAINED TITANIUM ALLOYS FOR IMPLANT
APPLICATIONS
Diego Alfonso Godoy Pérez
UNIVERSITÉ GRENOBLE ALPES
Laboratoire d’Electrochimie et de Physicochimie des Matériaux et des Interfaces
(LEPMI), F-38000 Grenoble, France.
UNIVERSIDADE FEDERAL DE SÃO CARLOS
Department of Materials Engineering, Rod. Washington Luiz, São Carlos - SP,
13565-905
2019


Abstract i
Abstract
Titanium and its alloys are used as biomaterials because their excellent
combination of high corrosion resistance, low modulus of elasticity and
biocompatibility. However, titanium and its alloys cannot meet all the clinical
requirements. In this sense, in order to improve the electrochemical and bioactive
properties, this thesis aims to evaluate the effect of the severe plastic deformation
as well as the surface modification treatments on the corrosion resistance and
bioactivity of titanium alloys (α' + β) and (β).
The titanium alloys, Ti13Nb13Zr (α' + β) and Ti35Nb7Zr5Ta (β), were
deformed by the high-pressure torsion (HPT) method. Afterward, surface
modification treatments, such as the anodization and chemical treatments, were
carried out both in samples non-deformed and deformed by HPT. Finally, corrosion
and bioactivity tests were performed in simulated body fluid (SBF). The tests were
performed on samples with treated surfaces compared with non-treated surfaces in
the deformed and undeformed conditions.
The samples’ microstructures were analyzed by confocal laser microscopy
(CLM), scanning electron microscopy (SEM) and X-ray diffraction (XRD). Hardness
tests were also performed after the HPT process. On the other hand, surface
modification treatments, and the formation of apatite in bioactivity assays were
evaluated by scanning electron microscopy (SEM), with chemical analyzes carried
out by dispersive energy spectroscopy (EDS) and phase identification by X-ray
diffraction (XRD).
In general, the corrosion resistance of the titanium alloys improved with the
anodization treatment. Apatite deposits were observed on Ti13Nb13Zr alloy
samples, in the conditions non-deformed and deformed by HPT. The
Ti35Nb7Zr5Ta appears to have a lower apatite-formation ability compared to
Ti13Nb13Zr.

Influence of surface treatments on corrosion resistance
properties of ultrafine grained Titanium alloys for implant applications ii
Keywords: Titanium alloys, Ti13Nb13Zr alloy, Ti35Nb7Zr5Ta alloy, Severe plastic
deformation, TiO2 nanotubes, Apatite, Corrosion resistance, Bioactivity.

Résumé iii
Résumé
Le titane et ses alliages sont utilisés comme biomatériaux en raison de leur
excellente combinaison de résistance élevée à la corrosion, de faibles modules
d'élasticité et de biocompatibilité. Cependant, le titane et ses alliages ne peuvent
pas répondre à toutes les exigences cliniques. En ce sens, afin d’améliorer les
propriétés électrochimiques et bioactives, cette thèse vise à évaluer l’effet de la
déformation plastique sévère ainsi que des traitements de modification de surface
sur la résistance à la corrosion et la bioactivité des alliages de titane (α '+ β) et (β).
Les alliages Ti13Nb13Zr (α' + β) et Ti35Nb7Zr5Ta (β) ont été déformés par
la méthode de torsion à haute pression (HPT-High Pressure torsion). Ensuite, des
traitements de modification de surface, tels que l’anodisation et les traitements
chimiques, ont été effectués dans des échantillons non déformés et déformés par
HPT. Enfin, des tests de corrosion et de bioactivité ont été réalisés dans un fluide
corporel simulé (SBF). Les tests ont été effectués sur des échantillons de surfaces
traitées par rapport à des surfaces non traitées de conditions déformées et non
déformées.
La microstructure des échantillons a été analysée par microscope confocal
à balayage laser (CLM), microscopie électronique à balayage (SEM) et diffraction
des rayons X (XRD). Des tests de dureté sont également effectués après le
processus HPT. D'autre part, les traitements de modification de surface et la
formation d'apatite dans les tests de bioactivité sont évalués par SEM, analyses
chimiques par spectroscopie d'énergie dispersive (EDS) et DRX.
En général, la résistance à la corrosion des alliages de titane évaluées,
améliorée avec le traitement d'anodisation. Des dépôts d'apatite ont été observés
sur des échantillons d'alliage Ti13Nb13Zr, non déformés et déformés par HPT,
pour les traitements de modification de surface proposés. Le Ti35Nb7Zr5Ta
semble avoir une capacité de formation d'apatite inférieure à celle du Ti13Nb13Zr.

Influence of surface treatments on corrosion resistance
properties of ultrafine grained Titanium alloys for implant applications iv
Mots-clés : Alliage de titane, Alliage Ti13Nb13Zr, Alliage Ti35Nb7Zr5Ta,
Déformation plastique sévère, Nanotubes de TiO2, Apatite, Résistance à la
corrosion, Bioactivité.
Resumo v
Resumo
Titânio e suas ligas são utilizados como biomateriais devido à sua excelente
combinação de alta resistência à corrosão, baixo módulo de elasticidade e
biocompatibilidade. No entanto, o titânio e suas ligas não podem atender a todos
os requisitos clínicos. Neste sentido, a fim de melhorar as propriedades
eletroquímicas e bioativas, esta tese tem como objetivo avaliar o efeito da
deformação plástica severa e os tratamentos de modificação de superfície na
resistência à corrosão e bioatividade de ligas de titânio (α '+ β) e (β).
As ligas de titânio, (α' + β) Ti13Nb13Zr e a liga (β) Ti35Nb7Zr5Ta foram
deformadas pelo método de deformação plástica severa de torção sob alta
pressão (HPT, High Pressure Torsion). Além disso, tratamentos de modificação de
superfície são propostos, como anodização e tratamentos químicos em amostras
deformadas por HPT e em amostras não deformadas. Finalmente, os testes de
corrosão e bioatividade foram realizados em fluido corporal simulado (SBF). Os
testes foram realizados em amostras de superfícies tratadas em comparação com
superfícies não tratadas de condições deformadas e não deformadas.
A microestrutura das amostras foi analisada por microscopia confocal laser
(MCL), microscopia eletrônica de varredura (MEV) e difração de raios X (DRX).
Testes de dureza também são realizados após o processo HPT. Por outro lado,
tratamentos de modificação de superfície e a formação de apatita em ensaios de
bioatividade são avaliados por MEV, análises químicas por espectroscopia de
energia dispersiva (EDS) e DRX.
Em geral, a resistência à corrosão das ligas de titânio avaliadas melhorou
com o tratamento de anodização. Depósitos de apatita foram observados em
amostras da liga Ti13Nb13Zr, não deformadas e deformadas por HPT, para todos
os tratamentos de modificação de superfície propostos A liga Ti35Nb7Zr5Ta
parece ter uma menor capacidade de formação de apatita que a liga de
Ti13Nb13Zr.

Influence of surface treatments on corrosion resistance
properties of ultrafine grained Titanium alloys for implant applications vi
Palavras-chave: Liga de titânio, Liga Ti13Nb13Zr, Liga Ti35Nb7Zr5Ta,
Deformação plástica severa, Nanotubos de TiO2, Apatita, Resistência à corrosão,
Bioatividade.

Acknowledgment vii
Acknowledgments
Acknowledging everyone who helped me, in one way or another, during my
thesis work in two different laboratories.
I would like to start by expressing my gratitude to the National Commission
on Scientific and Technological Research of Chile (CONICYT), for the partial Ph.D.
fellowship. I would also like to thank the French Committee for the Evaluation of
Academic and Scientific Cooperation with Brazil (COFECUB), the Brazilian CAPES
(Process number #88887.137755/2017-00- Finance Code 001) for funding the
bilateral cooperation, and also FAPESP under the grant number FAPESP
Thematic # 2013/05987-8, for the partial funding.
Thank you, my main supervisors, Walter Jose Botta Filho, and Alberto
Moreira Jorge Júnior, for the patience, scientific insight, and suggestions during the
planning and development of this research work. My grateful thanks are also
extended to my co-supervisors in Grenoble, Virginie Roche, and Jean Claude
Lepretre, for their advice and supervision in the corrosion laboratory.
I would like to acknowledge the people who made key inputs to this work:
Claudemiro Bolfarini for having provided the alloys studied in this work and also for
his valuable and constructive suggestions. Fanny Hilario for helping me when I
arrived to Grenoble as well as for her support in the electrochemical
measurements; Verónica Müller for her help with Raman spectroscopy; and
Gabriel Hitoshi Asato and Murillo Romero for helping me with the deformation by
HPT of some samples. A special thank you to the technicians of both the
Laboratory of Structural Characterization (LCE/DEMa/UFSCar) in São Carlos and
the Consortium des Moyens Technologiques Communs (CMTC) within the INP in
Grenoble. I particularly acknowledge to Diego Coimbrão, Manoel Denari, Ana
Vieira, Frederic Charlot, and Thierry Encinas.

Influence of surface treatments on corrosion resistance
properties of ultrafine grained Titanium alloys for implant applications viii
My thanks to all the people who made me feel welcome to the labs in São
Carlos and Grenoble. To my colleagues, thank you for the help in the experiments,
for the coffee and lunch sessions.
To my Family and Margarita, for the unlimited support and for encouraging
me to pursue my dreams, thank you very much. This thesis is dedicated to you.
List of figures ix
LIST OF FIGURES
Figure 1: Crystal structure of titanium. Adapted from Froes (2015) [37]................. 8
Figure 2: Effect of alloying elements on phase diagrams of titanium alloys
(schematically). Adapted from Lütjering et al., (2003) [39]. ..................................... 9
Figure 3: Schematic illustration of the HPT process. Adapted from Zhilyaev et al.,
(2008) [66]. .......................................................................................................... 12
Figure 4: a) Dental implant from nanostructured Ti; b), c) X-ray photographs after
surgery and control photograph after incorporation of dental implants into the
human jaw. Adapted from Sabirov et al., (2015) [67]. ........................................... 14
Figure 5: Growth of regular TiO2 nanotubes: (a) cathodic reaction, (b) anodic
reaction, (c) transition state of TiO2 layer, (d) starting of nanotube formation and (e)
titania nanotubes. Adapted from Minagar et al., (2012) [80]. ................................ 18
Figure 6: Crystal structure of anatase, rutile, and brookite. Gray sphere: Ti, Red
sphere: O. Adapted from Etacheri et al., (2015) [82]. ........................................... 19
Figure 7: SEM images showing self-organized oxide nanotube layers grown on
Ti6Al7Nb alloy (A) and (B), TiNb alloy. The insets show top-views of the nanotube
layers. Adapted from Macak et al., (2007) [84]. .................................................... 20
Figure 8: SEM micrographs of an SLA surface on a titanium dental implant
(Courtesy of Straumann AG, Switzerland).Adapted from Le Guéhennec et al.,
(2007) [86]. .......................................................................................................... 21
Figure 9: Schematic representation of the relationship between changes in surface
structure and the potential of amorphous sodium titanate in the apatite formation
process on its surface, in an SBF solution. Adapted from Kokubo et al., (2003) [90].
............................................................................................................................. 23
Figure 10: Schematic representation of the Tafel extrapolation method. .............. 26

Influence of surface treatments on corrosion resistance
properties of ultrafine grained Titanium alloys for implant applications x
Figure 11: Schematic representation of the principle of measurements by EIS.... 27
Figure 12: Nyquist plot (a), Bode magnitude (b) and Bode phase angle (c). ........ 29
Figure 13: Schematic electrochemical impedance circuits. (a) Charge control. (b)
Diffusion control, adapted from Perez (2016) [101]. ............................................. 31
Figure 14: Flow diagram of the experimental procedures used in this doctoral
project (read from left to right). ............................................................................. 37
Figure 15: Universal Testing Machine EMIC and HPT accessory. ....................... 38
Figure 16: (a) Diagrammatic representation of the assembly with four working
electrodes and one counter-cylindrical electrode of Pt connected to a power supply.
(b) Photograph of the electrochemical cell used in this work for anodization
experiments. Adapted from Hilario (2017) [25]. .................................................... 40
Figure 17: Schematic representation of the experimental assembly for the
electrochemical characterization of the alloys Ti13Nb13Zr and Ti35Nb7Zr5Ta.
Adapted from Hilario (2017) [25]. ......................................................................... 42
Figure 18: Schematic representation of the experimental assembly used to
bioactivity assays. ................................................................................................ 44
Figure 19: (a) Vickers hardness tester; (b) Scheme of the positions of the
hardness measurements. ..................................................................................... 45
Figure 20: Equipment used for the measurements of the elastic modulus. .......... 46
Figure 21: XRD patterns of Ti13Nb13Zr alloy at the non-deformed condition and
deformed by HPT at 1 GPa and 4.5 GPa and three turns. ................................... 52
Figure 22: Microstructures of Ti13Nb13Zr alloy at (a) non-deformed condition and
deformed by HPT at (b) 1 GPa and (c) 4.5 GPa and three turns. ......................... 52
List of figures xi
Figure 23: Hardness mappings for Ti13Nb13Zr alloy at the non-deformed
condition and deformed by HPT 1 GPa and 4.5 GPa and three turns. ................. 54
Figure 24: Graph comparing elastic modulus values for the Ti13Nb13Zr alloy at
the non-deformed condition and deformed by HPT at 1 GPa and 4.5 GPa. ......... 55
Figure 25: XRD patterns of anodized samples of Ti13Nb13Zr alloy in the ND,
HPT1GPa, and HPT4.5GPa conditions. ............................................................... 55
Figure 26: XRD pattern of anodized and annealed samples of Ti13Nb13Zr alloy in
the ND, HPT1GPa, and HPT4.5GPa conditions. TiO2 nanostructures were
annealed at 550 °C in air. ..................................................................................... 56
Figure 27: SEM micrographs of anodized and annealed samples of Ti13Nb13Zr
alloy at non-deformed condition, (a) Top and (b) Lateral views, deformed by HPT at
1 GPa, (c) Top and (d) Lateral views and deformed at 4.5 GPa, (e) Top and (f)
Lateral views. ....................................................................................................... 57
Figure 28: SEM images of Ti13Nb13Zr alloy, chemically treated by HCl etching
and NaOH activation, (a and b) non-deformed, deformed by HPT at (c and d) 1
GPa and deformed by HPT at (e and f) 4.5 GPa. ................................................. 59
Figure 29: Raman spectra of the surface of Ti13Nb13Zr alloy chemically treated
by HCl etching and NaOH activation. ................................................................... 61
Figure 30: SEM images of Ti13Nb13Zr alloy, chemically treated by H3PO4 and
NaOH, (a and b) ND sample, (c and d) HPT1GPa sample (e and f) HPT4.5GPa
sample. ................................................................................................................ 62
Figure 31: Raman spectra of the surface of Ti13Nb13Zr alloy chemically treated
by H3PO4 and NaOH. ........................................................................................... 63
Figure 32: Anodic polarization curves, recorded in SBF at 37 °C of the polished
surfaces of Ti13Nb13Zr alloy in the conditions ND, HPT1GPa, and HPT4.5GPa
samples. .............................................................................................................. 65
Influence of surface treatments on corrosion resistance
properties of ultrafine grained Titanium alloys for implant applications xii
Figure 33: EIS graphs in the Nyquist diagrams (a) and Bode diagrams (b) of the
polished samples of Ti13Nb13Zr alloy in the conditions ND, HPT1GPa, and
HPT4.5GPa.......................................................................................................... 67
Figure 34: Anodic polarization curves, recorded in SBF at 37 °C for the anodized
Ti13Nb13Zr samples in the conditions ND, HPT1GPa, and HPT4.5GPa. ............ 70
Figure 35: Nyquist diagrams (a) and Bode diagrams (b) for the anodized
Ti13Nb13Zr samples in the conditions ND, HPT1GPa, and HPT4.5GPa. ............ 72
Figure 36: Anodic polarization curves, recorded in SBF at 37 °C for samples of
Ti13Nb13Zr alloy chemically treated by HCl and NaOH in the conditions ND,
HPT1GPa, and HPT4.5GPa. ................................................................................ 75
Figure 37: Nyquist diagrams (a) and Bode diagrams (b) for samples of
Ti13Nb13Zr alloy chemically treated by HCl and NaOH in the conditions ND,
HPT1GPa, and HPT4.5GPa. ................................................................................ 77
Figure 38: Anodic polarization curves, recorded in SBF at 37 °C for samples of
Ti13Nb13Zr alloy chemically treated by H3PO4 and NaOH in the conditions ND,
HPT1GPa, and HPT4.5GPa. ................................................................................ 79
Figure 39: Nyquist diagrams (a) and Bode diagrams (b) for samples of
Ti13Nb13Zr alloy chemically treated by H3PO4 and NaOH in the conditions ND,
HPT1GPa, and HPT4.5GPa. ................................................................................ 81
Figure 40: Model used to fit the EIS data for polished samples of Ti13Nb13Zr
alloy, non-deformed, and deformed by HPT at 1 GPa and 4.5 GPa and three turns.
Adapted from Valereto et al., (2004) [142]. ........................................................... 82
Figure 41: Nyquist diagrams of experimental data and simulated curves obtained
by the Simad software for the polished surfaces of Ti13Nb13Zr alloy at ND,
HPT1GPa, and HPT4.5GPa conditions. ............................................................... 84

List of figures xiii
Figure 42: Model of a cylindrical porous electrode. The gray area is
nonconductive. Adapted from Lasia et al., (2008) [172]. ....................................... 88
Figure 43: Scheme of a porous electrode. Adapted from Bisquert et al., (2000)
[174]. .................................................................................................................... 89
Figure 44: Transmission line used for modeling of EIS data of anodized samples
of Ti13Nb13Zr alloy, non-deformed and deformed by HPT, immersed in SBF at 37
°C. ........................................................................................................................ 92
Figure 45: Nyquist diagrams of experimental data and simulated curves obtained
by the Simad software for the anodized samples of Ti13Nb13Zr alloy at ND,
HPT1GPa, and HPT4.5GPa conditions. ............................................................... 93
Figure 46: Schematic representation of surface structural change on titanium
metal in the presence of acid etching and alkali treatment. Adapted from
Sasikumar et al., (2017) [139]. ............................................................................. 95
Figure 47: Equivalent circuit for samples of Ti13Nb13Zr alloy chemically treated by
HCl and NaOH at ND, HPT1GPa, and HPT4.5GPa conditions. Adapted from
Orazem et al., (2017)[185]. .................................................................................. 96
Figure 48: Nyquist diagrams of experimental data and simulated curves obtained
by the Simad software for samples of Ti13Nb13Zr alloy chemically treated by HCl
and NaOH at ND, HPT1GPa, and HPT4.5GPa conditions. .................................. 97
Figure 49: Nyquist diagrams of experimental data and simulated curves obtained
by the Simad software for samples of Ti13Nb13Zr alloy chemically treated by
H3PO4 and NaOH at ND, HPT1GPa, and HPT4.5GPa conditions. ..................... 100
Figure 50: SEM-FEG observations (scale bar 1 µm) of polished samples of
Ti13Nb13Zr alloy, non-deformed, and deformed by HPT, subjected to the
bioactivity tests after 1, 7, and 14 days immersed in SBF. ................................. 103

Influence of surface treatments on corrosion resistance
properties of ultrafine grained Titanium alloys for implant applications xiv
Figure 51: SEM-FEG observations (scale bar 1 µm) of anodized samples of
Ti13Nb13Zr alloy, non-deformed, and deformed by HPT, subjected to the
bioactivity tests after 1, 7, and 14 days immersed in SBF. ................................. 105
Figure 52: The weight change of anodized samples of Ti13Nb13Zr alloy, non-
deformed, and deformed by HPT, after soaking in SBF for 1, 7 and14 days. ..... 107
Figure 53: SEM-FEG observations (scale bar 1 µm) for samples of Ti13Nb13Zr
alloy chemically treated, by HCl etching and NaOH activation, non-deformed and
deformed by HPT, subjected to the bioactivity tests after 1, 7 and 14 days
immersed in SBF. .............................................................................................. 108
Figure 54: The weight change for samples of Ti13Nb13Zr alloy chemically treated
by HCl and NaOH, non-deformed and deformed by HPT, subjected to the
bioactivity tests after 1, 7 and 14 days immersed in SBF. .................................. 110
Figure 55: SEM-FEG observations (scale bar 1 µm) for samples of Ti13Nb13Zr
alloy chemically treated by H3PO4 and NaOH, non-deformed and deformed by
HPT, subjected to the bioactivity tests after 1, 7 and 14 days immersed in SBF. 111
Figure 56: The weight change for samples of Ti13Nb13Zr alloy chemically treated,
by H3PO4 etching and NaOH activation, non-deformed and deformed by HPT,
subjected to the bioactivity tests after 1, 7 and 14 days immersed in SBF.......... 113
Figure 57: XRD patterns of Ti35Nb7Zr5Ta alloy in the conditions ND, HPT1GPa,
and HPT4.5GPa. ................................................................................................ 116
Figure 58: Microstructures of Ti35Nb7Zr5Ta alloy at (a) the non-deformed
condition, and deformed by HPT (b) HPT1GPa and (c) HPT4.5GPa. ................. 116
Figure 59: Hardness mappings for Ti35Nb7Zr5Ta alloy in the conditions ND,
HPT1GPa, and HPT4.5GPa. .............................................................................. 117
Figure 60: Graph comparing elastic modulus values for the Ti35Nb7Zr5Ta alloy at
the conditions ND, HPT1GPA and HPT4.5GPa, and three turns. ....................... 118

List of figures xv
Figure 61: XRD patterns of anodized samples of Ti35Nb7Zr5Ta alloy in the ND,
HPT1GPa, and HPT4.5GPa conditions. ............................................................. 119
Figure 62: XRD pattern of anodized and annealed samples of Ti35Nb7Zr5Ta alloy
in the ND, HPT1GPa, and HPT4.5GPa conditions. TiO2 nanostructures were
annealed at 550 °C in air. ................................................................................... 120
Figure 63: SEM micrographs of anodized and annealed samples of Ti35Nb7Zr5Ta
alloy at non-deformed condition, (a) Top and (b) Lateral views, deformed by HPT at
1 GPa, (c) Top and (d) Lateral views and deformed at 4.5 GPa, (e) Top and (f)
Lateral views. ..................................................................................................... 121
Figure 64: SEM images of Ti35Nb7Zr5Ta alloy, chemically treated by HCl etching
and NaOH activation, (a and b) non-deformed condition, deformed by HPT at (c
and d) 1 GPa and deformed by HPT at (e and f) 4.5 GPa. ................................. 123
Figure 65: Raman spectra of the surface of Ti35Nb7Zr5Ta alloy chemically treated
by HCl etching and NaOH activation. ................................................................. 124
Figure 66: SEM images of Ti35Nb7Zr5Ta alloy, chemically treated by H3PO4
etched and NaOH activated, (a and b) non-deformed condition, deformed by HPT
at (c and d) 1 GPa and deformed by HPT at (e and f) 4.5 GPa. ......................... 126
Figure 67 Raman spectra of the surface of Ti35Nb7Zr5Ta alloy chemically treated
by H3PO4 and NaOH. ......................................................................................... 127
Figure 68: Anodic polarization curves, recorded in SBF at 37 °C of the polished
surfaces of Ti35Nb7Zr5Ta alloy in the conditions ND, HPT1GPa, and HPT4.5GPa
samples. ............................................................................................................ 129
Figure 69: EIS graphs in the Nyquist diagrams (a) and Bode diagrams (b) of the
polished samples of Ti35Nb7Zr5Ta alloy in the conditions ND, HPT1GPa, and
HPT4.5GPa........................................................................................................ 131

Influence of surface treatments on corrosion resistance
properties of ultrafine grained Titanium alloys for implant applications xvi
Figure 70: Anodic polarization curves, recorded in SBF at 37 °C for the anodized
Ti35Nb7Zr5Ta samples in the conditions ND, HPT1GPa, and HPT4.5GPa. ...... 133
Figure 71: Nyquist diagrams (a) and Bode diagrams (b) for the anodized
Ti35Nb7Zr5Ta samples in the conditions ND, HPT1GPa, and HPT4.5GPa. ...... 135
Figure 72: Anodic polarization curves, recorded in SBF at 37 °C for samples of
Ti35Nb7Zr5Ta alloy chemically treated by HCl and NaOH in the conditions ND,
HPT1GPa, and HPT4.5GPa. .............................................................................. 137
Figure 73: Nyquist diagrams (a) and Bode diagrams (b) for samples of
Ti35Nb7Zr5Ta alloy chemically treated by HCl and NaOH in the conditions ND,
HPT1GPa, and HPT4.5GPa. .............................................................................. 139
Figure 74: Anodic polarization curves, recorded in SBF at 37 °C for samples of
Ti35Nb7Zr5Ta alloy chemically treated by H3PO4 and NaOH in the conditions ND,
HPT1GPa, and HPT4.5GPa. .............................................................................. 141
Figure 75: Nyquist diagrams (a) and Bode diagrams (b) for samples of
Ti35Nb7Zr5Ta alloy chemically treated by H3PO4 and NaOH in the conditions ND,
HPT1GPa, and HPT4.5GPa. .............................................................................. 143
Figure 76: Nyquist diagrams of experimental data and simulated curves obtained
by the Simad software for the polished surfaces of Ti35Nb7Zr5Ta alloy at ND,
HPT1GPa, and HPT4.5GPa conditions. ............................................................. 145
Figure 77: Nyquist diagrams of experimental data and simulated curves obtained
by the Simad software for the anodized samples of Ti35Nb7Zr5Ta alloy at ND,
HPT1GPa, and HPT4.5GPa conditions. ............................................................. 148
Figure 78: Nyquist diagrams of experimental data and simulated curves obtained
by the Simad software for samples of Ti35Nb7Zr5Ta alloy chemically treated by
HCl and NaOH at ND, HPT1GPa, and HPT4.5GPa conditions. ......................... 151

List of figures xvii
Figure 79: Nyquist diagrams of experimental data and simulated curves obtained
by the Simad software for samples of Ti35Nb7Zr5Ta alloy chemically treated by
H3PO4 and NaOH at ND, HPT1GPa, and HPT4.5GPa conditions. ..................... 153
Figure 80: SEM-FEG observations (scale bar 1 µm) of polished samples of
Ti35Nb7Zr5Ta alloy, non-deformed, and deformed by HPT, subjected to the
bioactivity tests after 1, 7, and 14 days immersed in SBF. ................................. 156
Figure 81: SEM-FEG observations (scale bar 1 µm) of anodized samples of
Ti35Nb7Zr5Ta alloy, non-deformed, and deformed by HPT, subjected to the
bioactivity tests after 1, 7, and 14 days immersed in SBF. ................................. 158
Figure 82: The weight change of samples of the Ti35Nb7Zr5Ta alloy with TiO2
nanotubes unprocessed and processed by HPT after soaking in SBF for 1, 7
and14 days. ....................................................................................................... 160
Figure 83: SEM-FEG observations (scale bar 1 µm) for samples of Ti35Nb7Zr5Ta
alloy chemically treated by HCl and NaOH, non-deformed and deformed by HPT,
subjected to the bioactivity tests after 1, 7, and 14 days immersed in SBF......... 161
Figure 84: The weight change for samples of Ti35Nb7Zr5Ta alloy chemically
treated, by HCl etching and NaOH activation, non-deformed and deformed by HPT,
subjected to the bioactivity tests after 1, 7 and 14 days immersed in SBF.......... 163
Figure 85: SEM-FEG observations (scale bar 1 µm) for samples of Ti35Nb7Zr5Ta
alloy chemically treated by H3PO4 and NaOH, non-deformed and deformed by
HPT, subjected to the bioactivity tests after 1, 7, and 14 days immersed in SBF.164
Figure 86: Scheme of grain refinement during deformation by HPT describing in
sequence the processes of (a) the generation of dislocations, (b) the formation of
subgrains boundaries, (c) the increase in the disorientation angle, and (d) the
division of grains into subgrains. Adapted from Borodachenkova et al., (2017)
[193]. .................................................................................................................. 167

Influence of surface treatments on corrosion resistance
properties of ultrafine grained Titanium alloys for implant applications xviii
Figure 87: Open circuit potential measurements after 1-hour immersion in SBF at
37 ° C; (a) OCP measurements for samples of Ti13Nb13Zr alloy non-deformed and
deformed by HPT with different surface modification treatment and (b) OCP
measurements for samples of Ti35Nb7Zr5Ta alloy non-deformed and deformed by
HPT with different surface modification treatment. ............................................. 172
Figure 88: Passivation current (ipass) measurements in SBF at 37 ° C; (a) ipass
measurements for samples of Ti13Nb13Zr alloy non-deformed and deformed by
HPT with different surface modification treatment and (b) ipass measurements for
samples of Ti35Nb7Zr5Ta alloy non-deformed and deformed by HPT with different
surface modification treatment. .......................................................................... 173
Figure 89: Impedance module |Z| at low frequency (20 mHz); (a) measurements
for samples of Ti13Nb13Zr alloy non-deformed and deformed by HPT with different
surface modification treatment and (b) measurements for samples of
Ti35Nb7Zr5Ta alloy non-deformed and deformed by HPT with different surface
modification treatment. ....................................................................................... 174
Figure 90: Graphs showing the apatite mass gain after soaking specimens in SBF
as a function of the immersion time, comparing polished surfaces and surface
treated of deformed and undeformed samples. .................................................. 179

List of tables xix
LIST OF TABLES
Table 1: Physical properties of titanium (at room temperature). Adapted from Froes
(2015) [37]. ............................................................................................................ 7
Table 2: Common electrical elements. ................................................................. 30
Table 3: Ion concentrations of simulated body fluid (SBF). Adapted from Kamalian
et al. (2012) [121]. ................................................................................................ 43
Table 4: Summary of observed morphologies and dimensions of the formed
nanostructures observed in Figure 27 for samples of Ti13Nb13Zr alloy at different
conditions. ............................................................................................................ 58
Table 5: Quantitative chemical EDS analysis of samples chemically treated by HCl
etching and NaOH activation. ............................................................................... 60
Table 6: Quantitative chemical EDS analysis of chemically treated samples by
H3PO4 etching and NaOH activation. .................................................................... 63
Table 7: OCP measurements after 1-hour immersion in SBF at 37 °C of the
polished surfaces of Ti13Nb13Zr alloy in the conditions ND, HPT1GPa, and
HPT4.5GPa samples. .......................................................................................... 64
Table 8: Passivation current density of the polished samples of Ti13Nb13Zr alloy
in the conditions ND, HPT1GPa, and HPT4.5GPa. .............................................. 66
Table 9: OCP measurements, after 1-hour immersion in SBF at 37° C for the
anodized samples of Ti13Nb13Zr alloy in the conditions ND, HPT1GPa, and
HPT4.5GPa.......................................................................................................... 69
Table 10: Passivation current density for the anodized Ti13Nb13Zr samples in the
conditions ND, HPT1GPa, and HPT4.5GPa. ........................................................ 71

Influence of surface treatments on corrosion resistance
properties of ultrafine grained Titanium alloys for implant applications xx
Table 11: OCP measurements, after 1-hour immersion in SBF at 37° C of samples
of Ti13Nb13Zr alloy chemically treated by HCl and NaOH in the conditions ND,
HPT1GPa and HPT4.5GPa. ................................................................................. 74
Table 12: Passivation current density of samples of Ti13Nb13Zr alloy chemically
treated by HCl and NaOH in the conditions ND, HPT1GPa, and HPT4.5GPa. ..... 76
Table 13: OCP measurements, after 1-hour immersion in SBF at 37° C of samples
of Ti13Nb13Zr alloy chemically treated by H3PO4 and NaOH in the conditions ND,
HPT1GPa and HPT4.5GPa. ................................................................................. 78
Table 14: Passivation current density of samples of Ti13Nb13Zr alloy chemically
treated by H3PO4 and NaOH in the conditions ND, HPT1GPa, and HPT4.5GPa. 80
Table 15: Equivalent electrical circuits most frequently proposed in the literature to
model EIS data of TiO2 nanotubes. ...................................................................... 86
Table 16: Equivalent circuit parameters and effective capacitance associated with
the CPEs obtained when fitting EIS data of anodized samples of Ti13Nb13Zr alloy
according to the model in Figure 44. .................................................................... 94
Table 17: Equivalent circuit parameters and effective capacitance associated with
the CPEs obtained when fitting EIS data of samples of Ti13Nb13Zr alloy
chemically treated by HCl and NaOH according to the EEC in Figure 47. ............ 98
Table 18: Equivalent circuit parameters and effective capacitance associated with
the CPEs obtained when fitting EIS data of samples of Ti13Nb13Zr alloy
chemically treated by H3PO4 and NaOH according to the EEC in Figure 47....... 101
Table 19: The quantitative chemical EDS analysis of Ti13Nb13Zr alloy non-
deformed and deformed by HPT after soaking in SBF solution for 1, 7, and 14
days. .................................................................................................................. 104

List of tables xxi
Table 20: Quantitative EDS analysis results and Ca/P molar ratio of anodized
samples of Ti13Nb13Zr alloy, non-deformed and deformed by HPT, subjected to
the bioactivity tests after 1, 7 and 14 days immersed in SBF.............................. 106
Table 21: Quantitative EDS analysis results and Ca/P molar ratio for samples of
Ti13Nb13Zr alloy chemically treated by HCl and NaOH, non-deformed and
deformed by HPT, subjected to the bioactivity tests after 1, 7 and 14 days
immersed in SBF. .............................................................................................. 109
Table 22: Quantitative EDS analysis results and Ca/P molar ratio for samples of
Ti13Nb13Zr alloy chemically treated by H3PO4 and NaOH, non-deformed and
deformed by HPT, subjected to the bioactivity tests after 1, 7 and 14 days
immersed in SBF. .............................................................................................. 112
Table 23: Summary of observed morphologies and dimensions of the formed
nanostructures observed in Figure 63 for samples of Ti35Nb7Zr5Ta alloy at
different conditions. ............................................................................................ 122
Table 24: Quantitative chemical EDS analysis of samples chemically treated by
HCl and NaOH. .................................................................................................. 124
Table 25: Quantitative chemical EDS analysis of samples, chemically treated by
H3PO4 etching, and NaOH activation. ................................................................. 127
Table 26: OCP measurements after 1-hour immersion in SBF at 37 °C of the
polished surfaces of Ti35Nb7Zr5Ta alloy in the conditions ND, HPT1GPa, and
HPT4.5GPa samples. ........................................................................................ 128
Table 27: Passivation current density of the polished samples of Ti35Nb7Zr5Ta
alloy in the conditions ND, HPT1GPa, and HPT4.5GPa. .................................... 130
Table 28: OCP measurements, after 1-hour immersion in SBF at 37° C for the
anodized samples of Ti35Nb7Zr5Ta alloy in the conditions ND, HPT1GPa and
HPT4.5GPa........................................................................................................ 132

Influence of surface treatments on corrosion resistance
properties of ultrafine grained Titanium alloys for implant applications xxii
Table 29: Passivation current density for the anodized Ti35Nb7Zr5Ta samples in
the conditions ND, HPT1GPa, and HPT4.5GPa. ................................................ 134
Table 30: OCP measurements, after 1-hour immersion in SBF at 37° C of samples
of Ti35Nb7Zr5Ta alloy chemically treated by HCl and NaOH in the conditions ND,
HPT1GPa and HPT4.5GPa. ............................................................................... 136
Table 31: Passivation current density of samples of Ti35Nb7Zr5Ta alloy chemically
treated by HCl and NaOH in the conditions ND, HPT1GPa, and HPT4.5GPa. ... 138
Table 32: OCP measurements, after 1-hour immersion in SBF at 37° C of samples
of Ti35Nb7Zr5Ta alloy chemically treated by H3PO4 and NaOH in the conditions
ND, HPT1GPa and HPT4.5GPa......................................................................... 140
Table 33: Passivation current density of samples of Ti35Nb7Zr5Ta alloy chemically
treated by H3PO4 and NaOH in the conditions ND, HPT1GPa, and HPT4.5GPa.142
Table 34: Equivalent circuit parameters and effective capacitance associated with
the CPEs obtained when fitting EIS data of polished samples of Ti35Nb7Zr5Ta
alloy according to the model in Figure 40. .......................................................... 146
Table 35: Equivalent circuit parameters and effective capacitance associated with
the CPEs obtained when fitting EIS data of anodized samples of Ti35Nb7Zr5Ta
alloy according to the model in Figure 44. .......................................................... 149
Table 36: Equivalent circuit parameters and the effective capacitance associated
with the CPEs obtained when fitting EIS data of samples of Ti35Nb7Zr5Ta alloy
chemically treated by HCl and NaOH, according to the EEC in Figure 47. ......... 152
Table 37: Equivalent circuit parameters and the effective capacitance associated
with the CPEs obtained when fitting EIS data of samples of Ti35Nb7Zr5Ta alloy
chemically treated by H3PO4 and NaOH, according to the EEC in Figure 47...... 154

List of tables xxiii
Table 38: The quantitative chemical EDS analysis of Ti35Nb7Zr5Ta alloy non-
deformed and deformed by HPT after soaking in SBF solution for 1, 7, and 14
days. .................................................................................................................. 157
Table 39: The quantitative EDS analysis spectrum and Ca/P molar ratio of
anodized samples of Ti35Nb7Zr5Ta alloy, non-deformed and deformed by HPT,
subjected to the bioactivity tests after 1, 7 and 14 days immersed in SBF.......... 159
Table 40: The quantitative EDS analysis spectrum and Ca/P molar ratio for
samples of Ti35Nb7Zr5Ta alloy chemically treated by HCl and NaOH, non-
deformed and deformed by HPT, subjected to the bioactivity tests after 1, 7 and 14
days immersed in SBF. ...................................................................................... 162
Table 41: The quantitative chemical EDS analysis for samples of Ti35Nb7Zr5Ta
alloy chemically treated by H3PO4 and NaOH, non-deformed and deformed by
HPT, subjected to the bioactivity tests after 1, 7 and 14 days immersed in SBF. 165
Table 42: Ca/P molar ratios obtained from the EDS results on the polished
surfaces and surface treated of deformed and undeformed samples after different
times in SBF....................................................................................................... 175
Table 43: Summary of CaP phases, their corresponding Ca/P molar ratios,
abbreviations, and chemical formulas. ............................................................... 177


Table of contents xxv
TABLE OF CONTENTS
1 INTRODUCTION ....................................................................................... 1
2 OBJECTIVES ............................................................................................ 5
3 THEORETICAL BACKGROUND ............................................................... 7
3.1 Titanium: Physical Metallurgy .................................................................... 7
3.2 Ti13Nb13Zr alloy ..................................................................................... 10
3.3 Ti35Nb7Zr5Ta alloy ................................................................................. 11
3.4 Severe Plastic Deformation (SPD) ........................................................... 12
3.5 Surface modification treatments. ............................................................. 14
3.5.1 The growth of TiO2 nanostructures by electrochemical anodization ......... 15
3.5.2 Chemical treatment by acid etching and alkali activation ......................... 20
3.6 Electrochemical characterization ............................................................. 23
3.6.1 Measurements of open circuit potential (OCP) ........................................ 24
3.6.2 The principle of potentiodynamic polarization and extrapolation of Tafel . 24
3.6.3 Electrochemical Impedance Spectroscopy (EIS) ..................................... 26
3.6.4 Corrosion of ultrafine-grained materials obtained by severe plastic
deformation ................................................................................................. 33
3.7 Osseointegration ..................................................................................... 34
4 MATERIALS AND METHODS ................................................................. 37
Influence of surface treatments on corrosion resistance
properties of ultrafine grained Titanium alloys for implant applications xxvi
4.1 Preparation of samples ............................................................................ 37
4.2 High-Pressure Torsion (HPT) deformation ............................................... 38
4.3 Surface modification treatments .............................................................. 39
4.3.1 Electrochemical anodization .................................................................... 39
4.3.2 Chemical treatment by acid etching and alkali activation ......................... 41
4.4 Electrochemical characterization ............................................................. 41
4.4.1 Experimental assembly............................................................................ 41
4.4.2 Protocol and measurement sequence ..................................................... 43
4.5 Bioactivity assays .................................................................................... 43
4.6 Methods of characterization of samples ................................................... 44
4.6.1 Mechanical characterization .................................................................... 45
5 EXPERIMENTAL RESULTS: Ti13Nb13Zr ALLOY................................... 51
5.1 Microstructural and mechanical characterizations.................................... 51
5.1.1 Polished samples .................................................................................... 51
5.1.2 Anodized samples ................................................................................... 55
5.1.3 Samples chemically treated by HCl etching and NaOH activation ........... 58
5.1.4 Samples chemically treated by H3PO4 etching and NaOH activation ....... 61
5.2 Electrochemistry characterization ............................................................ 63
5.2.1 Polished samples .................................................................................... 63
5.2.2 Anodized samples ................................................................................... 69

Table of contents xxvii
5.2.3 Samples chemically treated by HCl etching and NaOH activation ........... 73
5.2.4 Samples chemically treated by H3PO4 etching and NaOH activation ....... 78
5.3 Modeling of impedance spectra for samples of Ti13Nb13Zr alloy ............ 81
5.3.1 EEC proposed for polished samples ........................................................ 82
5.3.2 EEC proposed for anodized samples....................................................... 85
5.3.3 EEC proposed to samples chemically treatment by HCl etching and NaOH
activation ................................................................................................. 95
5.3.4 EEC proposed to samples chemically treatment by H3PO4 etching and
NaOH activation ................................................................................................. 99
5.4 Bioactivity of Ti13Nb13Zr alloy .............................................................. 102
5.4.1 Bioactivity of polished samples .............................................................. 102
5.4.2 Bioactivity of anodized samples ............................................................. 104
5.4.3 Bioactivity of samples chemically treatment by HCl etching and NaOH
activation ............................................................................................... 107
5.4.4 Bioactivity of samples chemically treatment by H3PO4 etching and NaOH
activation ............................................................................................... 110
6 EXPERIMENTAL RESULTS: Ti35Nb7Zr5Ta ALLOY ............................ 115
6.1 Microstructural and mechanical characterizations.................................. 115
6.1.1 Polished samples .................................................................................. 115
6.1.2 Anodized samples ................................................................................. 119
6.1.3 Samples chemically treated by HCl etching and NaOH activation ......... 122

Influence of surface treatments on corrosion resistance
properties of ultrafine grained Titanium alloys for implant applications xxviii
6.1.4 Samples chemically treated by H3PO4 etching and NaOH activation ..... 125
6.2 Electrochemistry characterization .......................................................... 128
6.2.1 Polished samples .................................................................................. 128
6.2.2 Anodized samples ................................................................................. 132
6.2.3 Samples chemically treated by HCl etching and NaOH activation ......... 136
6.2.4 Samples chemically treated by H3PO4 etching and NaOH activation ..... 140
6.3 Modeling of impedance spectra for samples of Ti35Nb7Zr5Ta alloy ...... 144
6.3.1 EEC proposed for polished samples ...................................................... 144
6.3.2 EEC proposed for anodized samples..................................................... 147
6.3.3 EEC proposed for samples chemically treated by HCl etching and NaOH
activation ............................................................................................... 150
6.3.4 EEC proposed for samples chemically treated by H3PO4 etching and
NaOH activation ............................................................................................... 153
6.4 Bioactivity of Ti35Nb7Zr5Ta alloy .......................................................... 155
6.4.1 Bioactivity of polished samples .............................................................. 155
6.4.2 Bioactivity of samples anodized ............................................................. 157
6.4.3 Bioactivity of samples chemically treated by HCl etching and NaOH
activation ............................................................................................... 160
6.4.4 Bioactivity of samples chemically treated by H3PO4 etching and NaOH
activation ............................................................................................... 163
7 DISCUSSION ........................................................................................ 167

Table of contents xxix
8 SUMMARY AND CONCLUSIONS: ........................................................ 183
9 REFERENCES ...................................................................................... 187
RÉSUMÉ DÉTAILLÉ EN FRANÇAIS ................................................................. 213
RESUMO DETALHADO EM PORTUGUÊS ....................................................... 261


List of abbreviations xxxi
LIST OF ABBREVIATIONS
at % Atomic percent
CPE Constant-Phase-Element
ξ Interfacial impedance of the transmission line (Ω·cm)
Ecorr Corrosion potential
EDS Energy dispersive spectroscopy
EIS Electrochemical impedance spectroscopy
H3PO4 Phosphoric acid
HCl Hydrochloric acid
HPT High-pressure torsion
HV Hardness Vickers
Ipass Passivation current density
ISO International organization for standardization
NaOH Sodium hydroxide
ND Non-deformed
OCP Open circuit potential
Q3 Interfacial pseudo-capacitance
r1 Distributed resistance along with the liquid phase (Ω·cm-1)
r2 Distributed resistance along with the solid phase (Ω·cm-1)
Rs Electrolyte resistance (Ω·cm-2)

Influence of surface treatments on corrosion resistance
properties of ultrafine grained Titanium alloys for implant applications xxxii
SBF Solution body fluid
SCE Saturated calomel electrode
SHE Standard hydrogen electrode
SEM Scanning electron microscopy
SPD Severe plastic deformation
TEM Transmission electron microscopy
χ1 Impedance distributed in the liquid phase of the transmission line (Ω·cm-1)
χ2 Impedance distributed in the solid phase of the transmission line (Ω·cm-1)
XRD X-ray diffraction
ZA Boundary impedance at the interface electrolyte | top of the pores (Ω)
ZB Boundary impedance at the interface electrolyte | substrate (Ω)

Introduction 1
1 INTRODUCTION
The application of materials in the substitution of human tissues to restore
bodily functions is not a new fact. Scientists of materials science and implantology
have been looking for advances in device designs that can be valuable for the
replacement of body parts. It is not surprising that from the Roman period, there
are reports of the use of metals for dental prostheses [1]. With the development at
the scientific level of biomedical devices at the beginning of the 20th century, the
increase of the prosthetic market was favored. The biomedical devices currently in
use (prostheses, implants) have satisfactory performance in many cases.
However, sometimes the body reacts to the insertion of a device, which can lead to
the rapid replacement of this device.
In this context, titanium (Ti) and its alloys are today the most relevant and
sought materials for several designed implants in orthopedics and dentistry due to
their excellent biocompatibility and corrosion resistance [2]. Some of the most
common uses for titanium implants are in hip and knee replacement surgeries [3].
They are also used to replace shoulder and elbow joints and to protect the
vertebrae following complicated and invasive back surgery. Titanium pegs are
used to attach false eyes and ears, and titanium heart valves are even competing
with conventional tissue valves [4].
On the other hand, the mechanical properties of titanium and its alloys must
be near the bone tissue as a prerequisite for the success of orthopedic implants
[5]. α + β and β type are the most appropriate titanium alloys for orthopedic
implants because their mechanical properties are similar to the bone tissue [6]. α +
β titanium alloys are the easiest found and have already been used as a
biomaterial for at least three decades [7]. For example, the Ti6Al4V alloy (α + β
type) was initially developed to be applied in the aerospace industry. However, due
to its high availability is widely used in orthopedic implants [8]. Nevertheless,
biocompatibility studies have indicated that the release of Al and V ions can cause
harm to patients [9]. The formation of unstable oxides of V is associated with
Influence of surface treatments on corrosion resistance
properties of ultrafine grained Titanium alloys for implant applications 2
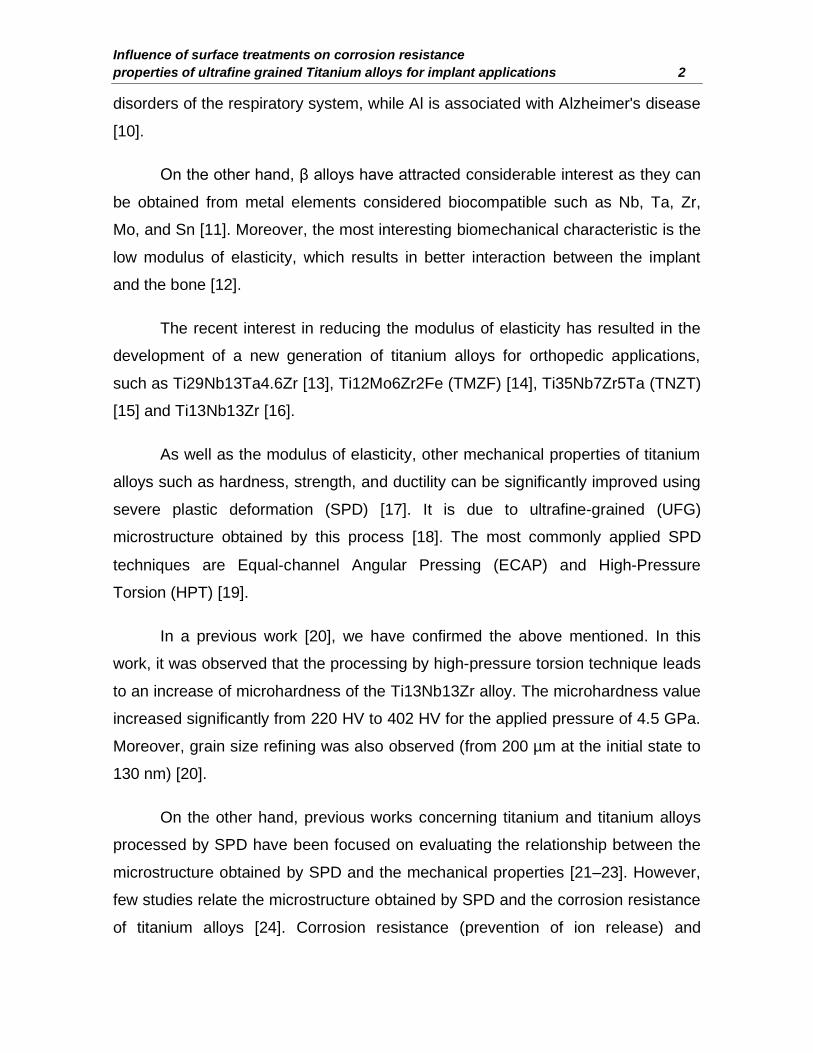
disorders of the respiratory system, while Al is associated with Alzheimer's disease
[10].
On the other hand, β alloys have attracted considerable interest as they can
be obtained from metal elements considered biocompatible such as Nb, Ta, Zr,
Mo, and Sn [11]. Moreover, the most interesting biomechanical characteristic is the
low modulus of elasticity, which results in better interaction between the implant
and the bone [12].
The recent interest in reducing the modulus of elasticity has resulted in the
development of a new generation of titanium alloys for orthopedic applications,
such as Ti29Nb13Ta4.6Zr [13], Ti12Mo6Zr2Fe (TMZF) [14], Ti35Nb7Zr5Ta (TNZT)
[15] and Ti13Nb13Zr [16].
As well as the modulus of elasticity, other mechanical properties of titanium
alloys such as hardness, strength, and ductility can be significantly improved using
severe plastic deformation (SPD) [17]. It is due to ultrafine-grained (UFG)
microstructure obtained by this process [18]. The most commonly applied SPD
techniques are Equal‐channel Angular Pressing (ECAP) and High-Pressure
Torsion (HPT) [19].
In a previous work [20], we have confirmed the above mentioned. In this
work, it was observed that the processing by high-pressure torsion technique leads
to an increase of microhardness of the Ti13Nb13Zr alloy. The microhardness value
increased significantly from 220 HV to 402 HV for the applied pressure of 4.5 GPa.
Moreover, grain size refining was also observed (from 200 µm at the initial state to
130 nm) [20].
On the other hand, previous works concerning titanium and titanium alloys
processed by SPD have been focused on evaluating the relationship between the
microstructure obtained by SPD and the mechanical properties [21–23]. However,
few studies relate the microstructure obtained by SPD and the corrosion resistance
of titanium alloys [24]. Corrosion resistance (prevention of ion release) and

Introduction 3
mechanical resistance (prevention of debris formation) are key factors that could
affect the biocompatibility of titanium alloys [25].
Corrosion is a major problem for the implantation of metallic materials
because it can cause loss of both the structural integrity and surface properties of
the implants. Moreover, it can also alter the mechanical properties of the implant
and accelerate its fatigue and wear, which will further intensify corrosion itself.
Corrosion process of a metallic material can also alter the physiological
environment (pH change) or release of the debris that can cause allergic reactions
[25].
The corrosion behavior of titanium alloy is mainly dependent on the passive
film that it forms on its surface and its properties (composition and thickness) and
the microstructure of the substrate (grain size and dislocation density) [26]. The
passivation phenomenon contributes to improving the corrosion resistance and
makes titanium alloys suitable for use as implants, for instance, dental and
orthopedic implants without promoting adverse reactions locally or systemically
[27].
The low rate of dissolution and chemical inertness of titanium oxide passive
layer (TiO2) dissolution products allow the bone to thrive and osseointegrate with
titanium alloy [28]. Moreover, it has been reported that TiO2 with high dielectric
constants, inhibits the movement of cells to implant surfaces and might play an
essential role in facilitating osseointegration [29].
The osseointegration refers to the adjacent neighborhood between the
implant and bone tissue [30]. Brhnemark (1985) suggested the following definition
of osseointegration: “A direct structural and functional connection between ordered,
living bone and the surface of a load-carrying implant” [31]. In this way, the
biological response of an implant depends on the physicochemical properties of
the surface [32]. Recently, surface modification methods for titanium implant
materials such as calcium phosphate (Ca3(PO4)2) coatings [33], the alkali- and
heat-treatments [34], plasma coatings [35] and TiO2 nanotubes [36] have been

Influence of surface treatments on corrosion resistance
properties of ultrafine grained Titanium alloys for implant applications 4
studied as a means of improving implant integration. These methods of surface
preparation can be based on clean and well-characterized surfaces for general
biological evaluation as well as for understanding the role of specific surface
contaminants [28].
Therefore, aiming to advance the understanding of the mechanical and
corrosion properties of titanium alloys for biomedical applications, in this work two
titanium alloys, (α'+ β) Ti13Nb13Zr and β Ti35Nb7Zr5Ta alloys deformed by the
HPT method at conditions already defined in previous work [20], were studied.
Also, two different surface modification treatments, the anodization and chemical
treatments in the samples deformed by HPT as well as in samples non-deformed
were carried out. Finally, the effects of severe plastic deformation and surface
modification treatments were established through corrosion and bioactivity assays.
Objectives 5
2 OBJECTIVES
This doctoral project aims to evaluate the effect of the severe plastic
deformation as well as the surface modification treatments on the corrosion
resistance and bioactivity of the alloys Ti13Nb13Zr and Ti35Nb7Zr5Ta. The
specific objectives of this study are:
Study of surface modification such as anodization, chemical treatment by
both HCl and H3PO4 etching and NaOH activation in the alloys Ti13Nb13Zr
and Ti35Nb7Zr5Ta with different levels of severe plastic deformation by
high-pressure torsion (HPT) methodology.
Electrochemical characterization in a simulated body fluid (SBF), regarding
the corrosion resistance of surfaces (modified and not) of the alloys
Ti13Nb13Zr and Ti35Nb7Zr5Ta, processed with different levels of severe
plastic deformation by HPT.
Evaluate the effect of different levels of severe plastic deformation and
surface modification treatments on the bioactivity of the alloys Ti13Nb13Zr
and Ti35Nb7Zr5Ta.


Theoretical background 7
3 THEORETICAL BACKGROUND
3.1 Titanium: Physical Metallurgy
The physical metallurgy of titanium is both complex and exciting. Table 1
presents the physical properties of pure titanium [37].
Table 1: Physical properties of titanium (at room temperature). Adapted from Froes (2015)
[37].
Physical properties of pure titanium: Elastic moduli, polycrystalline:
Atomic number: 22 Young’s: 109 GPa
Atomic weight: 47.90 g/mol Shear: 37 GPa
Crystal structure: Bulk: 123 GPa
α: to 885 °C hexagonal close-packed Poisson’s ratio: 0.34
c = 4.6832 Å, a = 2.9504 Å, c/a = 1.5873 Melting temperature: 1670 °C
β: 885 °C up to the melting point: body-centered cubic Boiling temperature: 3260 °C
a = 3.3065 Å, closest atom distance, 2.860 Å X-ray spectra:
Density: Kα: 2.750 Å
α: 4.505 g/cm3 Kβ: 2.514 Å
β: 4.32 g/cm3 K absorption edge: 2.496 Å
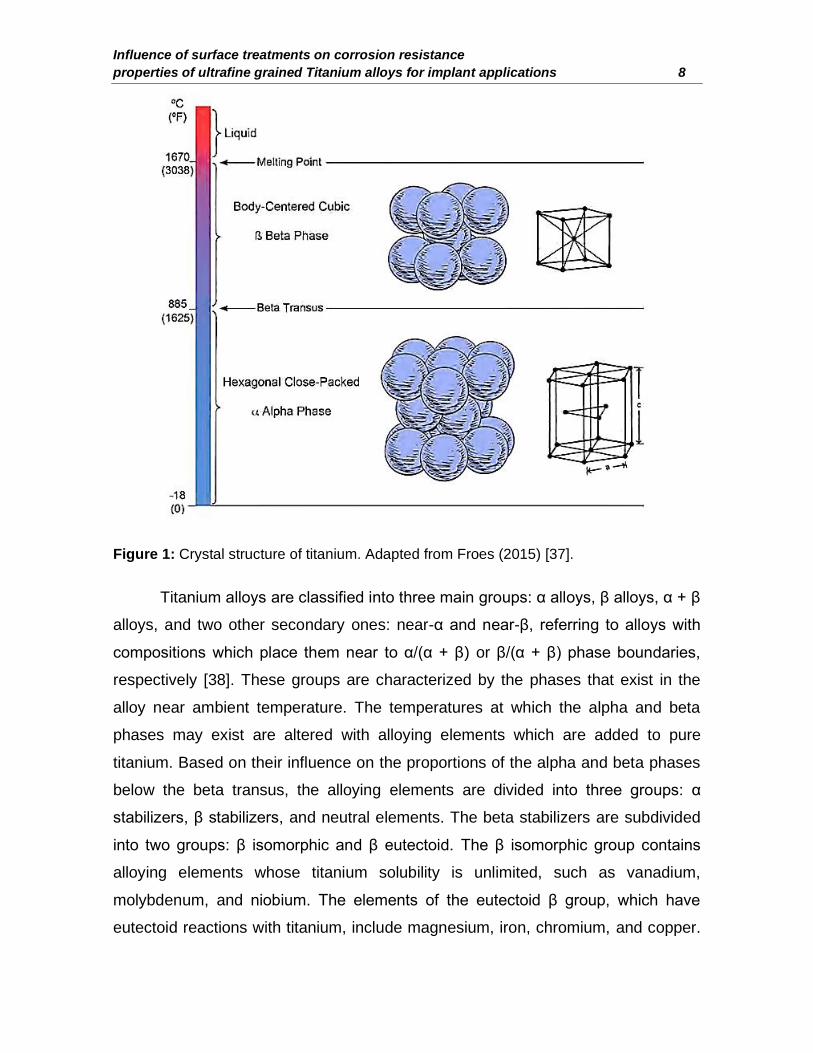
Pure titanium exhibits the phenomenon of allotropy. At low temperatures, it
exists as a hexagonal close-packed (HCP) crystalline structure, designated as
alpha phase (α), as shown in Figure 1. At high temperatures, above 882.5 °C, its
stable crystalline structure is the body-centered cubic (BCC) [37], designated as
beta phase (β), as also shown in Figure 1. For pure titanium, the temperature
which the transformation from alpha (HCP) to beta (BCC) occurs is called the beta
transus temperature. The addition of alloying elements changes this temperature.
Influence of surface treatments on corrosion resistance
properties of ultrafine grained Titanium alloys for implant applications 8
Figure 1: Crystal structure of titanium. Adapted from Froes (2015) [37].
Titanium alloys are classified into three main groups: α alloys, β alloys, α + β
alloys, and two other secondary ones: near-α and near-β, referring to alloys with
compositions which place them near to α/(α + β) or β/(α + β) phase boundaries,
respectively [38]. These groups are characterized by the phases that exist in the
alloy near ambient temperature. The temperatures at which the alpha and beta
phases may exist are altered with alloying elements which are added to pure
titanium. Based on their influence on the proportions of the alpha and beta phases
below the beta transus, the alloying elements are divided into three groups: α
stabilizers, β stabilizers, and neutral elements. The beta stabilizers are subdivided
into two groups: β isomorphic and β eutectoid. The β isomorphic group contains
alloying elements whose titanium solubility is unlimited, such as vanadium,
molybdenum, and niobium. The elements of the eutectoid β group, which have
eutectoid reactions with titanium, include magnesium, iron, chromium, and copper.
Theoretical background 9
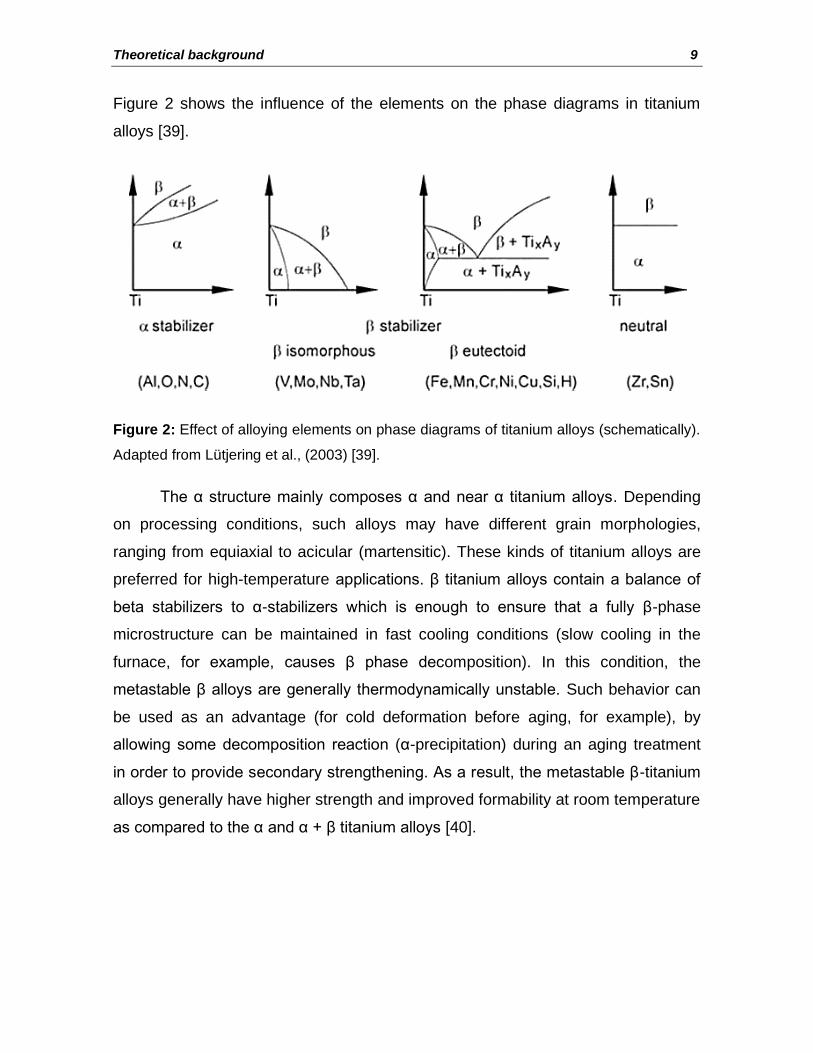
Figure 2 shows the influence of the elements on the phase diagrams in titanium
alloys [39].
Figure 2: Effect of alloying elements on phase diagrams of titanium alloys (schematically).
Adapted from Lütjering et al., (2003) [39].
The α structure mainly composes α and near α titanium alloys. Depending
on processing conditions, such alloys may have different grain morphologies,
ranging from equiaxial to acicular (martensitic). These kinds of titanium alloys are
preferred for high-temperature applications. β titanium alloys contain a balance of
beta stabilizers to α-stabilizers which is enough to ensure that a fully β-phase
microstructure can be maintained in fast cooling conditions (slow cooling in the
furnace, for example, causes β phase decomposition). In this condition, the
metastable β alloys are generally thermodynamically unstable. Such behavior can
be used as an advantage (for cold deformation before aging, for example), by
allowing some decomposition reaction (α-precipitation) during an aging treatment
in order to provide secondary strengthening. As a result, the metastable β-titanium
alloys generally have higher strength and improved formability at room temperature
as compared to the α and α + β titanium alloys [40].
Influence of surface treatments on corrosion resistance
properties of ultrafine grained Titanium alloys for implant applications 10
3.2 Ti13Nb13Zr alloy
The Ti13Nb13Zr alloy (in some articles named as TNZ) was developed in
1990 [41] by Davidson and Kovacs. Nowadays, it is part of a new class of
biomedical alloys used in medical implants [42].
It is an (α'+ β) alloy in water-quenched condition [43]. With subsequent
aging, the alloy consists of HCP martensite (α') and a retained BCC β phase. The
dispersed beta phase strengthens and hardens the material. Aging treatment
usually results in the conversion of the martensite into an α+ β mixture [44]. In the
water-quenched condition, this alloy has an elasticity modulus around 65 GPa [45].
As the modulus of this alloy is much closer to that of bone (30 GPa), it is
considered to be a better alternative when compared to the conventional alloys like
AISI Type 316L Stainless Steel with a modulus of 220 GPa and Co–Cr–Ni alloy
with a modulus of 240 GPa [46].
Khan et al., (1999) [47] called the attention to the fact that the Ti13Nb13Zr
alloy, made of non-toxic elements, had been proposed as more favorable for
orthopedic implants than the Ti6Al4V alloy because of its superior corrosion
resistance and biocompatibility. Reasons for this superiority have included the fact
that less metal ion release is likely to occur during spontaneous passivation of
Ti13Nb13Zr alloy because the corrosion products of the minor alloying elements,
niobium, and zirconium, are less soluble than those of aluminum and vanadium
[48]. Also, the passive oxide layer on the surface of the alloy is more inert
consisting of a dense rutile structure providing more excellent protection to the
underlying alloy.
Furthermore, the corrosion resistance of Ti13Nb13Zr in phosphate-buffered
saline (PBS) solution has also been evaluated, concluding that this alloy had better
corrosion resistance properties than pure titanium and Ti15Mo alloy, due to
formation of a very dense and stable passive layer [49].

Theoretical background 11
On the other hand, this alloy exhibits good mechanical [27,43,50,51] and
excellent tissue compatibility properties [42,52–54], which make it well suited for
biomedical applications where a bone anchorage is required, particularly for
implant applications. Standard specification for wrought Ti13Nb13Zr alloy for
medical implant application was settled in the ASTMF 1713-96 [55].
3.3 Ti35Nb7Zr5Ta alloy
The β type titanium alloy, Ti35Nb7Zr5Ta, (in some articles named as TNZT)
was developed by Dr. Henry Rack at Clemson University [56]. This alloy also is a
new metallic biomaterial that was designed to have outstanding osseointegration
ability, good mechanical strength, improved ductility, very low elastic modulus, and
excellent hot and cold workability [57].
The Ti35Nb7Zr5Ta alloy stood out as a prospective alloy mainly because it
had one of the lowest moduli to date (55 GPa) [56,58], almost 20-25% lower than
other available alloys [59], which is very close to the modulus of the bone [15].
Atapour et al., (2011) [60] reported that the corrosion resistance of
Ti35Nb7Zr5Ta alloy in 0.9 wt.% NaCl solution at 37 °C, is higher than for Ti6Al4V
and Ti13Mo7Zr3Fe alloys in these conditions. This observation reveals an
improvement in the corrosion protection characteristics of the alloys rich in niobium
[61].
On the other hand, Sonia et al., (2010) [62] reported that the Ti35Nb7Zr5Ta
alloy deposited with laser exhibits excellent corrosion resistance in both 0.1 N HCl
as well as in Ringer’s solution, comparable to, and in some cases even better than,
currently used Ti6Al4V ELI and CP Ti (Grade 2) alloys. Also, in-vitro studies
conducted on laser-deposited Ti35Nb7Zr5Ta alloy is encouraging and indicate that
these alloys are biocompatible aiding in both cell proliferation as well as in cell
differentiation [62].
Concerning the standard specification for Ti35Nb7Zr5Ta alloy for medical
implant application was settled in the Task Force F-04.12.23 [63].

Influence of surface treatments on corrosion resistance
properties of ultrafine grained Titanium alloys for implant applications 12
3.4 Severe Plastic Deformation (SPD)
The severe plastic deformation (SPD) is defined as a process in which ultra-
large plastic strains are introduced into a bulk material in order to achieve
significant grain refinement. The metallic materials obtained by SPD are ultrafine-
grained (UFG) (grain size in the range of 100–1000 nm) or nanostructured (NS)
(grain size below 100 nm) [64]. A large number of different SPD methods, such as
high-pressure torsion (HPT), equal channel angular pressing (ECAP) and
accumulative roll-bonding (ARB), have been developed [65]. The SPD by HPT has
shown a greater refinement of microstructure [18]. The principle of current HPT
process is described schematically in Figure 3 [66].
Figure 3: Schematic illustration of the HPT process. Adapted from Zhilyaev et al., (2008)
[66].
The sample in a disk form is located between two anvils under compressive
pressure, P, of several GPa at room or elevated temperature and simultaneously it
is subjected to a torsional strain which is imposed through rotation of the lower

Theoretical background 13
anvil. Surface frictional forces, therefore, deform the disk by shear so that
deformation proceeds under a quasi-hydrostatic pressure.
Pure Ti displays the highest biocompatibility with living organisms.
Nonetheless, it has limited use in medicine due to its low strength [67]. Recently it
has been shown that high-strength nanostructured pure Ti processed via SPD can
provide a new and promising alternative in medical device technology [23]. This
approach has the advantages of improved biocompatibility and reduces the size of
the implants significantly, decreasing the level of surgical intervention in the human
body [43,44].
The mechanical properties of the nanostructured Ti are even higher
compared to those of conventional high-strength Ti alloys (such as Ti6Al4V) used
in biomedical engineering [69]. Nanostructuring of Ti also positively affects its
biomedical properties. The company ‘Timplant’ (Ostrava, Czech Republic)
manufactures nanostructured Ti dental implants under the trademark Nanoimplant®
since 2006 [www.timplant.cz]. To date, these dental implants have been certified
according to the European standard EN ISO 13485:2003. The new generation
implants have a smaller diameter (2.0 mm) compared to the standard ones (3.5
mm) [69]. Therefore, they can be successfully inserted into thin jawbones where
larger implants cannot be used. Another advantage of smaller dental implants is
less damage induced into the jawbone during surgical intervention. For example,
Figure 4(a) illustrates the Nanoimplant®. It is installed into the body of an 18-year-
old patient with thin jawbones between teeth 11 and 13 [69]. Another implant with a
diameter of 2.4 mm was inserted to the right-side position 12 (Figures. 4(b) and
(c)). The patient left the dental office with two nano implants and with two
temporary crowns made on the same day as implants were inserted. After six
weeks, final metal-ceramic crowns were fixed on the implants.
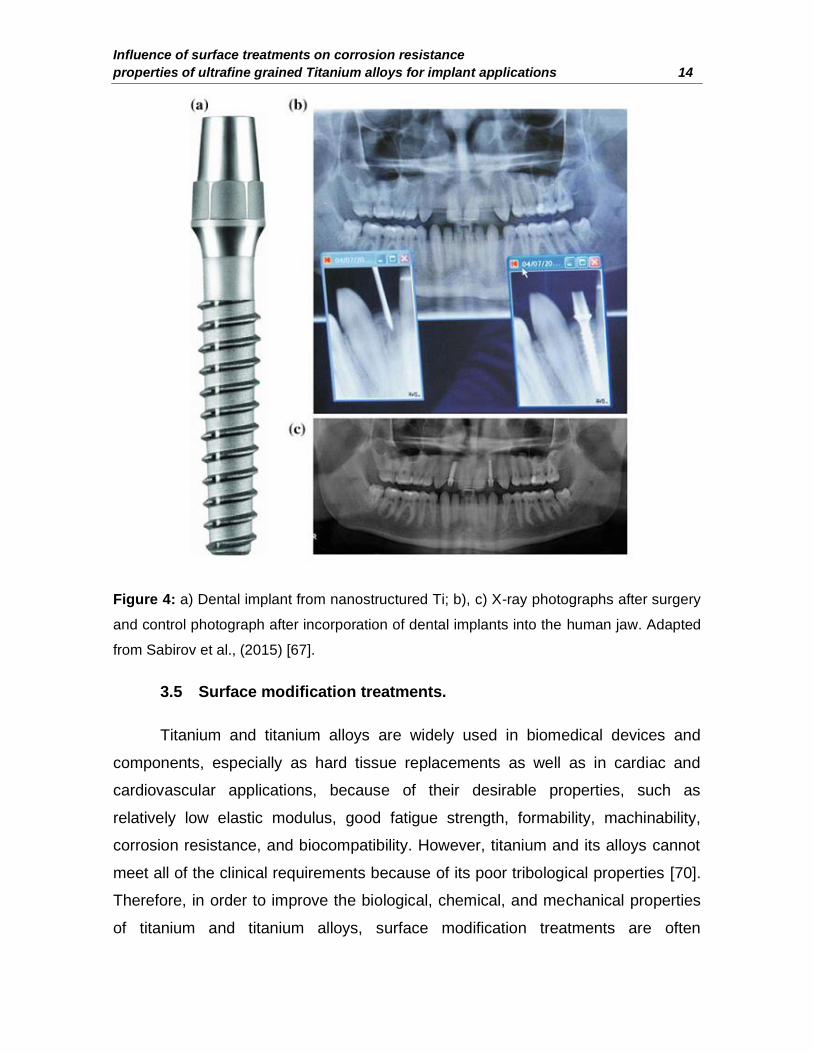
Influence of surface treatments on corrosion resistance
properties of ultrafine grained Titanium alloys for implant applications 14
Figure 4: a) Dental implant from nanostructured Ti; b), c) X-ray photographs after surgery
and control photograph after incorporation of dental implants into the human jaw. Adapted
from Sabirov et al., (2015) [67].
3.5 Surface modification treatments.
Titanium and titanium alloys are widely used in biomedical devices and
components, especially as hard tissue replacements as well as in cardiac and
cardiovascular applications, because of their desirable properties, such as
relatively low elastic modulus, good fatigue strength, formability, machinability,
corrosion resistance, and biocompatibility. However, titanium and its alloys cannot
meet all of the clinical requirements because of its poor tribological properties [70].
Therefore, in order to improve the biological, chemical, and mechanical properties
of titanium and titanium alloys, surface modification treatments are often

Theoretical background 15
performed. Two surface modification treatments related to titanium and titanium
alloys will be reviewed hereafter.
3.5.1 The growth of TiO2 nanostructures by electrochemical
anodization
The discovery of carbon nanotubes reported by Iijima in 1991 opened a new
area of research in materials science [71]. The one-dimensional (1D)
nanostructures provide unique electronic properties such as electron mobility and a
very high specific surface area [72]. Although carbon is still the most explored
nanotube material, a considerable range of other materials have been studied,
which are mainly transition metal oxides and sulfides, which have also shown
fascinating new properties and features [72].
Among the transition metal oxides, the titanium dioxide (TiO2) is one of the
most studied because of its exceptional properties: non-toxicity, high electrical
conduction, corrosion resistance, and biocompatibility (use in medicine) [72]. The
TiO2 is frequently used in paint, white pigments, sun-blockers, solar panels, for
photocatalytic reactions and biomedical coatings [73,74]. For most of these
applications, it is necessary to increase the specific surface area of the material to
achieve maximum overall efficiency and therefore nanoparticulated forms of TiO2
are widely used [75].
As mentioned previously, titanium is widely used in the replacement of hard
tissue and cardiovascular tissue. Since the surface of the implant is responsible for
the osseointegration process, it is essential to modify this surface to obtain better
biocompatibility. The adhesion of a nanostructured surface increases the
biocompatibility when compared usual metal surfaces, showing that nanotubes
improve osseointegration. Surfaces that contain TiO2 nanotubes increase cell
growth and increase hydroxyapatite (HAp) deposition [76]. The HAp
(Ca10(PO4)6(OH)2) presents chemical and structural similarities with the inorganic
component of the bone matrix. It adapts to the rate of resorption and growth of
bone, turning the nanostructured material the right choice for use in prostheses.

Influence of surface treatments on corrosion resistance
properties of ultrafine grained Titanium alloys for implant applications 16
TiO2 nanotubes are obtained by electrochemical anodization in aqueous or
organic electrolytes with fluoride ions (e.g., aqueous electrolyte either with acids-
H2SO4, or H3PO4 [9], or salts (NH4)2SO4, or Na2SO4 or glycerol or ethylene glycol,
and so forth) [22].
The critical processes involved in TiO2 nanotubes formation are (1) the
oxide growth at the metal surface due to the interaction of the metal with O2– or
OH- ions [77]. After the formation of a first oxide layer, these anions migrate
through the oxide layer reaching the metal/oxide interface where they react with
the metal. (2) Metal ion (Ti4+) migration from the metal at the metal/oxide interface;
Ti4+ cations will be ejected from the metal/oxide interface under application of an
electric field that move toward the oxide/electrolyte interface [78]. (3) Field-assisted
dissolution of the oxide at the oxide/electrolyte interface. Due to the applied electric
field, the Ti–O bond undergoes polarization and is weakened, promoting
dissolution of the metal cations. Ti4+ cations dissolve into the electrolyte, and the
free O2- anions migrate toward the metal/oxide interface, process (1), to interact
with the metal [78]. Finally, (4) chemical dissolution of the metal, or oxide, by the
acidic electrolyte. Chemical dissolution of TiO2 in the HF electrolyte plays a crucial
role in the formation of nanotubes rather than simple nanoporous structures [78].
3.5.1.1 Chemistry of the process
The process of formation of anodic oxide appears rather complicated, yet a
general and simplified model of the chemistry involved is required to understand
the process. The outer anodic layer (partly exposed to the electrolyte) has an
excess of hydroxyl ions compared to the inner layer and is considered to be
Ti(OH)4 [79]. The inner layer, where the dehydroxylation of the film (water
releasing) has occurred, is represented as TiO2. In reality, there is likely to be a
concentration gradient across the film, which can be written as TiO2.xH2O, to
represent the inner (dry) and outer (hydrated) anodic oxide.
The reactions which occur at the anode are (i) oxidation of the metal which
releases Ti4+ ions and electrons, see Eq. (1) [79]:

Theoretical background 17
2Ti → 2Ti4+ + 8e− (1)
(ii) combination of Ti4+ ions with OH– and O2– species provided by the water.
The following equations (2) and (3) explain the hydrated anodic layer and
the oxide layer. The further oxide is produced when the hydrated anodic layer
releases water by a condensation reaction, Eq. (4) [79]:
Ti4+ + 4OH− → Ti(OH)4 (2)
Ti4+ + 2O2− → TiO2 (3)
Ti(OH)4 → TiO2 + 2H2O (4)
At the cathode, hydrogen evolution occurs, according to Eq. (5):
2H+ + 2e− → H2 (5)
The overall process of oxide formation is given by Eq. (6):
Ti + 2H2O → TiO2 + 4H+ + 4e− (6)
Fluorine ions can attack the oxide and hydrated layer; or, the ions being
mobile in the anodic layer under the applied electric field as described by Eq. (7)
[80]:
TiO2 + 6F− → TiF62− + 2O2− (7)
In the initial stages of the anodization process, field-assisted dissolution
dominates chemical dissolution due to the relatively large electric field across the
thin oxide layer [81]. Small pits formed due to the localized dissolution of the oxide;
represented by the (Eq 7), act as pore-forming centers, after which these pits

Influence of surface treatments on corrosion resistance
properties of ultrafine grained Titanium alloys for implant applications 18
convert into pores with increasing pore density, uniformly, over the surface. The
pore growth occurs due to the inward movement of the oxide layer at the pore
bottom (barrier layer) [78]. The Ti4+ ions migrating from the metal to the
oxide/electrolyte interface dissolve in the HF electrolyte. The rate of oxide growth
at the metal/oxide interface and the rate of oxide dissolution at the pore-
bottom/electrolyte interface ultimately become equal, after that the thickness of the
barrier layer remains unchanged although it moves further into the metal increasing
the pore depth [78].
Usually, anodization experiments are carried out in a two-electrode or three-
electrode electrochemical cell with titanium or a titanium alloy as the anode,
platinum foil as the cathode and in the case of a three-electrode cell with an
Ag/AgCl electrode as the reference electrode [22]. A constant potential is applied
using a DC power supply, as shown in Figure 5.
Figure 5: Growth of regular TiO2 nanotubes: (a) cathodic reaction, (b) anodic reaction, (c)
transition state of TiO2 layer, (d) starting of nanotube formation and (e) titania nanotubes.
Adapted from Minagar et al., (2012) [80].
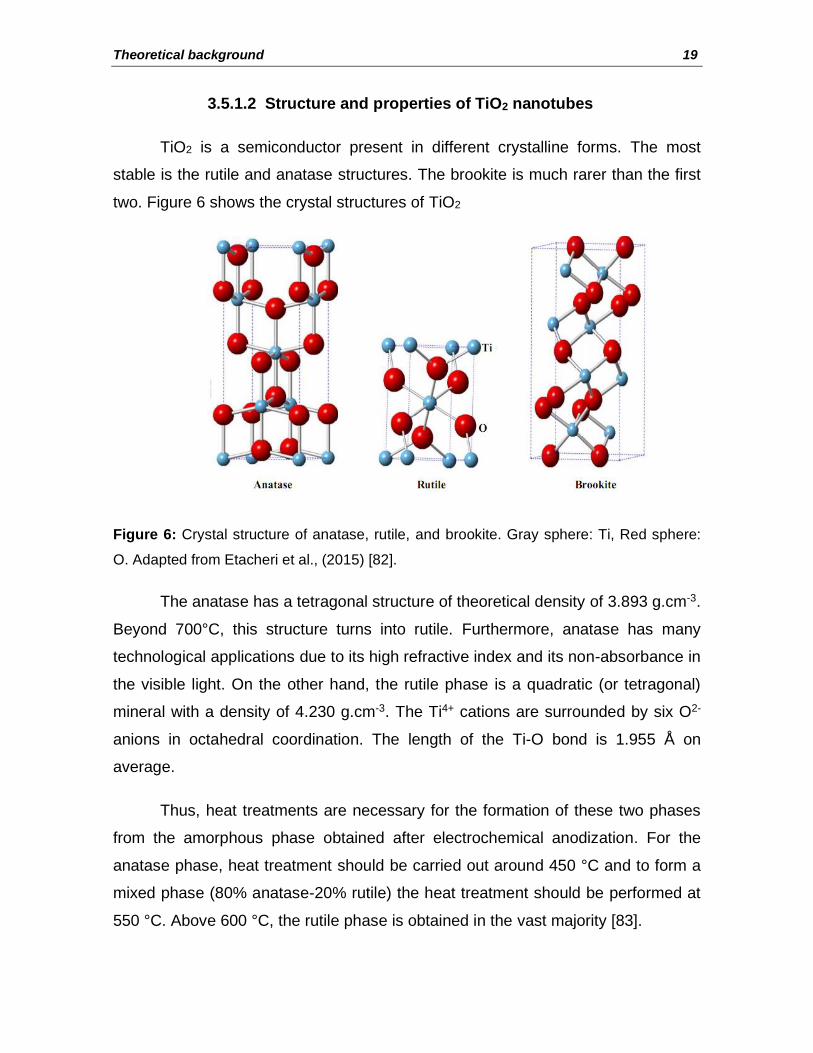
Theoretical background 19
3.5.1.2 Structure and properties of TiO2 nanotubes
TiO2 is a semiconductor present in different crystalline forms. The most
stable is the rutile and anatase structures. The brookite is much rarer than the first
two. Figure 6 shows the crystal structures of TiO2
Figure 6: Crystal structure of anatase, rutile, and brookite. Gray sphere: Ti, Red sphere:
O. Adapted from Etacheri et al., (2015) [82].
The anatase has a tetragonal structure of theoretical density of 3.893 g.cm-3.
Beyond 700°C, this structure turns into rutile. Furthermore, anatase has many
technological applications due to its high refractive index and its non-absorbance in
the visible light. On the other hand, the rutile phase is a quadratic (or tetragonal)
mineral with a density of 4.230 g.cm-3. The Ti4+ cations are surrounded by six O2-
anions in octahedral coordination. The length of the Ti-O bond is 1.955 Å on
average.
Thus, heat treatments are necessary for the formation of these two phases
from the amorphous phase obtained after electrochemical anodization. For the
anatase phase, heat treatment should be carried out around 450 °C and to form a
mixed phase (80% anatase-20% rutile) the heat treatment should be performed at
550 °C. Above 600 °C, the rutile phase is obtained in the vast majority [83].

Influence of surface treatments on corrosion resistance
properties of ultrafine grained Titanium alloys for implant applications 20
3.5.1.3 Nanotube arrays on titanium alloys
Nanotubes had been synthesized using Ti alloys as substrate material. For
example, Macak et al., (2007) reported the synthesis of oxide nanotube layers
grown on Ti6Al7Nb alloy and TiNb alloy, as is shown in Figure 7 [84].
Figure 7: SEM images showing self-organized oxide nanotube layers grown on Ti6Al7Nb
alloy (A) and (B), TiNb alloy. The insets show top-views of the nanotube layers. Adapted
from Macak et al., (2007) [84].
Most of the Ti alloys used in engineering/biomedical applications show a
dual-phase that is α + β microstructure [85]. Therefore, the formation of a uniform
nanotubular oxide layer on these Ti alloys cannot be achieved due to the difference
in chemistries of these phases [85].
3.5.2 Chemical treatment by acid etching and alkali activation
3.5.2.1 Acid etching
Acid treatment is often used to remove oxide and contamination to obtain
clean and uniform surface finishes. Takeuchi et al., 2003 investigated the
decontamination efficiency of three acids, Na2S2O8, H2SO4, and HCl, on the
titanium surface and found that HCl was the best decontamination agent because it
could easily dissolve the titanium salts and not weaken Ti surface [28].

Theoretical background 21
Acid-etching has been shown to enhance osseointegration greatly [86]. For
example, the immersion of titanium implants for several minutes in a mixture of
concentrated HCl and H2SO4 heated above 100°C (dual acid-etching) was
employed to produce a micro-rough surface (see Figure 8). This type of surface
promoted rapid osseointegration and maintained long-term success over three
years [87]. Similarly, it has been found that dual acid-etched surfaces enhance the
osteoconductive process through the attachment of fibrin and osteogenic cells,
resulting in bone formation directly on the surface of the implant [88].
Figure 8: SEM micrographs of an SLA surface on a titanium dental implant (Courtesy of
Straumann AG, Switzerland).Adapted from Le Guéhennec et al., (2007) [86].
3.5.2.2 Alkali activation
A simple chemical method was established to induce bioactivity of titanium
and its alloys. When Ti alloys were treated with NaOH solution (10 M) and
subsequently heat-treated at 60 °C, a thin sodium titanate layer was formed on
their surfaces [89]. Thus, the treated samples, immersed in simulated body fluid
(SBF), formed a dense and uniform bonelike apatite layer on their surfaces with ion
concentrations nearly equal to those of human blood plasma [89].
The structural change on the titanium surface during alkali and heat
treatments and the mechanism of apatite formation on the treated surface, of
samples immersed in SBF, are described as follows [70].

Influence of surface treatments on corrosion resistance
properties of ultrafine grained Titanium alloys for implant applications 22
TiO2 + NaOH → HTiO3− + Na+ (8)
During the alkali treatment, the TiO2 layer partially dissolves in the alkaline
solution because of the attack by hydroxyl groups. This reaction is assumed to
proceed simultaneously with the hydration of titanium [70].
Ti + 3OH− → HTiO3− + 4e− (9)
Ti(OH)3+ + e− → TiO2. H2O + 1
2⁄ H2 ↑ (10)
Ti(OH)3+ + OH− ↔ Ti(OH)4 (11)
A further hydroxyl attack on the hydrated TiO2 produces negatively charged
hydrates on the surfaces of the substrates as follows [70]:
TiO2. H2O + OH− ↔ HTiO3−. nH2O (12)
These negatively charged species combine with the alkali ions in the
aqueous solution to produce an alkaline titanate hydrogel layer. During the heat
treatment, the hydrogel layer is dehydrated and densified to form a stable
amorphous or crystalline alkali titanate layer [70].
The process of apatite formation can be interpreted regarding the
electrostatic interaction between the functional groups and ions in the fluid. The Ti-
OH groups formed on the surface of sodium titanate, after soaking in SBF, are
negatively charged and hence, selectively combine with the positively charged
Ca2+ ions in the fluid to form calcium titanate, as shown in Figure 9 [90].

Theoretical background 23
Figure 9: Schematic representation of the relationship between changes in surface
structure and the potential of amorphous sodium titanate in the apatite formation process
on its surface, in an SBF solution. Adapted from Kokubo et al., (2003) [90].
As the calcium ions accumulate on the surface, it gradually gains an overall
positive charge. Then, the positively charged surface combined with negatively
charged phosphate ions forms amorphous calcium phosphate which
spontaneously is transformed into apatite. The apatite is a stable phase in the body
environment [90].
3.6 Electrochemical characterization
Electrochemical characterization is a powerful technique used to understand
the relevant reaction mechanisms involved in charge transfer, mass transport,
electrolyte transport, electron transport, and so on [91].

Influence of surface treatments on corrosion resistance
properties of ultrafine grained Titanium alloys for implant applications 24
Several methods of electrochemical characterization are used in this study:
open circuit potential measurement, polarization curve graph (and Tafel
extrapolation) and electrochemical impedance spectroscopy (EIS). Therefore, they
will be explained below.
3.6.1 Measurements of open circuit potential (OCP)
Measurements of the electrochemical potential are one of the most basic
measurements in electrochemistry. The potential of a metal in an aqueous solution
is a function of the inherent reactivity of the metal and the oxidizing power of the
solution [92]. The goal of potential measurements is to measure the potential of the
specimen without affecting, in any way, electrochemistry reactions on the
specimen surface. It is necessary to make the potential measurements relative to a
stable reference electrode so that any changes in the measured potential can be
attributed to changes at the specimen/solution interface [93]. A reference electrode
requires that its potential is reproducible and stable. When a suitable reference
electrode is used, the potential of the specimen or working electrode can be
controlled reproducibly, and any changes in the measured potential during the test
can be related with confidence to changes in working electrode potential [93]. An
unstable or contaminated reference electrode is unacceptable and will result in
incorrect results.
3.6.2 The principle of potentiodynamic polarization and extrapolation
of Tafel
Potentiodynamic polarization is a destructive technique where the potential
of the electrode is varied at a selected rate, and the resulting current is measured.
In this test, the potential is varied from slightly cathodic (or anodic) to anodic (or
cathodic) region to know the reactivity of the system close to its corrosion potential
or OCP. Also to other potential values which the interface could take during
modification of the medium (for example, the conditions of use of the material or
the formation of corrosion zones).

Theoretical background 25
The plot of the current vs. voltage curve of a system is called the
polarization curve. The representation usually used in the context of the study of
corrosion consists in plotting the absolute value of the current density (i) in
logarithmic scale (obtained by dividing the current measured by the exposed
surface) as a function of the applied voltage. This type of curve gives us
information as the passive and active region of the system, as well as the corrosion
potential (Ecorr), and corrosion current density (icorr).
When recording a polarization curve, the corrosion potential is marked by a
sharp drop in current on both anodic (right part) and cathodic (left part) branches,
thus forming a “peak” directed down.
Moreover, it is possible to plot Tafel lines (linearity zone of current or current
density in a defined range of potentials) as presented in Figure 10. This method is
strictly applicable only if the linear part covers at least one decade of current. In
this case, the intersection of these lines at the corrosion potential gives the value of
the corrosion current density, which is directly proportional to the corrosion rate —
the lower the icorr, the better corrosion resistance of the material in the medium
under study.
The most basic procedure for experimentally evaluating corrosion current
(Icorr) is by Tafel extrapolation [94]. It is possible to plot Tafel lines, as presented in
Figure 10. The intersection of these lines at the corrosion potential gives the value
of the corrosion current density, which is directly proportional to the corrosion rate
— the lower the icorr, the better corrosion resistance of the material in the medium
under study.
This method requires the presence of a linear or Tafel section in the
polarization curve (Figure 10). A potential scan of approximately ±30 mV around
corrosion voltage (Ecorr) is required to determine if a linear region of at least one
decade of current is present, such that a reasonably accurate extrapolation can be
made to the Ecorr [95].

Influence of surface treatments on corrosion resistance
properties of ultrafine grained Titanium alloys for implant applications 26
Figure 10: Schematic representation of the Tafel extrapolation method.
In many cases, a linear region may not be observed even in the cathodic
branch. This behavior can be a result of corrosion under diffusion control or, on
decreasing the potential, entering into the diffusion control region, or even that the
nature of the interface changes with changing potential.
3.6.3 Electrochemical Impedance Spectroscopy (EIS)
While potentiodynamic polarization provides a very informative approach for
the corrosion behavior of metals, it is nevertheless, destructive and only informs
about the global electrochemical processes taking place at the interface, the weight
of the slowest processes is preponderant.
On the other hand, the EIS is a technique non-destructive, and it is based on
the excitation of the working electrode by a low amplitude alternating current (AC)
voltage (typically 10 - 20 mVrms) at several discrete frequencies logarithmically
distributed along several decades. This principle is illustrated in Figure 11.

Theoretical background 27
Figure 11: Schematic representation of the principle of measurements by EIS.
The alternating current (AC) voltage, applied to an electrochemical cell, and
the current response are shown by equations 13 and 14.
E(t) = E0 sin(ωt) (13)
I(t) = I0 sin(ωt + ϕ) (14)
Where E0 is the signal amplitude, ω is the radial frequency such as ω= 2πf, f
the frequency (in Hz), ϕ is the phase shift relative to the potential input and, I0 is the
amplitude of the current.
Following this and using Ohm’s law, the impedance is determined according
to equation 15. Thus, the impedance can be defined as the measure of an
electrochemical system’s tendency to resist (or impede) the flow of the alternating
electrical current [96].
Z(ω) =E0
I0exp(jΦ) = |Z|exp(jΦ) (15)
Where |Z| is the impedance modulus of a complex number and can be
represented as a sum of real and imaginary parts of the impedance.

Influence of surface treatments on corrosion resistance
properties of ultrafine grained Titanium alloys for implant applications 28
Z(ω) = |Z|(cosΦ + jsinΦ) = Zr(ω) + jZi(ω) (16)
As the various elementary processes evolve at different speeds, the
response of the system dissects the overall electrochemical process. Thus, as a
general appreciation of the method, high frequencies most often correspond to
capacitive phenomena (non-faradic), medium frequencies to charge transfers
(faradic) and low frequencies to diffusion phenomena.
Two types of complementary graphic representations are used to analyze
the impedance measurements. The impedance modulus (|Z|), the phase (ϕ), and
the frequency (ω) are plotted on what is known as a Bode plot, such as in Figure
12(b) (Bode magnitude plot) and Figure 12(c) (Bode phase plot). The |Z| and ϕ
information can also be displayed in a complex plane plot called the Nyquist plot,
such as that in Figure 12(a). It is a plot of the imaginary part of the impedance (Z´´
or Zim) versus the real part of the impedance (Z´ or Zre) and where the frequency
never explicitly appears; it must be obtained from the raw data point [97].

Theoretical background 29
Figure 12: Nyquist plot (a), Bode magnitude (b) and Bode phase angle (c).
Both plots show precisely the same data but plotted in a different format.
The Bode plot shows the frequency directly, and the whole frequency range is
identifiable. However, impedances at low frequencies may be difficult to identify
from the Nyquist plot [98].
As electrochemical systems often behave like simple electrical circuits, it is
possible to identify them by the EIS data analysis. For example, in a simple
resistor, the current sine wave is exactly in phase with the voltage sine wave. Thus,
the phase angle of a resistor’s impedance is 0°. For an ideal resistor, this is true at
all frequencies. Therefore, the Bode magnitude plot is just a horizontal straight line,
and the Bode phase angle is always zero [98]. In the Nyquist plot, the imaginary
part of the impedance will also be zero, and the resistor’s impedance lies on the
real axis.
The capacitor is another simple electrical circuit element. For a pure
capacitor, the current is 90° out of phase with the voltage. The Bode magnitude

Influence of surface treatments on corrosion resistance
properties of ultrafine grained Titanium alloys for implant applications 30
plot for a capacitor is a straight line with a slope of –1 with high impedance at low
frequency. Because the phase shift of a capacitor is always 90°, the Bode phase
plot is a horizontal line at –90° throughout the entire frequency range [99]. The
Nyquist plot for an ideal capacitor lacks essential information. The intercept on the
real axis at high frequencies is the resistance of the electrolyte between the
working electrode and the reference electrode, which is indistinguishable on this
plot. As well, the real component of the impedance is zero, and the total
impedance is equal to the imaginary impedance.
In electrochemical systems, examples of the resistor are the resistance of
the electrolyte in the electrochemical cell, the resistance of a porous layer and the
polarization resistance. On the other hand, examples of a capacitor are a metal
coated with a passive film, immersed in an electrolyte and the metal-electrolyte
interface knows as the “double layer”.
3.6.3.1 Equivalent Circuit Models and Analysis of
Electrochemical Impedance
EIS data commonly can be modeled by an equivalent electrical circuit
(EEC). Most of the circuit elements in the model are constructed by combining
electrical elements in series and/or in parallel, such as resistors (R), capacitors (C),
and inductors (L).
The interpretation of the impedance results requires an appropriate model
and knowledge about chemical-physical processes that occur in the
metal/electrolyte interface [100]. The typical circuit elements, the equation for their
current versus voltage relationship, and their impedance are listed in Table 2.
Table 2: Common electrical elements.
Component Current vs. Voltage Impedance
Resistor E = IR Z = R
Inductor E = L di / dt Z = jωL
Capacitor I = C dE / dt Z = 1 / jωC

Theoretical background 31
When modeling an electrochemical system as an electrochemical circuit, a
potential waveform is applied across the circuit, and a current response to the
frequency signal generates impedance data. Thus, the impedance data is related
to a phase shift angle and a variation in potential and current amplitudes. This
technique is a straightforward approach for analyzing the corrosion behavior of a
metal [101].
For instance, Figure 13 shows two schematic electrical circuit models can
be used to represent electrochemical systems. For a bare, corroding metal in an
electrolyte solution (Fig. 13(a)), only the solution resistance (Rs), polarization
resistance (Rp) and the capacitor (C), associated with the double layer capacitance
(Cdl) of the metal/electrolyte interface, are needed in a simple circuit [101].
On the other hand, if the electrochemical system is diffusion control (Fig.
13(b)), a diffusion impedance (ZD) is incorporated in the circuit [101].
Figure 13: Schematic electrochemical impedance circuits. (a) Charge control. (b) Diffusion
control, adapted from Perez (2016) [101].
When the electrochemical responses are not ideal and cannot be
represented by a connection of simple R-C-L elements, the Constant Phase
Element (CPE) is used. CPE is a parameter usually used in fitting EEC in
electrochemical impedance spectroscopy. The impedance of a constant-phase
element is defined as [102]:

Influence of surface treatments on corrosion resistance
properties of ultrafine grained Titanium alloys for implant applications 32
Z = [Q(jω)α]−1 (17)
The CPE parameters α and Q are independent of frequency. When the
electrode shows a capacitive behavior, α is equal to 1, Q has units of a
capacitance (µF/cm2). When α< 1, the system shows behavior that has been
attributed to surface heterogeneity [103] or to continuously distributed time
constants for charge-transfer reactions. When α is 0.5, it indicates an infinite
Warburg impedance.
The CPE parameters α and Q can be obtained from graphical methods
[104]. The parameter α is calculated from the slope of the log |Zi | vs. log f curve
[104]:
𝛼(𝑓) = |𝑑 𝑙𝑜𝑔|𝑍𝑖(𝑓)|
𝑑 log 𝑓| (18)
and Q is obtained from:
𝑄 = −1
𝑍𝑖(𝑓)𝑥(2𝜋𝑓)𝛼𝑥 𝑠𝑖𝑛 (
𝛼𝜋
2)
(19)
The parameters α and Q obtained by graphical evaluation of equations (18)
and (19) are the same as would be obtained by regression analysis [104].
On the other hand, two different equations were developed for estimating
effective capacitance from Constant-Phase-Element (CPE) parameters [103]. If the
CPE behavior is assumed to be associated with surface distributed time constants
for charge-transfer reactions (time-constant distribution along the electrode
surface), then it is possible to apply the equation derived by Brug et al. to calculate
the effective capacitance associated with the CPE [104]:

Theoretical background 33
𝐶𝑒𝑓𝑓(𝐵𝑟𝑢𝑔) = 𝑄1𝛼(𝑅𝑒
−1 + 𝑅𝑡−1)
𝛼−1𝛼 (20)
where Re is the electrolyte resistance and Rt the charge transfer resistance.
The second equation (normal distribution of time constants) is described by
the relation of Hsu-Mansfeld [25,103]:
𝐶𝑒𝑓𝑓(𝐻 − 𝑀) = 𝑄1𝛼(𝑅𝑡)
1−𝛼𝛼 (21)
thus, CPE impedance response can be associated with an effective
capacitance, the dielectric constant or the film thickness may be obtained from
[105]:
𝐶𝑒𝑓𝑓 =𝜖 · 𝜖0
𝛿 (22)
where δ is the film thickness, ϵ is the dielectric constant, and ϵ0 is the
permittivity of vacuum with a value of ϵ0 = 8.8542 × 10⁻¹⁴ F/cm [105].
3.6.4 Corrosion of ultrafine-grained materials obtained by severe
plastic deformation
Development of corrosion-resistant metallic materials for advanced
applications is a current task for modern materials science with attention to both
effectiveness and security of the cutting-edge technologies and environmental
security taking into consideration risks of global warming and industrial disasters.
The problem of utmost importance is the development of new functional materials
with reasonable corrosion resistance to be used in new-generation applications.
Grain refinement by SPD processing accompanies other microstructural
changes in a complicated way. These changes include phase transformation [20],
redistribution of impurity and solute elements [106], the morphology change of
Influence of surface treatments on corrosion resistance
properties of ultrafine grained Titanium alloys for implant applications 34
precipitation by partial dissolution and physical fragmentation [107], residual
dislocation density [108], texture [109], and so on. Effect of these changes is
superimposed on grain size effect on corrosion.
Titanium alloys have high corrosion resistance. Several factors influence the
corrosion resistance in titanium alloys processed by SPD. Particularly, basal
planes of CP Ti offer higher corrosion resistance independently of grain size. On
the other hand, corrosion studies for titanium alloys after severe plastic
deformation have been minimal [24].
Deformation processing imparts significant physical and chemical changes
to the material in addition to the grain refinement that, in turn, considerably affects
the demonstrated functional properties, including corrosion behavior. Thus,
systematic investigations of corrosion stability of SPD nanostructured materials
and revealing its dependence on nanostructural parameters remain as one of the
most challenging tasks in modern materials science [67].
3.7 Osseointegration
Osseointegration, defined as a direct structural and functional connection
between ordered, living bone and the surface of a load-carrying implant, is critical
for implant stability and is considered a prerequisite for implant loading and long-
term clinical success of endosseous implants [110]. Otherwise, the formation of
fibrous tissue around the implant could lead to rejection of the prosthesis.
The osseointegration must be linked to bioactivity. A material with proper
osseointegration is a bioactive material. When this material is immersed in a
physiological fluid, it spontaneously forms on its surface an apatite layer, or
specifically hydroxyapatite [70].
Hydroxyapatite (HAp) is an inorganic compound made of calcium phosphate
and hydroxyl groups, with a stoichiometry of (Ca10(PO4)6(OH)2) and a hexagonal
crystal structure. Natural HAp is the primary mineral constituent of hard human
tissues such as bones and teeth. It has the same crystal structure, but a

Theoretical background 35
stoichiometry slightly different from the synthetic one since some calcium ions can
be exchanged by other metallic ions, such as magnesium or sodium [111]. The
production of synthetic HAp has acquired a great significance in recent years due
to its excellent properties of biocompatibility, bioactivity, osteoconductivity, and
osteoinductivity [47, 48].
In this context, some experiments that will be carried out as part of this
project have as a particular objective the study of bioactivity specifically by the
growth of HAp.

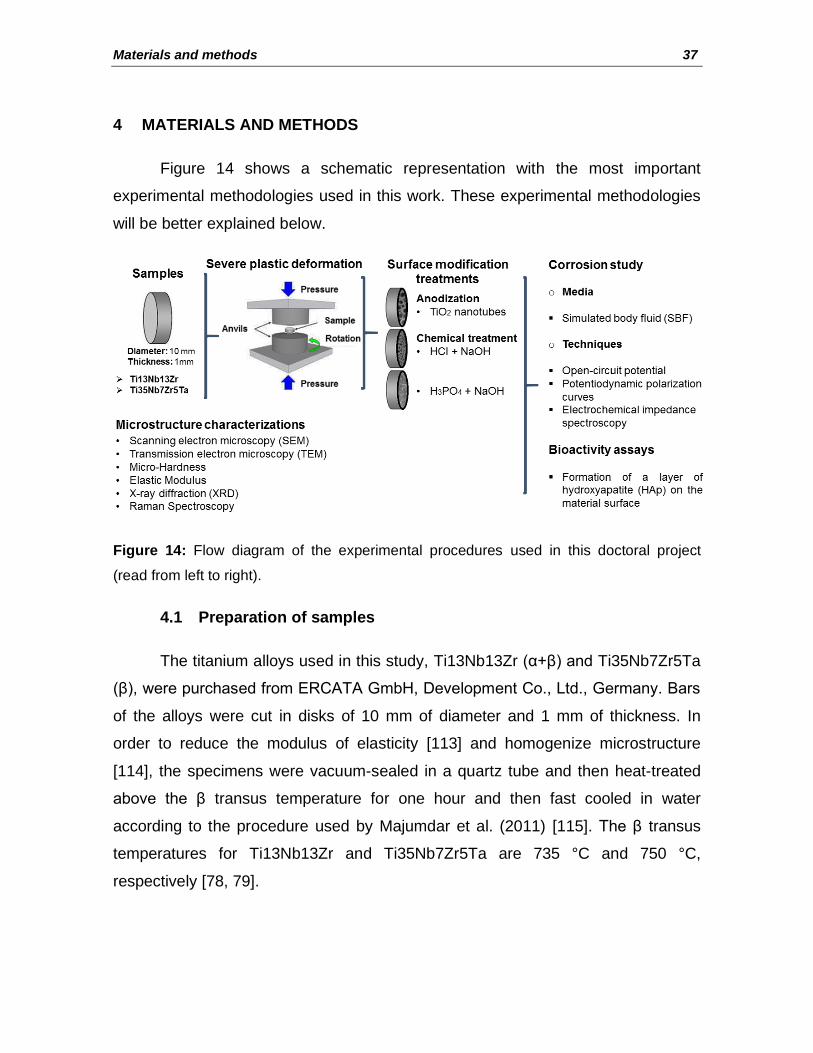
Materials and methods 37
4 MATERIALS AND METHODS
Figure 14 shows a schematic representation with the most important
experimental methodologies used in this work. These experimental methodologies
will be better explained below.
Figure 14: Flow diagram of the experimental procedures used in this doctoral project
(read from left to right).
4.1 Preparation of samples
The titanium alloys used in this study, Ti13Nb13Zr (α+β) and Ti35Nb7Zr5Ta
(β), were purchased from ERCATA GmbH, Development Co., Ltd., Germany. Bars
of the alloys were cut in disks of 10 mm of diameter and 1 mm of thickness. In
order to reduce the modulus of elasticity [113] and homogenize microstructure
[114], the specimens were vacuum-sealed in a quartz tube and then heat-treated
above the β transus temperature for one hour and then fast cooled in water
according to the procedure used by Majumdar et al. (2011) [115]. The β transus
temperatures for Ti13Nb13Zr and Ti35Nb7Zr5Ta are 735 °C and 750 °C,
respectively [78, 79].

Influence of surface treatments on corrosion resistance
properties of ultrafine grained Titanium alloys for implant applications 38
In this work, all the samples of each alloy were initially thermally treated.
The phases present in the samples after thermal treatment were identified by
confocal laser microscopy (CLM), scanning electron microscopy (SEM),
transmission electron microscopy (TEM) and X-ray diffraction (XRD). Moreover,
the thermally treated samples were also characterized by micro-hardness studies
and elastic modulus.
4.2 High-Pressure Torsion (HPT) deformation
The deformation by HPT of the samples of Ti13Nb13Zr and Ti35Nb7Zr5Ta
was performed at room temperature. The disks were processed under pressures of
1.0 and 4.5 GPa. Three turns were applied using a rotation speed of 3 rpm. Figure
15 shows the Universal Testing Machine (EMIC®) and the HPT accessory used for
the HPT assays.
Figure 15: Universal Testing Machine EMIC and HPT accessory.
The phases present in the samples after deformation by HPT were identified
by confocal laser microscopy (CLM), scanning electron microscopy (SEM),
transmission electron microscopy (TEM) and X-ray diffraction (XRD). Moreover,

Materials and methods 39
the samples deformed were also characterized by micro-hardness studies and
elastic modulus.
4.3 Surface modification treatments
The surface modification treatments that will be described below were
applied to the titanium alloys (Ti13Nb13Zr and Ti35Nb7Zr5Ta) deformed by HPT
(see section 3.5) as well as to non-deformed samples (ND). The microstructure of
the samples, with surface modifications, was evaluated by SEM, analyzed
chemically by energy dispersive spectroscopy (EDS) and by Raman's
spectroscopy. Phase identification was performed by XRD.
4.3.1 Electrochemical anodization
The conditions used in the electrochemical anodization were selected
according to the best results reported for pure titanium by Hilario et al. (2017)
[118].
4.3.1.1 Surface preparation
Initially, the surface of samples was polished successively with SiC abrasive
paper of P320 (grain size 46 μm), P600 (26 μm), P1200 (15 μm) and P2400 (10
μm) grades. Then, the samples were also polished with a colloidal silica
suspension of 0.03 μm, dispersed on a polishing cloth tender, and cleaned
ultrasonically in distilled water, ethanol, and acetone for 10 minutes in each case.
Finally, the samples were rinsed with distilled water and acetone and dried with
compressed air. This surface preparation was carried out just before anodization
assays, and in order to ensure orderly growth of the nanotubes on the sample
surface [25].
4.3.1.2 Anodization
The TiO2 nanostructures were obtained by anodization of the polished and
cleaned samples. The anodization was then carried out in an electrochemical cell
with a conventional two-electrode arrangement. The cell used during this work

Influence of surface treatments on corrosion resistance
properties of ultrafine grained Titanium alloys for implant applications 40
allowed the simultaneous anodization of four samples. The disks of the samples
embedded in a Teflon holder were employed as the working electrodes (each
sample exposed a superficial area of 0.283 cm2 to the electrolyte), the counter
electrode was a cylindrical platinum grid (placed 3 cm from the working electrodes
surface). The samples were connected to the positive terminal (+) of the power
supply (TCR - Electronic Measures Inc.), and the counter electrode was connected
to an amperemeter which was connected to the negative terminal (-) of the power
supply. The diagrammatic representation of the experimental assembly is shown in
Figure 16(a). Figure 16(b) shows a photograph of the electrochemical cell used in
this work.
Figure 16: (a) Diagrammatic representation of the assembly with four working electrodes
and one counter-cylindrical electrode of Pt connected to a power supply. (b) Photograph of
the electrochemical cell used in this work for anodization experiments. Adapted from
Hilario (2017) [25].
The anodization experiments were performed at 25 °C for one hour, in an
organic electrolyte consisting of glycerol, containing 25 vol% of water and 0.25M of
NH4F. A constant voltage of 20 V was applied during the experiments.
After anodization, samples were first rinsed with distilled water, then with
acetone, and finally dried with compressed air.

Materials and methods 41
Finally, the samples were annealed in air at 550 ºC for 2 h to crystallize TiO2
nanotubes into a mix of anatase and rutile phases.
4.3.2 Chemical treatment by acid etching and alkali activation
The chemical treatment consisted of an acid etching followed by the alkaline
activation. The acid attack was carried out with 37% hydrochloric acid (HCl) or 85%
phosphoric acid (H3PO4) in order to define which acid favors more the growth of
hydroxyapatite.
Initially, 150 ml of concentrated acid were transferred to a 300 ml beaker.
The solution was then maintained, with the help of a heating plate, at 60 °C or 80
ºC, during the attacks with HCl or H3PO4, respectively. When the temperature
stabilized, the samples were immersed in the solution for 30 minutes. Finally, the
samples previously attacked with acid were immersed in a NaOH solution (10 M)
and then kept at 60 °C into an incubator, Memmert UF55, for 24 h. Finally, the
samples were left in a desiccator to dry.
4.4 Electrochemical characterization
Samples non-deformed and deformed by HPT in the as-polished condition
and those with surface modifications were characterized electrochemically. All
experiments were performed in triplicate. Simad® software developed at the
Laboratory of Interfaces and Electrochemical Systems (LISE) was used for the
analysis of EIS data.
4.4.1 Experimental assembly
An experimental assembly of four electrodes and a potentiostat (GAMRY
Instruments, Reference 600 +) were used to perform the electrochemical
characterizations. The sample disk embedded in a Teflon holder was employed as
the working electrode (a surface of 0.283 cm2 was exposed to the electrolyte), the
reference electrode was a saturated calomel electrode (SCE, 0.242 V vs. SHE at
25 ºC), which was connected in parallel to a platinum wire exceeded by a capacity
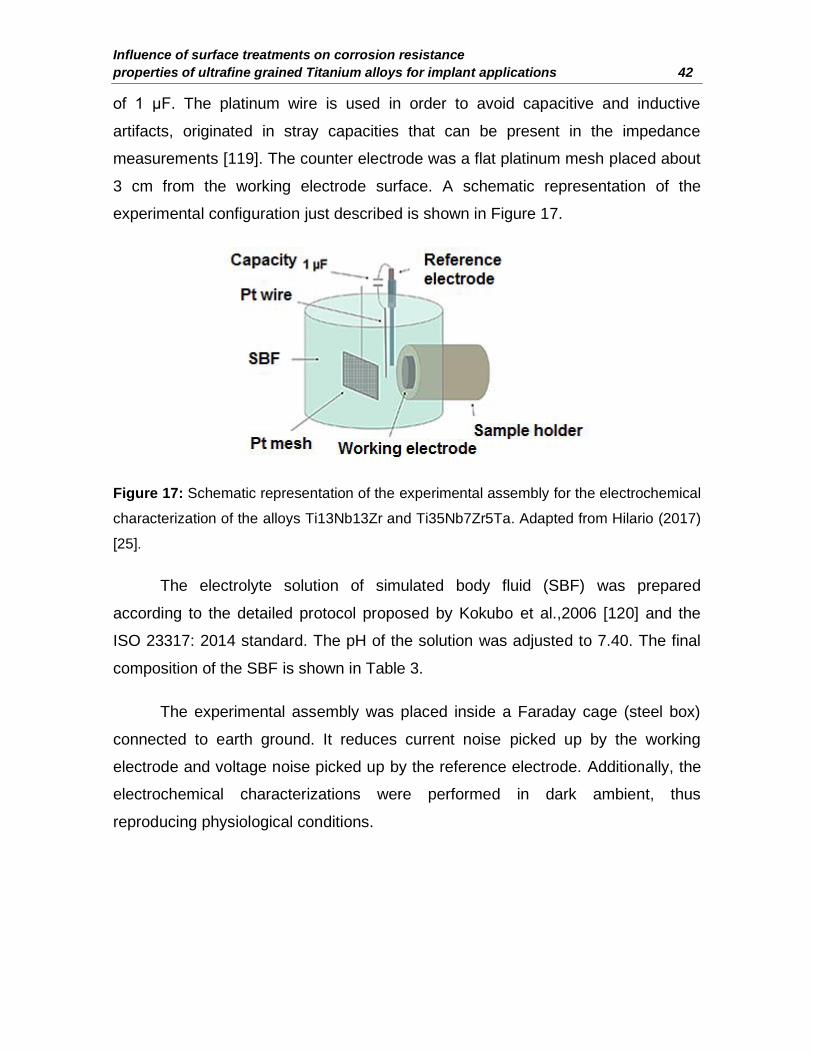
Influence of surface treatments on corrosion resistance
properties of ultrafine grained Titanium alloys for implant applications 42
of 1 μF. The platinum wire is used in order to avoid capacitive and inductive
artifacts, originated in stray capacities that can be present in the impedance
measurements [119]. The counter electrode was a flat platinum mesh placed about
3 cm from the working electrode surface. A schematic representation of the
experimental configuration just described is shown in Figure 17.
Figure 17: Schematic representation of the experimental assembly for the electrochemical
characterization of the alloys Ti13Nb13Zr and Ti35Nb7Zr5Ta. Adapted from Hilario (2017)
[25].
The electrolyte solution of simulated body fluid (SBF) was prepared
according to the detailed protocol proposed by Kokubo et al.,2006 [120] and the
ISO 23317: 2014 standard. The pH of the solution was adjusted to 7.40. The final
composition of the SBF is shown in Table 3.
The experimental assembly was placed inside a Faraday cage (steel box)
connected to earth ground. It reduces current noise picked up by the working
electrode and voltage noise picked up by the reference electrode. Additionally, the
electrochemical characterizations were performed in dark ambient, thus
reproducing physiological conditions.

Materials and methods 43
Table 3: Ion concentrations of simulated body fluid (SBF). Adapted from Kamalian et al.
(2012) [121].
Ion SBF (mmol/l)
Na+ 142.0
K+ 5.0
Mg+2 1.5
Ca+2 2.5
Cl- 147.8
HCO3- 4.2
HPO4-2 1.0
SO4-2 0.5
4.4.2 Protocol and measurement sequence
For each sample, the Open Circuit Potential (OCP) was recorded during 1 h
of immersion in the electrolyte. Next, the impedance spectroscopy measurements
were recorded on steady-state OCP with a frequency range of 20 kHz to 20 mHz.
The amplitude of the disturbing sinusoidal signal was 10 mVrms (amplitude large
enough for the output signal to be easily measured, but also to satisfy the criterion
of linearity). Finally, the corrosion resistance was assessed through
potentiodynamic polarization curves recorded in a potential range of -30 mV to
+1.50 V relative to the OCP, with a scanning speed of 0.20 mV s-1.
4.5 Bioactivity assays
The bioactivity assays were performed on the samples deformed by HPT in
the as-polished condition and on those with surface modifications, as well as on
samples non-deformed. All experiments were performed in triplicate.
In order to characterize the bioactivity of the titanium alloy used in this work,
the amount of hydroxyapatite (HAp) spontaneously deposited on the surface of the

Influence of surface treatments on corrosion resistance
properties of ultrafine grained Titanium alloys for implant applications 44
samples, when they were immersed in SBF, was measured according to the
protocol reported by Kokubo et al., 2006 [120]. The in vitro formation of HAp is an
indicator of the in vivo bioactivity of a material surface.
The samples were immersed in 30 mL of simulated body fluid (SBF) at 37
°C for different times (1, 7 or 14 days) into an incubator, Memmert UF55. The pH of
the solution was adjusted to 7.40. To avoid precipitation problems of Ca/P
compounds, the active surface of the sample tested was placed perpendicular to
the bottom of the container, as shown in Figure 18.
Figure 18: Schematic representation of the experimental assembly used to bioactivity
assays.
After the immersion time, the samples were removed from the solution,
rinsed with distilled water and dried in a desiccator. The apatite formation was then
evaluated by Scanning electron microscopy SEM-FEG observations, chemical
analysis by energy dispersive spectroscopy (EDS), X-ray diffraction (XRD), Raman
spectroscopy and also weighing the samples before and after the immersion.
4.6 Methods of characterization of samples
The methods used to the mechanical and microstructural characterization of
samples will be mentioned below. Samples polished and those with surface

Materials and methods 45
modifications, as well as non-deformed and deformed by HPT, were mechanical
and microstructural characterized.
4.6.1 Mechanical characterization
4.6.1.1 Micro-Hardness studies
The hardness of samples deformed by HPT and those non-deformed was
determined by the Vickers microhardness tests (HV) using the microdurometer
Stiefelmayer shown in Figure 19(a). Vickers microhardness tests were performed
at a load of 300 g for 15 s on the polished cross-sections of samples.
Microhardness mappings were constructed from hardness measurements along
over several samples' radii. The measurements were made in a straight line from
center to edge of specimens at 1 mm intervals. They were also made in the other
quadrants of the sample surface, as is shown in Figure 19(b).
The results showed in mapping are expressed as the mean of the hardness
values obtained at each interval.
Figure 19: (a) Vickers hardness tester; (b) Scheme of the positions of the hardness
measurements.

Influence of surface treatments on corrosion resistance
properties of ultrafine grained Titanium alloys for implant applications 46
4.6.1.2 Elastic Modulus
The elastic modulus of deformed and not deformed samples (disks of 10
mm of diameter and 1 mm of thickness) was measured according to the Pulse
excitation technique (ASTM E1876) [122]. This technique consists of determining
the elastic modulus of a material according to the natural frequency of a sample of
regular geometry. These frequencies are excited by a short mechanical impulse,
followed by the acquisition of the acoustic response using a microphone [123].
Figure 20 shows the system used in the measurements of elastic modulus.
Figure 20: Equipment used for the measurements of the elastic modulus.
The experiments were performed in triplicate, and the results are expressed
as mean of triplicates ± standard deviation.
4.6.1.3 Confocal laser microscopy
Confocal laser microscopy (CLM), is a powerful technique that allows
enhanced optical resolution and the reduction of background information away
from the focal plane (that leads to image degradation) [124]. A microscope LEXT
OLS4000 by Olympus was used during the experiments in order to characterize
polished samples.
Samples of Ti13Nb13Zr analyzed by CLM were ground in a multistep
process using SiC abrasive paper (320, 400, 600, 800, 1200, and 2000 grit). After

Materials and methods 47
grinding, Keller’s reagent (or Kroll’s reagent for samples of Ti35Nb7Zr5Ta) was
used to etch the samples [20,125].
4.6.1.4 Scanning electron microscopy
The microstructural characterization of the samples was examined by
scanning electron microscopy (SEM), in a Philips XL30 FEG equipped with energy-
dispersive spectroscopy (EDS) (OXFORD – LINK ISIS 300). The morphology of
the anodized TiO2 nanotubes was determined using a FEG-SEM Zeiss Ultra 55,
equipped with a Gemini column.
4.6.1.5 Transmission electron microscopy
Conventional transmission electron microscopy and Orientation-phase
mapping were accomplished by transmission electron microscopy (TEM) using an
FEI TECNAI G2 operated at 200 kV. This microscope is equipped with an
orientation and phase mapping precession unit NanoMEGAS (model ASTAR) and
with a Digistar P1000 unit. The recently developed technique based on
transmission electron microscopy, called ASTAR, makes use of electron-beam (in
precession mode or not) together with spot diffraction pattern recognition, allowing
to perform Automated Crystal Orientation Mapping (ACOM) in micro- or nanoprobe
mode. ACOM-TEM opens the opportunity of acquiring reliable orientation/phase
maps with a spatial resolution that can go down to the nm range. In short, the
ACOM-TEM consists in scanning the electron beam (in precession or not) in the
nanoprobe mode on a specimen area, thus collecting, by a CCD cam, thousands
of electron diffraction spot patterns to be subsequently indexed automatically
through a template matching. In fact, and very important, ACOM-TEM closes the
gap between EBSD in SEM and bright field (BF)/dark field (DF) in TEM by
providing full orientation maps with nanometer resolution and even materials
severely plastic deformed (SPD), e.g., by ECAP or HPT, can be reliably analyzed.
When SPD is performed, problems can arise when observations by EBSD are
carried out, because of the Kikuchi lines, used by any EBSD system or in the TEM,

Influence of surface treatments on corrosion resistance
properties of ultrafine grained Titanium alloys for implant applications 48
are very sensitive to the crystal orientation, and they rapidly disappear if the
diffracting volume suffers distortions induced by high dislocation densities [20].
The samples analyzed by TEM were thinned down to 10 µm by a Gatan
Dimple Grinder (model 656) using diamond polishing paste and alumina
suspension. The final stage of sample preparation was ion milling using a Gatan
Precision Ion Polishing System (model 691) under conditions in which damage is
avoided in the structure during thinning (2.5 keV at the initial stage of polishing and
1.6 keV at the final stage) [20].
4.6.1.6 X-ray diffraction
Within this study, X-ray diffraction (XRD) were used to characterize crystalline
phases in the deformed surfaces and the phases in TiO2 nanotubes. Two different
diffractometers were used in this investigation. The first X-ray diffractometer is a
Rigaku ME210GF2 with a diffracted beam monochromator that uses CuKα
radiation (λ = 1.5406 Å) and operates at 40 kV and 30 mA. Diffraction was
recorded for angles of 2θ between 30° and 90°, with a step from 0.033° to 0.067°.
The second XRD measurements were made on a PANalytical X'Pert Pro
MPD diffractometer/goniometer with Bragg-Brentano geometry, equipped with a
diffracted beam monochromator using CuKα radiation (λ = 1.5418 Å) and operating
at 45 kV and 40 mA. Diffraction was recorded for angles of 2θ between 10° and
90°, with a step from 0.033° to 0.067°.
4.6.1.7 Raman Spectroscopy
Raman spectroscopy, a vibrationally spectroscopic technique, it is excellent
for chemical analysis on both the macroscopic and microscopic scale. The
technique can provide information about concentration, structure, and interaction
between chemical components of a material. Raman spectroscopic techniques
were used for this study in order to characterize the formation of sodium titanate
layer after the chemical treatment. Raman Spectroscopy was performed on

Materials and methods 49
samples' surfaces using the RENISHAW InVia Raman Microscope employing an
Argon Ion laser of 20 mW with a wavelength of 514 nm.


Experimental results 51
5 EXPERIMENTAL RESULTS: Ti13Nb13Zr ALLOY
In this section, the results regarding the Ti13Nb13Zr alloy in the conditions
of non-deformed, deformed by HPT, and with different surface conditions will be
presented. The results will be presented in the following sequence: microstructural
and mechanical characterization, electrochemical characterization, and finally,
bioactivity.
5.1 Microstructural and mechanical characterizations
In this section, the microstructural and mechanical characterization of
samples of Ti13Nb13Zr alloy in the conditions non-deformed and deformed by HPT
will be presented. These samples without surface treatment are named “Polished
samples”.
5.1.1 Polished samples
Figure 21 shows XRD patterns of Ti13Nb13Zr alloy non-deformed (ND) and
deformed by HPT at 1 GPa and 4.5 GPa. The indexation of the XRD patterns
indicates the presence of the HCP α' (ICSD # 253841) and the BCC β (ISCD #
645545) phases before and after the deformation by HPT. The peak broadening
observed after deformation, at both pressure conditions, points to very high grain
refinement in the Ti13Nb13Zr alloy.

Influence of surface treatments on corrosion resistance
properties of ultrafine grained Titanium alloys for implant applications 52
30 40 50 60 70 80 90
4.5GPa
1GPa
Inte
nsit
y (
a.u
.)
2 (degree)
Non-deformed
Figure 21: XRD patterns of Ti13Nb13Zr alloy at the non-deformed condition and deformed
by HPT at 1 GPa and 4.5 GPa and three turns.
The microstructures of Ti13Nb13Zr alloy at (a) non-deformed condition and
deformed by HPT at (b) 1 GPa and (c) 4.5 GPa and three turns are shown in
Figure 22.
Figure 22: Microstructures of Ti13Nb13Zr alloy at (a) non-deformed condition and
deformed by HPT at (b) 1 GPa and (c) 4.5 GPa and three turns.
Figure 22(a) is an SEM picture that shows details of the microstructure of
Ti13Nb13Zr alloy at the non-deformed condition. It reveals the existence of a
Experimental results 53
retained BCC β phase as well as a coarse non-equilibrium metastable martensite
(HCP α') phase, precipitated after heating and quenching. The XRD results
presented in Figure 21 confirm such observation. Measurements of grain size were
conducted by using the commercial TSL OIM Analysis software and gave a mean
initial size of about 250 μm for the β phase, and α' laths presented an average
length of ~20 μm with thickness ranging from 1 to 2 μm.
Figure 22(b) is an image obtained by confocal laser microscopy. This image
corresponds to Ti13Nb13Zr alloy deformed by HPT at 1 GPa and three turns. The
average grain size measured was ~ 22 µm.
Figure 22(c) presents the equivalent bright field image from the surface of
the sample received by conventional TEM. This image corresponds to Ti13Nb13Zr
alloy deformed by HPT at 4.5 GPa and three turns. This image shows a
remarkable grain refinement in Ti13Nb13Zr alloy after deformation by HPT since
the average grain size measured was ~ 203 nm. Moreover, it is possible to observe
a non-homogeneous distribution of grains/subgrains sizes and comparing with
Figure 22(a), a redistribution of the α' after mechanical processing.
Figure 23 presents hardness mappings for Ti13Nb13Zr alloy non-deformed
and deformed by HPT at 1 GPa and 4.5 GPa.

Influence of surface treatments on corrosion resistance
properties of ultrafine grained Titanium alloys for implant applications 54
012345
012345
265,0
312,0
359,0
406,0
Ti 13Nb 13Zr (Non-deformed)
(HV)
Ra
diu
s [
mm
]
012345
012345
Ti 13Nb 13Zr (1GPa)
(HV)
265,0
312,0
359,0
406,0
012345
012345
Ti 13Nb 13Zr (4.5GPa)
(HV)
265,0
312,0
359,0
406,0
Figure 23: Hardness mappings for Ti13Nb13Zr alloy at the non-deformed condition and
deformed by HPT 1 GPa and 4.5 GPa and three turns.
As shown in Figure 23, when samples of Ti13Nb13Zr alloy were deformed
by HPT, the hardness significantly increased, from a mean value of 265 HV at the
non-deformed condition to values between 359 and 406 HV at 4.5 GPa. This result
can be related to the grain refinement shown in Figure 22. Moreover, the deformed
samples show a radial increase in hardness, from the center to the edge. This may
be because the HPT deformation is a torsional process. On the other hand, since
the increase in hardness is related to the decrease in grain size, it is possible to
assume that deformed samples display smaller grains in the edge than in the
center [20].
Figure 24 shows the elastic modulus measured for samples of Ti13Nb13Zr
alloy at ND, HPT1GPa, and HPT4.5GPa conditions. The elastic modulus of the
samples in the non-deformed condition, deformed at 1 GPa, and deformed at 4.5
GPa were 63 GPa, 58 GPa, and 60 GPa, respectively. The values showed in
Figure 24 are the result of a statistical analysis of 3 measurements (mean and
standard deviation).

Experimental results 55
Non-deformed HPT (1GPa) HPT (4.5GPa)
0
10
20
30
40
50
60
70
Yo
un
g's
mo
du
lus, E
/GP
a
Figure 24: Graph comparing elastic modulus values for the Ti13Nb13Zr alloy at the non-
deformed condition and deformed by HPT at 1 GPa and 4.5 GPa.
5.1.2 Anodized samples
Figure 25 shows the XRD patterns of anodized samples of Ti13Nb13Zr alloy
in the conditions ND, HPT1GPa, and HPT4.5GPa.
20 30 40 50 60 70 80 90
4.5GPa
1GPa
Inte
ns
ity
(a
.u.)
2 (degree)
Non-deformed
Amorphous TiO2
Figure 25: XRD patterns of anodized samples of Ti13Nb13Zr alloy in the ND, HPT1GPa,
and HPT4.5GPa conditions.

Influence of surface treatments on corrosion resistance
properties of ultrafine grained Titanium alloys for implant applications 56
These XRD patterns indicate that TiO2 nanotubes and nanopores obtained
during anodization are amorphous. However, when TiO2 nanotubes and nanopores
were heat-treated at 550 °C for two hours, an anatase-rutile mixture was obtained
(Figure 26). The indexing of the Bragg peaks indicates the presence of the anatase
TiO2 phases (2θ = 25.4 °, 38.3 °, 48.1 °, and 55.2 °) [126] and TiO2 -rutile phases
(2θ = 27.4 ° and 36.0 °)[127].
20 30 40 50 60 70 80 90
Non-deformed
1GPa
4.5GPa
• •
•
Inte
nsit
y (
a.u
.)
2 (degree)
• Ti Ti
TiO2 Anatase
TiO2 Rutile
•
Ti
Figure 26: XRD pattern of anodized and annealed samples of Ti13Nb13Zr alloy in the ND,
HPT1GPa, and HPT4.5GPa conditions. TiO2 nanostructures were annealed at 550 °C in
air.
TiO2 nanotubes morphologies were investigated by SEM. Figure 27 shows
the top and lateral views of anodized and annealed samples of Ti13Nb13Zr alloy (a
and b) ND; and HPT1GPa in (c and d) and HPT4.5GPa in (e and f).

Experimental results 57
Figure 27: SEM micrographs of anodized and annealed samples of Ti13Nb13Zr alloy at
non-deformed condition, (a) Top and (b) Lateral views, deformed by HPT at 1 GPa, (c)
Top and (d) Lateral views and deformed at 4.5 GPa, (e) Top and (f) Lateral views.
Figure 27(a) shows self-organized TiO2 nanotubes formed in the α' phase
and TiO2 nanoporous in the β phase of Ti13Nb13Zr alloy non-deformed. The
different nanostructures observed may be explained by the fact that there is a
competition between the dissolution and the formation of oxides depending on the
β
α'

Influence of surface treatments on corrosion resistance
properties of ultrafine grained Titanium alloys for implant applications 58
chemical composition of both phases. The lateral view of these nanostructures
(Figure 27(b)) shows self-organized arrays of nanotubes whose dimensions are
described in Table 4.
Table 4: Summary of observed morphologies and dimensions of the formed
nanostructures observed in Figure 27 for samples of Ti13Nb13Zr alloy at different
conditions.
Ti13Nb13Zr alloy
Condition Morphology
Diameter (nm) Length
(nm) Internal External
Non-deformed Nanotubes and
nanopores 58 ± 7 96 ± 20 1839 ± 72
1 GPa Nanotubes and
nanopores 44 ± 7 67 ± 11 1557 ± 158
4.5 GPa Nanotubes and
nanopores 47 ± 10 94 ± 11 1492 ± 73
In the same way, the samples deformed by HPT, Figures 27(c) and (e),
presented different nanostructures. However, since processing by HPT caused a
refinement and spatial redistribution of the α' and β phases, the deformed samples
presented a more homogenous distribution of the nanostructures.
5.1.3 Samples chemically treated by HCl etching and NaOH activation
The surface morphology of samples of Ti13Nb13Zr alloy, chemically treated
by HCl etching and NaOH activation, was examined by scanning electron
microscopy (SEM). The secondary electron (SE) detection mode with an
acceleration voltage of 25 kV was selected for SEM analysis. Figure 28 shows
SEM images of Ti13Nb13Zr alloy, chemically treated, at the conditions ND,
HPT1GPa, and HPT4.5GPa. Figures 28(b), (d) and (f) are SEM images of higher
magnification to show more details of surface morphology.

Experimental results 59
Figure 28: SEM images of Ti13Nb13Zr alloy, chemically treated by HCl etching and NaOH
activation, (a and b) non-deformed, deformed by HPT at (c and d) 1 GPa and deformed by
HPT at (e and f) 4.5 GPa.
As shown in the micrographs of Figure 28, the chemically treated by HCl
and NaOH, induced the formation of a nano topographic sponge-like morphology
on the samples' surface. Also observed in Figure 28 is that the surface is
completely cracked. This behavior has previously been described. For example,

Influence of surface treatments on corrosion resistance
properties of ultrafine grained Titanium alloys for implant applications 60
Jonášová et al., (2004) reported, that HCl etching of commercially pure Ti leads to
the formation of a micro-roughened surface, which after subsequent alkali
treatment in NaOH is maintained [128]. Yi et al., (2006) reported, for commercially
pure grade 2 Ti treated with H2SO4/H2O2 mixture, a texture characterized by a
three-dimensional sponge-like porosity on chemically treated cp Ti surface [129].
On the other hand, in order to obtain an analysis of the surface composition,
EDS analysis was performed. The results are shown in Table 5.
Table 5: Quantitative chemical EDS analysis of samples chemically treated by HCl etching
and NaOH activation.
Ti13Nb13Zr (at %)
Chemical element Non-deformed 1 GPa 4.5 GPa
O 61.79 54.4 63.37
Na 2.01 3.53 2.11
Zr 2.24 1.51 1.13
Nb 2.41 2.80 2.97
Ti 28.68 33.58 28.33
Cl 2.87 4.18 2.09
Raman spectroscopy was used to identify the crystalline phases present on
the surface of samples of Ti13Nb13Zr alloy chemically treated. The results shown
in Figure 29 indicate that sodium titanate, anatase, and rutile are the main phases
present in all the samples.

Experimental results 61
Figure 29: Raman spectra of the surface of Ti13Nb13Zr alloy chemically treated by HCl
etching and NaOH activation.
5.1.4 Samples chemically treated by H3PO4 etching and NaOH
activation
The surface morphology of Ti13Nb13Zr alloy samples, which were
chemically treated by H3PO4 etching and NaOH activation, was examined by
scanning electron microscopy (SEM). Figure 30 shows SEM images of chemically
modified surfaces of Ti13Nb13Zr alloy in the conditions ND, HPT1GPa, and
HPT4.5GPa. Figures 30(b), (d) and (f) are SEM images of higher magnification to
show more details about the surface morphology.
As observed in the samples treated with HCl, the chemically treated by
H3PO4 and NaOH also induced the formation of a nano topographic sponge-like
morphology on the samples' surface, and a surface full of cracks. The etched in
different acids, such as HCl, H3PO4 or a mixture of HF+HNO3, and subsequently
pretreated in NaOH, were reported for sintered Ti13Nb13Zr alloy by Müller et al.,
(2008) [130]. The authors also reported a micro-roughened surface as well as
microcracks.

Influence of surface treatments on corrosion resistance
properties of ultrafine grained Titanium alloys for implant applications 62
Figure 30: SEM images of Ti13Nb13Zr alloy, chemically treated by H3PO4 and NaOH, (a
and b) ND sample, (c and d) HPT1GPa sample (e and f) HPT4.5GPa sample.
Moreover, Raman results also indicate sodium titanate, anatase, and rutile
phases in the samples, see Figure 31. Table 6 presents the quantitative EDS
chemical analysis of samples chemically treated by H3PO4 and NaOH.

Experimental results 63
Table 6: Quantitative chemical EDS analysis of chemically treated samples by H3PO4
etching and NaOH activation.
Ti13Nb13Zr (at %)
Chemical element Non-deformed 1 GPa 4.5 GPa
O 66.38 65.38 66.47
Na 1.35 1.3 1.08
Zr 1.89 1.91 1.10
Nb 2.49 2.15 2.03
Ti 27.89 29.26 29.32
Figure 31: Raman spectra of the surface of Ti13Nb13Zr alloy chemically treated by H3PO4
and NaOH.
5.2 Electrochemistry characterization
5.2.1 Polished samples
5.2.1.1 Open circuit potential (OCP) measurements
Table 7 summarizes the values of open circuit potential (or corrosion
potential, Ecorr) recorded after one hour of immersion in simulated body fluid (SBF)

Influence of surface treatments on corrosion resistance
properties of ultrafine grained Titanium alloys for implant applications 64
for Ti13Nb13Zr alloy, in the conditions ND, HPT1GPa and HPT4.5GPa. The values
are the result of a statistical analysis of 3 measurements (mean and standard
deviation).
Table 7: OCP measurements after 1-hour immersion in SBF at 37 °C of the polished
surfaces of Ti13Nb13Zr alloy in the conditions ND, HPT1GPa, and HPT4.5GPa samples.
Condition OCP or Ecorr (mV vs. SCE)
Non-deformed -530 ± 54
1 GPa -466 ± 56
4.5 GPa -513 ± 62
The OCP is used as a criterion for the corrosion behavior, the higher the
potential, the nobler, and the more stable the surface in the medium.
A slight variation of the open circuit potential is observed for deformed
conditions. The OCP of Ti13Nb13Zr alloy, at ND condition, was - 530 mV vs. SCE,
while samples with HPT1Gpa and HPT4.5GPa showed a slight increase, - 466 mV
vs. SCE and - 513 mV vs. SCE, respectively. Therefore, regardless of the crystal
structure, it appears that severe plastic deformation causes a slight increase in the
corrosion potential compared to the ND samples.
5.2.1.2 Potentiodynamic polarization curves
Figure 32 shows the anodic polarization curves, recorded in SBF at 37 ºC,
for the polished samples at ND, HPT1GPa, and HPT4.5GPa conditions. The
polarization curve for each sample represents a single measure, arbitrarily chosen
from a series of three measurements carried out under the same conditions.

Experimental results 65
-0,8 -0,4 0,0 0,4 0,810
-10
10-9
10-8
10-7
10-6
10-5
10-4
i (A
/ c
m2)
E vs SCE (V)
Non-deformed
1 GPa; 3 turns
4.5 GPa; 3 turns
Figure 32: Anodic polarization curves, recorded in SBF at 37 °C of the polished surfaces
of Ti13Nb13Zr alloy in the conditions ND, HPT1GPa, and HPT4.5GPa samples.
The current density (i), represented on the ordinate axis of Figure 32, was
calculated by dividing the current measured by the geometric area (0.283 cm²). It is
considered that the current measured in the anode region is mainly due to the
oxidation reaction of the substrates to form TiO2, which contributes to the
thickening of the passive layer. This reaction takes place in the metal/oxide
interface. Therefore, the area in which it is produced is equal to the geometric area.
On the other hand, the Ecorr values obtained by extrapolation on the
polarization curves shown in Figure 32 were comparable with the values measured
in the OCP measurements (see Table 7). Moreover, as shown in Figure 32, a
current plateau was quickly established due to spontaneously formation of a
protective oxide layer on the surface of the sample. Thus, in this passive state, the
corrosion current density (icorr) could be considered equivalent to the current
density of the passive plateau (ipass).
The passivation current density (ipass) values, for the ND, HPT1GPa, and
HPT4.5GPa Ti13Nb13Zr samples were graphically established and summed up in

Influence of surface treatments on corrosion resistance
properties of ultrafine grained Titanium alloys for implant applications 66
Table 8. It shows the mean current density values of three points at the current
plateau in the polarization curves and their standard deviations.
Table 8: Passivation current density of the polished samples of Ti13Nb13Zr alloy in the
conditions ND, HPT1GPa, and HPT4.5GPa.
Conditions ipass (µA/cm2)
Non-deformed 2.00 ± 0.10
1 GPa 2.95 ± 0.15
4.5 GPa 2.45 ± 0.32
The passivation current density of the non-deformed Ti13Nb13Zr alloy was
2.00 µA/cm2, while samples HPT1GPa and HPT4.5GPa showed a slight increase,
2.95 µA/cm2, and 2.45 µA/cm2, respectively. Therefore, it appears that the increase
in the pressure from 1 GPa to 4.5 GPa does not affect the passivation current
density in the Ti13Nb13Zr alloy.
5.2.1.3 Electrochemical impedance measurements (EIS)
To conclude the electrochemical characterization of the samples without
surface treatments (polished samples), the samples were subjected to
electrochemical impedance spectroscopy measurements. The EIS was also
performed in SBF at 37 °C and in the dark. Figure 33 shows the EIS graphs in the
(a) Nyquist and (b) Bode representation of the Ti13Nb13Zr alloy in the conditions
ND, HPT1GPa, and HPT4.5GPa.

Experimental results 67
0,0 5,0x10⁴
1,0x10⁵
0,0
5,0x10⁴
1,0x10⁵
1,5x10⁵
-''(
c
m2
)
'( cm2)
Non-deformed
1GPa
4.5GPa
a)
10-3
10-2
10-1
100
101
102
103
104
105
10-1
100
101
102
103
104
105
Frequency (Hz)
Zm
od
(
cm
2)
b)
-15
-30
-45
-60
-75
-90
Non-deformed
1GPa
I Z I
4.5GPa
Figure 33: EIS graphs in the Nyquist diagrams (a) and Bode diagrams (b) of the polished
samples of Ti13Nb13Zr alloy in the conditions ND, HPT1GPa, and HPT4.5GPa.
Note that the diagrams for each sample present a single measurement,
chosen arbitrarily from a series of three experiments carried out under the same
conditions. It should also be taken into account that the influence of electrolyte
resistance confounds the use of Bode phase angle plots, to estimate the nature of
the impedance response [131]. Therefore, all Bode diagrams in this work were
corrected from the electrolyte resistance. A modified Bode representation is
possible following

Influence of surface treatments on corrosion resistance
properties of ultrafine grained Titanium alloys for implant applications 68
Φ𝑎𝑑𝑗 = tan−1 (𝑍′′
𝑍′ − 𝑅𝑒) (23)
𝑍𝑚𝑜𝑑𝑎𝑑𝑗 = √(𝑍′ − 𝑅𝑒)2 + (𝑍′′)2 (24)
The impedance spectra in Nyquist diagrams of Figure 33(a) show the typical
shape (arc) for a capacitive-resistive system (associations of capacitive
phenomena, accumulation of charges, and resistive phenomena, load transfers or
resistance of a layer). Additionally, it can be seen from Figure 33(a) that the
spectrum of ND samples has a higher amplitude, which indicates that SPD process
displays a slight effect on the formation of the protective layer in Ti13Nb13Zr alloy.
It can be related to the increasing surface energy of the alloy induced by
dislocations [132]. Thus, the tendency to loss of electrons and releasing atoms into
electrolyte is accelerated [133].
On the other hand, the effect of the dislocations caused by SPD was higher
for samples deformed at 1GPa (spectrum with the lowest amplitude). This may be
explained by the fact that, in the samples deformed at low pressure, the density of
dislocations was not enough to initiate the recrystallization of the material [20,134].
Instead of this, in the samples deformed at 4.5GPa, the greater amount of
dislocations generated probably induced certain recrystallization of the material
[20], which involves nucleation, growth of new dislocation free grains from the
deformed structure [135], and then decreasing surface energy.
The Bode diagrams, in Figure 33(b), show a capacitive behavior, from
medium to low frequencies, with phase angles approaching – 90° and straight lines
in Bode magnitude plot. It is typical of passive materials [136]. From the Bode
phase angle plot for all samples, two plateaus can be identified, where the phase
angle is independent of frequency.

Experimental results 69
Moreover, high values of Zmod (or |Z|) at low frequencies, above 105 Ω·cm2,
suggest that the passive film formed offers high corrosion resistance. This behavior
is consistent with the low passivation current determined in the polarization tests.
5.2.2 Anodized samples
In this section, the effect of the SPD by HPT as well as the presence of TiO2
nanostructures on the electrochemical properties of Ti13Nb13Zr alloy is presented.
The anodized samples were annealed according to section 4.3.1.2.
5.2.2.1 Open circuit potential measures
Table 9 summarizes the values of Ecorr recorded after 1 hour of immersion in
SBF for anodized Ti13Nb13Zr alloy in the conditions ND, HPT 1GPa and
HPT4.5GPa. The values are the result of a statistical analysis of 3 measurements
(mean and standard deviation).
Table 9: OCP measurements, after 1-hour immersion in SBF at 37° C for the anodized
samples of Ti13Nb13Zr alloy in the conditions ND, HPT1GPa, and HPT4.5GPa.
Condition OCP or Ecorr (mV vs. SCE)
Non-deformed -3.9 ± 9.3
1 GPa -49 ± 18
4.5 GPa -71 ± 29
The OCP of anodized Ti13Nb13Zr alloy, at the non-deformed condition, was
- 3.9 mV vs. SCE, while the anodized samples HPT1GPa and HPT4.5GPa showed
a decrease in their corrosion potential, - 49 mV vs. SCE and - 71 mV vs. SCE,
respectively. Therefore, the anodized ND Ti13Nb13Zr alloy showed the noblest
corrosion potential (the nobler and more stable surface in SBF).
On the other hand, the Ecorr of the anodized samples showed a drastic
increase compared to samples without TiO2 nanostructures (Table 7), meaning
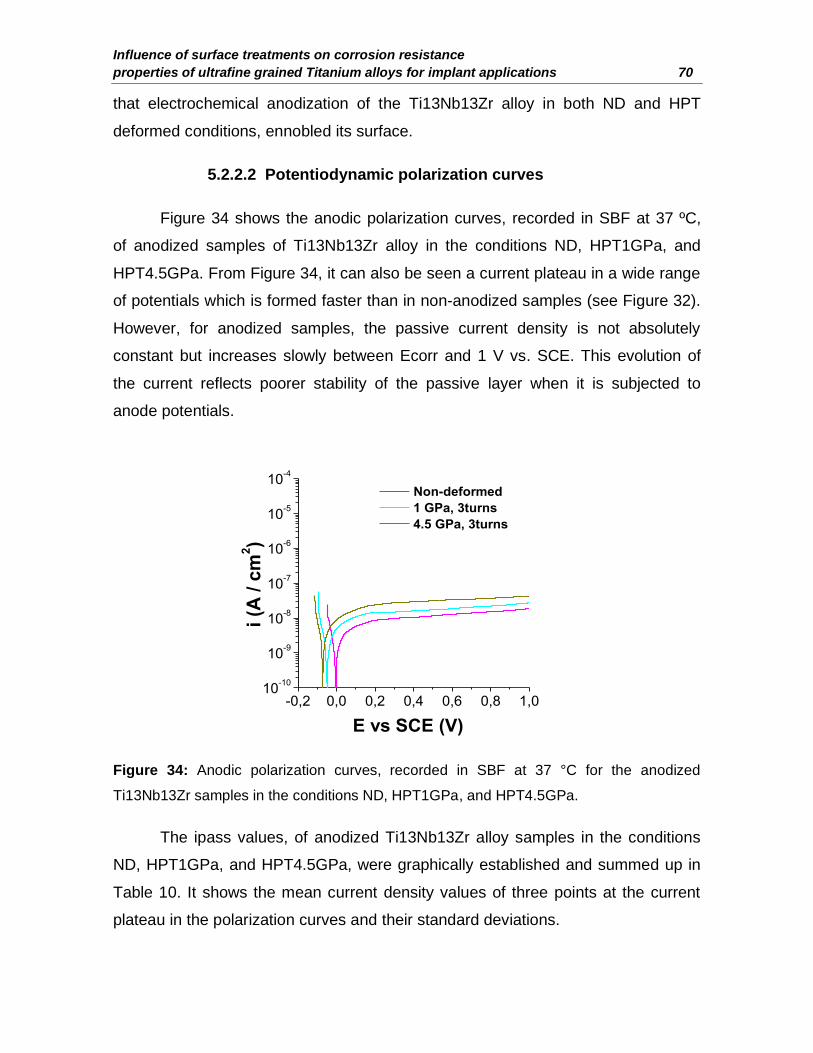
Influence of surface treatments on corrosion resistance
properties of ultrafine grained Titanium alloys for implant applications 70
that electrochemical anodization of the Ti13Nb13Zr alloy in both ND and HPT
deformed conditions, ennobled its surface.
5.2.2.2 Potentiodynamic polarization curves
Figure 34 shows the anodic polarization curves, recorded in SBF at 37 ºC,
of anodized samples of Ti13Nb13Zr alloy in the conditions ND, HPT1GPa, and
HPT4.5GPa. From Figure 34, it can also be seen a current plateau in a wide range
of potentials which is formed faster than in non-anodized samples (see Figure 32).
However, for anodized samples, the passive current density is not absolutely
constant but increases slowly between Ecorr and 1 V vs. SCE. This evolution of
the current reflects poorer stability of the passive layer when it is subjected to
anode potentials.
-0,2 0,0 0,2 0,4 0,6 0,8 1,010
-10
10-9
10-8
10-7
10-6
10-5
10-4
i (A
/ c
m2)
E vs SCE (V)
Non-deformed
1 GPa, 3turns
4.5 GPa, 3turns
Figure 34: Anodic polarization curves, recorded in SBF at 37 °C for the anodized
Ti13Nb13Zr samples in the conditions ND, HPT1GPa, and HPT4.5GPa.
The ipass values, of anodized Ti13Nb13Zr alloy samples in the conditions
ND, HPT1GPa, and HPT4.5GPa, were graphically established and summed up in
Table 10. It shows the mean current density values of three points at the current
plateau in the polarization curves and their standard deviations.

Experimental results 71
Table 10: Passivation current density for the anodized Ti13Nb13Zr samples in the
conditions ND, HPT1GPa, and HPT4.5GPa.
Condition ipass (µA/cm2)
Non-deformed 0.012 ± 0.004
1 GPa 0.017 ± 0.004
4.5 GPa 0.033 ± 0.006
The passivation current density of anodized ND Ti13Nb13Zr alloy, was
0.012 µA/cm2, while the HPT1GPa and HPT4.5GPa samples showed a slight
increase, 0.017 µA/cm2 and 0.033 µA/cm2, respectively. Therefore, it appears that
severe plastic deformation causes a slight increase in the passivation current of
anodized Ti13Nb13Zr alloy. On the other hand, the ipass of the samples anodized
also showed a drastic change compared to samples without TiO2 nanostructures
(Table 8). This result is also in agreement with earlier observations, which showed
that electrochemical anodization of Ti13Nb13Zr alloy, non-deformed or deformed
by HPT, ennobled its surface.
5.2.2.3 Electrochemical impedance measurements
Figure 35 shows the EIS graphs in the (a) Nyquist and (b) Bode
representation of anodized Ti13Nb13Zr alloy in the ND, HPT1GPa, and
HPT4.5GPa conditions.

Influence of surface treatments on corrosion resistance
properties of ultrafine grained Titanium alloys for implant applications 72
0,0 1,0x10⁵
0,0
1,0x10⁵
2,0x10⁵
3,0x10⁵
4,0x10⁵
-''(
c
m2
)
'( cm2
)
Non-deformed
1GPa
4.5GPa
a)
10-3
10-2
10-1
100
101
102
103
104
105
10-1
100
101
102
103
104
105
Frequency (Hz)
Zm
od
(
cm
2)
b)
-10
-20
-30
-40
-50
-60
-70
-80
-90
Non-deformed
I Z I
1GPa
4.5GPa
Figure 35: Nyquist diagrams (a) and Bode diagrams (b) for the anodized Ti13Nb13Zr
samples in the conditions ND, HPT1GPa, and HPT4.5GPa.
The impedance spectra in Nyquist diagrams of Figure 35(a) show a
pseudocapacitive shape (tilted straight line). This behavior suggests that the
electron exchanges, and therefore, the reactions, are minimal or that the oxide
layer is very resistive [137]. Additionally, it can be seen from Figure 35(a) that the
amplitude of spectra is much higher than in non-anodized samples (Figure 33(a)).
It suggests that the nanostructure arrays on the samples improved the protection of
the surface in Ti13Nb13Zr alloy.

Experimental results 73
On the other hand, deformed samples showed a spectrum with a lower
amplitude. Hence, the SPD process also affected the formation of nanostructures
on Ti13Nb13Zr alloy.
In contrast, comparing with the result obtained for polished samples, the
effect of the dislocations caused by SPD was lower for samples deformed at 1
GPa. This may be explained by the fact that the heat treatment carried out on
anodized samples possibly allowed the relief of residual stresses developed during
the deformation by HPT [138].
The Bode diagrams, in Figure 35(b), show a capacitive behavior with the
maximum phase angles close to −90° and high values of |Z| above 105 Ω·cm2 in
the low frequencies region, suggesting that the formed passive film offers high
corrosion resistance. This fact is consistent with the low passivation current
determined in polarization tests. From Bode phase angle plots, three plateaus can
be identified, which is more noticeable for samples deformed at 4.5 GPa.
5.2.3 Samples chemically treated by HCl etching and NaOH activation
In this section, the effect of the SPD by HPT as well as, surface modification
treatment by HCl etching and subsequent NaOH activation, on the electrochemical
properties of Ti13Nb13Zr alloy will be studied.
5.2.3.1 Open circuit potential measures
Table 11 summarizes the values of Ecorr for samples ND and deformed by
HPT as well as chemically treated by HCl and NaOH. The values are the result of a
statistical analysis of 3 measurements (mean and standard deviation).

Influence of surface treatments on corrosion resistance
properties of ultrafine grained Titanium alloys for implant applications 74
Table 11: OCP measurements, after 1-hour immersion in SBF at 37° C of samples of
Ti13Nb13Zr alloy chemically treated by HCl and NaOH in the conditions ND, HPT1GPa
and HPT4.5GPa.
Condition Corrosion potential (mV vs SCE)
Non-deformed -132 ± 26
1 GPa -144 ± 37
4.5 GPa -147 ± 38
The OCP of Ti13Nb13Zr alloy chemically treated by HCl and NaOH, non-
deformed, was -132 mV vs. SCE, while the corrosion potentials for samples
deformed at 1 GPa and 4.5 GPa did not show a significant variation being -144 mV
vs. SCE and -147 mV vs. SCE, respectively.
On the other hand, the Ecorr of chemically treated samples also showed an
increase compared to polished samples (Table 7), meaning that the chemically
treated by HCl and NaOH turns nobler and more stable the surface of Ti13Nb13Zr
alloy.
5.2.3.2 Potentiodynamic polarization curves
Figure 36 shows the anodic polarization curves for samples ND and
deformed as well as chemically treated by HCl and NaOH.
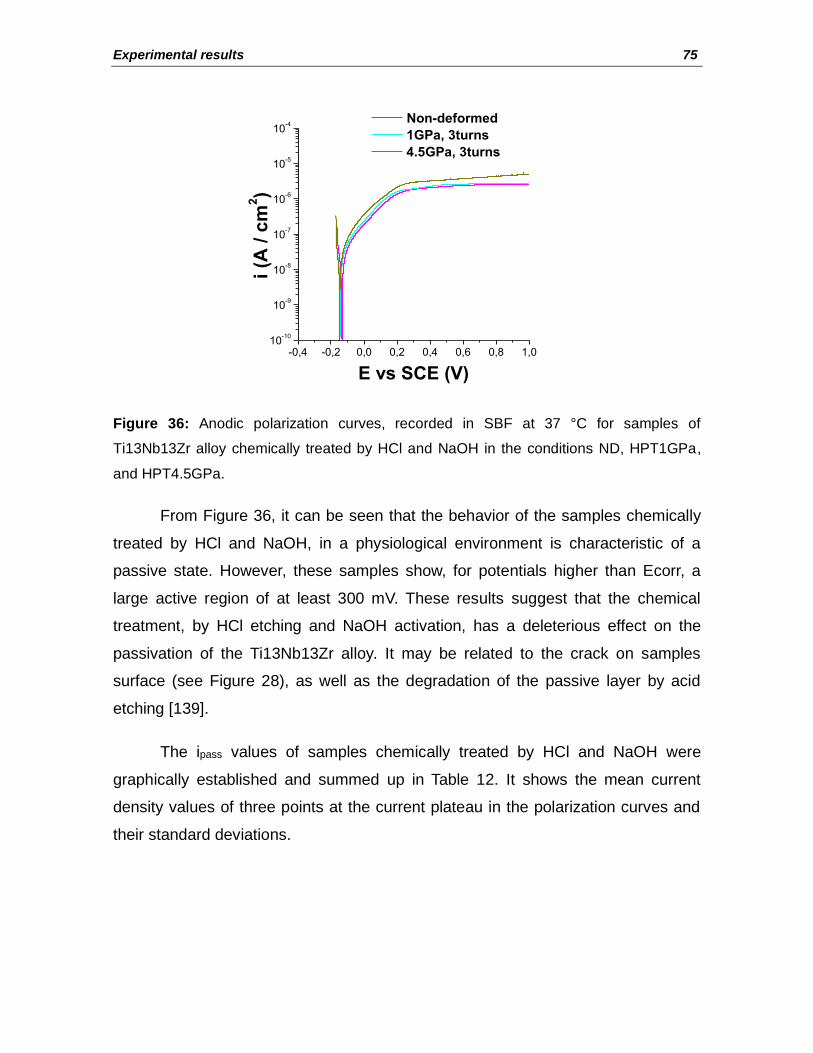
Experimental results 75
-0,4 -0,2 0,0 0,2 0,4 0,6 0,8 1,010
-10
10-9
10-8
10-7
10-6
10-5
10-4
i (A
/ c
m2)
E vs SCE (V)
Non-deformed
1GPa, 3turns
4.5GPa, 3turns
Figure 36: Anodic polarization curves, recorded in SBF at 37 °C for samples of
Ti13Nb13Zr alloy chemically treated by HCl and NaOH in the conditions ND, HPT1GPa,
and HPT4.5GPa.
From Figure 36, it can be seen that the behavior of the samples chemically
treated by HCl and NaOH, in a physiological environment is characteristic of a
passive state. However, these samples show, for potentials higher than Ecorr, a
large active region of at least 300 mV. These results suggest that the chemical
treatment, by HCl etching and NaOH activation, has a deleterious effect on the
passivation of the Ti13Nb13Zr alloy. It may be related to the crack on samples
surface (see Figure 28), as well as the degradation of the passive layer by acid
etching [139].
The ipass values of samples chemically treated by HCl and NaOH were
graphically established and summed up in Table 12. It shows the mean current
density values of three points at the current plateau in the polarization curves and
their standard deviations.

Influence of surface treatments on corrosion resistance
properties of ultrafine grained Titanium alloys for implant applications 76
Table 12: Passivation current density of samples of Ti13Nb13Zr alloy chemically treated
by HCl and NaOH in the conditions ND, HPT1GPa, and HPT4.5GPa.
Condition ipass (µA/cm2)
Non-deformed 2.30 ± 0.19
1 GPa 2.51 ± 0.11
4.5 GPa 3.40 ± 0.59
The passivation current of samples chemically treated by HCl and NaOH,
ND Ti13Nb13Zr alloy, was 2.30 µA/cm2, while the HPT1GPa and HPT4.5GPa
samples showed a slight increase, 2.51 µA/cm2 and 3.40 µA/cm2, respectively.
Therefore, it appears that severe plastic deformation causes a slight increase in
the passivation current of the chemically treated Ti13Nb13Zr samples.
5.2.3.3 Electrochemical impedance measurements
Figure 37 shows the EIS graphs in the (a) Nyquist and (b) Bode
representation for the Ti13Nb13Zr samples chemically treated by HCl and NaOH.
The impedance spectra in Nyquist diagrams of Figure 37(a) show a typical
behavior of a capacitive-resistive system that indicates corrosion protection.
Comparing Nyquist diagrams in Figure 37 with those shown in Figure 33(a), for
polished samples, the amplitude of ND sample chemically treated was lower.
Therefore, the chemical treatment with HCl and NaOH affected the formation of the
protective layer on Ti13Nb13Zr alloy.
The SPD also affected the formation of passive layers on samples
chemically treated. In this case, the sample deformed at 4.5 GPa showed a
spectrum with the lowest amplitude for the lowest frequency, unlike the polished
samples. These results are likely to be related to a more active dissolution of the
passive film at the surface near the grain boundaries [140]. Therefore, the
resistance of the passive film is more affected in samples with more grain
boundaries such as those deformed at 4.5 GPa.

Experimental results 77
On the other hand, the Bode diagrams, in Figure 37(b), show a capacitive
behavior with the maximum phase angles close to −90° and straight lines in the
Bode magnitude plot. The high values of |Z|, above 105 Ω·cm2 at low frequencies
region, suggest that the passive film formed offers high corrosion resistance. From
the Bode phase angle plot for all samples, three plateaus can be identified.
0,0 1,0x10⁵
0,0
5,0x10⁴
1,0x10⁵
1,5x10⁵
2,0x10⁵
'( cm2)
-''(
c
m2
)
Non-deformed
1GPa
4.5GPa
a)
10-3
10-2
10-1
100
101
102
103
104
105
10-1
100
101
102
103
104
105
Frequency (Hz)
Zm
od
(
. cm
2)
b)
-10
-20
-30
-40
-50
-60
-70
-80
-90
Non-deformed
1GPa
I Z I
4.5GPa
Figure 37: Nyquist diagrams (a) and Bode diagrams (b) for samples of Ti13Nb13Zr alloy
chemically treated by HCl and NaOH in the conditions ND, HPT1GPa, and HPT4.5GPa.

Influence of surface treatments on corrosion resistance
properties of ultrafine grained Titanium alloys for implant applications 78
5.2.4 Samples chemically treated by H3PO4 etching and NaOH
activation
In this section, the effect of the SPD by HPT as well as, surface modification
treatment by H3PO4 etching and subsequent NaOH activation, on the
electrochemical properties of Ti13Nb13Zr alloy will be studied.
5.2.4.1 Open circuit potential measures
Table 13 summarizes the values of Ecorr for samples non-deformed and
deformed by HPT as well as chemically treated by H3PO4 etching and NaOH
activation. The values are the result of a statistical analysis of 3 measurements
(mean and standard deviation).
Table 13: OCP measurements, after 1-hour immersion in SBF at 37° C of samples of
Ti13Nb13Zr alloy chemically treated by H3PO4 and NaOH in the conditions ND, HPT1GPa
and HPT4.5GPa.
Condition Corrosion potential (mV vs SCE)
Non-deformed -724 ± 57
1 GPa -501 ± 60
4.5 GPa -321 ± 49
Significant changes have been observed on the recorded corrosion potential
depending on the processing condition. The OCP for the ND Ti13Nb13Zr alloy
chemically treated by H3PO4 and NaOH was - 724 mV vs. SCE, while the corrosion
potentials for samples deformed at 1 GPa and 4.5 GPa were -501 mV vs. SCE and
-321 mV vs. SCE, respectively. Therefore, it appears that the corrosion potential is
nobler for substrates chemically treated, by H3PO4 etching and NaOH activation,
when they were previously deformed (for high pressures).

Experimental results 79
5.2.4.2 Potentiodynamic polarization curves
Figure 38 shows the anodic polarization curves for samples non-deformed
and deformed as well as chemically treated by H3PO4 and NaOH.
-0,8 -0,6 -0,4 -0,2 0,0 0,2 0,4 0,6 0,810
-10
10-9
10-8
10-7
10-6
10-5
10-4
E vs SCE (V)
i (A
/ c
m2)
Non-deformed
1GPa, 3 turns
4.5GPa, 3 turns
Figure 38: Anodic polarization curves, recorded in SBF at 37 °C for samples of
Ti13Nb13Zr alloy chemically treated by H3PO4 and NaOH in the conditions ND, HPT1GPa,
and HPT4.5GPa.
The polarization curves show, for potentials higher than Ecorr, a large active
region of at least 400 mV. These results suggest that the chemical treatment, by
H3PO4 and NaOH, has a deleterious effect on the passivation of the Ti13Nb13Zr
alloy. This result could be explained by the high formation rate of an oxide layer
which could lead to an increase of structural defects within the resultant oxide film
that increases its dissolution rate [141].
The ipass values of samples chemically treated by H3PO4 and NaOH were
graphically established and summed up in Table 14. It shows the mean current
density values of three points at the current plateau in the polarization curves and
their standard deviations.

Influence of surface treatments on corrosion resistance
properties of ultrafine grained Titanium alloys for implant applications 80
Table 14: Passivation current density of samples of Ti13Nb13Zr alloy chemically treated
by H3PO4 and NaOH in the conditions ND, HPT1GPa, and HPT4.5GPa.
Condition ipass (µA/cm2)
Non-deformed 4.05 ± 0.12
1 GPa 5.13 ± 0.21
4.5 GPa 4.21 ± 0.22
The passivation current of samples chemically treated by H3PO4 and NaOH,
non-deformed, was 4.05 µA/cm2, while samples deformed by HPT at 1 GPa and
4.5 GPa showed a slight increase, 5.13 µA/cm2, and 4.21 µA/cm2, respectively.
Therefore, it appears that severe plastic deformation causes a slight increase in
the passivation current of the chemically treated by H3PO4 and NaOH Ti13Nb13Zr
samples.
On the other hand, the ipass of the samples chemically treated by H3PO4 and
NaOH showed an increase of ipass compared with samples without chemical
treatment (Table 8).
5.2.4.3 Electrochemical impedance measurements
Figure 39 shows the EIS graphs in the (a) Nyquist and (b) Bode
representation of samples of Ti13Nb13Zr alloy chemically treated by H3PO4 and
NaOH.
The impedance spectra in Nyquist diagrams of Figure 39(a) show a
capacitive-like behavior. Contrary to results obtained for samples treated by HCl
and NaOH, ND sample showed a spectrum with the lowest amplitude. Thus, the
treatment with H3PO4 and NaOH affected more the formation of the protective layer
on Ti13Nb13Zr alloy. In this case, deformed samples showed a layer more
protective than in non-deformed samples. These results seem to be consistent with
the polarization curves shown in Figure 38.

Experimental results 81
The Bode diagrams, in Figure 39(b), also show a capacitive behavior and
high values of |Z| at low frequencies, suggesting that the passive film formed also
offers high corrosion resistance. Likewise, three plateaus can be identified.
0,0 1,0x10⁵
0,0
5,0x10⁴
1,0x10⁵
1,5x10⁵
2,0x10⁵
-''(
c
m2
)
'( cm2
)
Non-deformed
1GPa
4.5GPa
a)
10-3
10-2
10-1
100
101
102
103
104
105
10-1
100
101
102
103
104
105
Frequency (Hz)
Zm
od
(
cm
2)
b)
-10
-20
-30
-40
-50
-60
-70
-80
-90
Non-deformed
1GPa
4.5GPa
I Z I
Figure 39: Nyquist diagrams (a) and Bode diagrams (b) for samples of Ti13Nb13Zr alloy
chemically treated by H3PO4 and NaOH in the conditions ND, HPT1GPa, and HPT4.5GPa.
5.3 Modeling of impedance spectra for samples of Ti13Nb13Zr alloy
This section is focused on modeling the electrochemical impedance
spectrums by equivalent electrical circuits (EEC). Different equivalent circuits

Influence of surface treatments on corrosion resistance
properties of ultrafine grained Titanium alloys for implant applications 82
proposed in the literature will be reviewed. On the other hand, a transmission line
model was proposed for modeling EIS data of samples with TiO2 nanotubes.
The surface of the samples polished, chemically treated and with TiO2
nanostructures are complex, and the interpretation of their impedance response is
not trivial.
5.3.1 EEC proposed for polished samples
The results of EIS tests for polished samples of Ti13Nb13Zr alloy immersed
in SBF were presented through Nyquist and Bode diagrams in section 5.2.1.3,
Figure 33. From Bode phase angle plots (Figure 33(b)) were identified two
plateaus, where the phase angle is independent of frequency. This behavior can
be associated with the presence of two CPEs in the EEC applied to polished
samples.
Therefore, the EIS data were simulated using the physical model and
equivalent electrical circuit shown in Figure 40.
Figure 40: Model used to fit the EIS data for polished samples of Ti13Nb13Zr alloy, non-
deformed, and deformed by HPT at 1 GPa and 4.5 GPa and three turns. Adapted from
Valereto et al., (2004) [142].
This physical model represents a two-layer structure composed of a dense
inner layer and a porous outer layer on the surface Ti13Nb13Zr alloy. It can be
represented by the following EEC [142],
Rs + Qa / (Ra+ (Qdl / Rct))

Experimental results 83
where Rs is the electrolyte resistance, Ra is the resistance of the porous outer
layer, Qa is the constant-phase element for the porous layer, Rct represents the
resistance of charge-transfer and Qdl is the constant-phase element for the double
layer at the dense inner layer-electrolyte interface. The model and EEC illustrated
in Figure 40 have been proposed by several authors to describe the bi-layer oxide
film formed on Ti and its alloys [142–146].
In this work, the analysis of EIS data by regression of EEC was performed
using Simad® software. Figure 41 shows the fitting of EIS data as Nyquist
representations.
The errors measured for the experimental and simulated data were 0.32%
for the non-deformed sample and 0.62 % for the 4.5 GPa deformed sample,
indicating that the data adjusted well to the proposed EEC.
The equivalent electrical circuit parameters obtained when fitting EIS data
(see section 5.2.1.3, Figure 33), of polished samples of Ti13Nb13Zr alloy at the
ND, HPT1GPA and HPT4.5GPa conditions, are shown in Table 15. Additionally,
the equation derived by Brug et al. (Eq. (20)) was used to calculate the effective
capacitance associated with each CPE (Ceff(a) and Ceff(dl)). The effective
capacitance values also are shown in Table 15.
It can be seen from the data in Table 15, high Rct values, as well as low Qa
and Qdl values. These results indicate that a highly stable film was formed on the
surface of the polished samples of Ti13Nb13Zr alloy. The Rct is much higher than
Ra, which suggests that the protection provided by the passive layer is
predominantly due to the dense inner layer. Moreover, the α values were close to
0.9, which suggest that the passive film formed displays a near capacitive
behavior.
On the other hand, the Rct of ND samples is higher than that of deformed
samples. These results confirm that the dislocation induced by the SPD process
affected the formation of the protective layer on Ti13Nb13Zr alloy.

Influence of surface treatments on corrosion resistance
properties of ultrafine grained Titanium alloys for implant applications 84
0,0 4,0x10⁴
8,0x10⁴
0,0
4,0x10⁴
8,0x10⁴
1,2x10⁵
'( cm2)
-''(
c
m2)
Error (%) =0,32
Non-deformed
Fitting
0,0 4,0x10⁴
8,0x10⁴
0,0
2,0x10⁴
4,0x10⁴
6,0x10⁴
8,0x10⁴
Error (%) =1,34
'( cm2)
-''(
c
m2)
1 GPa
Fitting
0,0 4,0x10⁴
8,0x10⁴
0,0
4,0x10⁴
8,0x10⁴
1,2x10⁵
Error (%) =0,62
'( cm2)
-''(
c
m2)
4.5 GPa
Fitting
Figure 41: Nyquist diagrams of experimental data and simulated curves obtained by the
Simad software for the polished surfaces of Ti13Nb13Zr alloy at ND, HPT1GPa, and
HPT4.5GPa conditions.
Table 15: Equivalent electrical circuit parameters and effective capacitance
associated with the CPEs obtained when fitting EIS data of polished samples of
Ti13Nb13Zr alloy according to the model in Figure 40.
Condition Rs Qa
αa Ra Ceff(a) Qdl
µF ·s(αdl-1) αdl Rct Ceff(dl)
Ω·cm2 µF ·s(αa-1) Ω·cm2 µF/cm2 Ω·cm2 µF/cm2
Non-deformed 22 7 0.94 57 16 9 0.94 3.0E+05 20
1 GPa 19 5 0.90 111 7 12 0.88 1.3E+05 17
4.5 GPa 21 6 0.90 124 9 11 0.91 1.7E+05 20
On the other hand, the capacitance values for the double layer (Ceff(dl)) were
between 17 to 20 μF·cm- 2 (see Table 15). These values are in the typical range,

Experimental results 85
10–40 µF/cm2 [147]. The capacitance values for the porous layer (Ceff(a)) were
lower than Ceff(dl).
Considering the layer as a planar capacitor, the thickness of the protective
film δ (in nm) can be obtained from Equation 22 (see section 3.6.3.1):
𝛿 =𝜖 · 𝜖0
𝐶𝑒𝑓𝑓
where ϵ0 is the vacuum permittivity (8.8542 × 10⁻¹⁴ F/cm) and ϵ the dielectric
constant of the material. The value of the dielectric constant of TiO2 is in the range
of 18.2 to 173 [148] and an average value of the dielectric constant, ϵ = 100, has
been selected by other authors [149–151], Then, Eq. (22) gives the protective film
thickness of 3.75, 4.53 and 3.80 nm for Ti13Nb13Zr alloy, at ND, HPT1GPa and
HPT4.5GPa conditions, respectively. These results show that the deformation by
HPT of Ti13Nb13Zr alloy contributes to increasing the tendency to loss of electrons
and releasing atoms into electrolyte is accelerated [133].
The results obtained by fitting EIS data indicate that the Ti13Nb13Zr alloy,
non-deformed, and deformed by HPT, behaved in a very similar way. The
differences are rather small, and this can be explained by the fact that the passive
film formed on these conditions are basically of the same nature.
5.3.2 EEC proposed for anodized samples
It is common in the literature to analyze impedance results for TiO2
nanotubes by a physical model [27,151,152], this model is expressed by a
mathematical equation and by a “classical equivalent circuit”. Table 15 shows EEC
most frequently proposed in the literature to model EIS data of TiO2 nanotubes.

Influence of surface treatments on corrosion resistance
properties of ultrafine grained Titanium alloys for implant applications 86
Table 15: Equivalent electrical circuits most frequently proposed in the literature to model
EIS data of TiO2 nanotubes.
Equivalent electrical circuit Explanation
Rs: The solution resistance.
Qg and Rg: The dielectric properties and
resistivity of the film.
Qp and Rct: The double-layer capacitance and
interfacial charge-transfer resistance.
References: [153–157].
Rs: The solution resistance.
Qg and Rg: The resistance and capacitance of
the outer porous tube layer.
Qp and Rct: The resistance and capacitance of
the inner barrier layer.
References: [149,158,159]
Rs: The solution resistance.
Rct: Charge-transfer resistance.
Qg: Constant phase element (CPE) used in place
of double-layer capacitance.
W: Warburg arising from a diffusion-controlled
process at low frequency.
References: [27,160]
Rs: The solution resistance.
Qg and Rg: The resistance and capacitance of
the outer porous tube layer.
Qp and Rct: The resistance and capacitance of
the inner barrier layer.
W: Warburg impedance.
References: [161–163]
Rs: The solution resistance.
Qd and Rct: Related to the dielectric properties
and the resistivity of the film.
Qg and Rg: The resistance and capacitance of
the inner barrier layer.
Qb and Rb: The resistance and capacitance of
the outer porous tube layer.
References [164,165]
Experimental results 87
Sometimes the experimental impedance is not a semicircle, and a certain
dispersion in the frequency is usually found. Therefore, it does not seem relevant
to model the impedance results of the anodized samples in this work with "classical
equivalent circuits" mentioned above. However, the EEC 1, 4, and 5 shown in
Table 15 were tested to fitting EIS data of the anodized samples (data not shown).
The results were not satisfactory due to high fitting errors, and the values of the
obtained parameters were outliers.
De Levie [166–168] proposed a model to describe the behavior of porous
electrodes that can be conveniently described using a transmission line model
(TL). On the other hand, Bisquert et al. developed a complete series of TL models
for organic [169] and inorganic nanostructured systems [170,171]. These models
will be presented below.
The remainder of this section will be dedicated to the study of the porous
electrode model, and more precisely of the transmission line model.
5.3.2.1 Model of De Levie for the characterization of porous
electrodes
De Levie considered that the impedance of a porous electrode could be
described by a parallel schema of identical cylindrical pores of length L, as is
shown in Figure 42 [172], ideally filled by the electrolyte and along which the
resistivity of the solution is independent of the position x [173].

Influence of surface treatments on corrosion resistance
properties of ultrafine grained Titanium alloys for implant applications 88
Figure 42: Model of a cylindrical porous electrode. The gray area is nonconductive.
Adapted from Lasia et al., (2008) [172].
The conductivity of the solid phase is assumed to be infinite (metallic
electrode behavior), and the local impedance is independent of x (thus no axial
concentration gradient is considered, and the ohmic drop is neglected) [173]. The
analytical expression of the impedance of a pore “ZDe Levie” is given by Eq 18 [173]:
ZDe Levie = (R0Z0)1/2coth (L√R0
Z0) (25)
Where R0 (Ω·cm-1) and Z0 (Ω·cm-1) are, respectively, the resistance of the
electrolyte in the pore and the interfacial impedance, for a unit of pore length.
5.3.2.2 Transmission lines model
To explain the impedance behavior of non-ideal porous electrodes, Bisquert
et al., (2000) [169] developed an improved and generalized model involving the
concept of the transmission line. The starting point is the same as for the De Levie
model, i.e., the pores are considered cylindrical, of finite length L, deposited on a

Experimental results 89
conductive substrate, and immersed in an electrolyte [25]. This structure is
represented in Figure 43. It is assumed that the ionic species in the pores flooded
with electrolyte can be exchanged freely with the bulk solution at the pore´s mouth
(x = 0 in the Figure 43) , and also that the electronic charge carrier in the solid
phase can be withdrawn or injected freely at the contact with the substrate (x = L in
Figure 43) [174].
Figure 43: Scheme of a porous electrode. Adapted from Bisquert et al., (2000) [174].
The subscripts 1 and 2 denote the liquid (channel 1) and solid phase
(channel 2), respectively. χ1 is the impedance of the electrolyte within the pore,
and χ2 is the impedance of the porous electrode’s solid phase; these also describe
a local ohmic drop at each point of the transport channels. The element ξ
represents the interfacial impedance and describes an exchange of electrical
charge at the interface (solution/porous solid) owing to faradaic currents and
polarization at the pore surface. ZA is an impedance describing the specific
conditions of polarization of electronic carriers at the film/electrolyte boundary, and
similarly for ZB ionic and/or electronic polarization at the bottom of the pore.
The complete analytic expression of such a transmission line is the following
expression:

Influence of surface treatments on corrosion resistance
properties of ultrafine grained Titanium alloys for implant applications 90
𝑍 =1
𝑥1 + 𝑥2[𝜆(𝑥1 + 𝑥2)𝑆𝜆 + (𝑍𝐴 + 𝑍𝐵)𝐶𝜆 +
1
𝜆(𝑥1 + 𝑥2)𝑍𝐴𝑍𝐵𝑆𝜆]
−1
× (𝐿𝜆𝑥1𝑥2(𝑥1 + 𝑥2)𝑆𝜆 + 𝑥1[𝜆𝑥1𝑆𝜆 + 𝐿𝑥2𝐶𝜆]𝑍𝐴 + 𝑥2[𝜆𝑥2𝑆𝜆 + 𝐿𝑥1𝐶𝜆]𝑍𝐵
+1
𝑥1 + 𝑥2× [2𝑥1𝑥2 + (𝑥1
2 + 𝑥22)𝐶𝜆 +
𝐿
𝜆𝑥1𝑥2𝑆𝜆] 𝑍𝐴𝑍𝐵)
(26)
Where the notations 𝐶𝜆 = 𝑐𝑜𝑠ℎ (𝐿
𝜆) , 𝑆𝜆 = 𝑠𝑖𝑛ℎ (
𝐿
𝜆), and 𝜆 = [𝜉/(𝑥1 + 𝑥2 )]1/2 have
been used.
In this manner, the general transmission line shown in Figure 43 gives rise
to several models of transmission lines [148,174,175] depending on the different
types of assumptions concerning the geometry and microstructure leading to the
TL model.
5.3.2.3 Transmission line model applied to EIS data of anodized
samples.
To obtain quantitative and meaningful numerical results when a
transmission line model is applied, the choice of appropriate physical models and
boundary conditions with the corresponding, accurately determined, kinetic, and
transport parameters are key issues.
The first hypothesis proposed in this study is for channel 1 (the liquid) and
consist of admitting that a Warburg impedance is observed, which may be due to
the diffusion of oxygen into channel 1. Oxygen transport takes place in the
electrolyte towards pore surfaces [176]. Therefore, channel 1 can be represented
by χ1 = r1+ZW.
For traditional electrodes with large particle sizes, the Warburg-type
diffusion impedance, which draws a 45° line in the complex plane representation
(Nyquist plot), has been widely reported at low frequencies [177–179]. However,

Experimental results 91
impedance spectra of modern thin film and nanoparticle battery electrodes show
deviations in the spectra away from the conventional Warburg model [178,180].
On the other hand, the second hypothesis assumes that channel 2 is a
resistive channel and is modeled by a distributed resistance.
χ2 = r2
Thus, the total resistance (Ω) distributed in the resistive channel is given by
R2 = L· r2
The third hypothesis assumes that the effect of an interfacial reaction in the
pore surface can be modeled by a dispersive capacitance given by a CPE with a
parallel charge transfer resistance to the interfacial impedance. That is:
ξ =r3
1 + r3q3(jω)β
Where q3 is a constant and β is 0 < β < 1.
The total pseudo-capacitance describing the interface is defined by
Q3 = L·q3 (in F sβ-1)
Where L is the length of the pores (in cm).
The fourth hypothesis is concerning the boundary impedances. The
electrolyte | top of the pores is modeled by an impedance consisting of a
resistance (RA). The electrolyte | substrate interface is modeled by an impedance
consisting of a CPE element (QB(jω)n)−1.
To strictly justify these assumptions, preliminary fittings have been made, in
a first approach, considering the expression of the impedance of such a
transmission line as:
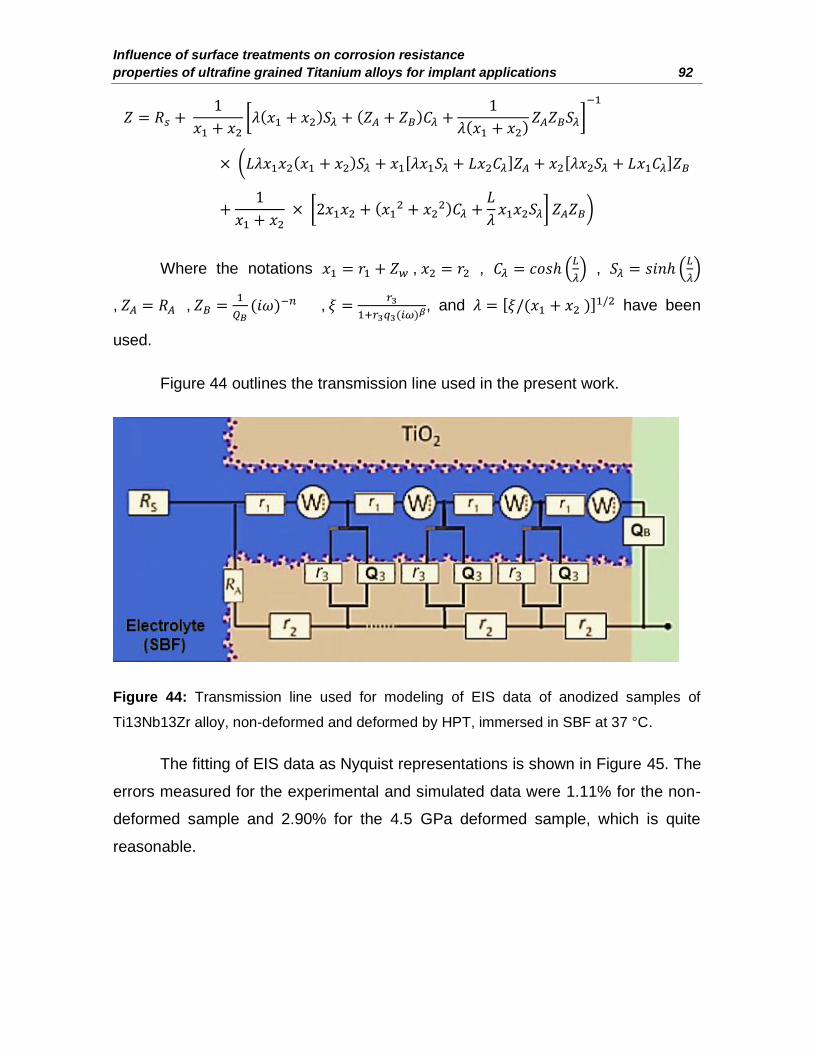
Influence of surface treatments on corrosion resistance
properties of ultrafine grained Titanium alloys for implant applications 92
𝑍 = 𝑅𝑠 + 1
𝑥1 + 𝑥2[𝜆(𝑥1 + 𝑥2)𝑆𝜆 + (𝑍𝐴 + 𝑍𝐵)𝐶𝜆 +
1
𝜆(𝑥1 + 𝑥2)𝑍𝐴𝑍𝐵𝑆𝜆]
−1
× (𝐿𝜆𝑥1𝑥2(𝑥1 + 𝑥2)𝑆𝜆 + 𝑥1[𝜆𝑥1𝑆𝜆 + 𝐿𝑥2𝐶𝜆]𝑍𝐴 + 𝑥2[𝜆𝑥2𝑆𝜆 + 𝐿𝑥1𝐶𝜆]𝑍𝐵
+1
𝑥1 + 𝑥2 × [2𝑥1𝑥2 + (𝑥1
2 + 𝑥22)𝐶𝜆 +
𝐿
𝜆𝑥1𝑥2𝑆𝜆] 𝑍𝐴𝑍𝐵)
Where the notations 𝑥1 = 𝑟1 + 𝑍𝑤 , 𝑥2 = 𝑟2 , 𝐶𝜆 = 𝑐𝑜𝑠ℎ (𝐿
𝜆) , 𝑆𝜆 = 𝑠𝑖𝑛ℎ (
𝐿
𝜆)
, 𝑍𝐴 = 𝑅𝐴 , 𝑍𝐵 =1
𝑄𝐵(𝑖𝜔)−𝑛 , 𝜉 =
𝑟3
1+𝑟3𝑞3(𝑖𝜔)𝛽, and 𝜆 = [𝜉/(𝑥1 + 𝑥2 )]1/2 have been
used.
Figure 44 outlines the transmission line used in the present work.
Figure 44: Transmission line used for modeling of EIS data of anodized samples of
Ti13Nb13Zr alloy, non-deformed and deformed by HPT, immersed in SBF at 37 °C.
The fitting of EIS data as Nyquist representations is shown in Figure 45. The
errors measured for the experimental and simulated data were 1.11% for the non-
deformed sample and 2.90% for the 4.5 GPa deformed sample, which is quite
reasonable.

Experimental results 93
0,0 1,0x10⁵
0,0
1,0x10⁵
2,0x10⁵
3,0x10⁵
4,0x10⁵
Error (%) =1,11
-''(
c
m2
)
'( cm2
)
Non-deformed
Fitting
0,0 6,0x10⁴
0,0
6,3x10⁴
1,3x10⁵
1,9x10⁵
2,5x10⁵
'( cm2
)
-''(
c
m2
)
Error (%) =1,96
1 GPa
Fitting
0,0 5,0x10⁴
0,0
7,0x10⁴
1,4x10⁵
2,1x10⁵
'( cm2
)
-''(
c
m2
)
Error (%) =2,90
4.5 GPa
Fitting
Figure 45: Nyquist diagrams of experimental data and simulated curves obtained by the
Simad software for the anodized samples of Ti13Nb13Zr alloy at ND, HPT1GPa, and
HPT4.5GPa conditions.
The equivalent circuit parameters obtained when fitting EIS data of anodized
samples of Ti13Nb13Zr alloy (see section 5.2.2.3, Figure 35) at the ND,
HPT1GPA, and HPT4.5GPa conditions, are shown in Table 16. Additionally, CPE
behavior corresponding to systems for which a variation of properties is expected
in the direction normal to the electrode, then it is possible to apply the equation

Influence of surface treatments on corrosion resistance
properties of ultrafine grained Titanium alloys for implant applications 94
derived by Hsu-Mansfeld et al. Eq. (21) to calculate the effective capacitance
associated with the CPE. These capacitance values are also shown in Table 16.
Table 16: Equivalent circuit parameters and effective capacitance associated with the
CPEs obtained when fitting EIS data of anodized samples of Ti13Nb13Zr alloy according
to the model in Figure 44.
It can be seen from the data in Table 16, high RA values, as well as low Q3
and QB values. These results indicate that a highly stable film was formed on the
surface of the anodized samples of Ti13Nb13Zr alloy, non-deformed and deformed
by HPT, immersed in SBF. Moreover, the n values were close to 0.95, which
suggest that the TiO2 nanostructures formed displays a near capacitive behavior.
On the other hand, it can be seen that internal resistance (R2) of the solid
channel is higher for the samples non-deformed and deformed by HPT at 1 GPa.
This result may be explained by the fact that the nanotubular layer is thicker in
these samples than in sample deformed at 4.5 GPa (see Table 4). Therefore, it
seems that there is a proportional relationship between TiO2 nanotube length and
corrosion resistance.
Regarding the effective interfacial capacitance (Cβ) associated to the ξ
element, for all conditions, they are of the order of several tens of μF·cm−2 (Table
16), which are typical values for double layer capacitances. Further, the effective
capacitance associated with the boundary CPE were 3, 2 and 5 μF·cm- 2 for
Ti13Nb13Zr alloy, at ND, HPT1GPa and HPT4.5GPa conditions, respectively.
These values are of the order of magnitude of a passive film capacitance.
Condition
χ1 χ2 𝝃 ZA ZB Rs
R1 R2 R3 Q3 β
Cβ RA QB n
Cn Rs
(Ω) (Ω) (Ω) (Fβ-1) µF/cm2 (Ω) (Fn-1) µF/cm2 (Ω)
Non-deformed 1 241 2.3E+15 1.4E-06 0.96 14 3.0E+07 1.4E-06 0.96 3 70.0
1 GPa 6 736 1.8E+15 1.2E-06 0.97 19 3.0E+07 1.0E-06 0.96 2 70.0
4.5 GPa 1 100 1.8E+15 2.4E-06 0.94 42 2.3E+07 2.0E-06 0.96 5 70.0

Experimental results 95
The passive film thickness was calculated from the effective capacitance
(Eq (22)). The thickness values were of 25.5, 39.6 and 17.6 nm for Ti13Nb13Zr
alloy at ND, HPT1GPa and HPT4.5GPa conditions, respectively. These results
show that the anodization of Ti13Nb13Zr alloy contributes to increasing the passive
film thickness. The passive film thicknesses, as well as the length of the
nanostructures, are affected by the deformation by HPT.
Finally, the experimental EIS data obtained for the anodized Ti13Nb13Zr
alloy were satisfactorily fitting by the model proposed in Figure 44. Therefore, the
physical behavior of the system was well described by this transmission line model.
5.3.3 EEC proposed to samples chemically treatment by HCl etching
and NaOH activation
Several reports have shown that during acid etching, the thin passive
titanium oxide layer dissolves to form TiH2 [181]. In contact with air moisture, a new
titanium oxide layer is formed. This layer is thinner than the original one. In alkali
solution, however, even this thin passive layer dissolves to form a layer containing
Na+ ions, as is shown in Figure 46 [128,139,182,183].
Figure 46: Schematic representation of surface structural change on titanium metal in the
presence of acid etching and alkali treatment. Adapted from Sasikumar et al., (2017) [139].
However, the microstructural characterization, of the chemically treated
samples, indicated the presence of anatase, rutile, and sodium titanate, as was
mentioned in section 5.1.3. The presence of anatase and rutile could be explained
because TiH2 is very easy to dissolve in alkaline solution, and a porous layer of
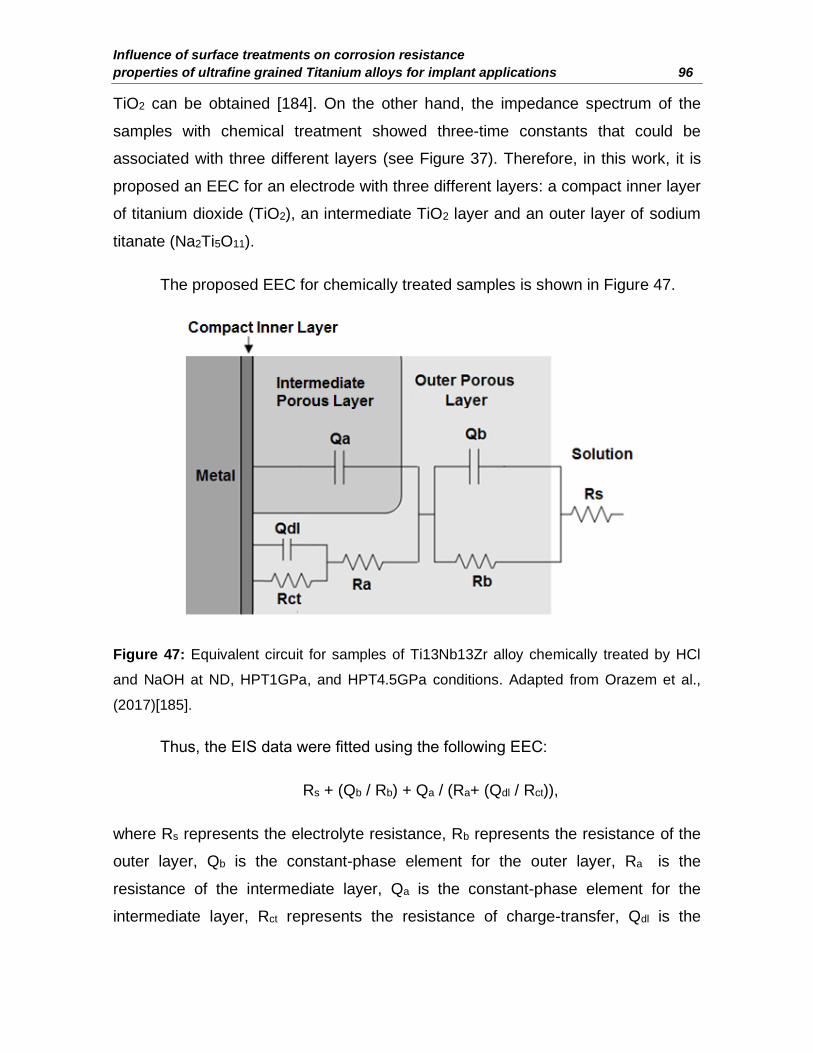
Influence of surface treatments on corrosion resistance
properties of ultrafine grained Titanium alloys for implant applications 96
TiO2 can be obtained [184]. On the other hand, the impedance spectrum of the
samples with chemical treatment showed three-time constants that could be
associated with three different layers (see Figure 37). Therefore, in this work, it is
proposed an EEC for an electrode with three different layers: a compact inner layer
of titanium dioxide (TiO2), an intermediate TiO2 layer and an outer layer of sodium
titanate (Na2Ti5O11).
The proposed EEC for chemically treated samples is shown in Figure 47.
Figure 47: Equivalent circuit for samples of Ti13Nb13Zr alloy chemically treated by HCl
and NaOH at ND, HPT1GPa, and HPT4.5GPa conditions. Adapted from Orazem et al.,
(2017)[185].
Thus, the EIS data were fitted using the following EEC:
Rs + (Qb / Rb) + Qa / (Ra+ (Qdl / Rct)),
where Rs represents the electrolyte resistance, Rb represents the resistance of the
outer layer, Qb is the constant-phase element for the outer layer, Ra is the
resistance of the intermediate layer, Qa is the constant-phase element for the
intermediate layer, Rct represents the resistance of charge-transfer, Qdl is the

Experimental results 97
constant-phase element for the double layer at the dense inner layer-electrolyte
interface.
The fitting of EIS data as Nyquist representation is shown in Figure 48. The
errors measured for the experimental and simulated data were 0.72% for the non-
deformed sample and 3.27% for the 4.5 GPa deformed sample, which is quite
reasonable.
0,0 8,0x10⁴
0,0
4,0x10⁴
8,0x10⁴
1,2x10⁵
1,6x10⁵
Error (%) =0,72
-''(
c
m2)
'( cm2)
Non-deformed
Fitting
0,0 6,0x10⁴
0,0
4,0x10⁴
8,0x10⁴
1,2x10⁵
Error (%) =2,87
-''(
c
m2)
'( cm2)
1 GPa
Fitting
0,00 4,50x10⁴
0,0
3,0x10⁴
6,0x10⁴
9,0x10⁴
Error (%) =3,27
-''(
c
m2)
'( cm2)
4.5 GPa
Fitting
Figure 48: Nyquist diagrams of experimental data and simulated curves obtained by the
Simad software for samples of Ti13Nb13Zr alloy chemically treated by HCl and NaOH at
ND, HPT1GPa, and HPT4.5GPa conditions.

Influence of surface treatments on corrosion resistance
properties of ultrafine grained Titanium alloys for implant applications 98
The equivalent circuit parameters obtained when fitting EIS data of samples
of Ti13Nb13Zr alloy chemically treated by HCl and NaOH are shown in Table 17.
Further, the effective capacitance associated with the CPE was calculated with the
equation derived by Brug et al. (Eq.20). These capacitance values are given in
Table 17.
Table 17: Equivalent circuit parameters and effective capacitance associated with the
CPEs obtained when fitting EIS data of samples of Ti13Nb13Zr alloy chemically treated by
HCl and NaOH according to the EEC in Figure 47.
Condition
Element Non-deformed 1 GPa 4.5 GPa
Rs (Ω· cm2) 22 20 20
Qb (µF ·s(αb-1)) 52 28 43
αb 0.70 0.76 0.72
Rb (Ω· cm2) 28 15 15
Ceff(b) (µF/ cm2) 2.2 2.0 2.0
Qa (µF ·s(αa-1)) 19 11 55
αa 0.70 0.75 0.70
Ra (Ω· cm2) 7 2 10
Ceff(a) (µF/ cm2) 0.4 0.3 0.5
Qdl (µF ·s(αdl-1)) 21 39 19
αdl 0.98 0.90 0.96
Rct (Ω· cm2) 7.6E+05 6.8E+05 6.0E+05
Ceff(dl) (µF/cm2) 19 18 14
It can be seen from the data in Table 17, high Rct values, which implies high
corrosion resistance. The exponent of the CPE, αb in the case of Qb equals a value
in between 0.70 and 0.76, while αa equals a value in between 0.70 and 0.75 in the
case of Qa. These exponent values indicate a highly porous interfacial range
between the outer layer and the substrate [186]. The exponent of the CPE related
to the double layer was between 0.90 and 0.98, which suggest that the dense inner

Experimental results 99
layer of samples chemically treated by HCl and NaOH displays a near capacitive
behavior.
On the other hand, the capacitance values for the double layer (Ceff(dl)) were
between 14 to 19 μF·cm-2 (see Table 17). These values are in the typical range,
10–40 µF/cm-2. The capacitance values for the porous outer layer (Ceff(b)) and
intermediate porous layer (Ceff(a)) were lower than Ceff(dl).
The thickness of the protective film δ (in nm) can be obtained from equation
22. Then, Eq. (22) gives the inner protective film thickness of 4.05, 4.30 and 5.41
nm for chemically treated Ti13Nb13Zr alloy, at ND, HPT1GPa and HPT4.5GPa
conditions, respectively. These results show that the chemical treatment, by HCl
etching and NaOH activation, contributes to increasing the inner layer thickness
comparing with polished samples. Also, the deformation by HPT of Ti13Nb13Zr
alloy contributes to increasing the thickness of this inner layer.
The results obtained by fitting EIS data indicate that the deformed and non-
deformed Ti13Nb13Zr alloy chemically treated by HCl and NaOH, behaved in a
very similar way. The differences are rather small, and this can be explained by the
fact that the passive film formed on these alloys is mostly of the same nature.
5.3.4 EEC proposed to samples chemically treatment by H3PO4
etching and NaOH activation
The equivalent circuit is shown in Figure 47 also was used to fitting the EIS
data of samples of Ti13Nb13Zr alloy chemically treated by H3PO4 and NaOH.
These fitting are shown in Figure 49. The errors measured for the experimental
and simulated data were 1.69% for the non-deformed sample and 1.19% for the
4.5 GPa deformed sample, indicating that data adjusted well to the proposed
equivalent circuit.
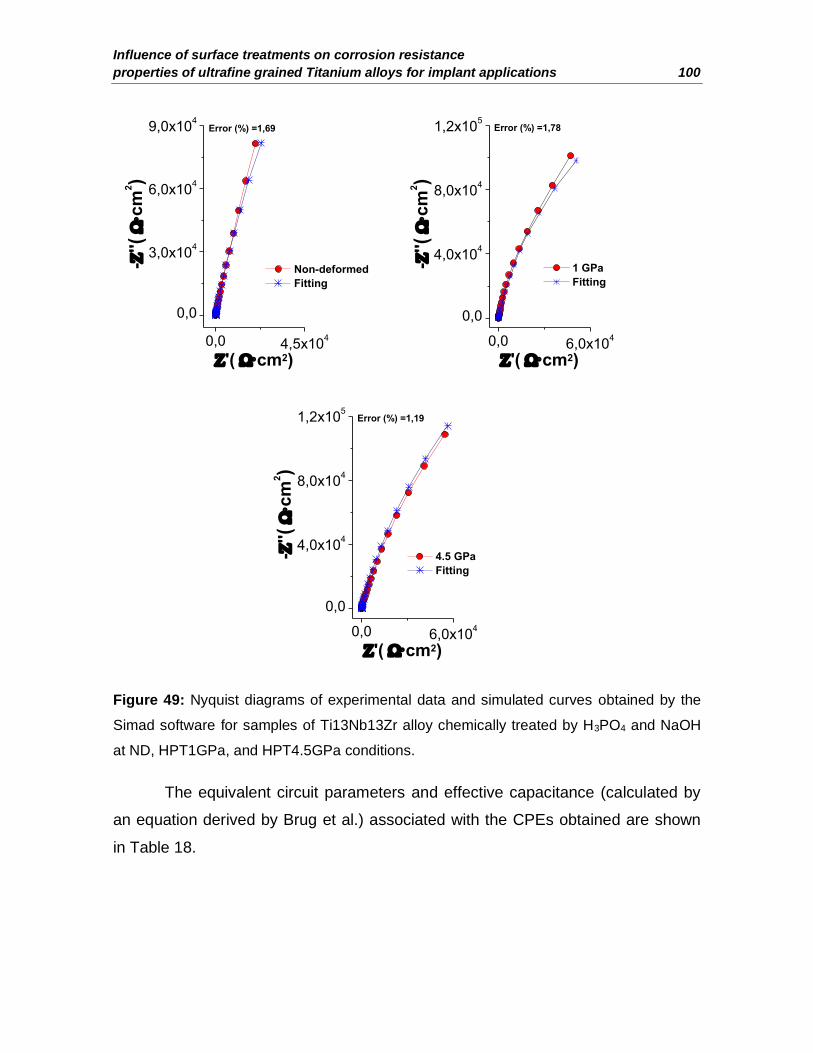
Influence of surface treatments on corrosion resistance
properties of ultrafine grained Titanium alloys for implant applications 100
0,0 4,5x10⁴
0,0
3,0x10⁴
6,0x10⁴
9,0x10⁴
Error (%) =1,69-
''(
c
m2)
'( cm2)
Non-deformed
Fitting
0,0 6,0x10⁴
0,0
4,0x10⁴
8,0x10⁴
1,2x10⁵
Error (%) =1,78
-''(
c
m2)
'( cm2)
1 GPa
Fitting
0,0 6,0x10⁴
0,0
4,0x10⁴
8,0x10⁴
1,2x10⁵
Error (%) =1,19
-''(
c
m2)
'( cm2)
4.5 GPa
Fitting
Figure 49: Nyquist diagrams of experimental data and simulated curves obtained by the
Simad software for samples of Ti13Nb13Zr alloy chemically treated by H3PO4 and NaOH
at ND, HPT1GPa, and HPT4.5GPa conditions.
The equivalent circuit parameters and effective capacitance (calculated by
an equation derived by Brug et al.) associated with the CPEs obtained are shown
in Table 18.

Experimental results 101
Table 18: Equivalent circuit parameters and effective capacitance associated with the
CPEs obtained when fitting EIS data of samples of Ti13Nb13Zr alloy chemically treated by
H3PO4 and NaOH according to the EEC in Figure 47.
Condition
Element Non-deformed 1 GPa 4.5 GPa
Rs (Ω· cm2) 20 20 20
Qb (µF ·s(αb-1)) 42 15 15
αb 0.72 0.81 0.78
Rb (Ω· cm2) 13 2 10
Ceff(b) (µF/ cm2) 1.9 1.3 1.2
Qa (µF ·s(αa-1)) 65 42 14
αa 0.78 0.82 0.77
Ra (Ω· cm2) 78 44 20
Ceff(a) (µF/ cm2) 9 8 1.0
Qdl (µF ·s(αdl-1)) 14 12 32
αdl 0.96 0.98 0.91
Rct (Ω· cm2) 5.1E+05 4.5E+05 7.1E+05
Ceff(dl) (µF/cm2) 10 10 15
It can be seen from the data in Table 18, high Rct values. These results
indicate that a highly stable film was formed on the surface of samples chemically
treated by H3PO4 and NaOH immersed in SBF. Moreover, the αdl values were
close to 0.95, which suggest that the samples chemically treated displays a near
capacitive behavior. The same behavior was observed as the samples with acid-
etched with HCl, where the values of αb and αa were between 0.72 and 0.82, which
was a consequence of frequency dispersion of the outer layer [187].
On the other hand, the capacitance values for the double layer (Ceff(dl)) were
between 10 to 15 μF·cm- 2 (see Table 17). These values are in the typical range,
10–40 μF·cm- 2. The capacitance values for the porous outer layer (Ceff(b)) and
intermediate porous layer (Ceff(a)) were lower than Ceff(dl).

Influence of surface treatments on corrosion resistance
properties of ultrafine grained Titanium alloys for implant applications 102
The thickness of the protective film δ (in nm) can be obtained from equation
22. The thickness values were of 7.62, 7.43, and 5.03 nm for Ti13Nb13Zr alloy at
ND, HPT1GPa and HPT4.5GPa conditions, respectively. These results show that
the chemical treatment contributes to increasing the inner layer.
The results obtained by fitting EIS data indicate that the deformed and non-
deformed Ti13Nb13Zr alloy chemically treated by H3PO4 and NaOH behaved in a
very similar way.
5.4 Bioactivity of Ti13Nb13Zr alloy
In order to characterize the bioactivity of the Ti13Nb13Zr alloy, the amount
of hydroxyapatite (HAp) spontaneously deposited on the surface of the samples
was measured. The samples were immersed in SBF for 1, 7, and 14 days.
5.4.1 Bioactivity of polished samples
Figure 50 shown SEM-FEG observations of polished samples, subjected to
the bioactivity tests, after 1, 7, and 14 days immersed in SBF.

Experimental results 103
Figure 50: SEM-FEG observations (scale bar 1 µm) of polished samples of Ti13Nb13Zr
alloy, non-deformed, and deformed by HPT, subjected to the bioactivity tests after 1, 7,
and 14 days immersed in SBF.
From Figure 50, one can see that even after 14 days of immersion in the
physiological solution, no apatite was detected on any surfaces of the polished
samples of Ti13Nb13Zr alloy.
Table 19 shows the EDS analysis performed for each condition. The results
confirm that there was no apatite formation on the surface of the samples.

Influence of surface treatments on corrosion resistance
properties of ultrafine grained Titanium alloys for implant applications 104
Table 19: The quantitative chemical EDS analysis of Ti13Nb13Zr alloy non-deformed and
deformed by HPT after soaking in SBF solution for 1, 7, and 14 days.
Chemical element (at %)
Soaking time Condition Ti Zr Nb O Ca P
Non-deformed 77.58 8.82 8.68 4.92 - -
1 day 1 GPa 76.03 9.10 8.95 5.92 - -
4.5 GPa 75.64 9.54 8.95 5.87 - -
Non-deformed 73.65 7.21 7.26 11.88 - -
7 days 1 GPa 73.29 7.57 7.92 11.22 - -
4.5 GPa 74.24 7.36 7.08 11.32 - -
Non-deformed 71.40 7.20 7.19 14.21 - -
14 days 1 GPa 70.39 7.13 7.19 15.29 - -
4.5 GPa 70.12 7.26 7.16 15.46 - -
The Ca/P ratio in the HAp, Ca10(PO4)6(OH)2, concerning stoichiometric value
is 1.67 [188]. From the data in Table 19, it can be seen that neither calcium nor
phosphorus were identified. Therefore, there was no formation of a film based on
calcium and phosphorus on the surface of samples without surface treatments
(polished samples). Furthermore, the polished samples were also weighed in order
to verify the mass gain due to the formation of a HAp film. There was no change in
the mass after 14 days of immersion in SBF.
5.4.2 Bioactivity of anodized samples
Figure 51 shows SEM-FEG observations of anodized samples, subjected to
the bioactivity tests, after 1, 7 and 14 days immersed in SBF.s

Experimental results 105
Figure 51: SEM-FEG observations (scale bar 1 µm) of anodized samples of Ti13Nb13Zr
alloy, non-deformed, and deformed by HPT, subjected to the bioactivity tests after 1, 7,
and 14 days immersed in SBF.
From Figure 51(c), it can be seen that only in the samples deformed at 4.5
GPa, there was the formation of apatite deposits from 24 hours of immersion in
SBF. Homogeneous deposits of apatite were observed in all the conditions at 7 and
14 days of immersion in SBF.
Table 20 shows the EDS analysis performed for each condition and confirms
that there is apatite formation from the first day for the deformed condition at 4.5
GPa and then for the 7 and 14 days for all the other conditions.
Apatite

Influence of surface treatments on corrosion resistance
properties of ultrafine grained Titanium alloys for implant applications 106
Table 20: Quantitative EDS analysis results and Ca/P molar ratio of anodized samples of
Ti13Nb13Zr alloy, non-deformed and deformed by HPT, subjected to the bioactivity tests
after 1, 7 and 14 days immersed in SBF.
Chemical element (at %)
Soaking time Condition Ti Zr Nb O Na Mg Ca P Ca/P Molar Ratio
Non-deformed 25.10 2.58 3.31 68.62 0.09 0.09 0.18 0.03 -
1 day 1 GPa 24.89 2.62 3.42 68.68 0.08 0.09 0.19 0.03 -
4.5 GPa 9.30 1.29 1.17 69.27 - - 12.23 6.74 1.81 Non-deformed 0.57 - - 66.87 0.33 0.92 19.36 11.95 1.62
7 days 1 GPa 0.27 0.42 - 66.71 0.42 0.98 19.73 11.47 1.72
4.5 GPa 0.05 0.42 - 68.66 0.30 0.85 18.97 10.75 1.76 Non-deformed 0.90 0.49 - 66.05 0.47 0.84 20.64 10.61 1.95
14 days 1 GPa 0.47 0.50 - 66.21 0.46 0.86 20.65 10.85 1.90
4.5 GPa 0.05 0.49 - 66.37 0.46 0.88 20.66 11.09 1.86
The molar ratio of Ca / P was calculated in Table 20. This molar ratio of Ca /
P was approximately 1.80, which is higher than the stoichiometric ratio of 1.67,
which indicates that the newly formed calcium phosphate is a type B carbonate
apatite, in which PO43− substitutes for CO3
2−[189]. A more detailed explanation will
be shown in the result's discussion section. On the other hand, to verify the mass
gain by the formation of a hydroxyapatite film, the samples were weighed, and their
results are shown in Figure 52.
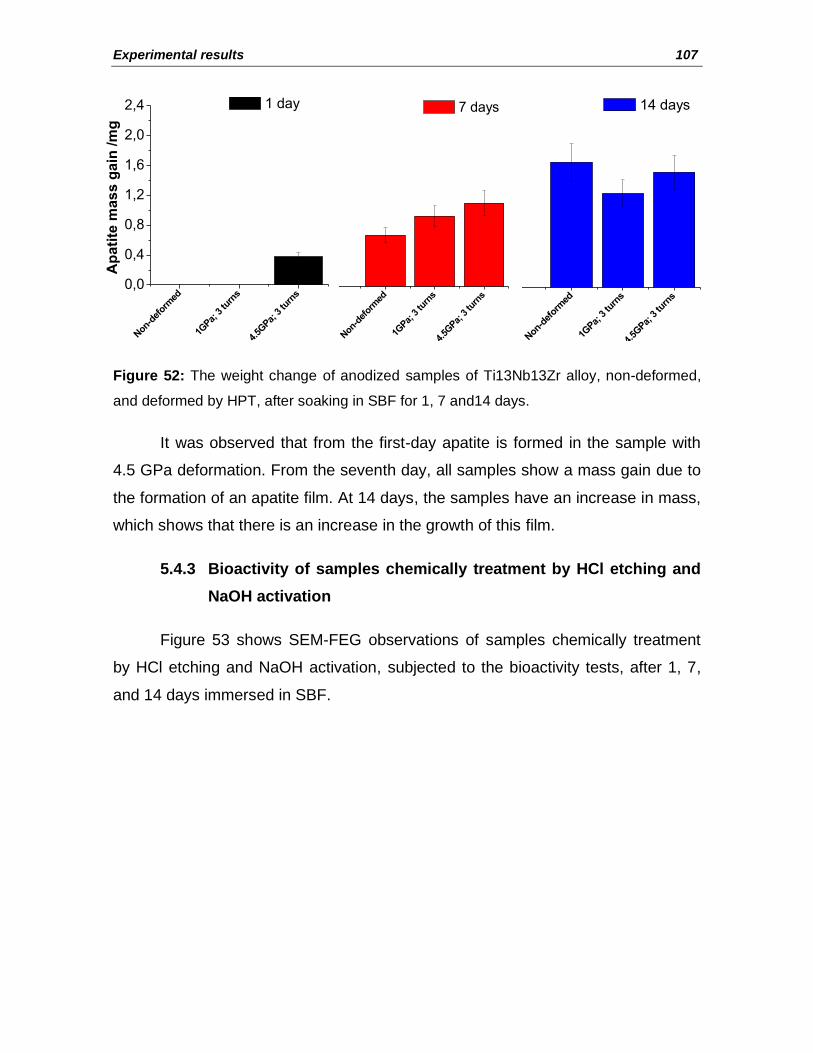
Experimental results 107
Non
-def
orm
ed
1GPa;
3 tu
rns
4.5G
Pa; 3 tu
rns
0,0
0,4
0,8
1,2
1,6
2,0
2,4A
pa
tite
ma
ss
ga
in /m
g 1 day
Non
-def
orm
ed
1GPa;
3 tu
rns
4.5G
Pa; 3 tu
rns
0,0
0,4
0,8
1,2
1,6
2,0
2,4
Ap
ati
te m
as
s g
ain
/m
g
7 days
Non
-def
orm
ed
1GPa;
3 tu
rns
4.5G
Pa; 3 tu
rns
0,0
0,4
0,8
1,2
1,6
2,0
2,4
Ap
ati
te m
as
s g
ain
/m
g
14 days
Figure 52: The weight change of anodized samples of Ti13Nb13Zr alloy, non-deformed,
and deformed by HPT, after soaking in SBF for 1, 7 and14 days.
It was observed that from the first-day apatite is formed in the sample with
4.5 GPa deformation. From the seventh day, all samples show a mass gain due to
the formation of an apatite film. At 14 days, the samples have an increase in mass,
which shows that there is an increase in the growth of this film.
5.4.3 Bioactivity of samples chemically treatment by HCl etching and
NaOH activation
Figure 53 shows SEM-FEG observations of samples chemically treatment
by HCl etching and NaOH activation, subjected to the bioactivity tests, after 1, 7,
and 14 days immersed in SBF.

Influence of surface treatments on corrosion resistance
properties of ultrafine grained Titanium alloys for implant applications 108
Figure 53: SEM-FEG observations (scale bar 1 µm) for samples of Ti13Nb13Zr alloy
chemically treated, by HCl etching and NaOH activation, non-deformed and deformed by
HPT, subjected to the bioactivity tests after 1, 7 and 14 days immersed in SBF.
From Figure 53, it is observed that after 7 days of immersion in the
physiological solution, apatite was detected on all surfaces of samples chemically
treatment by HCl and NaOH.
Table 21 shows the EDS analysis performed for each condition and
confirms that there is apatite formation from 7 and 14 days for all conditions.

Experimental results 109
Table 21: Quantitative EDS analysis results and Ca/P molar ratio for samples of
Ti13Nb13Zr alloy chemically treated by HCl and NaOH, non-deformed and deformed by
HPT, subjected to the bioactivity tests after 1, 7 and 14 days immersed in SBF.
Chemical element (at %)
Soaking time Condition Ti Zr Nb O Na Mg Ca P Ca/P Molar
Ratio
Non-deformed 23.95 1.21 2.41 67.28 0.56 0.59 3.57 0.43 -
1 day 1 GPa 24.12 1.18 2.52 67.32 0.62 0.74 2.98 0.52 -
4.5 GPa 22.78 1.24 2.64 68.42 0.52 0.65 3.33 0.42 -
Non-deformed 0.22 0.49 - 68.09 0.72 0.98 18.98 10.52 1.80
7 days 1 GPa 22.49 1.05 2.11 67.42 0.72 0.63 3.56 2.03 1.76
4.5 GPa 0.24 0.62 - 67.89 0.78 0.57 18.96 10.94 1.73
Non-deformed 0.16 0.47 - 67.36 0.49 0.85 19.24 11.43 1.68
14 days 1 GPa 0.21 0.78 - 66.08 0.42 0.76 20.50 11.25 1.82
4.5 GPa 0.12 0.38 - 65.66 0.42 0.82 20.24 12.36 1.64
The molar ratio of Ca / P was calculated in Table 21. This molar ratio of Ca /
P was approximately 1.74, which indicates that the newly formed calcium
phosphate is a type B carbonate apatite, in which PO43− substitutes for CO3
2−. On
the other hand, to verify the mass gain by the formation of a hydroxyapatite film,
the samples were weighed, and their results are shown in Figure 54.

Influence of surface treatments on corrosion resistance
properties of ultrafine grained Titanium alloys for implant applications 110
Non
-def
orm
ed
1GPa;
3 tu
rns
4.5G
Pa; 3 tu
rns
0,0
0,4
0,8
1,2
1,6
2,0
2,4A
pa
tite
ma
ss
ga
in /m
g
1 day
Non
-def
orm
ed
1GPa;
3 tu
rns
4.5G
Pa; 3 tu
rns
0,0
0,4
0,8
1,2
1,6
2,0
2,4
Ap
ati
te m
as
s g
ain
/m
g
7 days
Non
-def
orm
ed
1GPa;
3 tu
rns
4.5G
Pa; 3 tu
rns
0,0
0,4
0,8
1,2
1,6
2,0
2,4
Ap
ati
te m
as
s g
ain
/m
g
14 days
Figure 54: The weight change for samples of Ti13Nb13Zr alloy chemically treated by HCl
and NaOH, non-deformed and deformed by HPT, subjected to the bioactivity tests after 1,
7 and 14 days immersed in SBF.
It was observed that from the seventh day, all samples show a mass gain
due to the formation of an apatite film. At 14 days, the samples increase their
mass, which shows that there is an increase in the growth of this film.
5.4.4 Bioactivity of samples chemically treatment by H3PO4 etching
and NaOH activation
Figure 55 shows SEM-FEG observations of samples chemically treated by
H3PO4 and NaOH, subjected to the bioactivity tests, after 1, 7, and 14 days
immersed in SBF.

Experimental results 111
Figure 55: SEM-FEG observations (scale bar 1 µm) for samples of Ti13Nb13Zr alloy
chemically treated by H3PO4 and NaOH, non-deformed and deformed by HPT, subjected
to the bioactivity tests after 1, 7 and 14 days immersed in SBF.
Figure 55 shows that after 7 days of immersion in the physiological solution,
apatite was detected on all surfaces of samples chemically treatment by H3PO4
and NaOH.
Table 22 shows the ESD analysis performed for each condition and
confirms that there is apatite formation from 7 and 14 days for all conditions.
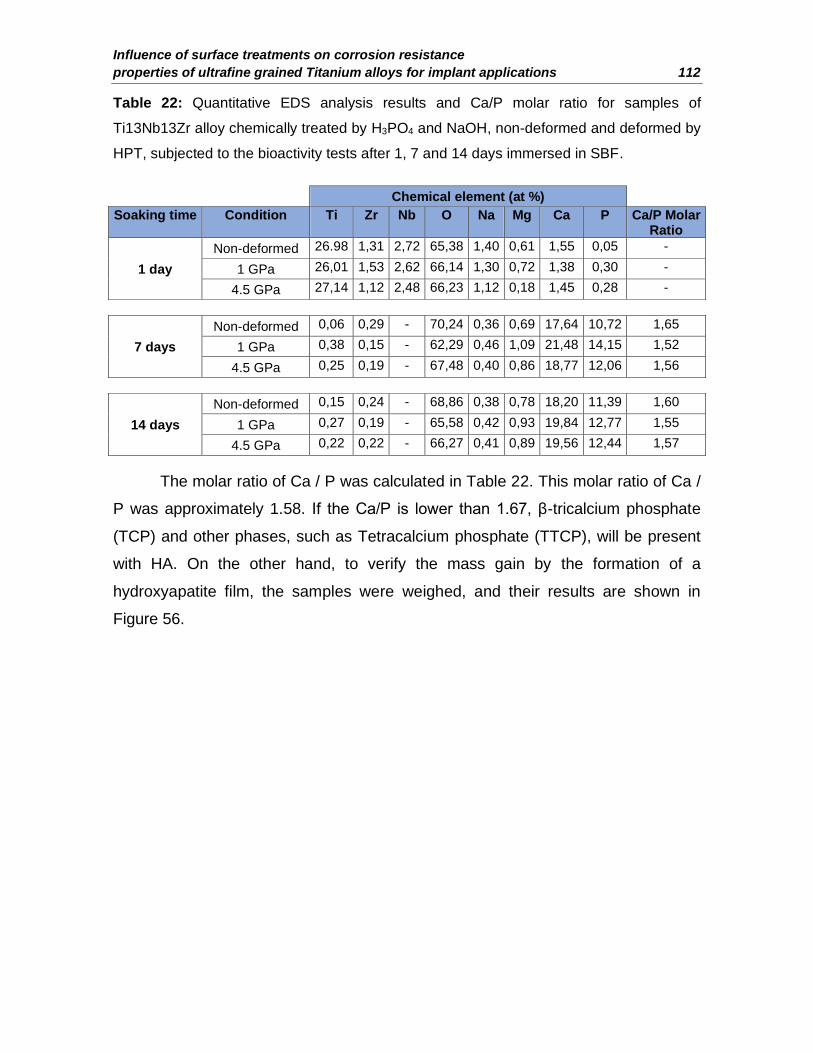
Influence of surface treatments on corrosion resistance
properties of ultrafine grained Titanium alloys for implant applications 112
Table 22: Quantitative EDS analysis results and Ca/P molar ratio for samples of
Ti13Nb13Zr alloy chemically treated by H3PO4 and NaOH, non-deformed and deformed by
HPT, subjected to the bioactivity tests after 1, 7 and 14 days immersed in SBF.
Chemical element (at %)
Soaking time Condition Ti Zr Nb O Na Mg Ca P Ca/P Molar Ratio
Non-deformed 26.98 1,31 2,72 65,38 1,40 0,61 1,55 0,05 -
1 day 1 GPa 26,01 1,53 2,62 66,14 1,30 0,72 1,38 0,30 -
4.5 GPa 27,14 1,12 2,48 66,23 1,12 0,18 1,45 0,28 -
Non-deformed 0,06 0,29 - 70,24 0,36 0,69 17,64 10,72 1,65
7 days 1 GPa 0,38 0,15 - 62,29 0,46 1,09 21,48 14,15 1,52
4.5 GPa 0,25 0,19 - 67,48 0,40 0,86 18,77 12,06 1,56
Non-deformed 0,15 0,24 - 68,86 0,38 0,78 18,20 11,39 1,60
14 days 1 GPa 0,27 0,19 - 65,58 0,42 0,93 19,84 12,77 1,55
4.5 GPa 0,22 0,22 - 66,27 0,41 0,89 19,56 12,44 1,57
The molar ratio of Ca / P was calculated in Table 22. This molar ratio of Ca /
P was approximately 1.58. If the Ca/P is lower than 1.67, β-tricalcium phosphate
(TCP) and other phases, such as Tetracalcium phosphate (TTCP), will be present
with HA. On the other hand, to verify the mass gain by the formation of a
hydroxyapatite film, the samples were weighed, and their results are shown in
Figure 56.

Experimental results 113
Non
-def
orm
ed
1GPa;
3 tu
rns
4.5G
Pa; 3 tu
rns
0,0
0,4
0,8
1,2
1,6
2,0
2,4A
pa
tite
ma
ss
ga
in /m
g
1 day
Non
-def
orm
ed
1GPa;
3 tu
rns
4.5G
Pa; 3 tu
rns
0,0
0,4
0,8
1,2
1,6
2,0
2,4
Ap
ati
te m
as
s g
ain
/m
g
7 days
Non
-def
orm
ed
1GPa;
3 tu
rns
4.5G
Pa; 3 tu
rns
0,0
0,4
0,8
1,2
1,6
2,0
2,4
Ap
ati
te m
as
s g
ain
/m
g
14 days
Figure 56: The weight change for samples of Ti13Nb13Zr alloy chemically treated, by
H3PO4 etching and NaOH activation, non-deformed and deformed by HPT, subjected to
the bioactivity tests after 1, 7 and 14 days immersed in SBF.
It was observed that from the seventh day, all samples show a mass gain
due to the formation of an apatite film. At 14 days, the samples increase their
mass, which shows that there is an increase in the growth of this film.


Experimental results 115
6 EXPERIMENTAL RESULTS: Ti35Nb7Zr5Ta ALLOY
In this section, the results of Ti35Nb7Zr5Ta alloy in the conditions non-
deformed, deformed by HPT, and with different surface conditions will be
presented. The results about their microstructural characterization will be
presented first, then their electrochemical characterization and finally, the results
about bioactivity.
6.1 Microstructural and mechanical characterizations
In this section, the microstructural and mechanical characterization of
samples of Ti35Nb7Zr5Ta alloy non-deformed and deformed by HPT will be
presented.
6.1.1 Polished samples
Figure 57 shows XRD patterns of Ti35Nb7Zr5Ta alloy at the non-deformed
condition (ND) and deformed by HPT, conditions HPT1GPa, and HPT4.5GPa. The
indexation of XRD patterns reveals that, before deformation, the Ti35Nb7Zr5Ta
alloy is mostly composed by the BCC β (ISCD # 645545) phase with the presence
some residual HCP α (ICSD # 43416) phase, which practically vanishes after
mechanical processing, also probably due to solute redistribution during HPT. The
peak broadening observed after deformation, at both pressure conditions, points to
very high grain refinement in the Ti35Nb7Zr5Ta alloy.

Influence of surface treatments on corrosion resistance
properties of ultrafine grained Titanium alloys for implant applications 116
30 40 50 60 70 80 90
4.5GPa
1GPa
Inte
ns
ity
(a
.u.)
2 (degree)
Non-deformed
Figure 57: XRD patterns of Ti35Nb7Zr5Ta alloy in the conditions ND, HPT1GPa, and
HPT4.5GPa.
The microstructures of Ti-35Nb-7Zr alloy at (a) ND and deformed by HPT (b)
HPT GPa and (c) HPT4.5 GPa are shown in Figure 58.
Figure 58: Microstructures of Ti35Nb7Zr5Ta alloy at (a) the non-deformed condition, and
deformed by HPT (b) HPT1GPa and (c) HPT4.5GPa.
Figure 58(a) is an image obtained by confocal laser microscopy (CLM), and
it shows a single β phase with equiaxed grains after heating and quenching. This
result is coherent with the one presented in Figure 57 because the amount of the

Experimental results 117
residual hcp α phase appears to be very small when comparing peak intensities in
such a figure. After image analysis, the grain size was evaluated to be around 240
μm on average.
Figure 58(b) is an image obtained by CLM. This image corresponds to the
condition HPT1GPa and shows a grain refinement after being processed. The
grain size distribution was determined for the sample after processing by HPT, and
the average grain sizes measured was ~ 89 um.
Figure 58(c) present the equivalent TEM bright field image from the surface
of the as-received sample. This figure shows a very high grain refinement due to
HPT4.5GPa processing. Furthermore, it is possible to observe a non-
homogeneous distribution of grains/subgrains sizes as compared with Figure
58(a). The grain size distribution for the sample after processing by HPT was
determined, and the measured average grain size was ~112 nm.
Figure 59 presents hardness mappings for the Ti35Nb7Zr5Ta alloy in the
conditions ND, HPT1GPa, and HPT4.5GPa.
012345
012345
Radiu
s [m
m]
(HV)
Ti 35Nb 7Zr 5Ta (Non-deformed)
183,0
232,3
281,7
331,0
012345
012345
(HV)
Ti 35Nb 7Zr 5Ta (1GPa)
183,0
232,3
281,7
331,0
012345
012345
(HV)
Ti 35Nb 7Zr 5Ta (4.5GPa)
183,0
232,3
281,7
331,0
Figure 59: Hardness mappings for Ti35Nb7Zr5Ta alloy in the conditions ND, HPT1GPa,
and HPT4.5GPa.
As shown in Figure 59, the same behavior was observed as in the
Ti13Nb13Zr alloy, where the hardness increases with deformation and its values
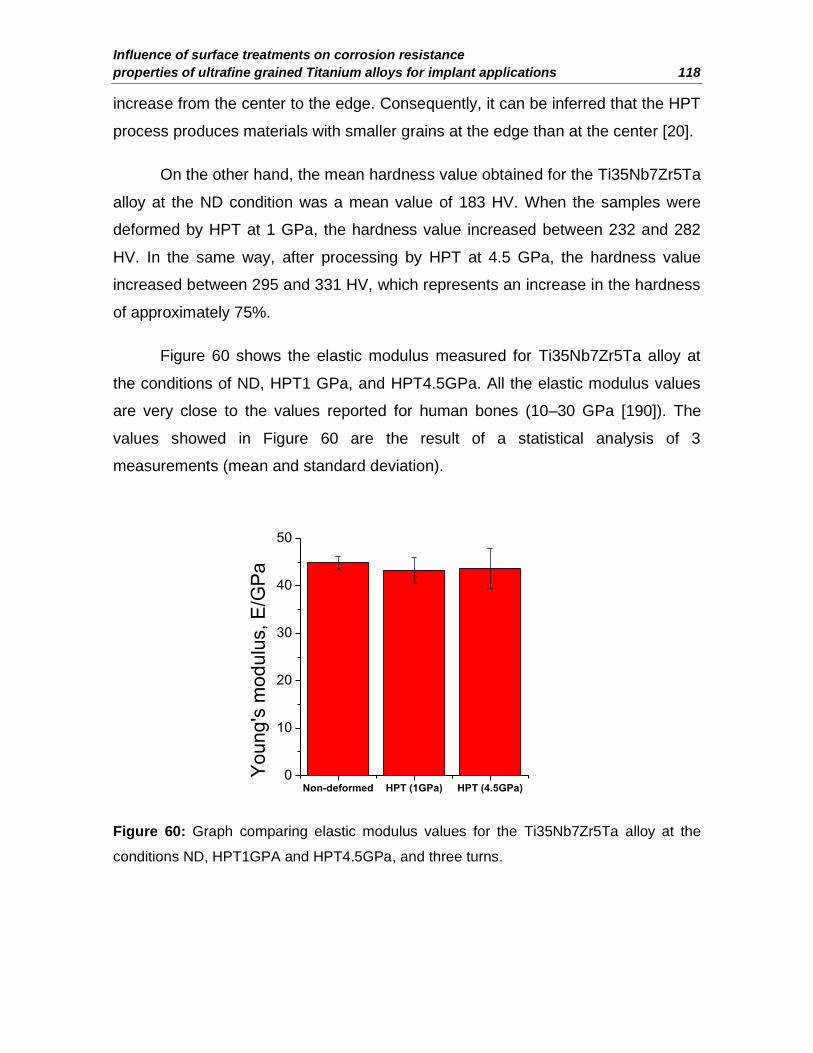
Influence of surface treatments on corrosion resistance
properties of ultrafine grained Titanium alloys for implant applications 118
increase from the center to the edge. Consequently, it can be inferred that the HPT
process produces materials with smaller grains at the edge than at the center [20].
On the other hand, the mean hardness value obtained for the Ti35Nb7Zr5Ta
alloy at the ND condition was a mean value of 183 HV. When the samples were
deformed by HPT at 1 GPa, the hardness value increased between 232 and 282
HV. In the same way, after processing by HPT at 4.5 GPa, the hardness value
increased between 295 and 331 HV, which represents an increase in the hardness
of approximately 75%.
Figure 60 shows the elastic modulus measured for Ti35Nb7Zr5Ta alloy at
the conditions of ND, HPT1 GPa, and HPT4.5GPa. All the elastic modulus values
are very close to the values reported for human bones (10–30 GPa [190]). The
values showed in Figure 60 are the result of a statistical analysis of 3
measurements (mean and standard deviation).
Non-deformed HPT (1GPa) HPT (4.5GPa)0
10
20
30
40
50
You
ng
's m
od
ulu
s, E
/GP
a
Figure 60: Graph comparing elastic modulus values for the Ti35Nb7Zr5Ta alloy at the
conditions ND, HPT1GPA and HPT4.5GPa, and three turns.
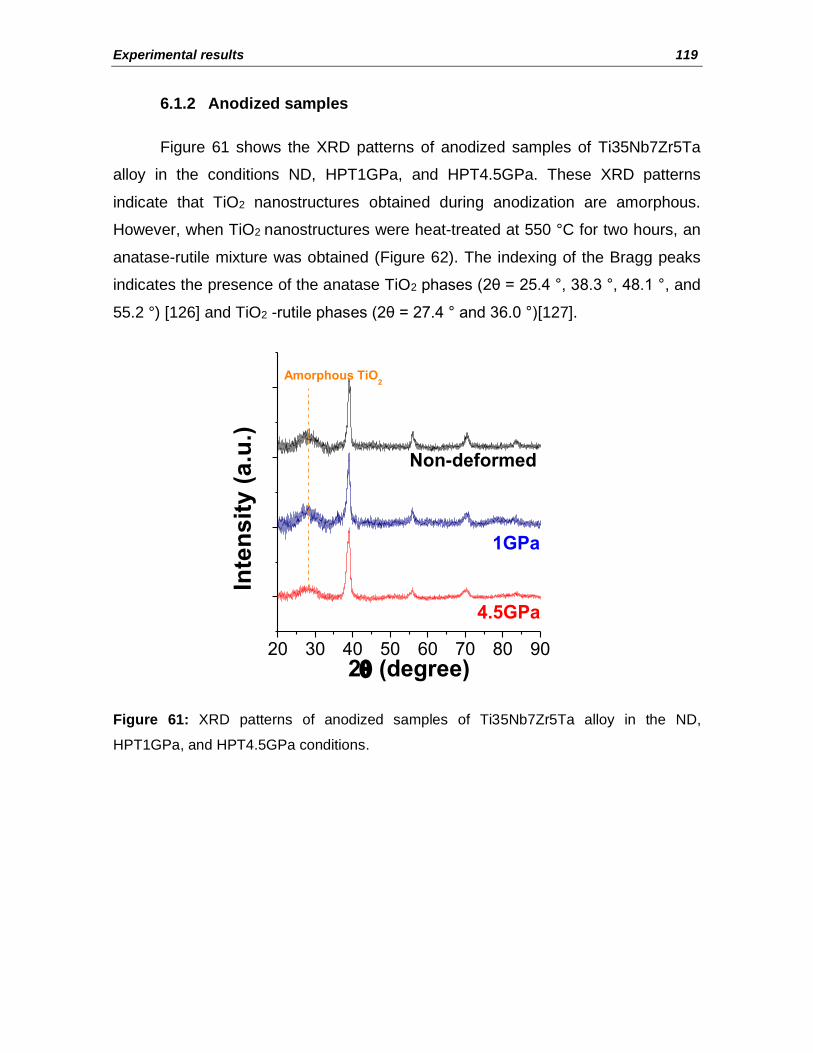
Experimental results 119
6.1.2 Anodized samples
Figure 61 shows the XRD patterns of anodized samples of Ti35Nb7Zr5Ta
alloy in the conditions ND, HPT1GPa, and HPT4.5GPa. These XRD patterns
indicate that TiO2 nanostructures obtained during anodization are amorphous.
However, when TiO2 nanostructures were heat-treated at 550 °C for two hours, an
anatase-rutile mixture was obtained (Figure 62). The indexing of the Bragg peaks
indicates the presence of the anatase TiO2 phases (2θ = 25.4 °, 38.3 °, 48.1 °, and
55.2 °) [126] and TiO2 -rutile phases (2θ = 27.4 ° and 36.0 °)[127].
20 30 40 50 60 70 80 90
4.5GPa
1GPa
Inte
nsit
y (
a.u
.)
2 (degree)
Non-deformed
Amorphous TiO2
Figure 61: XRD patterns of anodized samples of Ti35Nb7Zr5Ta alloy in the ND,
HPT1GPa, and HPT4.5GPa conditions.

Influence of surface treatments on corrosion resistance
properties of ultrafine grained Titanium alloys for implant applications 120
20 30 40 50 60 70 80 90
Non-deformed
1GPa
4.5GPa
• •
•
Inte
nsit
y (
a.u
.)
2 (degree)
• Ti Ti
TiO2 Anatase
TiO2 Rutile
•
Ti
Figure 62: XRD pattern of anodized and annealed samples of Ti35Nb7Zr5Ta alloy in the
ND, HPT1GPa, and HPT4.5GPa conditions. TiO2 nanostructures were annealed at 550 °C
in air.
TiO2 nanostructures morphologies were investigated by SEM. Figure 63
shows the top and lateral views of anodized and annealed samples of
Ti35Nb7Zr5Ta alloy (a and b) ND (c and d) HPT1GPa and (e and f) HPT4.5GPa.

Experimental results 121
Figure 63: SEM micrographs of anodized and annealed samples of Ti35Nb7Zr5Ta alloy at
non-deformed condition, (a) Top and (b) Lateral views, deformed by HPT at 1 GPa, (c)
Top and (d) Lateral views and deformed at 4.5 GPa, (e) Top and (f) Lateral views.
Figure 63(a) shows self-organized TiO2 nanoporous in the β phase of
Ti35Nb7Zr5Ta alloy in the ND condition. The lateral view of these nanostructures
(Figure 63(b)) shows self-organized arrays of nanoporous whose dimensions are
presented in Table 23.
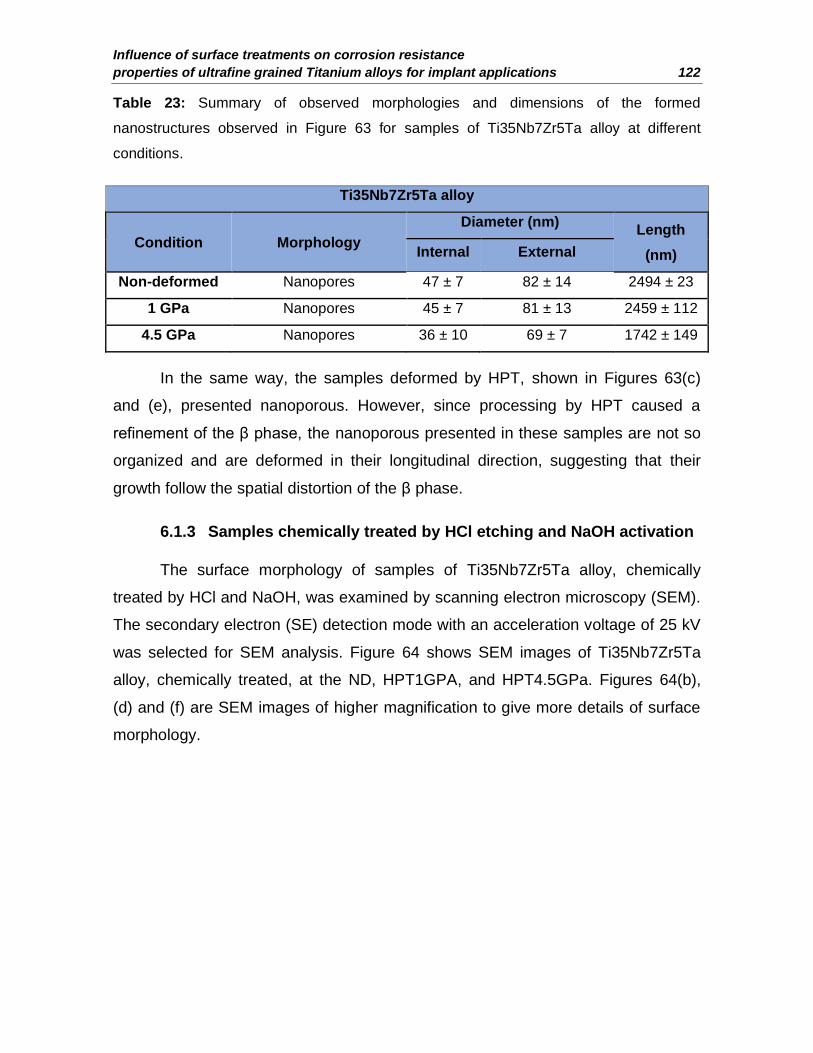
Influence of surface treatments on corrosion resistance
properties of ultrafine grained Titanium alloys for implant applications 122
Table 23: Summary of observed morphologies and dimensions of the formed
nanostructures observed in Figure 63 for samples of Ti35Nb7Zr5Ta alloy at different
conditions.
Ti35Nb7Zr5Ta alloy
Condition Morphology
Diameter (nm) Length
(nm) Internal External
Non-deformed Nanopores 47 ± 7 82 ± 14 2494 ± 23
1 GPa Nanopores 45 ± 7 81 ± 13 2459 ± 112
4.5 GPa Nanopores 36 ± 10 69 ± 7 1742 ± 149
In the same way, the samples deformed by HPT, shown in Figures 63(c)
and (e), presented nanoporous. However, since processing by HPT caused a
refinement of the β phase, the nanoporous presented in these samples are not so
organized and are deformed in their longitudinal direction, suggesting that their
growth follow the spatial distortion of the β phase.
6.1.3 Samples chemically treated by HCl etching and NaOH activation
The surface morphology of samples of Ti35Nb7Zr5Ta alloy, chemically
treated by HCl and NaOH, was examined by scanning electron microscopy (SEM).
The secondary electron (SE) detection mode with an acceleration voltage of 25 kV
was selected for SEM analysis. Figure 64 shows SEM images of Ti35Nb7Zr5Ta
alloy, chemically treated, at the ND, HPT1GPA, and HPT4.5GPa. Figures 64(b),
(d) and (f) are SEM images of higher magnification to give more details of surface
morphology.

Experimental results 123
Figure 64: SEM images of Ti35Nb7Zr5Ta alloy, chemically treated by HCl etching and
NaOH activation, (a and b) non-deformed condition, deformed by HPT at (c and d) 1 GPa
and deformed by HPT at (e and f) 4.5 GPa.
As one may observe in Figure 64, the chemical treatment (HCl etching and
NaOH activation) induced the formation of a nano topographic sponge-like
morphology on the samples' surface, and, as observed before, surfaces are whole
cracked. In order to obtain an analysis of the surface compositions of the samples,
EDS analysis was performed. The results are shown in Table 24.

Influence of surface treatments on corrosion resistance
properties of ultrafine grained Titanium alloys for implant applications 124
Table 24: Quantitative chemical EDS analysis of samples chemically treated by HCl and
NaOH.
Ti35Nb7Zr5Ta (at %)
Chemical element Non-deformed 1 GPa 4.5 GPa
O 59.82 55.89 56.02
Na 1.98 2.06 2.02
Zr 0.78 0.16 0.65
Nb 6.35 4.99 6.18
Ti 24.2 28.06 27.28
Cl 6.56 8.67 7.55
Ta 0.31 0.17 0.30
On the other hand, Raman spectroscopy was used to identify the crystalline
phases present on the surface of samples of Ti35Nb7Zr5Ta alloy chemically
treated. The results shown in Figure 65 indicate that sodium titanate, anatase, and
rutile are the main phases present in all the samples.
Figure 65: Raman spectra of the surface of Ti35Nb7Zr5Ta alloy chemically treated by HCl
etching and NaOH activation.

Experimental results 125
6.1.4 Samples chemically treated by H3PO4 etching and NaOH
activation
The surface morphology of samples of Ti35Nb7Zr5Ta alloy, chemically
treated by H3PO4 etched, and NaOH activated, was examined by scanning
electron microscopy (SEM). Figure 66 shows SEM images of chemically modified
surfaces of Ti35Nb7Zr5Ta alloy in the ND, HPT1GPA, and HPT4.5GPa conditions.
Figures 66(b), (d) and (f) are SEM images of higher magnification to give more
details about surface morphology.
In the same way, as samples treated with HCl, the treatment by H3PO4
etching and NaOH activation induced the formation of a nano topographic sponge-
like morphology on the samples' surface, with the presence of cracks on the
surface. Moreover, Raman results also indicate sodium titanate, anatase, and rutile
phases in the samples, see Figure 67. Table 25 presents the quantitative EDS
chemical analysis of samples chemically treated with H3PO4 followed by NaOH.

Influence of surface treatments on corrosion resistance
properties of ultrafine grained Titanium alloys for implant applications 126
Figure 66: SEM images of Ti35Nb7Zr5Ta alloy, chemically treated by H3PO4 etched and
NaOH activated, (a and b) non-deformed condition, deformed by HPT at (c and d) 1 GPa
and deformed by HPT at (e and f) 4.5 GPa.
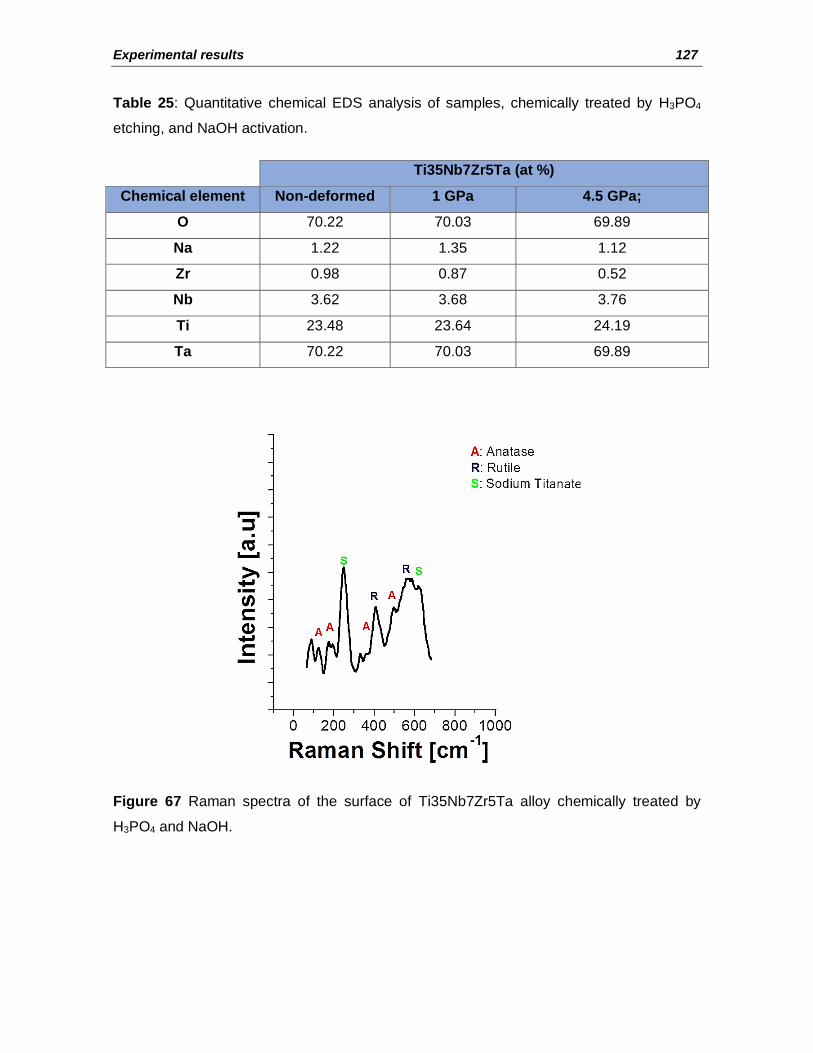
Experimental results 127
Table 25: Quantitative chemical EDS analysis of samples, chemically treated by H3PO4
etching, and NaOH activation.
Ti35Nb7Zr5Ta (at %)
Chemical element Non-deformed 1 GPa 4.5 GPa;
O 70.22 70.03 69.89
Na 1.22 1.35 1.12
Zr 0.98 0.87 0.52
Nb 3.62 3.68 3.76
Ti 23.48 23.64 24.19
Ta 70.22 70.03 69.89
Figure 67 Raman spectra of the surface of Ti35Nb7Zr5Ta alloy chemically treated by
H3PO4 and NaOH.

Influence of surface treatments on corrosion resistance
properties of ultrafine grained Titanium alloys for implant applications 128
6.2 Electrochemistry characterization
6.2.1 Polished samples
6.2.1.1 Open circuit potential (OCP) measures
Table 26 summarizes the values of open circuit potential (or corrosion
potential, Ecorr) recorded after one hour of immersion in simulated body fluid (SBF)
for Ti35Nb7Zr5Ta alloy, in the conditions ND, HPT1GPa and HPT4.5GPa. The
values are the result of a statistical analysis of 3 measurements (mean and
standard deviation).
Table 26: OCP measurements after 1-hour immersion in SBF at 37 °C of the polished
surfaces of Ti35Nb7Zr5Ta alloy in the conditions ND, HPT1GPa, and HPT4.5GPa
samples.
Condition OCP or Ecorr (mV vs. SCE)
Non-deformed -503 ± 50
1 GPa -379 ± 45
4.5 GPa -465 ± 56
A variation of open circuit potential is observed for deformed conditions. The
OCP of Ti13Nb13Zr alloy, at ND condition, was - 503 mV vs. SCE, while samples
with severe plastic deformation at 1 GPa and 4.5 GPa showed a slight increase, -
379 mV vs. SCE and - 465 mV vs. SCE, respectively. Therefore, regardless of the
crystal structure, it appears that severe plastic deformation causes an increase in
the corrosion potential compared to the samples non-deformed
6.2.1.2 Potentiodynamic polarization curves
Figure 68 shows the anodic polarization curves, recorded in SBF at 37 ºC,
for the polished samples of ND, HPT1GPa, and HPT4.5GPa samples. The
polarization curve for each sample represents a single measure, arbitrarily chosen
from a series of three measurements carried out under the same conditions.

Experimental results 129
-0,8 -0,4 0,0 0,4 0,810
-10
10-9
10-8
10-7
10-6
10-5
10-4
i (A
/ c
m2)
E vs SCE (V)
Non-deformed
1 GPa; 3 turns
4.5 GPa; 3 turns
Figure 68: Anodic polarization curves, recorded in SBF at 37 °C of the polished surfaces
of Ti35Nb7Zr5Ta alloy in the conditions ND, HPT1GPa, and HPT4.5GPa samples.
Current densities were calculated by dividing the current measured by the
geometric area (0.283 cm²). The current measured in the anode region is mainly
due to the oxidation reaction of the substrates to TiO2, which contributes to the
thickening of the passive layer. In this reaction, which takes place in the metal/
oxide interface, the area in which it happens is then equal to the geometric area.
The passivation current density (ipass) values, of Ti35Nb7Zr5Ta alloy non-
deformed and deformed by HPT at 1 GPa and 4.5 GPa, were graphically
established and summed up in Table 27. It shows the mean current density values
of three points at the current plateau in the polarization curves and their standard
deviations.

Influence of surface treatments on corrosion resistance
properties of ultrafine grained Titanium alloys for implant applications 130
Table 27: Passivation current density of the polished samples of Ti35Nb7Zr5Ta alloy in
the conditions ND, HPT1GPa, and HPT4.5GPa.
Conditions ipass (µA/cm2)
Non-deformed 3.52 ± 0.11
1 GPa 5.18 ± 0.31
4.5 GPa 6.03 ± 0.28
The passivation current density of the non-deformed Ti35Nb7Zr5Ta alloy
was 3.52 µA/cm2, while samples HPT1GPa and HPT4.5GPa showed a slight
increase, 5.18 µA/cm2, and 6.03 µA/cm2, respectively. Therefore, it appears that
the increase in the pressure from 1 GPa to 4.5 GPa causes an increase in the
passivation current Ti35Nb7Zr5Ta alloy.
6.2.1.3 Electrochemical impedance measurements (EIS)
Figure 69 shows the EIS graphs in the (a) Nyquist and (b) Bode
representation of the Ti35Nb7Zr5Ta alloy in the conditions ND, HPT1GPa, and
HPT4.5GPa.
The impedance spectra in Nyquist diagrams of Figure 69(a) show the typical
shape (arc) for a capacitive-resistive system (associations of capacitive
phenomena, accumulation of charges, and resistive phenomena, load transfers or
resistance of a layer). Moreover, it can be seen from Figure 69(a) that the
spectrum of ND samples has a higher amplitude, which indicates that SPD process
displays a slight effect on the formation of the protective layer in Ti35Nb7Zr5Ta
alloy. It can be explained by the inhomogeneous strain distribution induced by the
HPT [191], as well as by the increase in the dislocation density in deformed
samples. Therefore, inhomogeneous strain distribution can cause a selective
dissolution of specimens in zones of high strain, which tends to shift the corrosion
potential of the alloy to a more active value [191]. Additionally, increasing
dislocation density accelerates the release of atoms into electrolyte [133].

Experimental results 131
0,0 2,5x10⁴
5,0x10⁴
0,0
2,5x10⁴
5,0x10⁴
7,5x10⁴
-''(
c
m2
)
'( cm2)
Non-deformed
1GPa
4.5GPa
a)
10-3
10-2
10-1
100
101
102
103
104
105
10-1
100
101
102
103
104
105
Frequency (Hz)
Zm
od
(
. cm
2)
b)
-15
-30
-45
-60
-75
-90
Non-deformed
1GPa
4.5GPa
I Z I
Figure 69: EIS graphs in the Nyquist diagrams (a) and Bode diagrams (b) of the polished
samples of Ti35Nb7Zr5Ta alloy in the conditions ND, HPT1GPa, and HPT4.5GPa.
On the other hand, the effect of the SPD was more significant for samples
deformed at 4.5 GPa (spectrum with the lowest amplitude). This can be explained
by the fact that in this alloy deformed at 4.5 GPa, it could have more zones of high
strain, which are favorable to the dissolution of the passive layer.
The Bode diagrams, in Figure 69(b), show a capacitive behavior from
medium to low frequencies with phase angles approaching – 80°. It is typical of
passive materials [136]. Moreover, high values of |Z| at low frequencies, above 104
Ω·cm2, suggesting that the passive film formed offers high corrosion resistance.

Influence of surface treatments on corrosion resistance
properties of ultrafine grained Titanium alloys for implant applications 132
This behavior is consistent with the low passivation current determined in
polarization tests. On the other hand, from the Bode phase angle plot for all
samples, two plateaus can be identified.
In general, the results obtained from impedance measurement indicate that
all tested substrates behaved in a very similar way. The differences are rather
small, and this can be ascribed to the fact that the passive film formed on these
alloys is basically of the same nature.
6.2.2 Anodized samples
In this section, the effect of the SPD by HPT as well as TiO2 nanostructures
on the electrochemical properties of Ti35Nb7Zr5Ta alloy will be studied. The
samples anodized were annealed according to section 4.3.1.2.
6.2.2.1 Open circuit potential measures
Table 28 summarizes the values of Ecorr recorded after 1 hour of immersion
in SBF for anodized Ti35Nb7Zr5Ta alloy in the conditions ND, HPT 1GPa and
HPT4.5GPa. The values are the result of a statistical analysis of 3 measurements
(mean and standard deviation).
Table 28: OCP measurements, after 1-hour immersion in SBF at 37° C for the anodized
samples of Ti35Nb7Zr5Ta alloy in the conditions ND, HPT1GPa and HPT4.5GPa.
Condition OCP or Ecorr (mV vs. SCE)
Non-deformed -125 ± 25
1 GPa -88 ± 21
4.5 GPa -82 ± 30
The OCP of anodized Ti35Nb7Zr5Ta alloy, at the ND condition, was - 125
mV vs. SCE, while anodized samples deformed by HPT at 1 GPa and 4.5 GPa
showed an increase in their corrosion potential, - 88 mV vs. SCE and - 82 mV vs.

Experimental results 133
SCE, respectively. Therefore, samples of Ti35Nb7Zr5Ta alloy deformed and
anodized showed the noblest corrosion potential (the nobler and more stable
surface in SBF).
On the other hand, the Ecorr of the samples anodized showed a drastic
increase compared to samples without TiO2 nanostructures (Table 26), meaning
that electrochemical anodization of Ti35Nb7Zr5Ta alloy, non-deformed or
deformed by HPT, ennobled its surface.
6.2.2.2 Potentiodynamic polarization curves
Figure 70 shows the anodic polarization curves, recorded in SBF at 37 ºC,
of anodized samples of Ti35Nb7Zr5Ta alloy in the conditions ND, HPT1GPa, and
HPT4.5GPa.
-0,2 0,0 0,2 0,4 0,6 0,8 1,010
-10
10-9
10-8
10-7
10-6
10-5
10-4
i (A
/ c
m2)
E vs SCE (V)
Non-deformed
1GPa, 3turns
4.5GPa, 3turns
Figure 70: Anodic polarization curves, recorded in SBF at 37 °C for the anodized
Ti35Nb7Zr5Ta samples in the conditions ND, HPT1GPa, and HPT4.5GPa.
From Figure 70, it can be seen a current plateau in a wide range of
potentials, which corresponds to a limitation of the current by mass transport
through the oxide layer [25]. In fact, this behavior is characteristic of passive
materials. The ipass values, of anodized samples of Ti35Nb7Zr5Ta alloy non-

Influence of surface treatments on corrosion resistance
properties of ultrafine grained Titanium alloys for implant applications 134
deformed and deformed by HPT at 1 GPa and 4.5 GPa, were graphically
established and summed up in Table 29. It shows the mean current density values
of three points at the current plateau in the polarization curves and their standard
deviations.
Table 29: Passivation current density for the anodized Ti35Nb7Zr5Ta samples in the
conditions ND, HPT1GPa, and HPT4.5GPa.
Condition ipass (µA/cm2)
Non-deformed 0.16 ± 0.02
1 GPa 0.19 ± 0.05
4.5 GPa 0.52 ± 0.06
The passivation current density of anodized Ti35Nb7Zr5Ta alloy, non-
deformed, was 0.16 µA/cm2, while samples deformed by HPT at 1 GPa and 4.5
GPa showed a slight increase, 0.19 µA/cm2 and 0.52 µA/cm2, respectively.
Therefore, it appears that severe plastic deformation causes a slight increase in
the passivation current of anodized Ti35Nb7Zr5Ta alloy.
6.2.2.3 Electrochemical impedance measurements (EIS)
Figure 71 shows the EIS graphs in the (a) Nyquist and (b) Bode
representation of anodized samples of Ti35Nb7Zr5Ta alloy non-deformed and
deformed by HPT at 1 GPa and 4.5 GPa.
The impedance spectra in Nyquist diagrams of Figure 71(a) show a
pseudocapacitive shape (inclined straight). This behavior suggests that the
electron exchanges, and therefore, the reactions, are minimal or that the oxide
layer is very resistive [137]. Additionally, it can be seen from Figure 71(a) that the
amplitude of spectra is much higher than in non-anodized samples (Figure 69(a)).
It suggests that the nanoporous arrays on the samples improved the protection of
the surface in Ti35Nb7Zr5Ta alloy.

Experimental results 135
0,0 5,0x10⁴
0,0
5,0x10⁴
1,0x10⁵
1,5x10⁵
-''(
c
m2
)
'( cm2)
Non-deformed
1GPa
4.5GPa
a)
10-3
10-2
10-1
100
101
102
103
104
105
10-1
100
101
102
103
104
105
Frequency (Hz)
Zm
od
(
. cm
2)
b)
-10
-20
-30
-40
-50
-60
-70
-80
-90
Non-deformed
1GPa
I Z I
4.5GPa
Figure 71: Nyquist diagrams (a) and Bode diagrams (b) for the anodized Ti35Nb7Zr5Ta
samples in the conditions ND, HPT1GPa, and HPT4.5GPa.
On the other hand, the Nyquist spectra indicate that the amplitude of the
spectra of ND is higher than that of the deformed samples, this can be explained
by the lower dislocation density in samples without deformation.
The Bode diagrams, in Figure 71(b), show a capacitive behavior with the
maximum phase angles close to −80° and high values of |Z| above 105 Ω·cm2 in
the low frequencies region, suggesting that the passive film formed offers high

Influence of surface treatments on corrosion resistance
properties of ultrafine grained Titanium alloys for implant applications 136
corrosion resistance, which is consistent with the low passivation current
determined in polarization tests. On the other hand, from the Bode phase angle
plot for all samples, three plateaus can be identified.
6.2.3 Samples chemically treated by HCl etching and NaOH activation
In this section, the effect of the SPD by HPT as well as, surface modification
treatment by HCl etching and subsequent NaOH activation, on the electrochemical
properties of Ti35Nb7Zr5Ta alloy will be studied.
6.2.3.1 Open circuit potential measures
Table 30 summarizes the values of Ecorr for samples non-deformed and
deformed by HPT as well as chemically treated by HCl etching and NaOH
activation. The values are the result of a statistical analysis of 3 measurements
(mean and standard deviation).
Table 30: OCP measurements, after 1-hour immersion in SBF at 37° C of samples of
Ti35Nb7Zr5Ta alloy chemically treated by HCl and NaOH in the conditions ND, HPT1GPa
and HPT4.5GPa.
Condition Corrosion potential (mV vs SCE)
Non-deformed -388 ± 47
1 GPa -232 ± 28
4.5 GPa -137 ± 16
The OCP of Ti35Nb7Zr5Ta alloy chemically treated by HCl and NaOH, ND,
was - 388 mV vs. SCE, while anodized samples deformed by HPT at 1 GPa and
4.5 GPa showed an increase in their corrosion potential, - 232 mV vs. SCE and -
137 mV vs. SCE, respectively. Therefore, samples of Ti35Nb7Zr5Ta alloy
deformed and anodized showed the noblest corrosion potential.
On the other hand, the Ecorr of chemically treated samples also showed an
increase compared to polished samples (Table 26), indicating that the chemical

Experimental results 137
treatment by HCl etching and NaOH activation turns nobler and more stable the
surface of Ti35Nb7Zr5Ta alloy.
6.2.3.2 Potentiodynamic polarization curves
Figure 72 shows the anodic polarization curves for samples non-deformed
and deformed as well as chemically treated by HCl and NaOH.
-0,6 -0,4 -0,2 0,0 0,2 0,4 0,6 0,810
-10
10-9
10-8
10-7
10-6
10-5
10-4
i (A
/ c
m2)
E vs SCE (V)
Non-deformed
1GPa, 3turns
4.5GPa, 3turns
Figure 72: Anodic polarization curves, recorded in SBF at 37 °C for samples of
Ti35Nb7Zr5Ta alloy chemically treated by HCl and NaOH in the conditions ND, HPT1GPa,
and HPT4.5GPa.
From Figure 72, it can be seen that the behavior of the samples chemically
treated by HCl and NaOH, in a physiological environment is characteristic of a
passive state. The ipass values of samples chemically treated by HCl and NaOH
were graphically established and summed up in Table 31. It shows the mean
current density values of three points at the current plateau in the polarization
curves and their standard deviations.

Influence of surface treatments on corrosion resistance
properties of ultrafine grained Titanium alloys for implant applications 138
Table 31: Passivation current density of samples of Ti35Nb7Zr5Ta alloy chemically treated
by HCl and NaOH in the conditions ND, HPT1GPa, and HPT4.5GPa.
Condition ipass (µA/cm2)
Non-deformed 4.58 ± 0.41
1 GPa 7.20 ± 0.20
4.5 GPa 5.21 ± 0.16
The passivation current of samples chemically treated by HCl etching and
NaOH activation, non-deformed, was 4.58 µA/cm2, while samples deformed by
HPT at 1 GPa and 4.5 GPa showed a slight increase, 7.20 µA/cm2 and 5.21
µA/cm2, respectively. Therefore, it appears that severe plastic deformation causes
a slight increase in the passivation current of the chemically treated Ti35Nb7Zr5Ta
samples.
6.2.3.3 Electrochemical impedance measurements (EIS)
Figure 73 shows the EIS graphs in the (a) Nyquist and (b) Bode
representation of samples of Ti35Nb7Zr5Ta alloy chemically treated by HCl and
NaOH.
The impedance spectra in Nyquist diagrams of Figure 73(a) show a typical
behavior of a capacitive-resistive system that indicates corrosion protection. Also,
these Nyquist diagrams indicate that the amplitude of the spectra of ND is higher
than that of the deformed samples, which means that the ND samples show better
corrosion resistance. This can be explained because the resistance of the passive
film is more affected in samples with more grain boundaries such as those
deformed at 4.5 GPa. These results are likely to be related to a more active
dissolution of the passive film at the surface near the grain boundaries [140].

Experimental results 139
0,0 5,0x10⁴
1,0x10⁵
0,0
5,0x10⁴
1,0x10⁵
1,5x10⁵
-''(
c
m2
)
'( cm2)
Non-deformed
1GPa
4.5GPa
a)
10-3
10-2
10-1
100
101
102
103
104
105
10-1
100
101
102
103
104
105
Frequency (Hz)
Zm
od
(
. cm
2)
b)
-10
-20
-30
-40
-50
-60
-70
-80
-90
Non-deformed
1GPa
I Z I
4.5GPa
Figure 73: Nyquist diagrams (a) and Bode diagrams (b) for samples of Ti35Nb7Zr5Ta
alloy chemically treated by HCl and NaOH in the conditions ND, HPT1GPa, and
HPT4.5GPa.
On the other hand, the Bode diagrams, in Figure 73(b), show a capacitive
behavior with the maximum phase angles close to −80° and high values of |Z|
above 104 Ω·cm2 in the low frequencies region, suggesting that the passive film
formed offers high corrosion resistance. From the Bode phase angle plot for all
samples, three plateaus can be identified.

Influence of surface treatments on corrosion resistance
properties of ultrafine grained Titanium alloys for implant applications 140
6.2.4 Samples chemically treated by H3PO4 etching and NaOH
activation
In this section, the effect of the SPD by HPT as well as, surface modification
treatment by H3PO4 etching and subsequent NaOH activation, on the
electrochemical properties of Ti35Nb7Zr5Ta alloy will be studied.
6.2.4.1 Open circuit potential measures
Table 32 summarizes the values of Ecorr for samples non-deformed and
deformed by HPT as well as chemically treated by H3PO4 and NaOH. The values
are the result of a statistical analysis of 3 measurements (mean and standard
deviation).
Table 32: OCP measurements, after 1-hour immersion in SBF at 37° C of samples of
Ti35Nb7Zr5Ta alloy chemically treated by H3PO4 and NaOH in the conditions ND,
HPT1GPa and HPT4.5GPa.
Condition Corrosion potential (mV vs SCE)
Non-deformed -421 ± 51
1 GPa -406 ± 49
4.5 GPa -211± 35
The OCP of Ti35Nb7Zr5Ta alloy chemically treated by H3PO4 and NaOH,
non-deformed, was - 421 mV vs. SCE, while the corrosion potentials for samples
deformed at 1 GPa and 4.5 GPa were -406 mV vs. SCE and -211 mV vs. SCE,
respectively. Therefore, it appears that the corrosion potential is nobler for
substrates chemically treated, by H3PO4 etching and NaOH activation, when they
were previously deformed (for high pressures).
6.2.4.2 Potentiodynamic polarization curves
Figure 74 shows the anodic polarization curves for samples non-deformed
and deformed as well as chemically treated by H3PO4 and NaOH.

Experimental results 141
-0,6 -0,4 -0,2 0,0 0,2 0,4 0,6 0,810
-10
10-9
10-8
10-7
10-6
10-5
10-4
i (A
/ c
m2)
E vs SCE (V)
Non-deformed
1GPa, 3turns
4.5GPa, 3turns
Figure 74: Anodic polarization curves, recorded in SBF at 37 °C for samples of
Ti35Nb7Zr5Ta alloy chemically treated by H3PO4 and NaOH in the conditions ND,
HPT1GPa, and HPT4.5GPa.
The polarization curves show, for potentials higher than Ecorr, a wide active
region of at least 400 mV. These results suggest that the chemical treatment, by
H3PO4 etching and NaOH activation impairs the passivation of the Ti35Nb7Zr5Ta
alloy.
The ipass values of samples chemically treated, by H3PO4 etching and NaOH
activation, were graphically established and summed up in Table 33. It shows the
mean current density values of three points at the current plateau in the
polarization curves and their standard deviations.

Influence of surface treatments on corrosion resistance
properties of ultrafine grained Titanium alloys for implant applications 142
Table 33: Passivation current density of samples of Ti35Nb7Zr5Ta alloy chemically treated
by H3PO4 and NaOH in the conditions ND, HPT1GPa, and HPT4.5GPa.
Condition ipass (µA/cm2)
Non-deformed 8.24 ± 0.53
1 GPa 10.8 ± 0.52
4.5 GPa 10.8 ± 0.20
The passivation current of samples chemically treated by H3PO4 and NaOH,
non-deformed, was 8.24 µA/cm2, while samples deformed by HPT at 1 GPa and
4.5 GPa showed a slight increase, 10.8 µA/cm2, and 10.8 µA/cm2, respectively.
Therefore, it appears that severe plastic deformation causes a slight increase in
the passivation current compared to Ti35Nb7Zr5Ta alloy non-deformed.
On the other hand, the ipass of the samples chemically treated by H3PO4
etching and NaOH activation showed an increase of ipass compared with samples
without chemical treatment (Table 27).
6.2.4.3 Electrochemical impedance measurements (EIS)
Figure 75 shows the EIS graphs in the (a) Nyquist and (b) Bode
representation of samples of Ti35Nb7Zr5Ta alloy chemically treated by H3PO4 and
NaOH.
The same behavior is observed as the samples with acid etching with HCl,
where the Nyquist diagrams in Figure 75(a) indicate that the ND samples show
better resistance to corrosion.
The substrates show capacitive-like behavior with the maximum phase
angles close to −80° and high values of |Z| above 104 Ω·cm2 in the region of low
frequencies, concerning the Bode plots (Figure 75(b)), suggesting that the passive
films formed to offer high corrosion resistance. On the other hand, samples with
severe plastic deformation have a lower value of |Z|, which indicates that the

Experimental results 143
treatment of the chemical modification plus the deformation decreases the
resistance to corrosion. From Bode phase angle plot for all samples, three plateaus
can be identified.
0,0 5,0x10⁴
1,0x10⁵
0,0
5,0x10⁴
1,0x10⁵
1,5x10⁵
-''(
c
m2
)
'( cm2)
Non-deformed
1GPa
4.5GPa
a)
10-3
10-2
10-1
100
101
102
103
104
105
10-1
100
101
102
103
104
105
Frequency (Hz)
Zm
od
(
cm
2)
b)
-10
-20
-30
-40
-50
-60
-70
-80
-90
Non-deformed
1GPa
I Z I
4.5GPa
Figure 75: Nyquist diagrams (a) and Bode diagrams (b) for samples of Ti35Nb7Zr5Ta
alloy chemically treated by H3PO4 and NaOH in the conditions ND, HPT1GPa, and
HPT4.5GPa.

Influence of surface treatments on corrosion resistance
properties of ultrafine grained Titanium alloys for implant applications 144
6.3 Modeling of impedance spectra for samples of Ti35Nb7Zr5Ta
alloy
This section is focused on modeling the electrochemical impedance
spectrums by equivalent electrical circuits (EEC) and by transmission line model.
6.3.1 EEC proposed for polished samples
The physical and equivalent circuit model, previously used for polished
samples of Ti13Nb13Zr shown in Figure 40, were also chosen to describe the
electrochemical behavior of polished samples of Ti35Nb7Zr5Ta alloy immersed in
SBF.
This physical model represents a two-layer structure composed of a dense
inner layer and a porous outer layer on the surface Ti35Nb7Zr5Ta alloy. It can be
represented by the following EEC [142],
Rs + Qa / (Ra+ (Qdl / Rct)
where Rs is the electrolyte resistance, Ra is the resistance of the porous outer
layer, Qa is the constant-phase element for the porous layer, Rct represents the
resistance of charge-transfer and Qdl is the constant-phase element for the double
layer at the dense inner layer-electrolyte interface.
The fitting of EIS data as Nyquist representations is shown in Figure 76. The
error between experimental and simulated data was around 0.27%, indicating that
data adjusted well to the proposed equivalent circuit.

Experimental results 145
0,0 2,0x10⁴
4,0x10⁴
0,0
1,0x10⁴
2,0x10⁴
3,0x10⁴
4,0x10⁴
5,0x10⁴
'( cm2)
Error (%) =0,28-
''(
c
m2)
Non-deformed
Fitting
0,0 2,0x10⁴
4,0x10⁴
0,0
1,4x10⁴
2,7x10⁴
4,0x10⁴
5,4x10⁴
-''(
c
m2)
'( cm2)
Error (%) =0,25
1 GPa
Fitting
0,0 1,5x10⁴
3,0x10⁴
0,0
1,0x10⁴
2,0x10⁴
3,0x10⁴
4,0x10⁴
-''(
c
m2)
'( cm2)
Error (%) =0,27
4.5 GPa
Fitting
Figure 76: Nyquist diagrams of experimental data and simulated curves obtained by the
Simad software for the polished surfaces of Ti35Nb7Zr5Ta alloy at ND, HPT1GPa, and
HPT4.5GPa conditions.
The equivalent circuit parameters obtained when fitting EIS data of polished
samples of Ti35Nb7Zr5Ta alloy (see section 6.2.1.3, Figure 69) at the ND,
HPT1GPA, and HPT4.5GPa conditions, are shown in Table 34. Additionally, the
equation derived by Brug et al. Eq. (20) was used to calculate the effective
capacitance associated with each CPE (Ceff(a) and Ceff(dl)). These capacitance
values are also shown in Table 34.

Influence of surface treatments on corrosion resistance
properties of ultrafine grained Titanium alloys for implant applications 146
Table 34: Equivalent circuit parameters and effective capacitance associated with the
CPEs obtained when fitting EIS data of polished samples of Ti35Nb7Zr5Ta alloy
according to the model in Figure 40.
Condition Rs Qa
αa Ra Ceff(a) Qdl
µF ·s(αdl-1) αdl Rct Ceff(dl)
Ω·cm2 µF ·s(αa-1) Ω·cm2 µF/cm2 Ω·cm2 µF/cm2
Non-deformed 20 10 0.91 77 17 23 0.93 1.1E+05 49
1 GPa 21 10 0.89 129 15 22 0.91 1.7E+05 40
4.5 GPa 21 9 0.89 186 12 28 0.89 1.1E+05 44
It can be seen from the data in Table 34, high Rct values, as well as low Qa
and Qdl values. These results suggest a high corrosion resistance in the electrolyte
used, and are indicative of a stable passive oxide film present on the surface of the
polished samples of Ti35Nb7Zr5Ta alloy, non-deformed and deformed by HPT.
Moreover, the α values were close to 0.9, which suggest that the passive film
formed displays a near capacitive behavior.
On the other hand, the capacitance values for the double layer (Ceff(dl)) were
between 40 to 49 μF·cm- 2 (see Table 34). These values are in the typical range,
10-40 μF·cm- 2. The capacitance values for the porous layer (Ceff(a)) were lower
than (Ceff(dl)), between 12 to 17 μF·cm- 2.
The film thickness, δ (in nm), were obtained from the dense inner layer
capacitance. The thickness values were of 1.52, 1.90 and 1.70 nm for
Ti35Nb7Zr5Ta alloy, at ND, HPT1GPa and HPT4.5GPa conditions, respectively.
These results show that the passive films the deformation by HPT of
Ti35Nb7Zr5Ta alloy contributes to increasing the passive film thickness.
The results obtained by fitting EIS data indicate that Ti35Nb7Zr5Ta alloy,
non-deformed, and deformed by HPT, behaved in a very similar way. The
differences are rather small, and this can be ascribed to the fact that the passive
film formed on these alloys is primarily of the same nature.

Experimental results 147
6.3.2 EEC proposed for anodized samples
The transmission lines model used for the anodized samples of the
Ti13Nb13Zr alloy was also chosen to describe the electrochemical behavior of
anodized samples of Ti35Nb7Zr5Ta alloy, soaked in SBF. The model used is the
following:
𝑍 = 𝑅𝑠 + 1
𝑥1 + 𝑥2[𝜆(𝑥1 + 𝑥2)𝑆𝜆 + (𝑍𝐴 + 𝑍𝐵)𝐶𝜆 +
1
𝜆(𝑥1 + 𝑥2)𝑍𝐴𝑍𝐵𝑆𝜆]
−1
× (𝐿𝜆𝑥1𝑥2(𝑥1 + 𝑥2)𝑆𝜆 + 𝑥1[𝜆𝑥1𝑆𝜆 + 𝐿𝑥2𝐶𝜆]𝑍𝐴 + 𝑥2[𝜆𝑥2𝑆𝜆 + 𝐿𝑥1𝐶𝜆]𝑍𝐵
+1
𝑥1 + 𝑥2 × [2𝑥1𝑥2 + (𝑥1
2 + 𝑥22)𝐶𝜆 +
𝐿
𝜆𝑥1𝑥2𝑆𝜆] 𝑍𝐴𝑍𝐵)
Where the notations 𝑥1 = 𝑟1 + 𝑍𝑤 , 𝑥2 = 𝑟2 , 𝐶𝜆 = 𝑐𝑜𝑠ℎ (𝐿
𝜆) , 𝑆𝜆 = 𝑠𝑖𝑛ℎ (
𝐿
𝜆)
, 𝑍𝐴 = 𝑅𝐴 , 𝑍𝐵 =1
𝑄𝐵(𝑖𝜔)−𝑛 , 𝜉 =
𝑟3
1+𝑟3𝑞3(𝑖𝜔)𝛽, and 𝜆 = [𝜉/(𝑥1 + 𝑥2 )]1/2 have been
used. Figure 44 outlines the transmission line model used.
The fitting of EIS data as Nyquist representations is shown in Figure 77. The
errors measured for the experimental and simulated data were 0.69% for the non-
deformed sample and 3.10% for the 4.5 GPa deformed sample, which is quite
reasonable.

Influence of surface treatments on corrosion resistance
properties of ultrafine grained Titanium alloys for implant applications 148
0,0 4,0x10⁴
0,0
4,0x10⁴
8,0x10⁴
1,2x10⁵
'( cm2
)
-''(
c
m2
)Error (%) =0,69
Non-deformed
Fitting
0,0 4,0x10⁴
0,0
4,0x10⁴
8,0x10⁴
1,2x10⁵
-''(
c
m2
)
'( cm2
)
Error (%) =1,81
1 GPa
Fitting
0,0 3,0x10⁴
0,0
3,0x10⁴
6,0x10⁴
9,0x10⁴
-''(
c
m2
)
'( cm2
)
Error (%) =3.10
4.5 GPa
Fitting
Figure 77: Nyquist diagrams of experimental data and simulated curves obtained by the
Simad software for the anodized samples of Ti35Nb7Zr5Ta alloy at ND, HPT1GPa, and
HPT4.5GPa conditions.
The equivalent circuit parameters obtained when fitting EIS data of anodized
samples of Ti35Nb7Zr5Ta alloy (see section 6.2.2.3, Figure 71), at ND, HPT1GPa
and HPT4.5GPa conditions, are shown in Table 35. Further, the effective
capacitance was calculated by the equation derived from Hsu-Mansfeld et al. The
capacitance values are also given in Table 35.
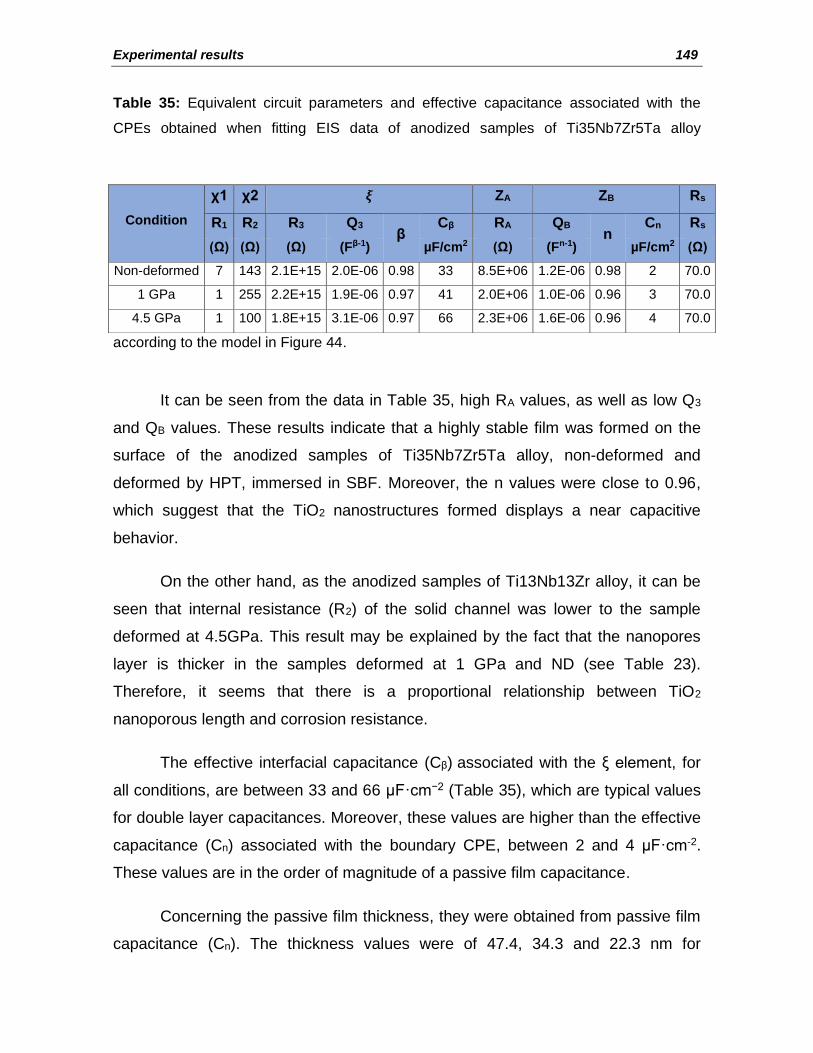
Experimental results 149
Table 35: Equivalent circuit parameters and effective capacitance associated with the
CPEs obtained when fitting EIS data of anodized samples of Ti35Nb7Zr5Ta alloy
according to the model in Figure 44.
It can be seen from the data in Table 35, high RA values, as well as low Q3
and QB values. These results indicate that a highly stable film was formed on the
surface of the anodized samples of Ti35Nb7Zr5Ta alloy, non-deformed and
deformed by HPT, immersed in SBF. Moreover, the n values were close to 0.96,
which suggest that the TiO2 nanostructures formed displays a near capacitive
behavior.
On the other hand, as the anodized samples of Ti13Nb13Zr alloy, it can be
seen that internal resistance (R2) of the solid channel was lower to the sample
deformed at 4.5GPa. This result may be explained by the fact that the nanopores
layer is thicker in the samples deformed at 1 GPa and ND (see Table 23).
Therefore, it seems that there is a proportional relationship between TiO2
nanoporous length and corrosion resistance.
The effective interfacial capacitance (Cβ) associated with the ξ element, for
all conditions, are between 33 and 66 μF·cm−2 (Table 35), which are typical values
for double layer capacitances. Moreover, these values are higher than the effective
capacitance (Cn) associated with the boundary CPE, between 2 and 4 μF·cm-2.
These values are in the order of magnitude of a passive film capacitance.
Concerning the passive film thickness, they were obtained from passive film
capacitance (Cn). The thickness values were of 47.4, 34.3 and 22.3 nm for
Condition
χ1 χ2 𝝃 ZA ZB Rs
R1 R2 R3 Q3 β
Cβ RA QB n
Cn Rs
(Ω) (Ω) (Ω) (Fβ-1) µF/cm2 (Ω) (Fn-1) µF/cm2 (Ω)
Non-deformed 7 143 2.1E+15 2.0E-06 0.98 33 8.5E+06 1.2E-06 0.98 2 70.0
1 GPa 1 255 2.2E+15 1.9E-06 0.97 41 2.0E+06 1.0E-06 0.96 3 70.0
4.5 GPa 1 100 1.8E+15 3.1E-06 0.97 66 2.3E+06 1.6E-06 0.96 4 70.0

Influence of surface treatments on corrosion resistance
properties of ultrafine grained Titanium alloys for implant applications 150
Ti35Nb7Zr5Ta alloy, at ND, HPT1GPa and HPT4.5GPa conditions, respectively.
These results show that the anodization of Ti35Nb7Zr5Ta alloy contributes to
increasing the passive film thickness. The passive film thickness, as well as the
length of the nanostructures, are affected by the deformation by HPT.
Finally, the experimental EIS data obtained for the anodized Ti35Nb7Zr5Ta
alloy were satisfactory fitting by the model proposed in Figure 44. Therefore, the
physical behavior of the system was well described by this transmission line model.
6.3.3 EEC proposed for samples chemically treated by HCl etching
and NaOH activation
The electrochemical behavior of samples of Ti35Nb7Zr5Ta alloy, chemically
treated, by HCl etching and NaOH activation, was also described by the EEC show
in Figure 47, for samples with three different layers, consisting of a compact inner
layer of titanium dioxide (TiO2), an intermediate TiO2 layer and an outer layer of
sodium titanate (Na2Ti5O11).
The EIS data were fitted using the following EEC:
Rs + (Qb / Rb) + Qa / (Ra+ (Qdl / Rct)),
where Rs represents the electrolyte resistance, Rb represents the resistance of the
outer layer, Qb is the constant-phase element for the outer layer, Ra is the
resistance of the intermediate layer, Qa is the constant-phase element for the
intermediate layer, Rct represents the resistance of charge-transfer, Qdl is the
constant-phase element for the double layer at the dense inner layer-electrolyte
interface.
The fitting of EIS data as Nyquist representations is shown in Figure 78. The
errors measured for the experimental and simulated data were 1.28% for the non-
deformed sample and 3.95% for the 4.5 GPa deformed sample, which is quite
reasonable.

Experimental results 151
0,0 3,5x10⁴
7,0x10⁴
0,0
3,0x10⁴
6,0x10⁴
9,0x10⁴
Error (%) =1,28-
''(
c
m2)
'( cm2)
Non-deformed
Fitting
0,0 3,5x10⁴
7,0x10⁴
0,0
2,0x10⁴
4,0x10⁴
6,0x10⁴
8,0x10⁴
Error (%) =0,86
-''(
c
m2)
'( cm2)
1 GPa
Fitting
0,0 2,5x10⁴
5,0x10⁴
0,0
2,5x10⁴
5,0x10⁴
Error (%) =3,95
-''(
c
m2)
'( cm2)
4.5 GPa
Fitting
Figure 78: Nyquist diagrams of experimental data and simulated curves obtained by the
Simad software for samples of Ti35Nb7Zr5Ta alloy chemically treated by HCl and NaOH
at ND, HPT1GPa, and HPT4.5GPa conditions.
The equivalent circuit parameters obtained when fitting EIS data of samples
of Ti35Nb7Zr5Ta alloy chemically treated by HCl and NaOH, are shown in Table
36. Further, the effective capacitance associated with the CPE was calculated with
the equation derived by Brug et al. (Eq.20). These capacitance values are given in
Table 36.

Influence of surface treatments on corrosion resistance
properties of ultrafine grained Titanium alloys for implant applications 152
Table 36: Equivalent circuit parameters and the effective capacitance associated with the
CPEs obtained when fitting EIS data of samples of Ti35Nb7Zr5Ta alloy chemically treated
by HCl and NaOH, according to the EEC in Figure 47.
Condition
Element Non-deformed 1 GPa 4.5 GPa
Rs (Ω·cm2) 21 20 20
Qb (µF ·s(αb-1)) 42 40 40
αb 0.72 0.72 0.72
Rb (Ω·cm2) 10 9 3
Ceff(b) (µF/cm2) 1.8 1.6 1.1
Qa (µF ·s(αa-1)) 19 33 47
αa 0.70 0.71 0.80
Ra (Ω·cm2) 1 1 24
Ceff(a) (µF/cm2) 0.2 0.5 7.3
Qdl (µF ·s(αdl-1)) 32 17 12
αdl 0.93 0.93 0.98
Rct (Ω·cm2) 3.3E+05 2.7E+05 8.4E+04
Ceff(dl) (µF/cm2) 18 10 10
It can be seen from data in Table 36 that the αdl value was higher than 0.92,
which suggest that the samples chemically treated displays a near capacitive
behavior. Also, as samples chemically treated of the Ti35Nb7Zr5Ta alloy, the
values of αb and αa were between 0.70 and 0.80, which was caused by interfacial
heterogeneity.
On the other hand, the capacitance values for (Ceff(dl)) were between 10 to
18 μF·cm- 2 (see Table 36). These values are in the typical range 10-40 μF·cm- 2.
The capacitance values for the porous outer layer (Ceff(b)) and intermediate porous
layer (Ceff(a)) were lower than Ceff(dl).
The passive film thickness, δ (in nm), were also obtained from passive film
capacitance. The values of the thickness were of 4.07, 7.87 and 7.43 nm for
chemically treated Ti35Nb7Zr5Ta alloy, at ND, HPT1GPa and HPT4.5GPa

Experimental results 153
conditions, respectively. These results show that the chemical treatment and the
deformation by HPT contribute to increasing the passive films thickness.
6.3.4 EEC proposed for samples chemically treated by H3PO4 etching
and NaOH activation
The equivalent circuit shown in Figure 47 was also used to fitting the EIS
data of samples of Ti35Nb7Zr5Ta alloy chemically treated by H3PO4 and NaOH.
The fitting of EIS data as Nyquist representations is shown in Figure 79. The errors
measured for the experimental and simulated data were 2.14% for the non-
deformed sample and 3.88% for the 4.5 GPa deformed sample, indicating that data
adjusted well to the proposed equivalent circuit.
0,0 4,5x10⁴
9,0x10⁴
0,0
3,0x10⁴
6,0x10⁴
9,0x10⁴
Error (%) =2,14
-''(
c
m2)
'( cm2)
Non-deformed
Fitting
0,0 2,0x10⁴
4,0x10⁴
0,0
1,0x10⁴
2,0x10⁴
3,0x10⁴
4,0x10⁴
Error (%) =3,78
-''(
c
m2)
'( cm2)
1 GPa
Fitting
0,0 1,8x10⁴
3,6x10⁴
0,0
1,1x10⁴
2,1x10⁴ Error (%) =3,88
-''(
c
m2)
'( cm2)
4.5 GPa
Fitting
Figure 79: Nyquist diagrams of experimental data and simulated curves obtained by the
Simad software for samples of Ti35Nb7Zr5Ta alloy chemically treated by H3PO4 and
NaOH at ND, HPT1GPa, and HPT4.5GPa conditions.

Influence of surface treatments on corrosion resistance
properties of ultrafine grained Titanium alloys for implant applications 154
The equivalent circuit parameters and effective capacitance (calculated by
an equation derived by Brug et al.) associated with the CPEs obtained are shown
in Table 37.
Table 37: Equivalent circuit parameters and the effective capacitance associated with the
CPEs obtained when fitting EIS data of samples of Ti35Nb7Zr5Ta alloy chemically treated
by H3PO4 and NaOH, according to the EEC in Figure 47.
Condition
Element Non-deformed 1 GPa 4.5 GPa
Rs (Ω·cm2) 20 20 20
Qb (µF ·s(αb-1)) 40 53 15
αb 0.73 0.70 0.80
Rb (Ω·cm2) 9 7 4
Ceff(b) (µF/cm2) 1.8 1.6 1.3
Qa (µF ·s(αa-1)) 6 6 37
αa 0.72 0.78 0.84
Ra (Ω·cm2) 3 1 10
Ceff(a) (µF/cm2) 0.1 4.3 7.5
Qdl (µF ·s(αdl-1)) 47 54 54
αdl 0.88 0.80 0.80
Rct (Ω·cm2) 2.2E+05 1.0E+05 2.5E+04
Ceff(dl) (µF/cm2) 19 10 10
It can be seen from the data in Table 37 that the αdl values were between
0.80 and 0.88, which suggest that the samples chemically treated displays a near
capacitive behavior. The same behavior was observed as all the samples with
chemical treatment, where the values of αb and αa were between 0.70 and 0.84,
which was a consequence of an interfacial heterogeneity of the outer layer.
On the other hand, the capacitance values for the double layer Ceff(dl) were
between 10 to 19 μF·cm- 2 (see Table 37). These values are in the typical range
10-40 μF·cm- 2. The capacitance values for the porous outer layer (Ceff(b)) and
intermediate porous layer (Ceff(a)) were lower than Ceff(dl).

Experimental results 155
The passive film thickness, δ (in nm), were obtained from dense inner layer
capacitance. The thickness values were of 3.98, 7.62 and 7.69 nm for
Ti35Nb7Zr5Ta alloy, at ND, HPT1GPa and HPT4.5GPa conditions, respectively.
The results obtained by fitting EIS data indicate that Ti35Nb7Zr5Ta alloy
chemically treated by H3PO4 and NaOH behaved in a very similar way.
6.4 Bioactivity of Ti35Nb7Zr5Ta alloy
In order to characterize the bioactivity of Ti35Nb7Zr5Ta alloy, the amount of
hydroxyapatite (HAp) spontaneously deposited on the surface of the samples was
measured. The samples were immersed in SBF for 1, 7, and 14 days.
6.4.1 Bioactivity of polished samples
Figure 80 shown SEM-FEG observations of polished samples, subjected to
the bioactivity tests, after 1, 7, and 14 days immersed in SBF.

Influence of surface treatments on corrosion resistance
properties of ultrafine grained Titanium alloys for implant applications 156
Figure 80: SEM-FEG observations (scale bar 1 µm) of polished samples of Ti35Nb7Zr5Ta
alloy, non-deformed, and deformed by HPT, subjected to the bioactivity tests after 1, 7,
and 14 days immersed in SBF.
From Figure 80, one may observe that even after 14 days of immersion in
the physiological solution, no apatite was detected on any surfaces of the polished
samples of Ti35Nb7Zr5Ta alloy.
Table 38 shows the EDS analysis performed for each condition. The results
confirm that there was no apatite formation on the surface of the samples.
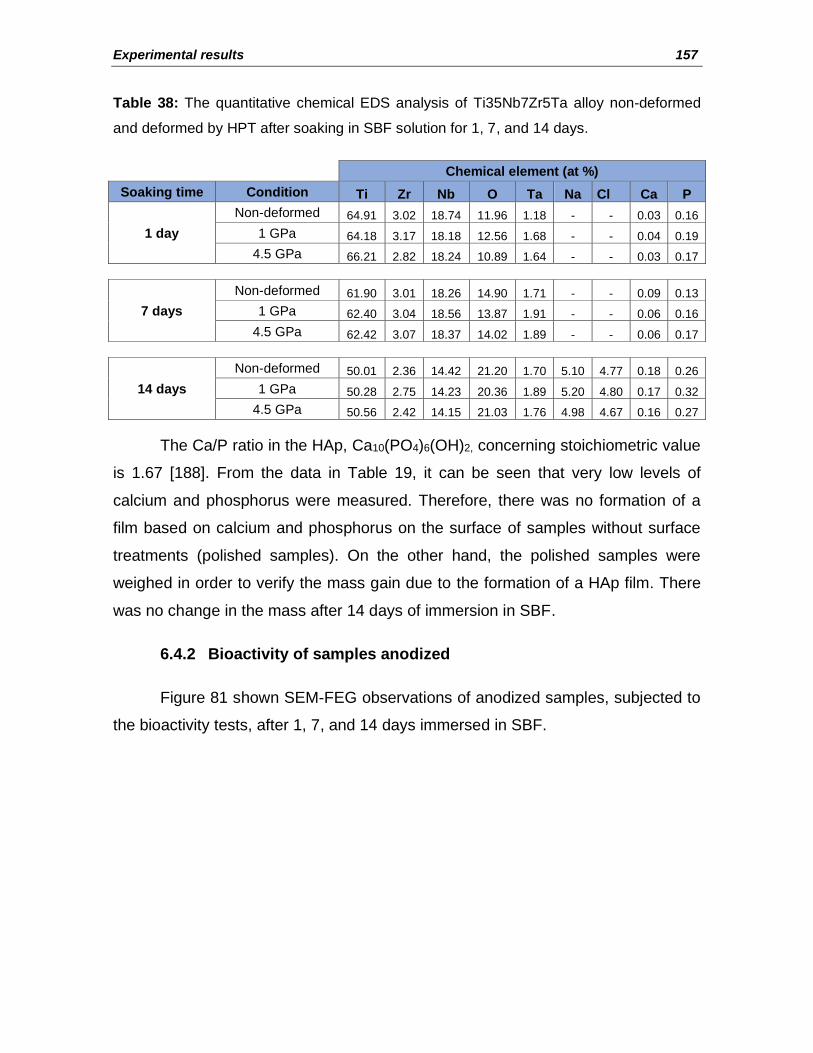
Experimental results 157
Table 38: The quantitative chemical EDS analysis of Ti35Nb7Zr5Ta alloy non-deformed
and deformed by HPT after soaking in SBF solution for 1, 7, and 14 days.
Chemical element (at %)
Soaking time Condition Ti Zr Nb O Ta Na Cl Ca P Non-deformed 64.91 3.02 18.74 11.96 1.18 - - 0.03 0.16
1 day 1 GPa 64.18 3.17 18.18 12.56 1.68 - - 0.04 0.19 4.5 GPa 66.21 2.82 18.24 10.89 1.64 - - 0.03 0.17
Non-deformed 61.90 3.01 18.26 14.90 1.71 - - 0.09 0.13
7 days 1 GPa 62.40 3.04 18.56 13.87 1.91 - - 0.06 0.16 4.5 GPa 62.42 3.07 18.37 14.02 1.89 - - 0.06 0.17
Non-deformed 50.01 2.36 14.42 21.20 1.70 5.10 4.77 0.18 0.26
14 days 1 GPa 50.28 2.75 14.23 20.36 1.89 5.20 4.80 0.17 0.32 4.5 GPa 50.56 2.42 14.15 21.03 1.76 4.98 4.67 0.16 0.27
The Ca/P ratio in the HAp, Ca10(PO4)6(OH)2, concerning stoichiometric value
is 1.67 [188]. From the data in Table 19, it can be seen that very low levels of
calcium and phosphorus were measured. Therefore, there was no formation of a
film based on calcium and phosphorus on the surface of samples without surface
treatments (polished samples). On the other hand, the polished samples were
weighed in order to verify the mass gain due to the formation of a HAp film. There
was no change in the mass after 14 days of immersion in SBF.
6.4.2 Bioactivity of samples anodized
Figure 81 shown SEM-FEG observations of anodized samples, subjected to
the bioactivity tests, after 1, 7, and 14 days immersed in SBF.

Influence of surface treatments on corrosion resistance
properties of ultrafine grained Titanium alloys for implant applications 158
Figure 81: SEM-FEG observations (scale bar 1 µm) of anodized samples of
Ti35Nb7Zr5Ta alloy, non-deformed, and deformed by HPT, subjected to the bioactivity
tests after 1, 7, and 14 days immersed in SBF.
Figures 81((g) and (i)) show that only apatite deposits were formed from the
fourteenth day of immersion in SBF.
Table 39 shows the EDS analysis performed for each condition and confirms
that there is apatite formation from the fourteenth day on immersion in SBF for the
deformed condition at 4.5 GPa and non-deformed samples.

Experimental results 159
Table 39: The quantitative EDS analysis spectrum and Ca/P molar ratio of anodized
samples of Ti35Nb7Zr5Ta alloy, non-deformed and deformed by HPT, subjected to the
bioactivity tests after 1, 7 and 14 days immersed in SBF.
Chemical element (at %)
Soaking time Condition Ti Zr Nb O Ta Na Mg Ca P
Ca/P Molar Ratio
Non-deformed 23.10 1.25 7.89 66.54 0.68 - - 0.41 0.13 -
1 day 1 GPa 22.21 1.09 7.64 67.89 0.62 - - 0.42 0.13 - 4.5 GPa 22.55 1.25 7.83 67.16 0.57 - - 0.48 0.16 -
Non-deformed 22.77 1.11 7.78 67.05 0.72 - - 0.42 0.14 -
7 days 1 GPa 22.04 1.12 7.88 67.88 0.51 - - 0.45 0.12 - 4.5 GPa 21.82 1.23 7.80 68.10 0.42 - - 0.47 0.16 -
Non-deformed 0.20 - - 64.80 - 0.38 0.90 21.46 12.26 1.75
14 days 1 GPa 22.48 1.14 8.04 67.24 0.52 - - 0.44 0.14 -
4.5 GPa 0.20 - - 64.42 - 0.37 0.88 22.10 12.03 1.84
The molar ratio of Ca / P was calculated in Table 39. This molar ratio of Ca /
P was approximately 1.80, which is higher than the stoichiometric ratio of 1.67,
indicating that the newly formed calcium phosphate is a type B carbonate apatite,
in which PO43− substitutes for CO3
2−. On the other hand, to verify the mass gain by
the formation of a hydroxyapatite film, the samples were weighed, and their results
are presented in Figure 82, which shows that from the fourteenth-day apatite is
formed in the sample non-deformed, and the sample deformed at 4.5 GPa.

Influence of surface treatments on corrosion resistance
properties of ultrafine grained Titanium alloys for implant applications 160
Non
-def
orm
ed
1GPa;
3 tu
rns
4.5G
Pa; 3 tu
rns
0,0
0,4
0,8
1,2
1,6
2,0
2,4A
pa
tite
ma
ss
ga
in /m
g
1 day
Non
-def
orm
ed
1GPa;
3 tu
rns
4.5G
Pa; 3 tu
rns
0,0
0,4
0,8
1,2
1,6
2,0
2,4
Ap
ati
te m
as
s g
ain
/m
g
7 days
Non
-def
orm
ed
1GPa;
3 tu
rns
4.5G
Pa; 3 tu
rns
0,0
0,4
0,8
1,2
1,6
2,0
2,4
Ap
ati
te m
as
s g
ain
/m
g
14 days
Figure 82: The weight change of samples of the Ti35Nb7Zr5Ta alloy with TiO2 nanotubes
unprocessed and processed by HPT after soaking in SBF for 1, 7 and14 days.
6.4.3 Bioactivity of samples chemically treated by HCl etching and
NaOH activation
Figure 83 shown SEM-FEG observations of samples chemically treatment
by HCl and NaOH, subjected to the bioactivity tests, after 1, 7 and 14 days
immersed in SBF.

Experimental results 161
Figure 83: SEM-FEG observations (scale bar 1 µm) for samples of Ti35Nb7Zr5Ta alloy
chemically treated by HCl and NaOH, non-deformed and deformed by HPT, subjected to
the bioactivity tests after 1, 7, and 14 days immersed in SBF.
Figures 83((g) and (i)) confirm that only apatite deposits were formed from
the fourteenth day of immersion in SBF.
Table 40 shows the EDS analysis performed for each condition and confirms
that there is apatite formation from the fourteenth day on immersion in SBF for the
deformed condition at 4.5 GPa and non-deformed samples.

Influence of surface treatments on corrosion resistance
properties of ultrafine grained Titanium alloys for implant applications 162
Table 40: The quantitative EDS analysis spectrum and Ca/P molar ratio for samples of
Ti35Nb7Zr5Ta alloy chemically treated by HCl and NaOH, non-deformed and deformed by
HPT, subjected to the bioactivity tests after 1, 7 and 14 days immersed in SBF.
Chemical element (at %)
Soaking time Condition Ti Zr Nb O Ta Na Mg Ca P
Ca/P Molar Ratio
Non-deformed 16.23 0.25 2.17 71.65 0.32 0.62 0.70 6.65 1.41 -
1 day 1 GPa 16.43 0.26 2.16 71.30 0.31 0.63 0.71 6.74 1.43 - 4.5 GPa 16.45 0.25 2.40 71.20 0.31 0.62 0.70 6.65 1.41 -
Non-deformed 18.62 0.34 2.79 69.76 0.92 0.92 0.68 5.51 2.06 -
7 days 1 GPa 19.10 0.41 2.68 68.74 0.92 0.68 0.57 5.01 1.89 - 4.5 GPa 18.29 0.52 2.37 67.89 1.08 0.72 0.69 6.14 2.30 -
Non-deformed 0.21 - - 64.80 - 0.37 0.90 21.46 12.26 1.75
14 days 1 GPa 19.55 0.74 2.92 70.50 0.28 1.86 0.48 3.65 0.02 -
4.5 GPa 0.01 - - 67.45 0.02 0.35 1.17 19.89 11.11 1.79
The molar ratio of Ca / P was calculated in Table 40. This molar ratio of Ca /
P was approximately 1.77, which indicates that the newly formed calcium
phosphate is a type B carbonate apatite, in which PO43− substitutes for CO3
2−. On
the other hand, to verify the mass gain by the formation of a hydroxyapatite film,
the samples were weighed, and their results are introduced in Figure 84, showing
that from the fourteenth-day apatite is formed in the non-deformed samples and
the samples deformed at 4.5 GPa.

Experimental results 163
Non
-def
orm
ed
1GPa;
3 tu
rns
4.5G
Pa; 3 tu
rns
0,0
0,4
0,8
1,2
1,6
2,0
2,4A
pa
tite
ma
ss
ga
in /m
g
1 day
Non
-def
orm
ed
1GPa;
3 tu
rns
4.5G
Pa; 3 tu
rns
0,0
0,4
0,8
1,2
1,6
2,0
2,4
Ap
ati
te m
as
s g
ain
/m
g
7 days
Non
-def
orm
ed
1GPa;
3 tu
rns
4.5G
Pa; 3 tu
rns
0,0
0,4
0,8
1,2
1,6
2,0
2,4
Ap
ati
te m
as
s g
ain
/m
g
14 days
Figure 84: The weight change for samples of Ti35Nb7Zr5Ta alloy chemically treated, by
HCl etching and NaOH activation, non-deformed and deformed by HPT, subjected to the
bioactivity tests after 1, 7 and 14 days immersed in SBF.
6.4.4 Bioactivity of samples chemically treated by H3PO4 etching and
NaOH activation
Figure 85 shown SEM-FEG observations of samples chemically treatment
by H3PO4 and NaOH, subjected to the bioactivity tests, after 1, 7, and 14 days
immersed in SBF.

Influence of surface treatments on corrosion resistance
properties of ultrafine grained Titanium alloys for implant applications 164
Figure 85: SEM-FEG observations (scale bar 1 µm) for samples of Ti35Nb7Zr5Ta alloy
chemically treated by H3PO4 and NaOH, non-deformed and deformed by HPT, subjected
to the bioactivity tests after 1, 7, and 14 days immersed in SBF.
Figure 85 indicates that even after 14 days of immersion in the physiological
solution, no apatite was detected on any surfaces of Ti35Nb7Zr5Ta alloy
chemically treated, by H3PO4 etching and NaOH activation.
Table 41 shows the EDS analysis performed for each condition. The results
confirm that there was no apatite formation on the surface of the samples.

Experimental results 165
Table 41: The quantitative chemical EDS analysis for samples of Ti35Nb7Zr5Ta alloy
chemically treated by H3PO4 and NaOH, non-deformed and deformed by HPT, subjected
to the bioactivity tests after 1, 7 and 14 days immersed in SBF.
Chemical element (at %)
Soaking time Condition Ti Zr Nb O Ta Na Mg Ca P Non-deformed 22,09 0,41 4,37 69,02 0,11 1,47 0,51 1,61 0,41
1 day 1 GPa 22,14 0,38 2,58 70,88 0,16 1,43 0,70 1,42 0,31 4.5 GPa 22,68 0,36 3,75 69,31 0,10 1,35 0,48 1,59 0,38
Non-deformed 21,91 0,59 4,13 66,34 1,19 1,20 0,43 3,70 0,51
7 days 1 GPa 22,52 1,14 5,58 63,26 0,99 1,75 0,79 3,74 0,23 4.5 GPa 21,82 0,80 4,88 65,06 0,62 1,85 0,60 3,88 0,49
Non-deformed 24,55 0,76 5,54 62,29 0,72 1,49 0,52 3,73 0,40
14 days 1 GPa 22,99 0,95 5,05 64,66 0,69 1,26 0,44 3,66 0,30 4.5 GPa 24,02 1,47 5,96 63,43 0,76 1,06 0,27 2,91 0,12
From the data in Table 41, it can be seen the same behavior as in the
polished samples with very low levels of calcium and phosphorus being observed.
Therefore, there was no formation of a film based on calcium and phosphorus on
the surface of Ti35Nb7Zr5Ta alloy chemically treated. On the other hand, the
chemically treated samples were weighed in order to verify the mass gain due to
the formation of a HAp film. There was no change in the mass after 14 days of
immersion in SBF.


Discussion 167
7 DISCUSSION
The grain size was measured before and after the deformations by HPT for
the different samples of the alloys Ti13Nb13Zr (α'+β) and Ti35Nb7Zr5Ta (β).
Initially, the Ti13Nb13Zr had an average grain size of 250 µm, after being
deformed with 1 GPa the size is reduced to 89 µm and finally to 203 nm for the
pressure of 4.5 GPa. For the (β) alloy the same behavior is observed where initially
an average size of 240 µm is observed, and when deformed with 1 GPa it is
reduced to 89 µm, and, finally, grain sizes of 112 nm are observed after
deformation of 4.5 GPa. The HPT process produces ultrafine grain size (UFG) in
nanometric ranges for high pressures and also generates a high amount of
dislocation density [192]. Grain refinement is formed by subdividing the original
grains into subgrains into the early stages of deformation as illustrated in Figure
86, and recovering and migrating from these subgrains to form high-angle contours
in the following stages of plastic deformation.
Figure 86: Scheme of grain refinement during deformation by HPT describing in sequence
the processes of (a) the generation of dislocations, (b) the formation of subgrains
boundaries, (c) the increase in the disorientation angle, and (d) the division of grains into
subgrains. Adapted from Borodachenkova et al., (2017) [193].

Influence of surface treatments on corrosion resistance
properties of ultrafine grained Titanium alloys for implant applications 168
The hardness in the processed state by HPT was reported for alloys of
Ti13Nb13Zr and Ti35Nb7Zr5Ta. The hardness in the processed HPT state
becomes higher for high pressures, which is related to the decrease in grain size.
Initially, microhardness value was 265 HV in the non‐deformed state and 390 HV in
the HPT‐processed state at 4.5 GPa for the alloy Ti13Nb13Zr and values of 183
HV in the non‐deformed state and 320 HV in the HPT‐processed state at 4.5 GPa
for the alloy of Ti35Nb7Zr5Ta. The microhardness measurements for all the
samples have confirmed that the hardness increases with the distance from the
center of the disk to the edge because, as the processing is torsional, the
deformation decreases from the edge towards the center, leading to smaller grains
on the edge that in the center [20]. This analysis is per the study of Wang and
Langdon [194], in which the same behavior is observed for the alloy Ti6Al4V
deformed by HPT.
The effect of HPT on Young’s modulus was investigated. Young’s modulus
is a measure of interatomic bonds force and depends only slightly on the
microstructure morphology of materials [195]. In fact, in the alloys Ti13Nb13Zr and
Ti35Nb7Zr5Ta deformed by HPT, the degree of plastic deformation and the size of
grains have no significant influence on the value of Young's modulus. For the
Ti13Nb13Zr alloy values of Young's modulus were observed between 58 to 63
GPa and Ti35Nb7Zr5Tabetween 44 and 45 GPa for the Ti35Nb7Zr5Ta alloy.
Methods of surface modification are of great interest in this work. The
nanostructures in alloys of Ti13Nb13Zr and Ti35Nb7Zr5Ta with different degrees of
deformations were fabricated by the surface modification technique known as
anodization. The effect of the SPD on the morphology, crystal phase, and size of
nanostructures was investigated. Nanostructures arrays with uniform diameter
were achieved by using an organic electrolyte (glycerol) containing fluoride ions
and a few percentages of water, indicating that the electrolyte composition will
influence the arrangement of TiO2 nanostructures arrays. XRD analysis confirmed
that as-anodized amorphous nanostructures crystallize into a mixture of anatase
and rutile when annealed at 550°C, without significant morphological changes in

Discussion 169
the surface phases. The anodization of the biphasic (α'+β) Ti13Nb13Zr alloy form
arrays of TiO2 nanotubes with well-defined circular geometry in the α' phase, while
nanopores of TiO2 are formed in the β phase. After anodization, formed self-
organized arrays of nanotubes were obtained with the following average
dimensions in the range: diameter of 62-90 nm, a length of 1.5-1.9 mm and a
thickness of 18-26 nm. The HPT processing caused the refinement and spatial
redistribution of α' and β phases. The formation of the nanotubes was kept sole
within the α' phase, however, with the difference that nanotubes are not so
organized and are deformed in their longitudinal direction suggesting that their
growth follow the spatial distortion of the α' phase. Such distortion also influences
the length of the nanostructures, due to it is observed a greater length of
nanotubes in the non-deformed state (uniform arrays) and a shorter length for
more significant deformations (arrays with spatial distortion).
The distinct nanostructures obtained in the Ti13Nb13Zr alloy is a result of
competition between electrochemical oxide formation and chemical dissolution of
oxide by fluoride ions. The oxidation reaction at the interface of the Ti13Nb13Zr
alloy surface and electrolyte at a constant applied potential is given by [196]:
𝑀 ↔ 𝑀𝑛+ + 𝑛𝑒−(𝑀 = 𝑇𝑖, 𝑁𝑏 𝑎𝑛𝑑 𝑍𝑟)
Followed by:
𝑥𝐻2𝑂 ↔ 𝑥𝑂2− + 2𝑥𝐻+
Then,
2𝑀𝑛+ + 𝑛𝑂2− ↔ 𝑀𝑛𝑂𝑛
In the presence of a fluorine anion, chemical dissolution occurs:
𝑇𝑖4+ + 6𝐹− ↔ [𝑇𝑖𝐹6]2−
𝑁𝑏5+ + 7𝐹− ↔ [𝑁𝑏𝐹7]2−
𝑍𝑟4+ + 6𝐹− ↔ [𝑍𝑟𝐹6]2−

Influence of surface treatments on corrosion resistance
properties of ultrafine grained Titanium alloys for implant applications 170
Consequently, β and α' phases will inevitably produce different
nanostructures due to the high solubility of Ti-F or Ti-O-F compounds in aqueous
media, unlike Nb-F and Zr-F species that are much less soluble. Thus, an ordered
nanoporous oxide will be formed on the Ti-poorer β phase (less Ti fluorides), but
nanotubular morphology will be found for the Ti-richer α' phase (more Ti fluorides).
On the other hand, the anodization of the monophasic alloy (β)
Ti35Nb7Zr5Ta forms arrays of TiO2 nanopores with a well-defined circular
geometry. After anodization, formed self-organized arrays of nanotubes were
obtained with the following average dimensions in the range: diameter of 66-75
nm, a length of 1.7-2.4 mm and a thickness of 22-32 nm. As a result, the
nanoporous grown on the Ti35Nb7Zr5Ta alloy after severe plastic deformation by
HPT had a smaller diameter and larger wall thickness. The formation of the
nanoporous not so organized was observed in substrates deformed by HPT,
suggesting that their growth follow the spatial distortion of the β phase. As it was
observed for the Ti13Nb13Zr, the spatial distortion also affects the length of the
nanostructures leading to a greater length of nanoporous in the non-deformed
state (uniform arrays) and a shorter length for larger deformations (arrays with
spatial distortion).
Chemical treatment by acid etching and NaOH activation were carried out in
Ti13Nb13Zr and Ti35Nb7Zr5Ta alloys with different degrees of deformations. Two
different etching procedures were performed: (i) samples were etched in HCl, (ii)
samples were etched in H3PO4. Subsequently, all specimens were soaked in
NaOH. The acid plus alkali treatment induced the formation of a nano topographic
sponge-like morphology on all samples' surfaces. Such surfaces were full of
cracks. However, it is noticeable that sponges' tentacles have quite different sizes,
depending on the sample composition and mechanical processing condition. In
other words, they decrease from Ti13Nb13Zr to Ti35Nb7Zr5Ta and after
processing by HPT.
The quantity of Na+ incorporated into the Ti13Nb13Zr surface after NaOH
activation was comparable for the two different acid etching procedures and the

Discussion 171
amounts to 2,81±0,62 at% for HCl treated and 1,24±0,11 at% for H3PO4 treated
samples. The amount of Na+ ions is related to the formation of sodium titanate
(Na2Ti5O11) on the surface of the substrates. Similarly, the results of Na+
incorporated into the Ti35Nb7Zr5Ta surface after NaOH activation was comparable
for the two different acid etching procedures and the amounts to 2,02±0,03 at% for
HCl treated and 1,23±0,09 at% for H3PO4 treated samples. Therefore, the samples
with acid etching with HCl of both alloys have a more considerable amount of Na+
ions, and the alloy Ti13Nb13Zr is the one that has more Na+ ions.
The evaluation of the corrosion resistance was carried out for both alloys
Ti13Nb13Zrin the undeformed and Ti35Nb7Zr5Ta deformed conditions, on
polished, anodized, and chemically treated surfaces.
Figure 87 summarizes open circuit potential measurements after soaking 1
hour in SBF for all samples presented in this work. The anodized samples of both
alloys have a higher open circuit potential. That means that anodized samples
have a more stable and protective oxide film on the surface. Apparently, there is a
tendency to increase the OCP in the samples of both alloys with acid etching plus
alkali treatment when severe plastic deformation is applied. The increase of the
potential can indicate the stability of the passive film, suggesting that the severe
plastic deformation accelerates the formation of this film.
Figure 88 shows the current passivation (ipass) for the (α'+β) and (β) alloys.
The conditions non-deformed and deformed by HPT were plotted and also the
different surface modification treatments. The passivation currents for the samples
with polished surface and the samples with chemical treatment (HCl, H3PO4 +
NaOH) are of the same order of magnitude (10-6 A ·cm-2). On the other hand, no
significant differences were observed for passivation currents between non-
deformed and deformed samples (except anodized samples), suggesting that
cracks formed on the surface of chemically treated samples exposed the surfaces,
which dominated the passivation phenomenon. Thus, the passive oxide film
formed on the samples' surface is responsible for providing high resistance to
corrosion.

Influence of surface treatments on corrosion resistance
properties of ultrafine grained Titanium alloys for implant applications 172
Non
-def
orm
ed
1 GPa
4.5
GPa
Non
-def
orm
ed
1 GPa
4.5
GPa
Non
-def
orm
ed
1 GPa
4.5
GPa
Non
-def
orm
ed
1 GPa
4.5
GPa
0
-100
-200
-300
-400
-500
-600
-700
-800
-900
a) Ti-13Nb-13Zr
Op
en
Cir
cu
it P
ote
ntia
l vs S
CE/m
V Polished
Anodized
HCl + NaOH
H3PO
4+ NaOH
Non
-def
orm
ed
1 GPa
4.5
GPa
Non
-def
orm
ed
1 GPa
4.5
GPa
Non
-def
orm
ed
1 GPa
4.5
GPa
Non
-def
orm
ed
1 GPa
4.5
GPa
0
-100
-200
-300
-400
-500
-600
-700
-800
-900
b) Ti-35Nb-7Zr-5Ta
Op
en
Cir
cu
it P
ote
ntia
l vs S
CE/m
V
Polished
Anodized
HCl + NaOH
H3PO
4+ NaOH
Figure 87: Open circuit potential measurements after 1-hour immersion in SBF at 37 ° C;
(a) OCP measurements for samples of Ti13Nb13Zr alloy non-deformed and deformed by
HPT with different surface modification treatment and (b) OCP measurements for samples
of Ti35Nb7Zr5Ta alloy non-deformed and deformed by HPT with different surface
modification treatment.
Regarding the anodized samples, two results are observed: (i) Treatment of
modification of surface with lower value of the passivation current, Ti13Nb13Zr and
Ti35Nb7Zr5Ta alloys exhibited average values: 10-8 and 10-7 A ·cm-2, respectively
and (ii) There is a tendency to increment the passivation current by increasing the
pressure applied in the HPT process. Such a current increase may be related to
the thickness of the nanostructured TiO2 layer formed on the surfaces of (α'+β) and
(β) alloys. Such thicknesses showed to be dependent on the degree of
deformation, being smaller for samples with more considerable straining. In other
words, the larger the film thickness, the better the resistance to corrosion.

Discussion 173
Non
-def
orm
ed
1 GPa
4.5
GPa
Non
-def
orm
ed
1 GPa
4.5
GPa
Non
-def
orm
ed
1 GPa
4.5
GPa
Non
-def
orm
ed
1 GPa
4.5
GPa
10-8
10-7
10-6
10-5
10-4
a) Ti-13Nb-13Zr
i pa
ss/A
. cm
-2
Polished
Anodized
HCl + NaOH
H3PO
4+ NaOH
Non
-def
orm
ed
1 GPa
4.5
GPa
Non
-def
orm
ed
1 GPa
4.5
GPa
Non
-def
orm
ed
1 GPa
4.5
GPa
Non
-def
orm
ed
1 GPa
4.5
GPa
10-8
10-7
10-6
10-5
10-4
i pa
ss/A
. cm
-2
b) Ti-35Nb-7Zr-5Ta Polished
Anodized
HCl + NaOH
H3PO
4+ NaOH
Figure 88: Passivation current (ipass) measurements in SBF at 37 ° C; (a) ipass
measurements for samples of Ti13Nb13Zr alloy non-deformed and deformed by HPT with
different surface modification treatment and (b) ipass measurements for samples of
Ti35Nb7Zr5Ta alloy non-deformed and deformed by HPT with different surface
modification treatment.
To discuss the results of EIS in a comparative way for both alloys and
conditions of interest of this work (deformation by HPT and surface modification
treatments), it is relevant to study in more detail the average values (from a
statistical analysis) of the impedance modules |Z| at low frequency for each type of
sample. Thus, Figure 89 presents the values of |Z| measured at 20 mHz,
associated with the specific surface area of each sample, and calculated according
to the relationship:
|𝑍| = √((𝑍,𝑥 𝑆𝑠 − 𝑅𝑒)2 + (𝑍,,𝑥𝑆𝑠)2)
Where Z 'and Z' '(in Ω) are respectively the real and imaginary parts of the
impedance at 20 mHz, SS is the specific area exposed to the solution in cm².
The presence of TiO2 nanostructures causes an increase of |Z| relative to
the substrate, meaning better properties of the protective oxide layer. This increase
is better observed in the Ti13Nb13Zr alloy, where the maximum values of |Z| were
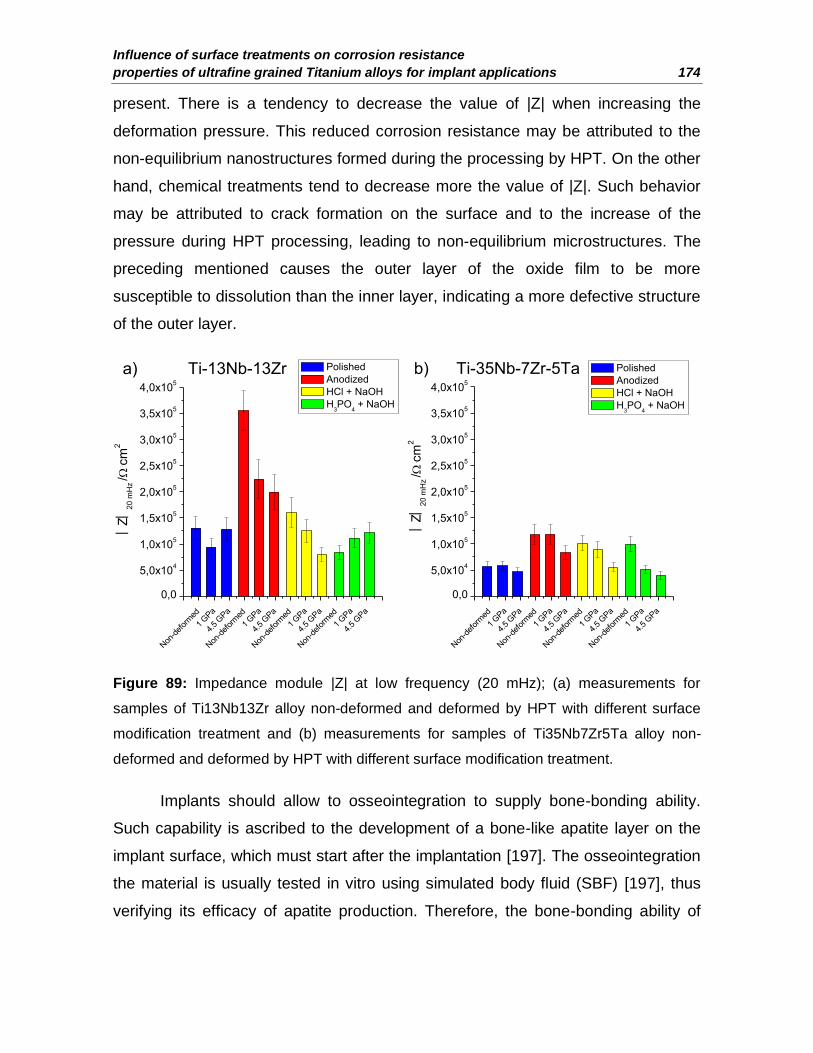
Influence of surface treatments on corrosion resistance
properties of ultrafine grained Titanium alloys for implant applications 174
present. There is a tendency to decrease the value of |Z| when increasing the
deformation pressure. This reduced corrosion resistance may be attributed to the
non-equilibrium nanostructures formed during the processing by HPT. On the other
hand, chemical treatments tend to decrease more the value of |Z|. Such behavior
may be attributed to crack formation on the surface and to the increase of the
pressure during HPT processing, leading to non-equilibrium microstructures. The
preceding mentioned causes the outer layer of the oxide film to be more
susceptible to dissolution than the inner layer, indicating a more defective structure
of the outer layer.
Non
-def
orm
ed
1 GPa
4.5
GPa
Non
-def
orm
ed
1 GPa
4.5
GPa
Non
-def
orm
ed
1 GPa
4.5
GPa
Non
-def
orm
ed
1 GPa
4.5
GPa
0,0
5,0x10⁴
1,0x10⁵
1,5x10⁵
2,0x10⁵
2,5x10⁵
3,0x10⁵
3,5x10⁵
4,0x10⁵
Z
2
0 m
Hz
/ .cm
2
a) Ti-13Nb-13Zr Polished
Anodized
HCl + NaOH
H3PO
4 + NaOH
Non
-def
orm
ed
1 GPa
4.5
GPa
Non
-def
orm
ed
1 GPa
4.5
GPa
Non
-def
orm
ed
1 GPa
4.5
GPa
Non
-def
orm
ed
1 GPa
4.5
GPa
0,0
5,0x10⁴
1,0x10⁵
1,5x10⁵
2,0x10⁵
2,5x10⁵
3,0x10⁵
3,5x10⁵
4,0x10⁵
b) Ti-35Nb-7Zr-5Ta
Z
2
0 m
Hz
/ .cm
2
Polished
Anodized
HCl + NaOH
H3PO
4 + NaOH
Figure 89: Impedance module |Z| at low frequency (20 mHz); (a) measurements for
samples of Ti13Nb13Zr alloy non-deformed and deformed by HPT with different surface
modification treatment and (b) measurements for samples of Ti35Nb7Zr5Ta alloy non-
deformed and deformed by HPT with different surface modification treatment.
Implants should allow to osseointegration to supply bone-bonding ability.
Such capability is ascribed to the development of a bone-like apatite layer on the
implant surface, which must start after the implantation [197]. The osseointegration
the material is usually tested in vitro using simulated body fluid (SBF) [197], thus
verifying its efficacy of apatite production. Therefore, the bone-bonding ability of

Discussion 175
samples with treated surfaces correlated to polished surfaces was evaluated by
immersing them for 1, 7, and 14 days in SBF.
The formation of an apatite layer was assessed by SEM-EDS chemical
microanalysis. For samples evidencing the apatite layer formation, the ratio Ca/P
was calculated (Table 42), which were inside or, at least, near the theoretical
relationship for hydroxyapatite of 1.67 (Ca5(PO4)3(OH) Ca/P = 5/3 = 1.67).
Table 42: Ca/P molar ratios obtained from the EDS results on the polished surfaces and
surface treated of deformed and undeformed samples after different times in SBF.
Surface modification treatments
Polished Anodized HCl
+ NaOH
H3PO4
+ NaOH
Soaking time Condition
Ca/P Molar Ratio
Ca/P Molar Ratio
Ca/P Molar Ratio
Ca/P Molar Ratio
1 Day
Ti13Nb13Zr; Non-deformed - - - -
Ti13Nb13Zr; 1 GPa - - - -
Ti13Nb13Zr; 4.5 GPa - 1.81 - -
Ti35Nb7Zr5Ta; Non-deformed - - - -
Ti35Nb7Zr5Ta; 1 GPa - - - -
Ti35Nb7Zr5Ta; 4.5 GPa - - - -
7 Days
Ti13Nb13Zr; Non-deformed - 1.62 1.80 1.65
Ti13Nb13Zr; 1 GPa - 1.72 1.76 1.52
Ti13Nb13Zr; 4.5 GPa - 1.76 1.73 1.56
Ti35Nb7Zr5Ta; Non-deformed - - - -
Ti35Nb7Zr5Ta; 1 GPa - - - -
Ti35Nb7Zr5Ta; 4.5 GPa - - - -
14 Days
Ti13Nb13Zr; Non-deformed - 1.95 1.68 1.60
Ti13Nb13Zr; 1 GPa - 1.90 1.82 1.55
Ti13Nb13Zr; 4.5 GPa - 1.86 1.64 1.57
Ti35Nb7Zr5Ta; Non-deformed - 1.75 1.75 -
Ti35Nb7Zr5Ta; 1 GPa - - - -
Ti35Nb7Zr5Ta; 4.5 GPa - 1.84 1.79 -
SEM-EDS chemical microanalysis (Table 42) showed that the Ti13Nb13Zr
and Ti35Nb7Zr5Ta alloys even after soaking for 14 days, in the polished condition
did form apatite, i.e., they are not bioactive. This behavior confirms that the first

Influence of surface treatments on corrosion resistance
properties of ultrafine grained Titanium alloys for implant applications 176
inert TiO2 layer created on the surface of the polished substrates was not sufficient
to promote bone formation.
The above behavior was also observed for samples of the Ti35Nb7Zr5Ta
alloy treated with acid etching using H3PO4 and activated with NaOH, indicating
that, even starting with phosphate on the surface, this material does not acquire
bioactivity using such a surface treatment. Contrarily, regarding the same surface
treatment, samples' surfaces of the Ti13Nb13Zr alloy showed bioactivity between
one and seven days for deformed and undeformed conditions.
Anodized surfaces of samples of the undeformed Ti13Nb13Zr alloy started
producing an apatite layer between seven and fourteen days, while deformed
samples showed to be bioactive since the first 24 hours. However, the same
surface treatment proved to be not as successful for specimens of the
Ti35Nb7Zr5Ta alloy. In this case, samples (deformed or not) only started producing
some apatite between the seventh and the fourteen days.
On the other hand, depending on the surface treatment performed, the
apatite composition can vary. The relation between Ca and P (Ca / P) obtained
from Table 44 is in the range of 1.52 to 1.95. As previously mentioned,
hydroxyapatite has a Ca / P ratio of 1.67, due to this, other CaP phases were
formed on the surfaces of the substrates. Table 43 [198] presents the potential
phases that can be present and their respective formulas.

Discussion 177
Table 43: Summary of CaP phases, their corresponding Ca/P molar ratios, abbreviations,
and chemical formulas.
Compounds Chemical formula Abbreviation Ca/P Molar
Ratio
Hydroxyapatite Ca10(PO4)6(OH)2 HAp 1.67
Amorphous phase N/A ACP
Alpha tricalcium α-Ca3(PO4)2 α-TCP 1.5
phosphate
Beta tricalcium β-Ca3(PO4)2 β-TCP 1.5
phosphate
Tetracalcium Ca4P2O9 TTCP 2.0
phosphate
Oxyhydroxyapatite Ca10(PO4)6 OHA 1.67
Calcium-deficient
hydroxyapatite
(OH)2-2x(O)x(h)x
Ca10−x(HPO4)x(PO4)6−x(OH)2−x
(0 < x < 1)
CDHA or
Ca-def HA
1.5–1.67
In general, two different ranges of Ca / P ratio are observed: (i) Samples
with Ca / P higher than 1.67, (ii) Samples with Ca / P less than 1.67. Samples with
a ratio of Ca / P higher than 1.67 are the following: (i) Ti13Nb13Zr and
Ti35Nb7Zr5Ta alloys non-deformed and deformed by HPT with the anodized
surface and (ii) Ti13Nb13Zr and Ti35Nb7Zr5Ta alloys non-deformed and deformed
by HPT with the surface etched with HCl and activated with NaOH.
Samples with a ratio of Ca / P lower than 1.67 are the following:(i)
Ti13Nb13Zr and Ti35Nb7Zr5Ta alloys non-deformed and deformed by HPT with
the surface etched with H3PO4 and activated with NaOH. For instance, the Ca / P
molar ratios 1.75-1.79 are commonly calculated for biomimetic CaP precipitated
onto calcium deficient hydroxyapatite [189]. In this case, the Ca/P ratio is higher
than 1.67, which indicates the formation of a calcium phosphate that is a B-type
carbonate apatite. This type of apatite replaces the PO43- for CO3
2- and commonly
occurs during biological mineralization processes [189].

Influence of surface treatments on corrosion resistance
properties of ultrafine grained Titanium alloys for implant applications 178
The general formula for calcium deficient hydroxyapatite can be written as
[199]:
𝐶𝑎10−𝑥(𝐻𝑃𝑂4)𝑋(𝑃𝑂4)6−𝑋(𝑂𝐻)2−𝑋
With 0 ≤ x ≤ 1. For stoichiometric HA (x = 0) the molar Ca/P ratio is 1.67. If
HPO42– is incorporated into the structure, the Ca/P ratio decreases to a minimum of
1.5 at x= 1. CO32– can easily substitute HPO4
2– due to the same charge [199]. This
results in:
𝐶𝑎8(𝐶𝑂3)2(𝑃𝑂4)4 ; Ca/P ratio = 2.
Therefore, other phases, such as B-type carbonate apatite, will be present
with hydroxyapatite.
Samples with an acid attack with H3PO4 and activation with NaOH have a
Ca / P ratio of less than 1.67. As expected, these samples form calcium deficient
hydroxyapatite with HPO42- incorporated into its structure. This results in:
𝐶𝑎9(𝐻𝑃𝑂4)(𝑃𝑂4)5(𝑂𝐻); Ca/P ratio = 1.5
Therefore, other phases, such as calcium-deficient hydroxyapatite, will be
present with hydroxyapatite.
In addition to the previous qualitative analysis performed by SEM-EDS,
apatite disposition was quantitatively estimated by weighing of samples before and
after SBF soaking. Such an evaluation is summarized in Figure 90, which presents
the means value of three weighings. Error bars display the standard deviation.
As it can be observed, the quantitative analysis of Figure 90 endorses the
above qualitative one, regarding apatite deposition or not, on polished or treated
surfaces, deformed or nondeformed, inside the periods afore-discussed.
It is noticeable that even having some bioactivity, the surfaces of anodized
samples of deformed and mechanically processed Ti35Nb7Zr5Ta alloy produced

Discussion 179
an undermost amount of apatite after 14 days. In a whole, for the Ti35Nb7Zr5Ta
alloy, it can be inferred that, unfortunately, even with these two kinds of surface
treatment, its bioactivity in the deformed and non-deformed conditions is
unsatisfactory. One reason for such behavior is probably the contamination of the
surfaces by other oxides. Surface layers of the alloys enriched with niobium,
tantalum, and zirconium oxides could decrease surface potential under
physiological conditions [200]. This surface potential decrease could be the reason
why the treated alloys did not form apatite as a result of suppression of the
sequence adsorption of phosphate and calcium ions.
Ti-35Nb-7Zr-5Ta Ti-35Nb-7Zr-5Ta Ti-35Nb-7Zr-5Ta
Ti-13Nb-13Zr Ti-13Nb-13Zr Ti-13Nb-13Zr
Polished Anodized HCl + NaOH H3PO
4+ NaOH
ND
1 GPa
4.5
GPa
ND
1 GPa
4.5
GPa
ND
1 GPa
4.5
GPa
ND
1 GPa
4.5
GPa
0,0
0,4
0,8
1,2
1,6
2,0
2,4
1 day 7 days 14 days
f)e)d)
c)b)
1 day 7 days 14 days
Apatit
e m
ass
gain
/m
g
a)
ND
1 GPa
4.5
GPa
ND
1 GPa
4.5
GPa
ND
1 GPa
4.5
GPa
ND
1 GPa
4.5
GPa
0,0
0,4
0,8
1,2
1,6
2,0
2,4
ND
1 GPa
4.5
GPa
ND
1 GPa
4.5
GPa
ND
1 GPa
4.5
GPa
ND
1 GPa
4.5
GPa
0,0
0,4
0,8
1,2
1,6
2,0
2,4
ND
1 GPa
4.5
GPa
ND
1 GPa
4.5
GPa
ND
1 GPa
4.5
GPa
ND
1 GPa
4.5
GPa
0,0
0,4
0,8
1,2
1,6
2,0
2,4
Apatit
e m
ass
gain
/m
g
ND
1 GPa
4.5
GPa
ND
1 GPa
4.5
GPa
ND
1 GPa
4.5
GPa
ND
1 GPa
4.5
GPa
0,0
0,4
0,8
1,2
1,6
2,0
2,4
ND
1 GPa
4.5
GPa
ND
1 GPa
4.5
GPa
ND
1 GPa
4.5
GPa
ND
1 GPa
4.5
GPa
0,0
0,4
0,8
1,2
1,6
2,0
2,4
Figure 90: Graphs showing the apatite mass gain after soaking specimens in SBF as a
function of the immersion time, comparing polished surfaces and surface treated of
deformed and undeformed samples.

Influence of surface treatments on corrosion resistance
properties of ultrafine grained Titanium alloys for implant applications 180
Concerning the behavior of the Ti13Nb13Zr alloy after anodization, as can
be seen, there was no precipitation of apatite on the surface of undeformed
Ti13Nb13Zr alloy during the first day of soaking, while, on deformed samples at 4.5
GPa, the apatite mass gain raised with the immersion time from the early 24 hours.
This behavior leads one inferring that the smaller the grain size, the more
significant the mass gain, which also proves the consequence of the kind of
surface for bioactivity, and, in this case, the redistribution and refinement of α' and
β phases on the sample surface caused by HPT.
In this study, it was shown that the TiO2 nanostructures formed on samples
deformed grew longitudinally following the texture induced by the HPT process.
Thus, the refinement presented in samples deformed at 4.5 GPa probably caused
the formation of TiO2 nanostructures more distorted. This behavior could favor
higher wettability of samples deformed when in contact with the SBF, and then
speed up the formation of apatite.
Regarding the behavior of the chemically treated surfaces of the
Ti13Nb13Zr alloy, one may observe that such a treatment is not as useful for
activating the surface of undeformed samples, being the bioactivation much better
for deformed ones. This behavior was already observed in the samples with
anodized ultrafine granulation. Therefore, it can be inferred that for the biphasic
sample of Ti13Nb13Zr, the grain refinement improves bioactivity due to a greater
apatite mass gain.
On the other hand, the amount of Na+ observed on the surface of the
chemically modified samples affects the formation of apatite. These sodium ions
come from the sodium titanate layer formed by the chemical treatment. As
mentioned, chemical treatment of etching by HCl and activation with NaOH forms a
higher quantity of Na+ ions. This condition was the one that most formed apatite on
samples' surface, indicating that the apatite formation on chemically treated
titanium alloys seems to be similar to that bioactive glasses [128]. The exchange of
Na+ from glass by H+ or H3O+ from the fluid leads to the formation of a Si-OH layer
that was described to induce apatite nucleation via incorporation of Ca2+. The

Discussion 181
consumption of H3O+ causes an increase in pH, and apatite will be precipitated
[201].
Finally, to discuss the results of surface modification treatments in a similar
way for both alloys, HPT deformation will not be considered in this analysis.
Regarding electrochemical characterization, one may observe that the anodizing
treatment clearly showed an improvement in electrochemical properties, which can
be observed in Figures 87, 88 and 89, which correspond to the graphs of open
circuit potential, passivation currents and modulus of impedance respectively.
These samples showed the noblest open circuit potential, lowest passivation
current and the highest impedance module at lower frequency (20 mHz). On the
other hand, the values of passivation current and impedance modulus of samples
chemically treated were similar to those of polished samples.
The surface modification treatments activated the surface of the sample to
form apatite, which was not observed in samples in the polished condition. The
surface modification treatments that formed apatite in both alloys were anodization
and HCl etching followed by NaOH activation. The treatment with H3PO4 followed
by NaOH activation formed lower amount of apatite in the Ti13Nb13Zr alloy and
did not form apatite in the Ti35Nb7Zr5Ta alloy. These results were positive and
showed high potential for the surface modification treatments in biomedical
applications.


Conclusions 183
8 SUMMARY AND CONCLUSIONS:
Two commercial Ti alloys, Ti13Nb13Zr and Ti35Nb7Zr5Ta, were heat
treated and rapidly quenched. Part of the samples was severely deformed by HPT,
using 3 rpm and 3 turns, with loads of 1GPa and 4.5 GPa. The samples had their
surface modified using different methods (anodization, chemical etching (HCl and
H3PO4) and activation with NaOH). The specimens, in all conditions, were
structurally, microstructurally, mechanically, and electrochemically characterized
using several different methods as a function of the microstructural refinement,
phases present and the kind of surface modification. Finally, bioactivity tests were
also accomplished for all sample conditions. After analyzing and discussing the
results, the following conclusions can be drawn:
Heat-treatment
After heat treatment, the Ti13Nb13Zr alloy acquired a biphasic microstructure
containing the α' and β phases. The Ti35Nb7Zr5Ta alloy also presented a
biphasic microstructure composed mainly by the β phase and a small amount
of α.
Processing by HPT
HPT processing significantly reduced grain sizes, resulting in ultra-fine
microstructures in both alloys. The initial grain sizes of the two alloys were
about 250 μm, which were reduced to ~ to 89 µm, ~203 nm and ~112 nm for
the Ti13Nb13Zr and Ti35Nb7Zr5Ta alloys, respectively.
Another feature produced by HPT was the increase of the β phase in the
Ti13Nb13Zr alloy and a decrease of α in the Ti35Nb7Zr5Ta, making it almost a
single phase.
Grain refinement led to increased hardness in both samples, changing from
~265 HV and ~183 HV to ~390 HV and ~320 HV, respectively.
In the same sample sense as for hardness and outstanding (low) values of the
elastic modulus were obtained, they were reduced a bit. However, considering
Influence of surface treatments on corrosion resistance
properties of ultrafine grained Titanium alloys for implant applications 184
error bars, they stayed in the range of 60 GPa and 44 GPa before and after
deformation, respectively for the Ti13Nb13Zr and Ti35Nb7Zr5Ta specimens.
Surface treatments
The anodization of the Ti13Nb13Zr alloy indicates that there is the formation of
two different nanostructures, where nanotubes for the α'-phase and nanopores
for the β-phase are observed, irrespective to the spatial distribution of both
phases or their refinement. In the case of the Ti35Nb7Zr5Ta alloy, only
nanopores were observed.
As-anodized surfaces were amorphous. After annealing at 550°C, they
crystallize into a mixture of anatase and rutile, without significant morphological
changes in the nanostructures produced on the surfaces.
Surfaces of the samples were modified using acid etching followed by alkaline
treatment, resulting in a sodium titanate sponge-like layer. Sponges' tentacles
sizes depended on the grain size, surface chemistry, and structure. In general,
tentacles were thicker for undeformed samples and much thinner for samples
processed by HPT.
Corrosion Behavior
The anodized samples of both alloys have a higher open circuit potential,
meaning that they have a more stable and protective oxide film on the surface.
Apparently, there is a tendency to increase the OCP in the samples of both
alloys with acid etching plus alkali treatment when severe plastic deformation is
applied leading to the conclusion that SPD can accelerate the formation of the
passivation film.
Anodized samples presented very small passivation currents (between one to
two orders of magnitude lower than polished surfaces). Even being inside of
the same order of magnitude, passivation currents tend to increase with the
HPT pressure. Such a current increase may be related to the thickness of the
nanostructured TiO2, which was smaller for samples with higher loads.
Conclusions 185
The passivation currents for the samples with polished surface and the
samples with chemical treatment (HCl, H3PO4 + NaOH) are of the same order
of magnitude (10-6 A cm-2). Such behavior was associated to cracks formed on
the surface that exposed it, suggesting that the only responsible for the
passivation is the oxide film formed on the samples' surface and not the
titanate layer formed after chemical treatment. Thus, natural TiO2 is the only
responsible for providing high resistance to corrosion.
EIS Analysis
|Z| increases compared to the substrate when samples are anodized, which
means better properties of the protective oxide layer.
|Z| tends to decrease with the increase of the deformation pressure. Such
behavior was attributed to the non-equilibrium nanostructures formed during
the processing by HPT.
|Z| is more decreased after any surface chemical treatment. Such a decrease
is emphasized with the increase of the HPT pressure. Both behaviors were
linked with crack formation on the surface and, as it was for TiO2
nanostructures, also to non-equilibrium microstructures.
Bioactivity
Samples with polished surfaces did not form apatite, i.e., they are not
bioactive.
In general, results of bioactivity tests indicated that TiO2 nanostructures
could activate the surfaces of both samples, but the bioactivity of the
Ti13Nb13Zr alloy is much higher than for the Ti35Nb7Zr5Ta alloy, which did
not present any bioactivity when chemical treatment was used. Contrarily,
Ti13Nb13Zr alloy was active after both treatments, but much better for TiO2
nanostructures and samples deformed by HPT.
Reasons for apatite forming-ability behavior were given, which, finally, were
related to different charges arising on the surfaces due to the presence of

Influence of surface treatments on corrosion resistance
properties of ultrafine grained Titanium alloys for implant applications 186
other oxides in both kinds of surface treatment and tentacle sizes in the
case of chemically treated surfaces.

References 187
9 REFERENCES
[1] A. Rosenfeld, M. Dvorachek, I. Rotstein, Bronze single crown-like prosthetic
restorations of teeth from the Late Roman period, J. Archaeol. Sci. 27 (2000)
641–644. doi:10.1006/jasc.1999.0517.
[2] G. Manivasagam, D. Dhinasekaran, A. Rajamanickam, Biomedical implants:
Corrosion and its Prevention-A Review, Recent Patents Corros. Sci. 2 (2010)
40–54. doi:10.2174/1877610801002010040.
[3] M. Ribeiro, F.J. Monteiro, M.P. Ferraz, Infection of orthopedic implants with
emphasis on bacterial adhesion process and techniques used in studying
bacterial-material interactions, Biomatter. 2 (2012) 176–194.
doi:10.4161/biom.22905.
[4] C. Schank, Titanium Metal: Titanium Medical Metal of Choice – Supra Alloys,
Http://Www.Supraalloys.Com/Medical-Titanium.Php. (n.d.).
http://www.supraalloys.com/medical-titanium.php.
[5] F. Guillemot, Recent advances in the design of titanium alloys for orthopedic
applications, Expert Rev. Med. Devices. 2 (2005) 741–748.
doi:10.1586/17434440.2.6.741.
[6] C. Oldani, A. Dominguez, Titanium as a Biomaterial for Implants, in: Recent
Adv. Arthroplast., InTech, 2012: pp. 149–162. doi:10.5772/27413.
[7] P.G. Coelho, J.E. Lemons, Physico/chemical characterization and in vivo
evaluation of nanothickness bioceramic depositions on
alumina‐blasted/acid‐etched Ti‐6Al‐4V implant surfaces, J. Biomed. Mater.
Res. Part A An Off. J. Soc. Biomater. Japanese Soc. Biomater. Aust. Soc.
Biomater. Korean Soc. Biomater. 90 (2009) 351–361.
doi:10.1002/jbm.a.32097.
[8] S. Taksali, J.N. Grauer, A.R. Vaccaro, Material considerations for

Influence of surface treatments on corrosion resistance
properties of ultrafine grained Titanium alloys for implant applications 188
intervertebral disc replacement implants, Spine J. 4 (2004) S231–S238.
doi:10.1016/j.spinee.2004.07.012.
[9] A. Bansiddhi, D.C. Dunand, Titanium and NiTi foams for bone replacement,
in: Bone Substit. Biomater., Elsevier, 2014: pp. 142–179.
doi:10.1533/9780857099037.2.142.
[10] D.R. Crapper, S.S. Krishnan, S. Quittkat, Aluminium, neurofibrillary
degeneration and Alzheimer’s disease, Brain a J. Neurol. 99 (1976) 67–80.
doi:10.1093/brain/99.1.67.
[11] M. Niinomi, D. Kuroda, K. Fukunaga, M. Morinaga, Y. Kato, T. Yashiro, A.
Suzuki, Corrosion wear fracture of new β type biomedical titanium alloys,
Mater. Sci. Eng. A. 263 (1999) 193–199. doi:10.1016/S0921-5093(98)01167-
8.
[12] M. Niinomi, Mechanical properties of biomedical titanium alloys, Mater. Sci.
Eng. A. 243 (1998) 231–236. doi:10.1016/S0921-5093(97)00806-X.
[13] A. Najdahmadi, A. Zarei-Hanzaki, E. Farghadani, Mechanical properties
enhancement in Ti–29Nb–13Ta–4.6 Zr alloy via heat treatment with no
detrimental effect on its biocompatibility, Mater. Des. 54 (2014) 786–791.
doi:10.1016/j.matdes.2013.09.007.
[14] K.K. Wang, L.J. Gustavson, J.H. Dumbleton, Microstructure and properties of
a new beta titanium alloy, Ti-12Mo-6Zr-2Fe, developed for surgical implants,
in: Med. Appl. Titan. Its Alloy. Mater. Biol. Issues, ASTM International, 1996.
[15] P.L. Ferrandini, F.F. Cardoso, S.A. Souza, C.R. Afonso, R. Caram, Aging
response of the Ti–35Nb–7Zr–5Ta and Ti–35Nb–7Ta alloys, J. Alloys
Compd. 433 (2007) 207–210. doi:10.1016/j.jallcom.2006.06.094.
[16] H.J. Rack, J.I. Qazi, Titanium alloys for biomedical applications, 26 (2006)
1269–1277. doi:10.1016/j.msec.2005.08.032.

References 189
[17] S. Zherebtsov, G. Salishchev, R. Galeyev, K. Maekawa, Mechanical
properties of Ti–6Al–4V titanium alloy with submicrocrystalline structure
produced by severe plastic deformation, Mater. Trans. 46 (2005) 2020–2025.
doi:10.2320/matertrans.46.2020.
[18] a. Azushima, R. Kopp, a. Korhonen, D.Y. Yang, F. Micari, G.D. Lahoti, P.
Groche, J. Yanagimoto, N. Tsuji, a. Rosochowski, a. Yanagida, Severe
plastic deformation (SPD) processes for metals, CIRP Ann. - Manuf.
Technol. 57 (2008) 716–735. doi:10.1016/j.cirp.2008.09.005.
[19] Y.T. Zhu, T.G. Langdon, The fundamentals of nanostructured materials
processed by severe plastic deformation, Jom. 56 (2004) 58–63.
doi:10.1007/s11837-004-0294-0.
[20] D.A.G. Pérez, J. Junior, A. Moreira, C.S. Kiminami, C. Bolfarini, W.J. Botta,
Ultrafine-Grained Ti-13Nb-13Zr Alloy Produced by Severe Plastic
Deformation, Mater. Res. 20 (2017) 404–410. doi:10.1590/1980-5373-mr-
2017-0037.
[21] K. Sharman, P. Bazarnik, T. Brynk, A. Gunay Bulutsuz, M. Lewandowska, Y.
Huang, T.G. Langdon, Enhancement in mechanical properties of a β-titanium
alloy by high-pressure torsion, J. Mater. Res. Technol. 4 (2015) 79–83.
doi:10.1016/j.jmrt.2014.10.010.
[22] M. Kulkarni, A. Mazare, E. Gongadze, Š. Perutkova, V. Kralj-Iglič, I. Milošev,
P. Schmuki, A. Iglič, M. Mozetič, Titanium nanostructures for biomedical
applications, Nanotechnology. 26 (2015) 62002. doi:10.1088/0957-
4484/26/6/062002.
[23] R.Z. Valiev, I.P. Semenova, V. V. Latysh, H. Rack, T.C. Lowe, J. Petruzelka,
L. Dluhos, D. Hrusak, J. Sochova, Nanostructured titanium for biomedical
applications, Adv. Eng. Mater. 10 (2008) 15–17.
doi:10.1002/adem.200800026.

Influence of surface treatments on corrosion resistance
properties of ultrafine grained Titanium alloys for implant applications 190
[24] H. Miyamoto, Corrosion of Ultrafine Grained Materials by Severe Plastic
Deformation, an Overview, Mater. Trans. 57 (2016) 559–572.
doi:10.2320/matertrans.M2015452.
[25] F. Hilario, Synthèse et caractérisations de nanotubes de TiO2 pour
applications biomédicales: propriétés électrochimiques et bioactivité, (2017).
[26] J. Lu, Y. Zhang, W. Huo, W. Zhang, Y. Zhao, Y. Zhang, Electrochemical
corrosion characteristics and biocompatibility of nanostructured titanium for
implants, Appl. Surf. Sci. 434 (2018) 63–72.
doi:10.1016/j.apsusc.2017.10.168.
[27] J.M. Hernández-López, A. Conde, J. de Damborenea, M.A. Arenas,
Correlation of the nanostructure of the anodic layers fabricated on
Ti13Nb13Zr with the electrochemical impedance response, Corros. Sci. 94
(2015) 61–69. doi:10.1016/j.corsci.2015.01.041.
[28] M. Takeuchi, Y. Abe, Y. Yoshida, Y. Nakayama, M. Okazaki, Y. Akagawa,
Acid pretreatment of titanium implants, 24 (2003) 1821–1827.
doi:10.1016/S0142-9612(02)00576-8.
[29] R.Z. Legeros, R.G. Craig, Strategies to affect bone remodeling:
osteointegration, J. Bone Miner. Res. 8 (1993) S583–S596.
doi:10.1002/jbmr.5650081328.
[30] T. Albrektsson, A. Wennerberg, Oral implant surfaces: Part 1--review
focusing on topographic and chemical properties of different surfaces and in
vivo responses to them, Int. J. Prosthodont. 17 (2004).
[31] T. Albrektsson, B. Albrektsson, Osseointegration of bone implants: A review
of an alternative mode of fixation, Acta Orthop. Scand. 58 (1987) 567–577.
doi:10.3109/17453678709146401.
[32] W.F. Oliveira, I.R.S. Arruda, G.M.M. Silva, G. Machado, L.C.B.B. Coelho,
M.T.S. Correia, Functionalization of titanium dioxide nanotubes with

References 191
biomolecules for biomedical applications, Mater. Sci. Eng. C. 81 (2017) 597–
606. doi:10.1016/j.msec.2017.08.017.
[33] J.E.G. Hulshoff, K. Van Dijk, J.E. De Ruijter, F.J.R. Rietveld, L.A. Ginsel, J.A.
Jansen, Interfacial phenomena: An in vitro study of the effect of calcium
phosphate (Ca‐P) ceramic on bone formation, J. Biomed. Mater. Res. 40
(1998) 464–474. doi:10.1002/(SICI)1097-4636(19980605)40:3<464::AID-
JBM18>3.0.CO;2-J.
[34] S. Nishiguchi, T. Nakamura, M. Kobayashi, H.-M. Kim, F. Miyaji, T. Kokubo,
The effect of heat treatment on bone-bonding ability of alkali-treated titanium,
Biomaterials. 20 (1999) 491–500. doi:10.1016/S0142-9612(98)90203-4.
[35] M.J. Filiaggi, N.A. Coombs, R.M. Pilliar, Characterization of the interface in
the plasma-sprayed HA coating/Ti-6Al-4V implant system, J. Biomed. Mater.
Res. 25 (1991) 1211–1229. doi:10.1002/jbm.820251004.
[36] K.S. Brammer, C.J. Frandsen, S. Jin, TiO2 nanotubes for bone regeneration,
Trends Biotechnol. 30 (2012) 315–322. doi:10.1016/j.tibtech.2012.02.005.
[37] F.H. Froes, Titanium: Physical Metallurgy, Processing, and Applications,
ASM International, 2015.
[38] S. Malinov, W. Sha, Application of artificial neural networks for modelling
correlations in titanium alloys, Mater. Sci. Eng. A. 365 (2004) 202–211.
doi:10.1016/j.msea.2003.09.029.
[39] G. Lütjering, J. Williams, Titanium, (2003). doi:10.1007/978-3-540-73036-1.
[40] W. Sha, S. Malinov, Titanium alloys: modelling of microstructure, properties
and applications, (2009). doi:10.1017/S0001924000037829.
[41] E. Urba, A. Krz, A. Kazek-k, J. Michalska, A. Stolarczyk, G. Dercz, W. Simka,
Electrochemical modi fi cation of Ti-13Nb-13Zr alloy surface in phosphate
based solutions, 291 (2016) 79–88. doi:10.1016/j.surfcoat.2016.02.025.

Influence of surface treatments on corrosion resistance
properties of ultrafine grained Titanium alloys for implant applications 192
[42] T.C. Niemeyer, C.R. Grandini, L.M.C. Pinto, A.C.D. Angelo, S.G. Schneider,
Corrosion behavior of Ti-13Nb-13Zr alloy used as a biomaterial, 476 (2009)
172–175. doi:10.1016/j.jallcom.2008.09.026.
[43] D.A.G. Pérez, A.M.J. Junior, G.H. Asato, J.-C. Lepretre, V. Roche, C.
Bolfarini, W.J. Botta, Surface anodization of the biphasic Ti13Nb13Zr
biocompatible alloy: Influence of phases on the formation of TiO2
nanostructures, J. Alloys Compd. 796 (2019) 93–102.
doi:10.1016/j.jallcom.2019.04.167.
[44] O. Florêncio, P.S.S. Jr, R. Ribeiro, J.M. Chaves, F.H. Sá, F.X. Melo, S.G.
Schneider, Effect of different annealing on the anelastic relaxation in Ti –
13Nb – 13Zr alloy, 522 (2009) 351–353. doi:10.1016/j.msea.2008.09.136.
[45] A.K. Mishra, J.A. Davidson, R.A. Poggie, P. Kovacs, J. Ted, Mechanical and
tribological properties and biocompatibility of diffusion hardenen Ti-13Nb-
13Zr A new Titanium alloy for surgical implants, (1996) 96–113.
[46] M. Geetha, U. Kamachi Mudali, A.K. Gogia, R. Asokamani, B. Raj, Influence
of microstructure and alloying elements on corrosion behavior of Ti-13Nb-
13Zr alloy, Corros. Sci. 46 (2004) 877–892. doi:10.1016/S0010-
938X(03)00186-0.
[47] M.A. Khan, R.L. Williams, D.F. Williams, The corrosion behaviour of Ti–6Al–
4V, Ti–6Al–7Nb and Ti–13Nb–13Zr in protein solutions, Biomaterials. 20
(1999) 631–637. doi:10.1016/S0142-9612(98)00217-8.
[48] N.T.C. Oliveira, E.A. Ferreira, T. Duarte, S.R. Biaggio, R.C. Rocha-filho, N.
Bocchi, Corrosion resistance of anodic oxides on the Ti – 50Zr and Ti – 13Nb
– 13Zr alloys, 51 (2006) 2068–2075. doi:10.1016/j.electacta.2005.07.015.
[49] M.A. Khan, R.L. Williams, D.F. Williams, Conjoint corrosion and wear in
titanium alloys, Biomaterials. 20 (1999) 765–772. doi:10.1016/S0142-
9612(98)00229-4.

References 193
[50] K.S. Suresh, N.P. Gurao, S. Singh D., S. Suwas, K. Chattopadhyay, S. V.
Zherebtsov, G.A. Salishchev, Effect of equal channel angular pressing on
grain refinement and texture evolution in a biomedical alloy Ti13Nb13Zr,
Mater. Charact. 82 (2013) 73–85. doi:10.1016/j.matchar.2013.05.003.
[51] A. Stróż, B. Łosiewicz, M. Zubko, B. Chmiela, K. Balin, G. Dercz, M.
Gawlikowski, T. Goryczka, Production, structure and biocompatible
properties of oxide nanotubes on Ti13Nb13Zr alloy for medical applications,
Mater. Charact. 132 (2017) 363–372.
doi:https://doi.org/10.1016/j.matchar.2017.09.004.
[52] D. Cáceres, C. Munuera, C. Ocal, J.A. Jiménez, A. Gutiérrez, M.F. López,
Nanomechanical properties of surface-modified titanium alloys for biomedical
applications, Acta Biomater. 4 (2008) 1545–1552.
doi:10.1016/j.actbio.2008.04.009.
[53] M.A. Khan, R.L. Williams, D.F. Williams, The corrosion behaviour of Ti—
6Al—4V, Ti—6Al—7Nb and Ti—13Nb—13Zr in protein solutions, 20 (1999)
631–637.
[54] M.A. Baker, S.L. Assis, O.Z. Higa, I. Costa, Nanocomposite hydroxyapatite
formation on a Ti – 13Nb – 13Zr alloy exposed in a MEM cell culture medium
and the effect of H 2 O 2 addition, Acta Biomater. 5 (2009) 63–75.
doi:10.1016/j.actbio.2008.08.008.
[55] Y. Okazaki, E. Nishimura, H. Nakada, K. Kobayashi, Surface analysis of Ti-
15Zr-4Nb-4Ta alloy after implantation in rat tibia, Biomaterials. 22 (2001)
599–607. doi:10.1016/S0142-9612(00)00221-0.
[56] S. Nag, Influence of beta instabilities on the early stages of nucleation and
growth of alpha in beta titanium alloys, (2008).
[57] V.R. Jablokov, N.G.D. Murray, H.J. Rack, H.L. Freese, Influence of oxygen
content on the mechanical properties of Titanium-35Niobium-7Zirconium-
Influence of surface treatments on corrosion resistance
properties of ultrafine grained Titanium alloys for implant applications 194
5Tantalum beta titanium alloy, in: Titanium, Niobium, Zirconium, Tantalum
Med. Surg. Appl., ASTM International, 2006.
[58] S. Ozan, J. Lin, Y. Li, R. Ipek, C. Wen, Development of Ti-Nb-Zr alloys with
high elastic admissible strain for temporary orthopedic devices, Acta
Biomater. 20 (2015) 176–187. doi:10.1016/j.actbio.2015.03.023.
[59] M. Long, H.J. Rack, Titanium alloys in total joint replacement—a materials
science perspective, Biomaterials. 19 (1998) 1621–1639.
doi:10.1016/S0142-9612(97)00146-4.
[60] M. Atapour, A.L. Pilchak, G.S. Frankel, J.C. Williams, Corrosion behavior of
β titanium alloys for biomedical applications, Mater. Sci. Eng. C. 31 (2011)
885–891. doi:10.1016/j.msec.2011.02.005.
[61] Y.J. Bai, Y.B. Wang, Y. Cheng, F. Deng, Y.F. Zheng, S.C. Wei, Comparative
study on the corrosion behavior of Ti–Nb and TMA alloys for dental
application in various artificial solutions, Mater. Sci. Eng. C. 31 (2011) 702–
711. doi:10.1016/j.msec.2010.12.010.
[62] S. Samuel, S. Nag, S. Nasrazadani, V. Ukirde, M. El Bouanani, A.
Mohandas, K. Nguyen, R. Banerjee, Corrosion resistance and in vitro
response of laser‐deposited Ti‐Nb‐Zr‐Ta alloys for orthopedic implant
applications, J. Biomed. Mater. Res. Part A. 94 (2010) 1251–1256.
doi:10.1002/jbm.a.32782.
[63] M. Niinomi, Mechanical biocompatibilities of titanium alloys for biomedical
applications, J. Mech. Behav. Biomed. Mater. 1 (2008) 30–42.
doi:10.1016/j.jmbbm.2007.07.001.
[64] I. Dimić, I. Cvijović-Alagić, B. Völker, A. Hohenwarter, R. Pippan, D. Veljović,
M. Rakin, B. Bugarski, Microstructure and metallic ion release of pure
titanium and Ti-13Nb-13Zr alloy processed by high pressure torsion, Mater.
Des. 91 (2016) 340–347. doi:10.1016/j.matdes.2015.11.088.

References 195
[65] R.. Valiev, R.. Islamgaliev, I.. Alexandrov, Bulk nanostructured materials from
severe plastic deformation, 2000. doi:10.1016/S0079-6425(99)00007-9.
[66] A.P. Zhilyaev, T.G. Langdon, Using high-pressure torsion for metal
processing: Fundamentals and applications, Prog. Mater. Sci. 53 (2008)
893–979. doi:10.1016/j.pmatsci.2008.03.002.
[67] I. Sabirov, N.A. Enikeev, M.Y. Murashkin, R.Z. Valiev, Bulk Nanostructured
Materials with Multifunctional Properties, First Ed., Springer Inter. Pub.
(2015) 27–100. doi:10.1007/978-3-319-19599-5.
[68] A. Tiwari, A.N. Nordin, Advanced biomaterials and biodevices, John Wiley &
Sons, 2014. doi:10.1002/9781118774052.
[69] L. Mishnaevsky, E. Levashov, R.Z. Valiev, J. Segurado, I. Sabirov, N.
Enikeev, S. Prokoshkin, A. V Solov’yov, A. Korotitskiy, E. Gutmanas,
Nanostructured titanium-based materials for medical implants: modeling and
development, Mater. Sci. Eng. R Reports. 81 (2014) 1–19.
doi:10.1016/j.mser.2014.04.002.
[70] X. Liu, P.K. Chu, C. Ding, Surface modification of titanium , titanium alloys ,
and related materials for biomedical applications, 47 (2005) 49–121.
doi:10.1016/j.mser.2004.11.001.
[71] O.P. Ferreira, A.G. Souza Filho, J. Mendes Filho, O.L. Alves, Unveiling the
structure and composition of titanium oxide nanotubes through ion exchange
chemical reactions and thermal decomposition processes, J. Braz. Chem.
Soc. 17 (2006) 393–402.
[72] P. Roy, S. Berger, P. Schmuki, TiO2nanotubes: Synthesis and applications,
Angew. Chemie - Int. Ed. 50 (2011) 2904–2939.
doi:10.1002/anie.201001374.
[73] N.S. Allen, M. Edge, G. Sandoval, J. Verran, J. Stratton, J. Maltby,
Photocatalytic Coatings for Environmental Applications, Photochem.

Influence of surface treatments on corrosion resistance
properties of ultrafine grained Titanium alloys for implant applications 196
Photobiol. 81 (2005) 279–290. doi:10.1562/2004-07-01-RA-221.
[74] Y. Cheng, H. Yang, Y. Yang, J. Huang, K. Wu, Z. Chen, X. Wang, C. Lin, Y.
Lai, Progress in TiO 2 nanotube coatings for biomedical applications: a
review, J. Mater. Chem. B. 6 (2018) 1862–1886. doi:10.1039/C8TB00149A.
[75] O. Ola, M.M. Maroto-Valer, Review of material design and reactor
engineering on TiO2 photocatalysis for CO2 reduction, J. Photochem.
Photobiol. C Photochem. Rev. 24 (2015) 16–42.
doi:10.1016/j.jphotochemrev.2015.06.001.
[76] H. Tsuchiya, J.M. Macak, L. Müller, J. Kunze, F. Müller, P. Greil, S. Virtanen,
P. Schmuki, Hydroxyapatite growth on anodic TiO2 nanotubes, J. Biomed.
Mater. Res. Part A. 77A (2006) 534–541. doi:10.1002/jbm.a.30677.
[77] V.P. Parkhutik, V.I. Shershulsky, Theoretical modelling of porous oxide
growth on aluminium, J. Phys. D. Appl. Phys. 25 (1992) 1258.
doi:10.1088/0022-3727/25/8/017.
[78] G.K. Grimes, Craig A., Mor, TiO2 nanotube arrays: synthesis, properties, and
applications, 2009. doi:10.1007/978-1-4419-0068-5.
[79] A. Jaroenworaluck, D. Regonini, C.R. Bowen, R. Stevens, D. Allsopp, Macro,
micro and nanostructure of TiO 2 anodised films prepared in a fluorine-
containing electrolyte, J. Mater. Sci. 42 (2007) 6729–6734.
doi:10.1007/s10853-006-1474-9.
[80] S. Minagar, C.C. Berndt, J. Wang, E. Ivanova, C. Wen, A review of the
application of anodization for the fabrication of nanotubes on metal implant
surfaces, Acta Biomater. 8 (2012) 2875–2888.
doi:10.1016/j.actbio.2012.04.005.
[81] B.J. Hwang, J.R. Hwang, Kinetic model of anodic oxidation of titanium in
sulphuric acid, J. Appl. Electrochem. 23 (1993) 1056–1062.
doi:10.1007/BF00266129.

References 197
[82] V. Etacheri, C. Di Valentin, J. Schneider, D. Bahnemann, S.C. Pillai, Visible-
light activation of TiO2 photocatalysts: Advances in theory and experiments,
J. Photochem. Photobiol. C Photochem. Rev. 25 (2015) 1–29.
doi:10.1016/j.jphotochemrev.2015.08.003.
[83] K. Huo, B. Gao, J. Fu, L. Zhao, P.K. Chu, Fabrication, modification, and
biomedical applications of anodized TiO2 nanotube arrays, Rsc Adv. 4
(2014) 17300–17324. doi:10.1039/c4ra01458h.
[84] J.M. Macak, H. Tsuchiya, A. Ghicov, K. Yasuda, R. Hahn, S. Bauer, P.
Schmuki, TiO2 nanotubes: Self-organized electrochemical formation,
properties and applications, Curr. Opin. Solid State Mater. Sci. 11 (2007) 3–
18. doi:10.1016/j.cossms.2007.08.004.
[85] K. Indira, U.K. Mudali, T. Nishimura, N. Rajendran, A Review on TiO2
Nanotubes: Influence of Anodization Parameters, Formation Mechanism,
Properties, Corrosion Behavior, and Biomedical Applications, J. Bio- Tribo-
Corrosion. 1 (2015) 1–22. doi:10.1007/s40735-015-0024-x.
[86] L. Le Guéhennec, A. Soueidan, P. Layrolle, Y. Amouriq, Surface treatments
of titanium dental implants for rapid osseointegration, Dent. Mater. 23 (2007)
844–854. doi:10.1016/j.dental.2006.06.02.
[87] S.A. Cho, K.T. Park, The removal torque of titanium screw inserted in rabbit
tibia treated by dual acid etching, Biomaterials. 24 (2003) 3611–3617.
doi:10.1016/S0142-9612(03)00218-7.
[88] J.Y. Park, J.E. Davies, Red blood cell and platelet interactions with titanium
implant surfaces, Clin. Oral Implants Res. 11 (2000) 530–539.
doi:10.1034/j.1600-0501.2000.011006530.x.
[89] H. Kim, F. Miyaji, T. Kokubo, T. Nakamura, Preparation of bioactive Ti and its
alloys via simple chemical surface treatment, J. Biomed. Mater. Res. An Off.
J. Soc. Biomater. Japanese Soc. Biomater. 32 (1996) 409–417.

Influence of surface treatments on corrosion resistance
properties of ultrafine grained Titanium alloys for implant applications 198
doi:10.1002/(sici)1097-4636(199611)32:3<409::aid-jbm14>3.0.co;2-.
[90] T. Kokubo, H. Kim, M. Kawashita, Novel bioactive materials with different
mechanical properties, 24 (2003) 2161–2175. doi:10.1016/S0142-
9612(03)00044-9.
[91] S. Thomas, R. Thomas, A.K. Zachariah, R.K. Mishra, Spectroscopic
Methods for Nanomaterials Characterization, Elsevier, 2017.
[92] C. Duret-Thual, Understanding corrosion: basic principles, Underst.
Biocorrosion Fundam. Appl. (2014) 1. doi:10.1533/9781782421252.1.3.
[93] Y.S. Jiménez, M.T. Gil, M.T. Guerra, L. Baltes, J.M. Rosca, Interpretation of
open circuit potential of two titanium alloys for a long time immersion in
physiological fluid, Bull. Transilv. Univ. Braşov• Vol. 2 (2009) 51.
[94] J. Tafel, Über die Polarisation bei kathodischer Wasserstoffentwicklung,
Zeitschrift Für Phys. Chemie. 50 (1905) 641–712. doi:10.1515/zpch-1905-
5043.
[95] R.A. Buchanan, E.E. Stansbury, 4-Electrochemical Corrosion, (2012).
doi:10.1016/B978-1-4377-3455-3.00004-3.
[96] R.M. Cardoso, R.M. Dornellas, A.P. Lima, R.H.O. Montes, E.M. Richter,
R.A.A. Munoz, Batch-Injection Amperometric Determination of Pyrogallol in
Biodiesel Using a Multi-Walled Carbon Nanotube Modified Electrode, J.
Braz. Chem. Soc. 28 (2017) 1650–1656. doi:10.21577/0103-5053.20160316.
[97] A. Lasia, Electrochemical impedance spectroscopy and its applications, in:
Springer, Springer, 2014: pp. 49–52. doi:10.1007/978-1-4614-8933-7.
[98] D. Loveday, P. Peterson, B. Rodgers, Evaluation of organic coatings with
electrochemical impedance spectroscopy, JCT Coatings Tech. 8 (2004) 46–
52.

References 199
[99] G. Instruments, Basics of electrochemical impedance spectroscopy, G.
Instruments, Complex Impedance Corros. (2007) 1–30.
[100] M.E. Orazem, B. Tribollet, An integrated approach to electrochemical
impedance spectroscopy, Electrochim. Acta. 53 (2008) 7360–7366.
[101] N. Perez, Electrochemistry and Corrosion Science, Elsevier, 2016.
doi:10.1007/978-3-319-24847-9.
[102] J.R. Macdonald, Impedence Spectroscopy--Emphasizing Solid Materials and
Systems, Wiley-Interscience, John Wiley Sons,. (1987) 1–346.
[103] B. Hirschorn, M.E. Orazem, B. Tribollet, V. Vivier, I. Frateur, M. Musiani,
Determination of effective capacitance and film thickness from constant-
phase-element parameters, Electrochim. Acta. 55 (2010) 6218–6227.
doi:10.1016/j.electacta.2009.10.065.
[104] B. Torres, A. Seyeux, S. Zanna, B. Tribollet, P. Marcus, I. Frateur, Influence
of BSA adsorption on the oxide layers developed on 70Cu-30Ni alloy in static
artificial seawater, Matériaux Tech. 101 (2013) 106.
[105] M.E. Orazem, I. Frateur, B. Tribollet, V. Vivier, S. Marcelin, N. Pébère, A.L.
Bunge, E.A. White, D.P. Riemer, M. Musiani, Dielectric properties of
materials showing constant-phase-element (CPE) impedance response, J.
Electrochem. Soc. 160 (2013) C215–C225.
[106] G. Sha, L. Yao, X. Liao, S.P. Ringer, Z.C. Duan, T.G. Langdon, Segregation
of solute elements at grain boundaries in an ultrafine grained Al–Zn–Mg–Cu
alloy, Ultramicroscopy. 111 (2011) 500–505.
doi:10.1016/j.ultramic.2010.11.013.
[107] C. Xu, M. Furukawa, Z. Horita, T.G. Langdon, Influence of ECAP on
precipitate distributions in a spray-cast aluminum alloy, Acta Mater. 53
(2005) 749–758. doi:10.1016/j.actamat.2004.10.026.

Influence of surface treatments on corrosion resistance
properties of ultrafine grained Titanium alloys for implant applications 200
[108] Y. Miyajima, M. Mitsuhara, S. Hata, H. Nakashima, N. Tsuji, Quantification of
internal dislocation density using scanning transmission electron microscopy
in ultrafine grained pure aluminium fabricated by severe plastic deformation,
Mater. Sci. Eng. A. 528 (2010) 776–779. doi:10.1016/j.msea.2010.09.058.
[109] I.J. Beyerlein, R.A. Lebensohn, C.N. Tome, Modeling texture and
microstructural evolution in the equal channel angular extrusion process,
Mater. Sci. Eng. A. 345 (2003) 122–138. doi:10.1016/S0921-5093(02)00457-
4.
[110] S. Parithimarkalaignan, T. V Padmanabhan, Osseointegration: an update, J.
Indian Prosthodont. Soc. 13 (2013) 2–6. doi:10.1007/s13191-013-0252-z.
[111] E.M. Rivera-Muñoz, R. Velázquez-Castillo, S. Alonso-Sierra, J.R. Alanís-
Gómez, B. Millán-Malo, L. Bucio-Galindo, R. Huirache-Acuña, A. Manzano-
Ramírez, R. Nava, M. Apátiga-Castro, HAp Nanofibers Grown with
Crystalline Preferential Orientation and Its Influence in Mechanical Properties
of Organic-Inorganic Composite Materials, in: Hydroxyapatite-Advances
Compos. Nanomater. Biomed. Appl. Its Technol. Facet., InTech, 2018.
doi:10.5772/intechopen.71850.
[112] J. Venkatesan, S.-K. Kim, Chitosan composites for bone tissue
engineering—an overview, Mar. Drugs. 8 (2010) 2252–2266.
doi:10.3390/md8082252.
[113] C. Zhao, X. Zhang, P. Cao, Mechanical and electrochemical characterization
of Ti–12Mo–5Zr alloy for biomedical application, J. Alloys Compd. 509 (2011)
8235–8238. doi:10.1016/j.jallcom.2011.05.090.
[114] G. Lütjering, Influence of processing on microstructure and mechanical
properties of (α+ β) titanium alloys, Mater. Sci. Eng. A. 243 (1998) 32–45.
doi:10.1016/S0921-5093(97)00778-8.
[115] P. Majumdar, S.B. Singh, M. Chakraborty, The role of heat treatment on

References 201
microstructure and mechanical properties of Ti-13Zr-13Nb alloy for
biomedical load bearing applications., J. Mech. Behav. Biomed. Mater. 4
(2011) 1132–44. doi:10.1016/j.jmbbm.2011.03.023.
[116] J. Davidson, A. Mishra, New surface-hardened, low-modulus, corrosion-
resistant Ti-13Nb-13Zr alloy for total hip arthroplasty, Bio-Medical Mater. 4
(1994) 231–243. doi:10.3233/BME-1994-4310.
[117] J. Qazi, V. Tsakiris, B. Marquardt, H. Rack, Effect of aging treatments on the
tensile properties of Ti-35Nb-7Zr-5Ta-(0.06-0.7)O alloys, 2004.
doi:10.1520/JAI12780.
[118] F. Hilario, V. Roche, R.P. Nogueira, A.M.J. Junior, Influence of morphology
and crystalline structure of TiO2 nanotubes on their electrochemical
properties and apatite-forming ability, Electrochim. Acta. 245 (2017) 337–
349. doi:10.1016/j.electacta.2017.05.160.
[119] A. Sadkowski, J. Diard, On the Fletcher ’ s two-terminal equivalent network
of a three-terminal electrochemical cell, Electrochim. Acta. 55 (2010) 1907–
1911. doi:10.1016/j.electacta.2009.11.008.
[120] T. Kokubo, H. Takadama, How useful is SBF in predicting in vivo bone
bioactivity?, Biomaterials. 27 (2006) 2907–2915.
doi:10.1016/j.biomaterials.2006.01.017.
[121] R. Kamalian, A. Yazdanpanah, F. Moztarzadeh, R. Ravarian, Z.
Moztarzadeh, M. Tahmasbi, M. Mozafari, Synthesis and characterization of
bioactive glass/forsterite nanocomposites for bone implants, Ceramics-
Silikáty. 56 (2012) 331–340.
[122] E. ASTM, Standard test method for dynamic young’s modulus, shear
modulus, and poisson’s ratio by impulse excitation of vibration, Annu. B.
ASTM Stand. 3 (2005).
[123] L.B. Otani, A.H.A. Pereira, J.D.D. Melo, S.C. Amico, Elastic Moduli

Influence of surface treatments on corrosion resistance
properties of ultrafine grained Titanium alloys for implant applications 202
characterization of composites using the Impulse Excitation, ATCP Phys.
Eng. (2014).
[124] K.N. Fish, M.W. Davidson, Fluorescent Biomarkers in Neurons, in: L.R.B.T.-
E. of N. Squire (Ed.), Academic Press, Oxford, 2009: pp. 261–271.
doi:https://doi.org/10.1016/B978-008045046-9.02003-9.
[125] H.A. Franco, C.R.M. Silva, J.L.A. Ferreira, J.A. Araújo, Fatigue Strength of
Ti-35Nb-7Zr-5Ta, in: Mater. Sci. Forum, Trans Tech Publ, 2012: pp. 73–79.
doi:10.4028/www.scientific.net/MSF.727-728.73.
[126] Y. Ji, K.-C. Lin, H. Zheng, J. Zhu, A.C.S. Samia, Fabrication of double-walled
TiO2 nanotubes with bamboo morphology via one-step alternating voltage
anodization, Electrochem. Commun. 13 (2011) 1013–1015.
doi:10.1016/j.elecom.2011.06.030.
[127] A. Ibrahim, W. Mekprasart, W. Pecharapa, Anatase/Rutile TiO2 composite
prepared via sonochemical process and their photocatalytic activity, Mater.
Today Proc. 4 (2017) 6159–6165. doi:10.1016/j.matpr.2017.06.110.
[128] L. Jonášová, F.A. Müller, A. Helebrant, J. Strnad, P. Greil, Biomimetic apatite
formation on chemically treated titanium, Biomaterials. 25 (2004) 1187–1194.
doi:10.1016/j.biomaterials.2003.08.009.
[129] J.-H. Yi, C. Bernard, F. Variola, S.F. Zalzal, J.D. Wuest, F. Rosei, A. Nanci,
Characterization of a bioactive nanotextured surface created by controlled
chemical oxidation of titanium, Surf. Sci. 600 (2006) 4613–4621.
doi:10.1016/j.susc.2006.07.053.
[130] F.A. Müller, M.C. Bottino, L. Müller, V.A.R. Henriques, U. Lohbauer, A.H.A.
Bressiani, J.C. Bressiani, In vitro apatite formation on chemically treated
(P/M) Ti–13Nb–13Zr, Dent. Mater. 24 (2008) 50–56.
doi:10.1016/j.dental.2007.02.005.
[131] M.E. Orazem, N. Pébère, B. Tribollet, Enhanced graphical representation of

References 203
electrochemical impedance data, J. Electrochem. Soc. 153 (2006) B129–
B136. doi:10.1149/1.2168377.
[132] G. Huang, B. Svendsen, Z. Lu, Effect of surface energy on dislocation-
induced field in half-space with application to thin film-substrate systems,
Acta Mech. Solida Sin. 22 (2009) 436–442. doi:10.1016/S0894-
9166(09)60294-9.
[133] E. Rafiee, M. Farzam, M.A. Golozar, A. Ashrafi, An investigation on
dislocation density in cold-rolled copper using electrochemical impedance
spectroscopy, ISRN Corros. 2013 (2013). doi:10.1155/2013/921825.
[134] R.J. Twiss, Theory and applicability of a recrystallized grain size
paleopiezometer, in: Stress Earth, Springer, 1977: pp. 227–244.
[135] S.H. Zahiri, D. Fraser, M. Jahedi, Recrystallization of cold spray-fabricated
CP titanium structures, J. Therm. Spray Technol. 18 (2009) 16–22.
doi:10.1007/s11666-008-9212-2.
[136] S.L. de Assis, I. Costa, The effect of polarisation on the electrochemical
behavior of Ti-13Nb-13Zr alloy, Mater. Res. 10 (2007) 293–296.
doi:10.1590/S1516-14392007000300014.
[137] V. Augustyn, P. Simon, B. Dunn, Pseudocapacitive oxide materials for high-
rate electrochemical energy storage, Energy Environ. Sci. 7 (2014) 1597–
1614. doi:10.1039/C3EE44164D.
[138] A.K. Bhargava, M.K. Banerjee, 2.14 Heat-Treating Copper and Nickel Alloys,
(2017). doi:10.1016/B978-0-12-803581-8.09196-7.
[139] Y. Sasikumar, R. Nallaiyan, Effect of Acid Treatment on the Surface
Modification of Ti-6Al-7Nb and Ti-5Al-2Nb-1Ta and Its Electrochemical
Investigations in Simulated Body Fluid, 2017. doi:10.1007/s40735-017-0096-
x.

Influence of surface treatments on corrosion resistance
properties of ultrafine grained Titanium alloys for implant applications 204
[140] M. Bettayeb, V. Maurice, L.H. Klein, L. Lapeire, K. Verbeken, P. Marcus,
Nanoscale Intergranular Corrosion and Relation with Grain Boundary
Character as Studied In Situ on Copper, J. Electrochem. Soc. 165 (2018)
C835–C841. doi:10.1149/2.1341811jes.
[141] F.E.-T. Heakal, A.S. Mogoda, A.A. Mazhar, M.S. El-Basiouny, Kinetic studies
on the dissolution of the anodic oxide film on titanium in phosphoric acid
solutions, Corros. Sci. 27 (1987) 453–462. doi:10.1016/0010-938x(87)90089-
8.
[142] I.C. Lavos-Valereto, S. Wolynec, I. Ramires, A.C. Guastaldi, I. Costa,
Electrochemical impedance spectroscopy characterization of passive film
formed on implant Ti–6Al–7Nb alloy in Hank’s solution, J. Mater. Sci. Mater.
Med. 15 (2004) 55–59.
[143] I. Milošev, T. Kosec, H.-H. Strehblow, XPS and EIS study of the passive film
formed on orthopaedic Ti–6Al–7Nb alloy in Hank’s physiological solution,
Electrochim. Acta. 53 (2008) 3547–3558.
doi:10.1016/j.electacta.2007.12.041.
[144] I. Milošev, M. Metikoš-Huković, H.-H. Strehblow, Passive film on orthopaedic
TiAlV alloy formed in physiological solution investigated by X-ray
photoelectron spectroscopy, Biomaterials. 21 (2000) 2103–2113.
doi:10.1016/S0142-9612(00)00145-9.
[145] M. Aziz-Kerrzo, K.G. Conroy, A.M. Fenelon, S.T. Farrell, C.B. Breslin,
Electrochemical studies on the stability and corrosion resistance of titanium-
based implant materials, Biomaterials. 22 (2001) 1531–1539.
doi:10.1016/S0142-9612(00)00309-4.
[146] S.L. de Assis, S. Wolynec, I. Costa, Corrosion characterization of titanium
alloys by electrochemical techniques, Electrochim. Acta. 51 (2006) 1815–
1819. doi:10.1016/j.electacta.2005.02.121.

References 205
[147] M. De Vittorio, L. Martiradonna, J. Assad, Nanotechnology and
neuroscience: nano-electronic, photonic and mechanical neuronal
interfacing, Springer, 2014.
[148] F. Hilario, V. Roche, A. Jorge Junior, R. Nogueira, Application of the
transmission line model for porous electrodes to analyse the impedance
response of TiO 2 nanotubes in physiological environment, 2017.
doi:10.1016/j.electacta.2017.09.045.
[149] S.A.A. Yahia, L. Hamadou, A. Kadri, N. Benbrahim, E.M.M. Sutter, Effect of
anodizing potential on the formation and EIS characteristics of TiO2
nanotube arrays, J. Electrochem. Soc. 159 (2012) K83–K92.
doi:10.1149/2.077204jes.
[150] L. Hamadou, L. Aïnouche, A. Kadri, S.A.A. Yahia, N. Benbrahim,
Electrochemical impedance spectroscopy study of thermally grown oxides
exhibiting constant phase element behaviour, Electrochim. Acta. 113 (2013)
99–108.
[151] P. Pu, H. Cachet, E.M.M. Sutter, Electrochemical impedance spectroscopy
to study photo-induced effects on self-organized TiO2 nanotube arrays,
Electrochim. Acta. 55 (2010) 5938–5946.
doi:10.1016/j.electacta.2010.05.048.
[152] A.G. Munoz, Semiconducting properties of self-organized TiO2 nanotubes,
Electrochim. Acta. 52 (2007) 4167–4176.
doi:10.1016/j.electacta.2006.11.035.
[153] W. Yu, Development of nanostructured materials based on manganese
oxides and produced by an electrochemical method for water electrolysis,
(2016).
[154] M. Stępień, P. Handzlik, K. Fitzner, Electrochemical synthesis of oxide
nanotubes on Ti6Al7Nb alloy and their interaction with the simulated body

Influence of surface treatments on corrosion resistance
properties of ultrafine grained Titanium alloys for implant applications 206
fluid, J. Solid State Electrochem. 20 (2016) 2651–2661. doi:10.1007/s10008-
016-3258-8.
[155] A. Mazare, M. Dilea, D. Ionita, I. Demetrescu, Electrochemical behavior in
simulated body fluid of TiO2 nanotubes on TiAlNb alloy elaborated in various
anodizing electrolyte, Surf. Interface Anal. 46 (2014) 186–192.
doi:10.1002/sia.5364.
[156] C. Liu, Y. Wang, M. Wang, W. Huang, P.K. Chu, Electrochemical stability of
TiO2 nanotubes with different diameters in artificial saliva, Surf. Coatings
Technol. 206 (2011) 63–67. doi:10.1016/j.surfcoat.2011.06.038.
[157] W. Yu, J. Qiu, F. Zhang, In vitro corrosion study of different TiO2 nanotube
layers on titanium in solution with serum proteins, Colloids Surfaces B
Biointerfaces. 84 (2011) 400–405. doi:10.1016/j.colsurfb.2011.01.033.
[158] S. Ahmadi, I. Mohammadi, S.K. Sadrnezhaad, Hydroxyapatite based and
anodic titania nanotube biocomposite coatings: fabrication, characterization
and electrochemical behavior, Surf. Coatings Technol. 287 (2016) 67–75.
doi:10.1016/j.surfcoat.2015.12.062.
[159] L. Aïnouche, L. Hamadou, A. Kadri, N. Benbrahim, D. Bradai, Interfacial
barrier layer properties of three generations of TiO2 nanotube arrays,
Electrochim. Acta. 133 (2014) 597–609. doi:10.1016/j.electacta.2014.04.086.
[160] J.M. Hernández-López, A. Conde, J.J. de Damborenea, M.A. Arenas,
Electrochemical response of TiO2 anodic layers fabricated on Ti6Al4V alloy
with nanoporous, dual and nanotubular morphology, Corros. Sci. 112 (2016)
194–203. doi:10.1016/j.corsci.2016.07.021.
[161] B. Munirathinam, L. Neelakantan, Titania nanotubes from weak organic acid
electrolyte: Fabrication, characterization and oxide film properties, Mater.
Sci. Eng. C. 49 (2015) 567–578. doi:10.1016/j.msec.2015.01.045.
[162] B. Munirathinam, L. Neelakantan, Role of crystallinity on the nanomechanical

References 207
and electrochemical properties of TiO2 nanotubes, J. Electroanal. Chem.
770 (2016) 73–83. doi:10.1016/j.jelechem.2016.03.032.
[163] B. Munirathinam, H. Pydimukkala, N. Ramaswamy, L. Neelakantan,
Influence of crystallite size and surface morphology on electrochemical
properties of annealed TiO2 nanotubes, Appl. Surf. Sci. 355 (2015) 1245–
1253. doi:10.1016/j.apsusc.2015.08.017.
[164] L. Mohan, C. Anandan, R. Nallaiyan, Electrochemical behavior and effect of
heat treatment on morphology, crystalline structure of self-organized TiO2
nanotube arrays on Ti–6Al–7Nb for biomedical applications, Mater. Sci. Eng.
C. 50 (2015) 394–401. doi:10.1016/j.msec.2015.02.013.
[165] P. Córdoba-Torres, N.T.C. Oliveira, C. Bolfarini, V. Roche, R.P. Nogueira,
Electrochemical impedance analysis of TiO2 nanotube porous layers based
on an alternative representation of impedance data, J. Electroanal. Chem.
737 (2015) 54–64. doi:10.1016/j.jelechem.2014.06.034.
[166] R. De Levie, On porous electrodes in electrolyte solutions: I. Capacitance
effects, Electrochim. Acta. 8 (1963) 751–780. doi:10.1016/0013-
4686(63)80042-0.
[167] R. De Levie, On porous electrodes in electrolyte solutions—IV, Electrochim.
Acta. 9 (1964) 1231–1245.
[168] R. De Levie, The influence of surface roughness of solid electrodes on
electrochemical measurements, Electrochim. Acta. 10 (1965) 113–130.
doi:10.1016/0013-4686(65)87012-8.
[169] J. Bisquert, G.G. Belmonte, F.F. Santiago, N.S. Ferriols, M. Yamashita, E.C.
Pereira, Application of a distributed impedance model in the analysis of
conducting polymer films, Electrochem. Commun. 2 (2000) 601–605.
doi:10.1016/S1388-2481(00)00089-8.
[170] F. Fabregat-Santiago, E.M. Barea, J. Bisquert, G.K. Mor, K. Shankar, C.A.

Influence of surface treatments on corrosion resistance
properties of ultrafine grained Titanium alloys for implant applications 208
Grimes, High Carrier Density and Capacitance in TiO2 Nanotube Arrays
Induced by Electrochemical Doping, J. Am. Chem. Soc. 130 (2008) 11312–
11316. doi:10.1021/ja710899q.
[171] H. Han, P. Sudhagar, T. Song, Y. Jeon, I. Mora-Seró, F. Fabregat-Santiago,
J. Bisquert, Y.S. Kang, U. Paik, Three dimensional-TiO2 nanotube array
photoanode architectures assembled on a thin hollow nanofibrous backbone
and their performance in quantum dot-sensitized solar cells, Chem.
Commun. 49 (2013) 2810–2812. doi:10.1039/C3CC40439K.
[172] A. Lasia, Modeling of impedance of porous electrodes, in: Model. Numer.
Simulations, Springer, 2008: pp. 67–137. doi:10.1007/978-0-387-49582-8_3.
[173] O.E. Barcia, E. D’Elia, I. Frateur, O.R. Mattos, N. Pébère, B. Tribollet,
Application of the impedance model of de Levie for the characterization of
porous electrodes, Electrochim. Acta. 47 (2002) 2109–2116.
doi:10.1016/S0013-4686(02)00081-6.
[174] J. Bisquert, Influence of the boundaries in the impedance of porous film
electrodes, Phys. Chem. Chem. Phys. 2 (2000) 4185–4192.
doi:10.1039/B001708F.
[175] J. Bisquert, A. Compte, Theory of the electrochemical impedance of
anomalous diffusion, J. Electroanal. Chem. 499 (2001) 112–120.
doi:10.1016/S0022-0728(00)00497-6.
[176] J. Garche, C.K. Dyer, P.T. Moseley, Z. Ogumi, D.A.J. Rand, B. Scrosati,
Encyclopedia of electrochemical power sources, Newnes, 2013.
[177] J. Landesfeind, J. Hattendorff, A. Ehrl, W.A. Wall, H.A. Gasteiger, Tortuosity
determination of battery electrodes and separators by impedance
spectroscopy, J. Electrochem. Soc. 163 (2016) A1373–A1387.
doi:10.1149/2.1141607jes.
[178] J. Song, M.Z. Bazant, Effects of nanoparticle geometry and size distribution

References 209
on diffusion impedance of battery electrodes, J. Electrochem. Soc. 160
(2013) A15–A24. doi:10.1149/2.023301jes.
[179] O.L. Riabokin, O. V Bojchuk, K.D. Pershina, Estimation of the primary
batteries state of charge and state of art by frequency characteristics of
electrochemical impedance spectra, Перспективні Матеріали Та Процеси в
Прикладній Електрохімії-2018. (2018).
[180] S.J. Cooper, A. Bertei, D.P. Finegan, N.P. Brandon, Simulated impedance of
diffusion in porous media, Electrochim. Acta. 251 (2017) 681–689.
doi:10.1016/j.electacta.2017.07.152.
[181] S. Ban, Y. Iwaya, H. Kono, H. Sato, Surface modification of titanium by
etching in concentrated sulfuric acid, Dent. Mater. 22 (2006) 1115–1120.
doi:10.1016/j.dental.2005.09.007.
[182] L. Jonášová, F.A. Müller, A. Helebrant, J. Strnad, P. Greil, Hydroxyapatite
formation on alkali-treated titanium with different content of Na+ in the
surface layer, Biomaterials. 23 (2002) 3095–3101.
[183] H.-M. Kim, F. Miyaji, T. Kokubo, T. Nakamura, Apatite-forming ability of
alkali-treated Ti metal in body environment, J. Ceram. Soc. Japan. 105
(1997) 111–116.
[184] S. Tanaka, M. Aonuma, N. Hirose, T. Tanaki, The preparation of porous
TiO2 by immersing Ti in NaOH solution, J. Electrochem. Soc. 149 (2002)
D167–D171. doi:10.1149/1.1512672.
[185] M.E. Orazem, B. Tribollet, Electrochemical impedance spectroscopy, John
Wiley & Sons, 2017.
[186] A. Tiwari, L. Hihara, J. Rawlins, Intelligent coatings for corrosion control,
Butterworth-Heinemann, 2014.
[187] S. Tamilselvi, V. Raman, N. Rajendran, Corrosion behaviour of Ti–6Al–7Nb
Influence of surface treatments on corrosion resistance
properties of ultrafine grained Titanium alloys for implant applications 210
and Ti–6Al–4V ELI alloys in the simulated body fluid solution by
electrochemical impedance spectroscopy, Electrochim. Acta. 52 (2006) 839–
846.
[188] H. Nishikawa, T. Hasegawa, A. Miyake, Y. Tashiro, Y. Hashimoto, D.H.A.
Blank, G. Rijnders, Relationship between the Ca/P ratio of hydroxyapatite
thin films and the spatial energy distribution of the ablation laser in pulsed
laser deposition, Mater. Lett. 165 (2016) 95–98.
doi:10.1016/j.matlet.2015.11.115.
[189] M. Vallet-Regí, D.A. Navarrete, Nanoceramics in clinical use: from materials
to applications, Royal Society of Chemistry, 2015.
[190] E. Wintermantel, S.-W. Ha, Medizintechnik: Life Science Engineering,
Springer Science & Business Media, 2009. doi:10.1007/978-3-540-93936-8.
[191] W.Y. Guo, J. Sun, J.S. Wu, Effect of deformation on corrosion behavior of
Ti–23Nb–0.7 Ta–2Zr–O alloy, Mater. Charact. 60 (2009) 173–177.
doi:10.1016/j.matchar.2008.08.006.
[192] Y. Wang, J. C. Ho, Y. Cao, X. Liao, H. Q. Li, Y. H. Zhao, E. Lavernia, S.
Ringer, Y. Zhu, Dislocation density evolution during high pressure torsion of
a nanocrystalline NiFe alloy, 2009. doi:10.1063/1.3095852.
[193] M. Borodachenkova, W. Wen, A.M. de Bastos Pereira, High‐Pressure
Torsion: Experiments and Modeling, in: Sev. Plast. Deform. Tech.,
IntechOpen, 2017. doi:10.5772/intechopen.69173.
[194] Y.C. Wang, T.G. Langdon, Effect of heat treatment on microstructure and
microhardness evolution in a Ti–6Al–4V alloy processed by high-pressure
torsion, J. Mater. Sci. 48 (2012) 4646–4652. doi:10.1007/s10853-012-7071-
1.
[195] S. Zherebtsov, I.P. Semenova, H. Garbacz, M. Motyka, Chapter 6 -
Advanced mechanical properties, in: H. Garbacz, I.P. Semenova, S.

References 211
Zherebtsov, M.B.T.-N.T. Motyka (Eds.), Micro Nano Technol., Elsevier, 2019:
pp. 103–121. doi:10.1016/B978-0-12-814599-9.00006-7.
[196] S. Minagar, Surface nanoengineering of titanium alloys for biomedical
applications, (2015).
[197] X. Liu, P.K. Chu, C. Ding, Surface modification of titanium, titanium alloys,
and related materials for biomedical applications, Mater. Sci. Eng. R Reports.
47 (2004) 49–121. doi:10.1016/j.mser.2004.11.001.
[198] M. Mucalo, Hydroxyapatite (HAp) for biomedical applications, Elsevier, 2015.
[199] A. Tampieri, S. Sprio, Bio-Inspired Regenerative Medicine: Materials,
Processes, and Clinical Applications, CRC Press, 2016.
[200] S. Yamaguchi, H. Hashimoto, R. Nakai, H. Takadama, Impact of Surface
Potential on Apatite Formation in Ti Alloys Subjected to Acid and Heat
Treatments, Materials (Basel). 10 (2017) 1127. doi:10.3390/ma10101127.
[201] T. Kokubo, S. Yamaguchi, Novel bioactive titanate layers formed on Ti metal
and its alloys by chemical treatments, Materials (Basel). 3 (2010) 48–63.
doi:10.3390/ma3010048.


Résumé détaillé en Français 213
INFLUENCE DE TRAITEMENTS DE SURFACE SUR LES PROPRIETES DE
RESISTANCE A LA CORROSION D'ALLIAGES DE TITANE A GRAINS
ULTRAFINS POUR DES APPLICATIONS BIOMEDICALES.
RÉSUMÉ DÉTAILLÉ EN FRANÇAIS
INTRODUCTION
Les dispositifs biomédicaux utilisés (prothèses, implants) fonctionnent de
manière satisfaisante dans de nombreux cas. Cependant, parfois, le corps réagit à
la présence de l’implant ce qui peut entraîner son remplaçant rapide. Dans ce
contexte, le titane (Ti) et ses alliages sont les matériaux les plus utilisés pour les
implants orthopédiques et dentaires en raison de leur excellente biocompatibilité et
résistance à la corrosion [1].
Cependant, les propriétés mécaniques du titane et de ses alliages devraient
être proches du tissu osseux, condition préalable au succès des implants
orthopédiques. Dans ce contexte, les alliages (α+β) et β ont suscité un intérêt
considérable, car ils présentent un faible module d'élasticité, ce qui permet une
meilleure interaction entre l'implant et l'os [2]. De plus, les alliages (α+β) et β
peuvent être obtenus à partir d'éléments métalliques considérés
comme biocompatibles comme Nb, Ta, Zr, Mo et Sn [3].
Les investigations récentes menées sur le module d'élasticité ont permis le
développement d'une nouvelle génération d'alliages de titane pour les applications
orthopédiques, notamment le Ti29Nb13Ta4.6Zr [4], Ti12Mo6Zr2Fe (TMZF) [5],
Ti35Nb7Zr5Ta (TNZT) [6] et Ti13Nb13Zr [7].
En plus du module d'élasticité, d'autres propriétés mécaniques des alliages
de titane, tels que la dureté, la résistance et la ductilité, peuvent être
considérablement améliorées grâce à l'utilisation de techniques de déformations
mécaniques telles que les déformations plastiques sévères (SPD-Severe Plastic
Deformation) [8]. Ce procédé permet d’obtenir une microstructure avec des grains

Influence de traitements de surface sur les propriétés de résistance à la corrosion d’alliages de titane à grains ultrafins pour des applications biomédicales 214
ultrafins [9]. Les techniques de SPD les plus couramment appliquées sont
l'extrusion de canaux angulaires ((ECAP-Equal Channel Angular Pressing) et la
torsion sous haute pression (HPT-High Pressure Torsion) [10].
Notre équipe a étudié l'article intitulé "Ultrafine-Grained Ti13Nb13Zr Alloy
produced by Severe Plastic Deformation" [11]. Dans ce travail, l'effet de la
technique de torsion sous haute pression sur l'augmentation de la micro-dureté de
l'alliage Ti13Nb13Zr a été observé. La valeur de micro-dureté a augmenté de
manière significative de 220 HV à 402 HV avec une pression appliquée de
4,5 GPa. De plus, un affinement de la taille de grains (200 µm à l'état initial à 130
nm) a également été observé.
D'autre part, des travaux antérieurs sur le titane et les alliages de titane
traités par SPD se sont concentrés sur l'étude de la relation entre la microstructure
obtenue et les propriétés mécaniques [12–14]. Cependant, peu d'études
concernent la microstructure obtenue par le SPD et la résistance à la corrosion des
alliages de titane [15].
Le comportement en corrosion des alliages de titane dépend principalement
des propriétés du film passif (composition et épaisseur) et de la microstructure du
substrat (taille du grain et densité de déplacement) [16]. La faible vitesse de
dissolution et l'inertie chimique des produits de dissolution de la couche passive
d'oxyde de titane (TiO2) permettent à l'os de se développer et de se solidifier avec
la surface de l'alliage de titane [17].
Ainsi, la réponse biologique d'un implant dépend des propriétés physico-
chimiques de la surface [18]. Récemment, des méthodes de modification de la
surface des implants en titane ont été étudiées, telles que des revêtements au
phosphate de calcium (Ca3(PO4)2) [19], des traitements alcalins et thermiques [20],
des revêtements au plasma [21] et des nanotubes de TiO2 [22] pour améliorer
l'intégration des implants. Par conséquent, afin de progresser quant à la
compréhension des propriétés mécaniques et de la corrosion des matériaux à
base de titane pour les applications biomédicales, deux alliages de titane,

Résumé détaillé en Français 215
l'alliage Ti13Nb13Zr (α'+β) et l'alliage β Ti35Nb7Zr5Ta déformé par la
méthode HPT seront étudiés dans des conditions déjà définies dans un travail
précédent [11]. En outre, deux traitements de modification de surface différents
sont proposés : la croissance de nanotubes de titane (TiO2) et les traitements
chimiques sur des échantillons déformés HPT et des échantillons sans
déformation. Enfin, les effets des traitements de déformation plastique sévère et de
modification de surface seront évalués par des tests de corrosion et de bioactivité.
Déformation plastique sévère
Une stratégie pour améliorer les propriétés mécaniques du titane et de ses
alliages consiste à affiner la granulométrie par une déformation plastique sévère
(SPD-Severe Plastic Deformation). Les techniques de SPD les plus développées
sont l'extrusion en canal angulaire (ECAP-Equal Channel Angular Pressing),
torsion sous haute pression (HPT-High Pressure Torsion) et le laminage cumulatif
(ARB-Accumulative Roll Bonding) [9,10].
D'après les méthodes de déformation plastique sévère mentionnées ci-
dessus, le traitement HPT a montré un raffinement accru de la microstructure [9].
Les principes du traitement HPT moderne sont décrits schématiquement sur la
figure 1 [23].
.
Figure 1 : Schéma de principe de la Torsion sous Haute Pression (HPT). Adapté de
Zhilyaev et al., (2008) [23].

Influence de traitements de surface sur les propriétés de résistance à la corrosion d’alliages de titane à grains ultrafins pour des applications biomédicales 216
L’échantillon en forme de disque est positionné entre deux actionneurs, où il
est soumis à la pression appliquée, P, de quelques GPa à température ambiante
ou à chaud. Pendant que la pression est appliquée, une déformation par rotation
est réalisée sur l'éprouvette. Les forces de frottement sur la surface déforment le
disque par cisaillement. Le processus se déroule alors sous une pression presque
hydrostatique [23].
Dans ce projet, les alliages Ti13Nb13Zr et Ti35Nb7Zr5Ta sous forme de
disques de 10 mm de diamètre et 1 mm d'épaisseur sont traités par HPT. Le
traitement est effectué à la température ambiante. Les disques sont traités sous
des pressions de 1,0 et 4,5 GPa et trois tours sont appliqués avec une vitesse de
rotation de 3 rpm.
Traitements de modification de surface.
Le titane et ses alliages sont largement utilisés dans les dispositifs et
composants biomédicaux ainsi que dans les applications cardiaques et
cardiovasculaires, en raison de leurs propriétés recherchées, telles que leur
module d'élasticité relativement bas, leur bonne résistance à la fatigue, leur
usinabilité, résistance à la corrosion et biocompatibilité. Cependant, le titane et ses
alliages ne peuvent pas répondre à toutes les exigences cliniques en raison de
leurs propriétés tribologiques faibles [24]. Par conséquent, afin d'améliorer les
propriétés biologiques, chimiques et mécaniques du titane et des alliages de titane,
des traitements de modification de surface sont souvent effectués.
Nanotubes de TiO2.
Le titane est largement utilisé pour la fabrication de dispositifs biomédicaux
et, comme la surface de l'implant est responsable du processus d'ostéointégration,
il est essentiel de modifier cette surface pour obtenir une meilleure
biocompatibilité. De plus, l'adhérence d'une surface nanostructurée augmente par
rapport aux surfaces métalliques usuelles, démontrant ainsi que les nanotubes
améliorent l'ostéointégration. Les surfaces contenant des nanotubes de TiO2

Résumé détaillé en Français 217
augmentent la croissance cellulaire et les dépôts d'hydroxyapatite (HAp) [25].
L'hydroxyapatite (Ca10(PO4)6(OH)2) présente une similitude chimique et structurelle
avec le composant inorganique de la matrice osseuse.
Croissance de nanostructures de TiO2 par anodisation électrochimique.
Les tests d'anodisation sont généralement effectués sur une cellule
électrochimique à deux ou trois électrodes avec un alliage en titane comme anode,
une grille de platine comme cathode et, dans le cas d'une cellule à trois électrodes
avec une électrode Ag / AgCl comme électrode de référence. Un potentiel constant
est appliqué à l'aide d'une source d'alimentation en courant continu [13].
Les principaux processus de formation de nanotubes de TiO2 sont (1) la
croissance d'oxydes à la surface du métal due à l'interaction du métal avec les ions
O2- ou OH- [26]. Après formation d'une couche d'oxyde initiale, ces anions migrent
à travers la couche d'oxyde pour atteindre l'interface métal / oxyde où ils
réagissent avec le métal. (2) migration des ions métalliques (Ti4+) du métal à
l'interface métal / oxyde ; les cations Ti4+ seront éjectés de l'interface métal / oxyde
sous l'application d'un champ électrique qui se déplacera vers l'interface oxyde /
électrolyte [27]. (3) Oxydation assistée par le champ électrique de l'oxyde à
l'interface oxyde / électrolyte. En raison du champ électrique appliqué, la liaison Ti-
O subit une polarisation et est affaiblie, ce qui favorise la dissolution des cations
métalliques. Les cations Ti4+ se dissolvent dans l'électrolyte et les anions sans O2-
migrent vers l'interface métal / oxyde, processus (1), pour interagir avec le métal
[27]. (4) Dissolution chimique du métal, ou de l'oxyde, par l'électrolyte acide. La
dissolution chimique du TiO2 dans l'électrolyte HF joue un rôle crucial dans la
formation de nanotubes, plutôt que de simples structures nanoporeuses [27].
Dans le présent travail, la formation de nanotubes de TiO2 par anodisation
électrochimique des alliages Ti13Nb13Zr et Ti35Nb7Zr5Ta a été réalisée à l'aide
de solutions organiques contenant des fluorures.
Structure cristalline de nanotubes de TiO2 et traitements thermiques.

Influence de traitements de surface sur les propriétés de résistance à la corrosion d’alliages de titane à grains ultrafins pour des applications biomédicales 218
Après l'anodisation, les nanotubes de TiO2 sont généralement amorphes.
[28,29]. Après le traitement thermique (généralement sous air ou oxygène), les
nanotubes de TiO2 peuvent cristalliser sous forme anatase ou rutile ; la conversion
en structure cristallisée peut avoir un impact significatif sur les propriétés
mécaniques, optiques, électroniques, chimiques et biomédicales [30].
Pour ce projet, un traitement thermique a été réalisé sur des surfaces avec
des nanotubes de TiO2, à une température de 550 ° C pendant deux heures pour
former un mélange de phases anatase et rutile.
Traitement acide.
Le traitement à l'acide est souvent utilisé pour éliminer l'oxyde et la
contamination afin d'obtenir des finitions de surface propres et uniformes, générant
également une microrugosité de surface. Takeuchi et al. (2003) ont étudié
l'efficacité de décontamination de trois acides, Na2S2O8, H2SO4 et HCl, pour la
surface de titane et ont découvert que HCl était un excellent agent de
décontamination, car il pouvait facilement dissoudre les sels de titane et ne
fragilisait pas la surface de Ti [17]. Il a été démontré que l'attaque acide améliore
grandement l'ostéointégration, car elle favorise la formation de tissu osseux entre
l'implant et l'interface osseuse [31]. Pour ce travail, les acides chlorhydriques et
phosphorique ont été testés afin de déterminer quel acide favorise la formation
d'hydroxyapatite.
Traitement alcalin.
Une méthode chimique simple a été établie pour induire la bioactivité du
titane et de ses alliages. Lorsque des substrats en alliage de titane ont été traités
avec une solution aqueuse de NaOH 10 M et ensuite traités thermiquement à
60°C, une mince couche de titanate de sodium s'est formée sur ses surfaces [32].
Ainsi, les substrats traités formaient une couche d'apatite dense et uniforme sur
leurs surfaces dans un fluide corporel simulé (SBF-Simulated Body Fluid) avec des
concentrations ioniques presque égales à celles du plasma sanguin humain [32].

Résumé détaillé en Français 219
Caractérisation initiale d'échantillons d'alliage Ti13Nb13Zr.
Différentes surface sont étudiées dans ce travail et le tableau 1 résume
toutes les surfaces modifiées avec et sans déformation plastique sévère utilisées
dans les tests de corrosion et de bioactivité.
Tableau 1 : Surfaces de travail initial de l’alliage Ti13Nb13Zr avec différents traitements
de modification de surface et avec et sans traitement par HPT.

Influence de traitements de surface sur les propriétés de résistance à la corrosion d’alliages de titane à grains ultrafins pour des applications biomédicales 220
Caractérisation électrochimique.
Alliage Ti13Nb13Zr.
Pour reproduire au plus près des conditions du corps humain, les mesures
électrochimiques sont effectuées dans un environnement physiologique. Une
solution simulant un fluide corporel (SBF-Simulated Body Fluid) a été utilisée
comme électrolyte (NaCl 8,035 g L-1, KCl 0,225 g L-1, NaHCO3 0,355 g L-1,
K2HPO4·3H2O 0,231 g L-1, MgCl2·6H2O 0,311 g L-1, CaCl2 0,292 g L-1 e Na2SO4
0,072 g L-1). Il reproduit la partie inorganique du plasma sanguin humain (ne
contient pas de composition organique ni de cellules). Dans cette étude, la solution
de SBF a été préparée, selon le protocole détaillé proposé par Kokubo et al.(2006)
[33] et dans la norme ISO 23317:2014.
Les mesures électrochimiques présentées ci-dessous sont donc destinées à
évaluer l'impact du traitement de modification de surface et de la déformation
plastique sévère sur les propriétés électrochimiques dans la solution SBF pour
l'alliage Ti13Nb13Zr. Les conditions pour les tests électrochimiques effectués pour
toutes les conditions existantes et pour les deux alliages (Ti13Nb13Zr et
Ti35Nb7Zr5Ta) sont les suivantes :
• Afin de reproduire au mieux les conditions physiologiques, toutes les
mesures se font à l'obscurité.
• Pour des raisons de reproductibilité, les mesures sont répétées trois fois
(sur un échantillon différent à chaque fois, mais avec la même morphologie
et la même structure cristalline).
• Les courbes de polarisation sont enregistrées dans une plage de potentiel
de -30 mV à +1,20 V par rapport au potentiel de circuit ouvert (OCP), avec
une vitesse de balayage de 0,50 mV s-1.
• Les mesures de spectroscopie d'impédance sont enregistrées pour une
gamme de fréquences de 20 kHz à 20 mHz. L'amplitude du signal de
perturbation sinusoïdale est de 10 mVrms.

Résumé détaillé en Français 221
• Les simulations des spectres EIS de tous les échantillons ont été réalisées
à l'aide du logiciel Simad (développé parle laboratoire LISE).
Échantillons polis.
Les figures 2((a) et (b)) présentent les courbes de polarisation anodiques et
les diagrammes de Nyquist, respectivement, dans SBF à 37°C des échantillons de
surface poli de l'alliage Ti13Nb13Zr non déformés et déformés par HPT.
-0,8 -0,4 0,0 0,4 0,810
-10
10-9
10-8
10-7
10-6
10-5
10-4
i (A
/ c
m2)
E vs SCE (V)
Sans déformation
1 GPa, 3 tours
4.5 GPa, 3 tours
Sans déformation
1 GPa
4.5 GPa
0,0 5,0x10⁴
1,0x10⁵
0,0
5,0x10⁴
1,0x10⁵
1,5x10⁵
-''(
c
m2
)
'( cm2
)
Figure 2 : Courbes de polarisation anodiques (a) et diagrammes de Nyquist (b) des
échantillons polis de l'alliage Ti-13Zr-13Nb non déformés et déformés par HPT en milieu
physiologique dans une solution de SBF à pH 7,4 à 37 ° C.
Les densités de courant, représentées sur l'axe des ordonnées de la figure
2(a), ont été calculées en divisant le courant mesuré par la surface géométrique
(0,283 cm²). On considère que le courant mesuré dans la région anodique est
principalement dû à la réaction d'oxydation des substrats en TiO2, ce qui contribue
à l'épaississement de la couche passive. Cette réaction se produit à l'interface
métal / oxyde [30].
Les courants de passivation sont similaires pour les conditions non
déformées eet déformées par HPT. Initialement pour un échantillon sans
a) b)

Influence de traitements de surface sur les propriétés de résistance à la corrosion d’alliages de titane à grains ultrafins pour des applications biomédicales 222
déformation, le courant de passivation a une valeur approximative : 2,00 µA / cm2.
Pour les échantillons présentant une déformation plastique sévère, les courants de
passivation sont les suivants: 2,95 µA / cm2 pour l'échantillon présentant une
déformation de 1 GPa et 2,45 µA / cm2 pour l'échantillon présentant une
déformation de 4,5 GPa. Par conséquent, une déformation plastique sévère n'a
pas d'effet significatif sur le courant de passivation des échantillons déformés par
rapport au échantillons sans déformation.
Afin de compléter la caractérisation électrochimique des surfaces polies, les
échantillons ont été soumis à des mesures de spectroscopie d'impédance
électrochimique. La figure 2(b) montre les mesures d'impédance en représentation
de Nyquist. L'observation des diagrammes de Nyquist révèle que la forme du
spectre d'impédance de tous les substrats (arc) est typique d'un système capacitif-
résistif (associations de phénomènes capacitifs, c'est-à-dire accumulations de
charges et phénomènes résistifs, liés à la charge ou la résistance d'une couche).
Les spectres d'impédance expérimentaux ont été modelisés par un circuit
électrique équivalent approprié décrivant les propriétés du système étudié. Nous
avons envisagé pour les échantillons un modèle qui représente une structure à
deux couches composées d'une couche interne dense et d'une couche externe
poreuse sur l'alliage Ti13Nb13Zr. La figure 3 montre le modèle sélectionné qui est
représenté par un circuit équivalent Rs + Qa / (Ra+ (Qdl / Rct)). Où Rs est la
résistance de la solution, Ra est la résistance de la couche externe poreuse, Rct
représente la résistance de transfert de charge, Qa est l'élément à phase constante
pour la couche externe poreuse et Qdl est l'élément à phase constante pour la
double couche à l'interface couche interne dense-électrolyte.

Résumé détaillé en Français 223
Figure 3 : Circuit électrique équivalent utilisé pour modéliser les résultats d'échantillons
d'alliage Ti13Nb13Zr non déformés et déformés par HPT en milieu physiologique dans
une solution de SBF à pH 7,4 à 37 ° C.
Les résultats du modèle sont présentés dans le tableau 2. En général, on
observe des valeurs de résistance de la solution (résistance d’électrolyte)
comprises entre 19 et 22 (Ω·cm2) ainsi que des valeurs de résistance de transfert
de charge élevées entre 1,7x10⁵ et 3x10⁵ (Ω·cm2), indiquant une résistance élevée
à la corrosion. De plus, il est possible de calculer des valeurs de capacités
effectives (Ceff) de la couche externe poreuse et de la couche interne dense à
partir des paramètres de l'élément à phase constante, à l'aide de la relation de
Brug [34] :
𝐶𝑒𝑓𝑓(𝐵𝑟𝑢𝑔) = 𝑄1𝛼(𝑅𝑒
−1 + 𝑅𝑡−1)
𝛼−1𝛼
Les valeurs de capacité sont indiquées dans le tableau 2. Le calcul de la
capacité effective associée à la couche externe poreuse (Ceff(a)) donne entre 7 et
16 μF·cm−2. Par contre, les résultats obtenus pour la couche interne dense (Ceff(dl))
sont compris entre 17 et 20 µF·cm-2, qui est une valeur typique d’une capacité de
double couche.
Si l’on associe le film passif à un condensateur plan, l’épaisseur de film
passif δ (en nm) peut être estimée par la relation suivante :
𝛿 =𝜖 · 𝜖0
𝐶𝑒𝑓𝑓

Influence de traitements de surface sur les propriétés de résistance à la corrosion d’alliages de titane à grains ultrafins pour des applications biomédicales 224
Où ϵ0 est la permittivité du vide (8,8542 × 10⁻¹⁴ F/cm) et ϵ la constante
diélectrique du matériau. La valeur de la constante diélectrique pour le TiO2 est
comprise entre 18,2 et 173 [35]. Si l’on considère maintenant une valeur moyenne
de la constante diélectrique, ϵ = 100, comme déjà choisie par différents auteurs
[36,37], conduit des épaisseurs de films passifs protecteurs (associés à la couche
interne dense, responsables de la protection du matériau) de 3,75, 4,53 et 3,80 nm
pour l'alliage Ti13Nb13Zr, dans des conditions non déformées (ND) et déformées
par 1GPa (HPT1GPa) et déformées par 4,5GPa (HPT4.5GPa), respectivement.
Ces résultats montrent que les films passifs en alliage Ti13Nb13Zr déformé ont
une épaisseur supérieure.
En résumé, les résultats obtenus avec l'ajustement indiquent que tous les
substrats testés se sont comportés de manière très similaire.
Tableau 2 : Valeurs des paramètres d’ajustement des mesures d’impédance des
échantillons polis d'alliage Ti13Nb13Zr avec le modèle de la Figure 3.
Condition Rs Qa
αa Ra Ceff(a) Qdl
µF·s(αdl-1) αdl Rb Ceff(dl)
Ω·cm2 µF ·s(αa-1) Ω·cm2 µF/cm2 Ω·cm2 µF/cm2
Sans déformation 22 7 0.94 57 16 9 0.94 3.0E+05 20
1 GPa 19 5 0.90 111 7 12 0.88 1.3E+05 17
4.5 GPa 21 6 0.90 124 9 11 0.91 1.7E+05 20
Echantillons de surface à base de nanotubes de TiO2
Les figures 4((a) et (b)) présentent les courbes de polarisation anodiques et
les diagrammes de Nyquist, respectivement, dans SBF à 37°C des échantillons de
surface à base de nanotubes de TiO2 d'alliage Ti13Nb13Zr non déformés et
déformés par HPT.
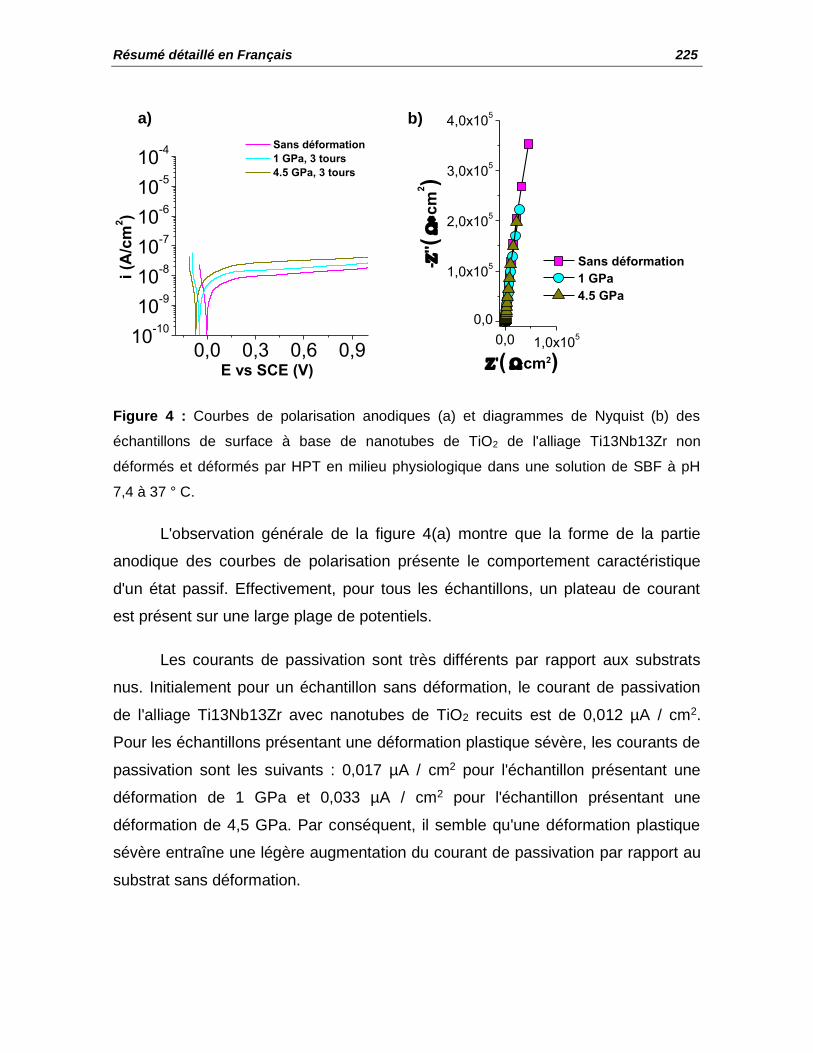
Résumé détaillé en Français 225
0,0 0,3 0,6 0,910
-10
10-9
10-8
10-7
10-6
10-5
10-4
i (A
/cm
2)
E vs SCE (V)
Sans déformation
1 GPa, 3 tours
4.5 GPa, 3 tours
Sans déformation
1 GPa
4.5 GPa
0,0 1,0x10⁵
0,0
1,0x10⁵
2,0x10⁵
3,0x10⁵
4,0x10⁵
-''(
c
m2
)
'( cm2)
Figure 4 : Courbes de polarisation anodiques (a) et diagrammes de Nyquist (b) des
échantillons de surface à base de nanotubes de TiO2 de l'alliage Ti13Nb13Zr non
déformés et déformés par HPT en milieu physiologique dans une solution de SBF à pH
7,4 à 37 ° C.
L'observation générale de la figure 4(a) montre que la forme de la partie
anodique des courbes de polarisation présente le comportement caractéristique
d'un état passif. Effectivement, pour tous les échantillons, un plateau de courant
est présent sur une large plage de potentiels.
Les courants de passivation sont très différents par rapport aux substrats
nus. Initialement pour un échantillon sans déformation, le courant de passivation
de l'alliage Ti13Nb13Zr avec nanotubes de TiO2 recuits est de 0,012 µA / cm2.
Pour les échantillons présentant une déformation plastique sévère, les courants de
passivation sont les suivants : 0,017 µA / cm2 pour l'échantillon présentant une
déformation de 1 GPa et 0,033 µA / cm2 pour l'échantillon présentant une
déformation de 4,5 GPa. Par conséquent, il semble qu'une déformation plastique
sévère entraîne une légère augmentation du courant de passivation par rapport au
substrat sans déformation.
a) b)

Influence de traitements de surface sur les propriétés de résistance à la corrosion d’alliages de titane à grains ultrafins pour des applications biomédicales 226
La figure 4(b) montre les mesures d'impédance en représentation de
Nyquist. L'observation des diagrammes de Nyquist révèle que la forme du spectre
d'impédance de tous les substrats est pseudo-capacitive (droite inclinée), c'est-à-
dire que les échanges d'électrons et donc les réactions sont très limitées ou que la
couche d'oxyde est très résistive.
Les spectres expérimentaux d'impédance sont modélisés au moyen d'un
modèle de ligne de transmission développée pour une électrode poreuse décrivant
les propriétés du système à l'étude. La figure 5 montre le schéma de la ligne de
transmission proposée pour modéliser les mesures d'impédance.
Figure 5 : Schéma de la ligne de transmission proposée pour des échantillons de surface
à base de nanotubes de TiO2 de l'alliage Ti13Nb13Zr non déformés et déformés par HPT
dans une solution de SBF à pH 7,4 à 37 ° C.
Les résultats du modèle sont présentés dans le tableau 3. Les résultats du
réglage indiquent des valeurs de résistance de la solution proches de 20 (Ω·cm2)
et une élevée résistance associée à la limite supérieure des pores (RA) comprise
entre 2x10⁷ et 3x10⁷ (Ω·cm2), indiquant une résistance à la corrosion supérieure à
celle des substrats polis. Enfin, il a été observé que les substrats avec des
nanotubes de TiO2 plus longs à l'état non déformé présentent une résistance à la
corrosion supérieure. De plus, il est possible de calculer des valeurs de capacités
effectives à partir des paramètres CPE modélisant les impédances ξ et ZB, à l'aide
de la relation de Hsu-Mansfeld [38] :

Résumé détaillé en Français 227
𝐶𝑒𝑓𝑓(𝐻 − 𝑀) = 𝑄1𝛼(𝑅𝑡)
1−𝛼𝛼
Les valeurs de capacité sont indiquées dans le tableau 3. Le calcul de la
capacité effective interfaciale associée à l’élément ξ (Cβ) donne entre 14 et 42
μF·cm-2, qui correspondent aux valeurs correspondant à la capacité de double
couche. Par contre, les résultats obtenus pour la capacité effective Cn, associée au
CPE de fond de pore sont compris entre 2 et 5 µF·cm-2, qui est une valeur typique
d’une capacité de film passif.
En ce qui concerne l'épaisseur du film passif, elles ont été calculées à partir
de la capacité effective. Les valeurs d'épaisseur étaient de 25,5, 39,6 et 17,6 nm
pour l'alliage Ti13Nb13Zr dans les conditions ND, HPT1GPa et HPT4.5GPa,
respectivement.
Tableau 3 : Valeurs des paramètres d’ajustement des mesures d’impédance des
échantillons de surface à base de nanotubes de TiO2 d'alliage Ti13Nb13Zr avec le modèle
de la Figure 5.
Échantillons soumis à un traitement acide à l’HCl puis à un traitement alcalin
avec NaOH.
Les figures 6((a) et (b)) présentent les courbes de polarisation anodiques et
les diagrammes de Nyquist, respectivement, dans SBF à 37°C des échantillons de
surface soumis à un traitement acide à l’HCl puis à un traitement alcalin avec
NaOH d'alliage Ti13Nb13Zr non déformés et déformés par HPT.
Condition
χ1 χ2 𝝃 ZA ZB Rs
R1 R2 R3 Q3 β
Cβ RA QB n
Cn Rs
(Ω) (Ω) (Ω) (Fβ-1) µF/cm2 (Ω) (Fn-1) µF/cm2 (Ω)
Sans déformation 1 241 2.3E+15 1.4E-06 0.96 14 3.0E+07 1.4E-06 0.96 3 70.0
1 GPa 6 736 1.8E+15 1.2E-06 0.97 19 3.0E+07 1.0E-06 0.96 2 70.0
4.5 GPa 1 100 1.8E+15 2.4E-06 0.94 42 2.3E+07 2.0E-06 0.96 5 70.0

Influence de traitements de surface sur les propriétés de résistance à la corrosion d’alliages de titane à grains ultrafins pour des applications biomédicales 228
Sans déformation
1 GPa, 3 tours
4.5GPa, 3 tours
-0,4 0,0 0,4 0,810
-10
10-9
10-8
10-7
10-6
10-5
10-4
i (A
/cm
2)
E vs SCE (V)
Sans déformation
1 GPa
4.5 GPa
0,0 1,0x10⁵
0,0
1,0x10⁵
2,0x10⁵
'( cm2)
-''(
c
m2
)
Figure 6 : Courbes de polarisation anodiques (a) et diagrammes de Nyquist (b) des
échantillons de surface soumis à un traitement acide à l’HCl puis à un traitement alcalin
avec NaOH d'alliage Ti13Nb13Zr non déformés et déformés par HPT en milieu
physiologique dans une solution de SBF à pH 7,4 à 37 ° C.
Une observation générale de la forme de la partie anodique des courbes de
polarisation représentées à la figure 6(a), montre que le comportement des
échantillons dans un environnement physiologique est caractéristique d'un état
passif.
Une variation des courants de passivation est observée : initialement les
échantillons sans déformation ont une valeur approximative du courant au plateau
de passivation de 2,30 µA / cm2, pour les échantillons présentant une déformation
plastique sévère, les courants de passivation sont les suivants : 2,51 μA / cm2 pour
l'échantillon présentant une déformation de 1 GPa et 3,40 μA / cm2 pour
l'échantillon présentant une déformation de 4,5 GPa. Ainsi, une déformation
plastique sévère entraîne une légère augmentation du courant de passivation par
rapport au substrat sans déformation.
La figure 6(b) montre les mesures d'impédance en représentation de
Nyquist. L’observation des diagrammes de Nyquist révèle que la forme du spectre
a) b)

Résumé détaillé en Français 229
d’impédance pour tous les substrats (arc) est typique d’un système capacitif-
résistif.
Les spectres expérimentaux d'impédance sont modélisés à l'aide d'un circuit
électrique équivalent approprier décrivant les propriétés du système étudié.
Les spectres ont été ajustés à l'aide du circuit :
Rs + (Qb / Rb) + Qa / (Ra+ (Qdl / Rct)),
Où Rs représente la résistance de la solution, Rb et Qb représentent la résistance
et l'élément à phase constante pour la couche externe poreuse, Ra et Qa
représentent la résistance et l'élément à phase constante pour la couche
intermédiaire poreuse, Rct et Qdl représentent la résistance de transfert de charge
et l'élément à phase constante pour la double couche à l'interface couche interne
dense-électrolyte. La figure 7 montre le modèle sélectionné.
Figure 7 : Circuit équivalent utilisé pour modéliser les résultats d'impédance d'échantillons
de surface soumis à un traitement acide à l’HCl puis à un traitement alcalin avec NaOH
d'alliage Ti13Nb13Zr non déformés et déformés par HPT en milieu physiologique dans
une solution de SBF à pH 7,4 à 37 ° C.

Influence de traitements de surface sur les propriétés de résistance à la corrosion d’alliages de titane à grains ultrafins pour des applications biomédicales 230
Les résultats de l'ajustement du modèle et de la capacité effective associée
au CPE calculé avec l'équation de Brug sont donnés dans le tableau 4.
L'ajustement permet d'obtenir des valeurs de résistance de solution comprises
entre 20 et 22 (Ω·cm2) ainsi que des valeurs élevées de résistance de transfert de
charge (Rct) comprises entre 6x10⁵ et 8x10⁵ (Ω·cm2), indiquant une résistance
élevée à la corrosion avec des valeurs légèrement supérieures à des échantillons
nus.
En ce qui concerne les capacités, les valeurs pour la double couche
(Ceff(dl)) étaient comprises entre 14 et 19 µF·cm-2 (voir tableau 4). Les valeurs de
capacité pour la couche externe poreuse (Ceff(b)) et la couche poreuse
intermédiaire (Ceff(a)) étaient inférieures à Ceff (dl). De plus, l'épaisseur du film
passif, δ (en nm), a été obtenue à partir de la capacité de la couche interne dense.
Les valeurs d'épaisseur sont respectivement de 4,05, 4,30 et 5,41 nm pour l'alliage
Ti13Nb13Zr, dans les conditions ND, HPT1GPa et HPT4.5GPa, respectivement.
Ces résultats montrent que le film passif en alliage Ti13Nb13Zr sans déformation a
une épaisseur inférieure et que le traitement chimique augmente le film passif par
rapport aux échantillons nus.

Résumé détaillé en Français 231
Tableau 4 : Valeurs des paramètres d’ajustement des mesures d’impédance
d'échantillons de surface soumis à un traitement acide à l’HCl puis à un traitement alcalin
avec NaOH d'alliage Ti13Nb13Zr avec le modèle de la Figure 7.
Condition
Élément Sans déformation 1 GPa 4.5 GPa
Rs (Ω· cm2) 22 20 20
Qb (µF ·s(αb-1)) 52 28 43
αb 0.70 0.76 0.72
Rb (Ω· cm2) 28 15 15
Ceff(b) (µF/ cm2) 2.2 2.0 2.0
Qa (µF ·s(αa-1)) 19 11 55
αa 0.70 0.75 0.70
Ra (Ω· cm2) 7 2 10
Ceff(a) (µF/ cm2) 0.4 0.3 0.5
Qdl (µF ·s(αdl-1)) 21 39 19
αdl 0.98 0.90 0.96
Rct (Ω· cm2) 7.6E+05 6.8E+05 6.0E+05
Ceff(dl) (µF/cm2) 19 18 14
Échantillons soumis à un traitement acide à l’H3PO4 puis à un traitement
alcalin avec NaOH.
Les figures 8((a) et (b)) présentent les courbes de polarisation anodiques et
les diagrammes de Nyquist, respectivement, dans SBF à 37°C des échantillons de
surface soumis à un traitement acide à l’H3PO4 puis à un traitement alcalin avec
NaOH d'alliage Ti13Nb13Zr non déformés et déformés par HPT.
Le comportement observé est différent des surfaces nues ou avec
nanotubes montrant un comportement passif des échantillons en SBF au potentiel
de corrosion pour les alliages avec nanotubes et près du potentiel de corrosion
pour les surfaces nues (zone de corrosion active réduite) mais assez similaire à

Influence de traitements de surface sur les propriétés de résistance à la corrosion d’alliages de titane à grains ultrafins pour des applications biomédicales 232
celui des alliages traités en milieu acide bien que la partie active s’étale sur une
plus large gamme de potentiels la partie anodique des courbes de polarisation.
Sans déformation
1 GPa, 3 tours
4.5 GPa, 3 tours
-0,8 -0,4 0,0 0,4 0,810
-10
10-9
10-8
10-7
10-6
10-5
10-4
i (A
/cm
2)
E vs SCE (V)
Sans déformation
1 GPa
4.5 GPa
0,0 1,0x10⁵
0,0
5,0x10⁴
1,0x10⁵
1,5x10⁵
2,0x10⁵
-''(
c
m2
)'( cm
2
)
Figure 8 : Courbes de polarisation anodiques (a) et diagrammes de Nyquist (b) des
échantillons de surface soumis à un traitement acide à l’H3PO4 puis à un traitement alcalin
avec NaOH d'alliage Ti13Nb13Zr non déformés et déformés par HPT en milieu
physiologique dans une solution de SBF à pH 7,4 à 37 ° C.
Initialement les échantillons sans déformation ont une valeur de courants de
passivation approximative de : 4,05 µA / cm2. Pour les échantillons présentant une
déformation plastique sévère, les courants de passivation sont les suivants : 5,13
μA / cm2 pour l'échantillon présentant une déformation de 1 GPa et 5,13 μA / cm2
pour l'échantillon présentant une déformation de 4,5 GPa. Par conséquent, il
apparaît qu'une déformation plastique sévère n'a pas d'effet sur le courant de
passivation par rapport au substrat sans déformation.
La figure 8(b) montre les mesures d'impédance. L'observation des
diagrammes de Nyquist révèle que la forme du spectre d'impédance de tous les
substrats est caractéristique d'un système capacitif-résistif. Les spectres
d'impédance expérimentaux sont analysés en ajustant le même circuit électrique
équivalent à celui utilisé pour les échantillons de surface soumis à un traitement
a) b)

Résumé détaillé en Français 233
acide à l’HCl puis à un traitement alcalin avec NaOH d'alliage Ti13Nb13Zr (voir
figure 7).
Les résultats de l'ajustement du modèle et de la capacité effective associée
au CPE calculé avec l'équation de Brug sont donnés dans le tableau 5.
L'ajustement permet d'obtenir des valeurs de résistance de solution de 20 (Ω·cm2)
ainsi que des valeurs élevées de résistance de transfert de charge (Rct) comprises
entre 5x10⁵ et 7x10⁵ (Ω·cm2), indiquant une résistance élevée à la corrosion avec
des valeurs légèrement supérieures à des échantillons nus.
En ce qui concerne les capacités, les valeurs pour la double couche
(Ceff(dl)) étaient comprises entre 10 et 15 µF·cm-2. Les valeurs de capacité pour la
couche externe poreuse (Ceff(b)) et la couche poreuse intermédiaire (Ceff(a))
étaient inférieures à Ceff (dl). De plus, l'épaisseur du film passif, δ (en nm), a été
obtenue à partir de la capacité de la couche interne dense. Les valeurs d'épaisseur
sont respectivement de 7,62, 7,43 et 5,03 nm pour l'alliage Ti13Nb13Zr, dans les
conditions ND, HPT1GPa et HPT4.5GPa, respectivement. Ces résultats montrent
que le traitement chimique contribue à augmenter l'épaisseur du film passif.

Influence de traitements de surface sur les propriétés de résistance à la corrosion d’alliages de titane à grains ultrafins pour des applications biomédicales 234
Tableau 5 : Valeurs des paramètres d’ajustement des mesures d’impédance
d'échantillons de surface soumis à un traitement acide à l’H3PO4 puis à un traitement
alcalin avec NaOH d'alliage Ti13Nb13Zr avec le modèle de la Figure 7.
Condition
Élément Sans déformation 1 GPa 4.5 GPa
Rs (Ω· cm2) 20 20 20
Qb (µF ·s(αb-1)) 42 15 15
αb 0.72 0.81 0.78
Rb (Ω· cm2) 13 2 10
Ceff(b) (µF/ cm2) 1.9 1.3 1.2
Qa (µF ·s(αa-1)) 65 42 14
αa 0.78 0.82 0.77
Ra (Ω· cm2) 78 44 20
Ceff(a) (µF/ cm2) 9 8 1.0
Qdl (µF ·s(αdl-1)) 14 12 32
αdl 0.96 0.98 0.91
Rct (Ω· cm2) 5.1E+05 4.5E+05 7.1E+05
Ceff(dl) (µF/cm2) 10 10 15
Tests de bioactivité sur l'alliage Ti13Nb13Zr
Le principe des essais de bioactivité est d'évaluer l'aptitude du matériau à
former spontanément de l'apatite à la surface lorsqu'il est immergé dans du SBF.
Cette capacité est un critère essentiel pour déterminer la biocompatibilité d'un
matériau. Dans cette étude, les dépôts d'apatite ont été examinés après 1, 7 et 14
jours d'immersion dans du SBF pour des échantillons de l'alliage Ti13Nb13Zr avec
une modification de surface différente, ainsi que différents niveaux de déformation
par HPT.

Résumé détaillé en Français 235
Échantillons polis.
Les observations au microscope électronique à balayage (MEB) présentées
sur la la figure 9 indiquent que, même après 14 jours d'immersion dans la solution
physiologique, aucune formation d'apatite n'est détectée à la surface des substrats
polis.
Figure 9 : Observations MEB-FEG des échantillons de surface polies (nues) d'alliage
Ti13Nb13Zr non déformés et déformés par HPT soumis à des tests de bioactivité de 1, 7
et 14 jours dans du SBF.
Echantillons de surface à base de nanotubes de TiO2
Dès le premier jour d'immersion dans une solution de SBF, l'apatite est
visible dans de petites zones sur des substrats de l'alliage Ti13Nb13Zr déformé

Influence de traitements de surface sur les propriétés de résistance à la corrosion d’alliages de titane à grains ultrafins pour des applications biomédicales 236
par HPT pour une déformation de 4,5 GPa (Figure 10(c)). Des dépôts homogènes
d'apatite sont observés dans tous les échantillons lorsqu'ils sont immergés dans du
SBF pendant sept et 14 jours.
Figure 10 : Observations MEB-FEG des surfaces d’alliage Ti13Nb13Zr avec nanotubes
de TiO2 non déformé et déformé par HPT soumises à des tests de bioactivité pendant 1, 7
et 14 jours dans du SBF.
Échantillons soumis à un traitement acide à l’HCl puis à un traitement alcalin
avec NaOH.
Les observations MEB-FEG illustrées à la figure 11 montrent qu'à partir du
septième jour d'immersion dans une solution de SBF, des dépôts d'apatite sont
visibles sur tous les échantillons de l'alliage Ti13Nb13Zr.
Apatite
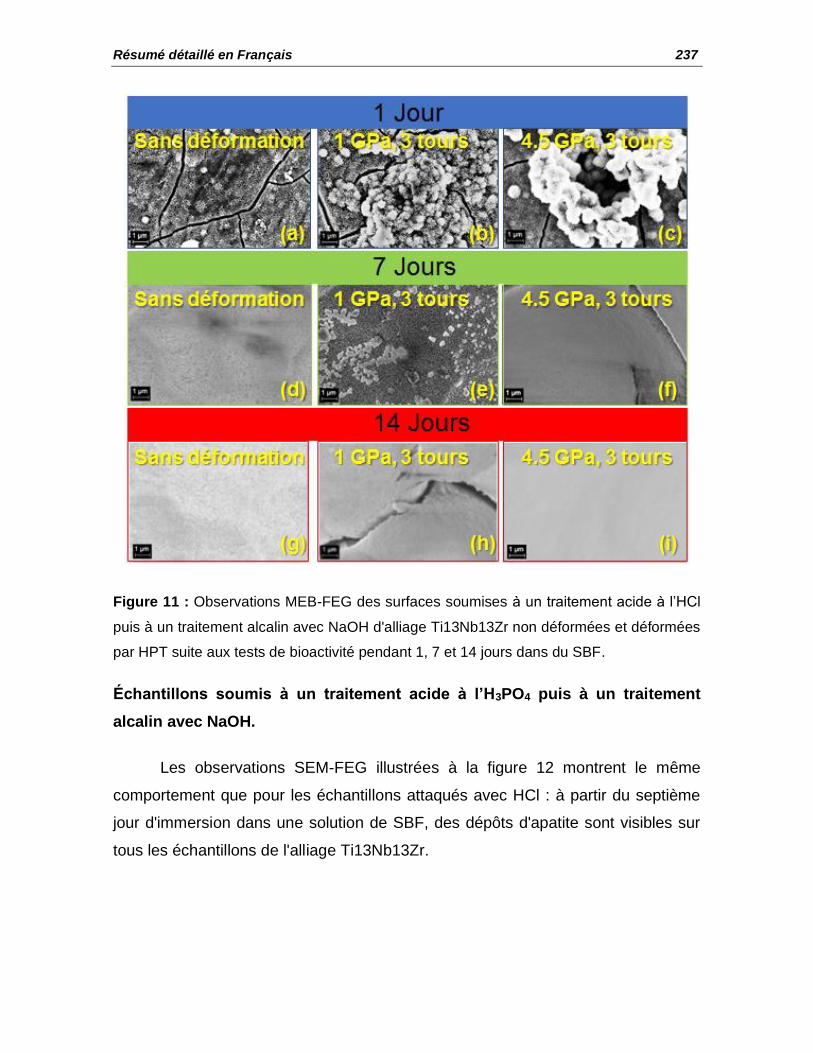
Résumé détaillé en Français 237
Figure 11 : Observations MEB-FEG des surfaces soumises à un traitement acide à l’HCl
puis à un traitement alcalin avec NaOH d'alliage Ti13Nb13Zr non déformées et déformées
par HPT suite aux tests de bioactivité pendant 1, 7 et 14 jours dans du SBF.
Échantillons soumis à un traitement acide à l’H3PO4 puis à un traitement
alcalin avec NaOH.
Les observations SEM-FEG illustrées à la figure 12 montrent le même
comportement que pour les échantillons attaqués avec HCl : à partir du septième
jour d'immersion dans une solution de SBF, des dépôts d'apatite sont visibles sur
tous les échantillons de l'alliage Ti13Nb13Zr.

Influence de traitements de surface sur les propriétés de résistance à la corrosion d’alliages de titane à grains ultrafins pour des applications biomédicales 238
Figure 12 : Observations MEB-FEG des surfaces soumises à un traitement acide à
l’H3PO4 puis à un traitement alcalin avec NaOH d'alliage Ti13Nb13Zr non déformées et
déformées par HPT suite aux tests de bioactivité réalisés pendant 1, 7 et 14 jours dans du
SBF.

Résumé détaillé en Français 239
Caractérisation initiale d'échantillons d'alliage Ti35Nb7Zr5Ta.
Différentes conditions de surface sont étudiées dans ce travail afin de
résumer toutes les surfaces modifiées avec et sans déformation plastique sévère.
Le tableau 6 montre toutes les surfaces de travail utilisées dans les tests de
corrosion et de bioactivité.
Tableau 6 : Surfaces de travail initial en alliage Ti35Nb7Zr5Ta avec différents traitements
de modification de surface et avec et sans traitement par HPT.

Influence de traitements de surface sur les propriétés de résistance à la corrosion d’alliages de titane à grains ultrafins pour des applications biomédicales 240
Caractérisation électrochimique.
Alliage Ti35Nb7Zr5Ta.
Les mesures électrochimiques présentées ci-dessous sont donc destinées à
évaluer l'impact du traitement de modification de surface et des déformations
plastiques sévères sur les propriétés électrochimiques dans du SBF pour l'alliage
Ti35Nb7Zr5Ta.
Échantillons polis.
Les figures 13((a) et (b)) présentent les courbes de polarisation anodiques
et les diagrammes de Nyquist, respectivement, dans SBF à 37°C des échantillons
de surface poli de l'alliage Ti35Nb7Zr5Ta non déformés et déformés par HPT.
Sans déformation
1 GPa, 3 tours
4.5 GPa, 3 tours
-0,8 -0,4 0,0 0,4 0,810
-10
10-9
10-8
10-7
10-6
10-5
10-4
i (A
/cm
2)
E vs SCE (V)
Sans déformation
1 GPa
4.5 GPa
0,0 2,5x10⁴
5,0x10⁴
0,0
2,5x10⁴
5,0x10⁴
7,5x10⁴
-''(
c
m2
)
'( cm2)
Figure 13 : Courbes de polarisation anodiques (a) et diagrammes de Nyquist (b) des
échantillons polis de l'alliage Ti35Nb7Zr5Ta non déformés et déformés par HPT en milieu
physiologique dans une solution de SBF à pH 7,4 à 37 ° C.
On considère que le courant mesuré dans la région anodique est
principalement dû à la réaction d'oxydation des substrats en TiO2, ce qui contribue
à l'épaississement de la couche passive.
a) b)

Résumé détaillé en Français 241
Une légère variation des courants de passivation est observé. Où
initialement les échantillons sans déformation ont une valeur approximative de :
3,52 µA / cm2. Pour les échantillons présentant une déformation plastique sévère,
les courants de passivation sont les suivants : 5,18 µA / cm2 pour l'échantillon
présentant une déformation de 1 GPa et 6,03 µA / cm2 pour l'échantillon
présentant une déformation de 4,5 GPa. Ainsi, une déformation plastique sévère
entraîne une légère augmentation du courant de passivation par rapport au
substrat sans déformation.
La figure 13(b) montre les mesures d'impédance à l'aide du diagramme de
Nyquist. L'observation des diagrammes de Nyquist révèle que la forme du spectre
d'impédance de tous les substrats sont caractéristiques d'un système capacitif-
résistif. Les spectres d'impédance expérimentaux sont analysés en ajustant le
même circuit électrique équivalent qu’utiliser pour les échantillons de surface poli
de l'alliage Ti13Nb13Zr (voir figure 3).
Les résultats de l'ajustement du modèle et de la capacité effective associée
au CPE calculé avec l'équation de Brug sont donnés dans le tableau 7. En
général, on observe des valeurs de résistance d’électrolyte d’environ 21 (Ω·cm2)
ainsi que des valeurs élevées de résistance de transfert de charge entre 1x10⁵ et
1.7x10⁵ (Ω·cm2), indiquant une résistance élevée à la corrosion. Le calcul de la
capacité effective associée à la couche passive poreuse (Ceff(a)) donne entre 12 et
17 μF·cm−2. Par contre, les résultats obtenus pour la couche interne dense (Ceff(dl))
sont compris entre 40 et 49 µF·cm-2, qui est une valeur typique d’une capacité de
double couche.
De plus, l'épaisseur du film passif, δ (en nm), a été obtenue à partir de la
capacité de la couche interne dense. Les valeurs d'épaisseur sont respectivement
de 1,52, 1,90 et 1,70 nm pour l'alliage Ti35Nb7Zr5Ta, dans les conditions ND,
HPT1GPa et HPT4.5GPa, respectivement. Ces résultats montrent que les films
passifs en alliage Ti35Nb7Zr5Ta déformé ont une épaisseur supérieure.

Influence de traitements de surface sur les propriétés de résistance à la corrosion d’alliages de titane à grains ultrafins pour des applications biomédicales 242
Tableau 7 : Valeurs des paramètres d’ajustement des mesures d’impédance des
échantillons polis de l'alliage Ti35Nb7Zr5Ta avec le modèle de la Figure 3.
Condition Rs Qa
αa Ra Ceff(a) Qb
µF ·s(α3-1) αb Rb Ceff(b)
Ω·cm2 µF ·s(α2-1) Ω·cm2 µF/cm2 Ω·cm2 µF/cm2
Sans déformation 20 10 0.91 77 17 23 0.93 1.1E+05 49
1 GPa 21 10 0.89 129 15 22 0.91 1.7E+05 40
4.5 GPa 21 9 0.89 186 12 28 0.89 1.1E+05 44
Echantillons de surface à base de nanotubes de TiO2
Les figures 14((a) et (b)) présentent les courbes de polarisation anodiques
et les diagrammes de Nyquist, respectivement, dans SBF à 37°C des échantillons
de surface à base de nanotubes de TiO2 d'alliage Ti35Nb7Zr5Ta non déformés et
déformés par HPT.
La figure 14(a) montre que la forme de la partie anodique des courbes de
polarisation présente le comportement caractéristique d'un état passif. Pour tous
les échantillons, un plateau de courant s’établit sur une large plage de potentiels,
ce qui pourrait correspondre à une limitation du courant par le transport de matière
à travers la couche d'oxyde.
Les courants de passivation diffèrent de ceux mesurés sur les substrats
polis. Initialement pour un échantillon sans déformation, le courant de passivation
de l'alliage Ti13Nb13Zr avec nanotubes de TiO2 recuits a à peu près la valeur :
0,16 µA / cm2. Pour les échantillons présentant une déformation plastique sévère,
les courants de passivation sont les suivants : 0,19 µA / cm2 pour l'échantillon
présentant une déformation de 1 GPa et 0,52 µA / cm2 pour l'échantillon
présentant une déformation de 4,5 GPa. Par conséquent, il semble qu'une
déformation plastique sévère entraîne une légère augmentation du courant de
passivation par rapport au substrat sans déformation.

Résumé détaillé en Français 243
Sans déformation
1 GPa, 3 tours
4.5 GPa, 3 tours
0,0 0,3 0,6 0,910
-10
10-9
10-8
10-7
10-6
10-5
10-4
i (A
/cm
2)
E vs SCE (V)
Sans déformation
1 GPa
4.5 GPa
0,0 5,0x10⁴
0,0
5,0x10⁴
1,0x10⁵
1,5x10⁵
-''(
c
m2
)
'( cm2)
Figure 14 : Courbes de polarisation anodiques (a) et diagrammes de Nyquist (b) des
échantillons de surface à base de nanotubes de TiO2 de l'alliage Ti35Nb7Zr5Ta non
déformés et déformés par HPT en milieu physiologique dans une solution de SBF à pH
7,4 à 37 ° C.
La figure 14(b) montre les mesures d'impédance. L'observation des
diagrammes de Nyquist révèle que la forme du spectre d'impédance de tous les
substrats est pseudo-capacitive (droite inclinée), c'est-à-dire que les échanges
d'électrons et donc les réactions sont très limitées ou que la couche d'oxyde est
très résistive.
Les spectres d'impédance expérimentaux sont analysés en utilisant le
même modèle de ligne de transmission que celui utilisé pour l'alliage Ti13Nb13Zr
avec des nanotubes de TiO2. Les résultats de l'ajustement du modèle et de la
capacité effective associée au CPE calculé avec l'équation de Hsu-Mansfeld sont
donnés dans le tableau 8. Les résultats d’ajustement indiquent des valeurs de
résistance de la solution proches de 21 (Ω·cm2) et une élevée résistance associée
à la limite supérieure des pores (RA) comprise entre 2x10⁶ et 8x10⁶ (Ω·cm2),
indiquant une résistance à la corrosion supérieure à celle des substrats polis.
Le calcul de la capacité effective interfaciale associée à l’élément ξ (Cβ)
donne entre 33 et 66 μF·cm-2, qui correspondent aux valeurs correspondant à la
a) b)

Influence de traitements de surface sur les propriétés de résistance à la corrosion d’alliages de titane à grains ultrafins pour des applications biomédicales 244
capacité de double couche. Par contre, les résultats obtenus pour la capacité
effective Cn, associée au CPE de fond de pore sont compris entre 2 et 4 µF·cm-2,
qui est une valeur typique d’une capacité de film passif.
En ce qui concerne l'épaisseur du film passif, elles ont été calculées à partir
de la capacité effective. Les valeurs d'épaisseur étaient de 47,4, 34,3 et 22,3 nm
pour l'alliage Ti35Nb7Zr5Ta dans les conditions ND, HPT1GPa et HPT4.5GPa,
respectivement.
Enfin, il a été observé que les substrats avec des nanotubes de TiO2 plus
longs à l'état non déformé présentent une résistance à la corrosion supérieure.
Tableau 8 : Valeurs des paramètres d’ajustement des mesures d’impédance des
échantillons de surface à base de nanotubes de TiO2 d'alliage Ti35Nb7Zr5Ta avec le
modèle de la Figure 5.
Échantillons soumis à un traitement acide à l’HCl puis à un traitement alcalin
avec NaOH.
Les figures 15((a) et (b)) présentent les courbes de polarisation anodiques
et les diagrammes de Nyquist, respectivement, dans SBF à 37°C des échantillons
de surface soumis à un traitement acide à l’HCl puis à un traitement alcalin avec
NaOH d'alliage Ti35Nb7Zr5Ta non déformés et déformés par HPT.
Condition
χ1 χ2 𝝃 ZA ZB Rs
R1 R2 R3 Q3 β
Cβ RA QB n
Cn Rs
(Ω) (Ω) (Ω) (Fβ-1) µF/cm2 (Ω) (Fn-1) µF/cm2 (Ω)
Sans déformation 7 143 2.1E+15 2.0E-06 0.98 33 8.5E+06 1.2E-06 0.98 2 70.0
1 GPa 1 255 2.2E+15 1.9E-06 0.97 41 2.0E+06 1.0E-06 0.96 3 70.0
4.5 GPa 1 100 1.8E+15 3.1E-06 0.97 66 2.3E+06 1.6E-06 0.96 4 70.0

Résumé détaillé en Français 245
Sans déformation
1 GPa, 3 tours
4.5 GPa, 3 tours
-0,4 0,0 0,4 0,810
-10
10-9
10-8
10-7
10-6
10-5
10-4
i (A
/cm
2)
E vs SCE (V)
Sans déformation
1 GPa
4.5 GPa
0,0 5,0x10⁴
1,0x10⁵
0,0
5,0x10⁴
1,0x10⁵
1,5x10⁵
-''(
c
m2
)
'( cm2)
Figure 15 : Courbes de polarisation anodiques (a) et diagrammes de Nyquist (b) des
échantillons de surface soumis à un traitement acide à l’HCl puis à un traitement alcalin
avec NaOH d'alliage Ti35Nb7Zr5Ta non déformés et déformés par HPT en milieu
physiologique dans une solution de SBF à pH 7,4 à 37 ° C.
La forme de la partie anodique des courbes de polarisation représentées à
la figure 15(a), elle montre que le comportement des échantillons dans un
environnement physiologique est caractéristique d'un état passif.
Une variation des courants de passivation est observée : initialement les
échantillons sans déformation ont une valeur approximative de 4,58 µA / cm2, pour
les échantillons présentant une déformation plastique sévère, les courants de
passivation sont les suivants : 7,20 μA / cm2 pour l'échantillon présentant une
déformation de 1 GPa et 3,40 μA / cm2 et 5,21 μA / cm2 pour l'échantillon
présentant une déformation de 4,5 GPa. Ainsi, une déformation plastique sévère
entraîne une légère augmentation du courant de passivation par rapport au
substrat sans déformation.
La figure 15(b) montre les mesures d'impédance à l'aide du diagramme de
Nyquist. L'observation des diagrammes de Nyquist révèle que la forme du spectre
d'impédance de tous les substrats sont caractéristiques d'un système capacitif-
a) b)

Influence de traitements de surface sur les propriétés de résistance à la corrosion d’alliages de titane à grains ultrafins pour des applications biomédicales 246
résistif. Les spectres d'impédance expérimentaux sont analysés en ajustant le
même circuit électrique équivalent qu’utiliser pour les ‘alliages Ti13Nb13Zr soumis
à un traitement acide à l’HCl puis à un traitement alcalin avec NaOH (voir figure 7).
Les résultats de l'ajustement du modèle et de la capacité effective associée
au CPE calculé avec l'équation de Brug sont donnés dans le tableau 9.
Tableau 9 : Valeurs des paramètres d’ajustement des mesures d’impédance
d'échantillons de surface soumis à un traitement acide à l’HCl puis à un traitement alcalin
avec NaOH d'alliage Ti35Nb7Zr5Ta avec le modèle de la Figure 7.
Condition
Elément Sans déformation 1 GPa 4.5 GPa
Rs (Ω·cm2) 21 20 20
Qb (µF ·s(αb-1)) 42 40 40
αb 0.72 0.72 0.72
Rb (Ω·cm2) 10 9 3
Ceff(b) (µF/cm2) 1.8 1.6 1.1
Qa (µF ·s(αa-1)) 19 33 47
αa 0.70 0.71 0.80
Ra (Ω·cm2) 1 1 24
Ceff(a) (µF/cm2) 0.2 0.5 7.3
Qdl (µF ·s(αdl-1)) 32 17 12
αdl 0.93 0.93 0.98
Rct (Ω·cm2) 3.3E+05 2.7E+05 8.4E+04
Ceff(dl) (µF/cm2) 18 10 10
L'ajustement permet d'obtenir des valeurs de résistance de solution
comprises entre 20 et 21 (Ω·cm2) ainsi que des valeurs élevées de résistance de
transfert de charge (Rct) comprises entre 8,4x10⁴ et 3x10⁵ (Ω·cm2).
En ce qui concerne les capacités, les valeurs pour la double couche
(Ceff(dl)) étaient comprises entre 10 et 18 µF·cm-2. Les valeurs de capacité pour la
couche externe poreuse (Ceff(b)) et la couche poreuse intermédiaire (Ceff(a))

Résumé détaillé en Français 247
étaient inférieures à Ceff (dl). De plus, l'épaisseur du film passif, δ (en nm), a été
obtenue à partir de la capacité de la couche interne dense. Les valeurs d'épaisseur
sont respectivement de 4,07, 7,87 et 7,43 nm pour l'alliage Ti35Nb7Zr5Ta, dans
les conditions ND, HPT1GPa et HPT4.5GPa, respectivement. Ces résultats
montrent que le traitement chimique et la déformation contribuent à augmenter
l'épaisseur du film passif.
Échantillons soumis à un traitement acide à l’H3PO4 puis à un traitement
alcalin avec NaOH.
Les figures 16((a) et (b)) présentent les courbes de polarisation anodiques
et les diagrammes de Nyquist, respectivement, dans SBF à 37°C des échantillons
de surface soumis à un traitement acide à l’H3PO4 puis à un traitement alcalin avec
NaOH d'alliage Ti35Nb7Zr5Ta non déformés et déformés par HPT.
Le même comportement observé pour les autres courbes de polarisation est
observé, où la partie anodique des courbes de polarisation montre un
comportement passif des échantillons en SBF.
Une variation des courants de passivation est observée : initialement les
échantillons sans déformation ont une valeur approximative de 8,24 µA / cm2 et
pour les échantillons présentant une déformation plastique sévère, les courants de
passivation sont les suivants : 10,80 μA / cm2 pour l'échantillon présentant une
déformation de 1 GPa et 10,80 μA / cm2 pour l'échantillon présentant une
déformation de 4,5 GPa. Ainsi, une déformation plastique sévère entraîne une
légère augmentation du courant de passivation par rapport au substrat sans
déformation.

Influence de traitements de surface sur les propriétés de résistance à la corrosion d’alliages de titane à grains ultrafins pour des applications biomédicales 248
Sans déformation
1 GPa, 3 tours
4.5 GPa, 3 tours
-0,4 0,0 0,4 0,810
-10
10-9
10-8
10-7
10-6
10-5
10-4
i (A
/cm
2)
E vs SCE (V)
Sans déformation
1 GPa
4.5 GPa
0,0 5,0x10⁴
1,0x10⁵
0,0
5,0x10⁴
1,0x10⁵
1,5x10⁵
-''(
c
m2
)
'( cm2)
Figure 16 : Courbes de polarisation anodiques (a) et diagrammes de Nyquist (b) des
échantillons de surface soumis à un traitement acide à l’H3PO4 puis à un traitement alcalin
avec NaOH d'alliage Ti35Nb7Zr5Ta non déformés et déformés par HPT en milieu
physiologique dans une solution de SBF à pH 7,4 à 37 ° C.
L'observation des diagrammes de Nyquist (figure 16 b) révèle que la forme
du spectre d'impédance de tous les substrats est caractéristique d'un système
capacitif-résistif. Les spectres d'impédance expérimentaux sont analysés avec le
même circuit électrique équivalent que celui utilisé pour les échantillons de surface
soumis à un traitement acide à l’HCl puis à un traitement alcalin avec NaOH pour
les alliages Ti13Nb13Zr (voir figure 7).
Les résultats de l'ajustement du modèle et de la capacité effective associée
au CPE calculé avec l'équation de Brug sont donnés dans le tableau 10.
L'ajustement permet d'obtenir des valeurs de résistance de solution de 20 (Ω·cm2)
ainsi que des valeurs élevées de résistance de transfert de charge (Rct) comprises
entre 2x10⁴ et 2x10⁵ (Ω·cm2).
En ce qui concerne les capacités, les valeurs pour la double couche
(Ceff(dl)) étaient comprises entre 10 et 19 µF·cm-2. Les valeurs de capacité pour la
couche externe poreuse (Ceff(b)) et la couche poreuse intermédiaire (Ceff(a))
étaient inférieures à Ceff (dl). De plus, l'épaisseur du film passif, δ (en nm), a été
a) b)

Résumé détaillé en Français 249
obtenue à partir de la capacité de la couche interne dense. Les valeurs d'épaisseur
sont respectivement de 3,98, 7,62 et 7,69 nm pour l'alliage Ti35Nb7Zr5Ta, dans
les conditions ND, HPT1GPa et HPT4.5GPa, respectivement. Ces résultats
montrent que le traitement chimique et la déformation contribuent à augmenter
l'épaisseur du film passif.
Tableau 10 : Valeurs des paramètres d’ajustement des mesures d’impédance
d'échantillons de surface soumis à un traitement acide à l’H3PO4 puis à un traitement
alcalin avec NaOH d'alliage Ti13Nb13Zr avec le modèle de la Figure 7.
Condition
Elément Sans déformation 1 GPa 4.5 GPa
Rs (Ω·cm2) 20 20 20
Qb (µF ·s(αb-1)) 40 53 15
αb 0.73 0.70 0.80
Rb (Ω·cm2) 9 7 4
Ceff(b) (µF/cm2) 1.8 1.6 1.3
Qa (µF ·s(αa-1)) 6 6 37
αa 0.72 0.78 0.84
Ra (Ω·cm2) 3 1 10
Ceff(a) (µF/cm2) 0.1 4.3 7.5
Qdl (µF ·s(αdl-1)) 47 54 54
αdl 0.88 0.80 0.80
Rct (Ω·cm2) 2.2E+05 1.0E+05 2.5E+04
Ceff(dl) (µF/cm2) 19 10 10
Tests de bioactivité sur l'alliage Ti35Nb7Zr5Ta
Dans cette étude, les dépôts d'apatite ont été examinés après 1, 7 et 14
jours d'immersion dans la solution SBF pour des échantillons de l'alliage
Ti35Nb7Zr5Ta avec différente modification de surface, ainsi que des niveaux de
déformation par HPT différents.

Influence de traitements de surface sur les propriétés de résistance à la corrosion d’alliages de titane à grains ultrafins pour des applications biomédicales 250
Échantillons polis.
Les observations au microscope électronique à balayage (MEB) illustrées à
la figure 17 indiquent que, même après 14 jours d'immersion dans la solution
physiologique, aucune formation d'apatite n'est détectée à la surface des substrats
nus.
Figure 17 : Observations MEB-FEG des échantillons de surface poli d'alliage
Ti35Nb7Zr5Ta non déformé et déformé par HPT suite aux tests de bioactivité pendant 1, 7
et 14 jours dans du SBF.

Résumé détaillé en Français 251
Échantillons de surface à base de nanotubes de TiO2.
Les observations au microscope électronique à balayage (SEM) illustrées à
la figure 18 indiquent que à partir du quatorzième jour d'immersion dans une
solution de SBF, l'apatite est visible sur certains substrats de Ti35Nb7Zr5Ta non
déformés et des échantillons déformés par HPT à l'état de 4,5 GPa avec des
nanotubes de TiO2 recuits. (Figures 18((g) et (i)).
Figure 18 : Observations MEB-FEG des échantillons d'alliage Ti35Nb7Zr5Ta avec
nanotubes de TiO2 non déformé et déformé par HPT suite aux tests de bioactivité à 1, 7 et
14 jours dans du SBF.

Influence de traitements de surface sur les propriétés de résistance à la corrosion d’alliages de titane à grains ultrafins pour des applications biomédicales 252
Échantillons soumis à un traitement acide à l’HCl puis à un traitement alcalin
avec NaOH.
Les observations au microscope électronique à balayage (MEB) illustrées à
la figure 19 indiquent le même comportement que celui observé pour les
échantillons avec des nanotubes de TiO2. Cela signifie qu'à partir du quatorzième
jour d'immersion dans une solution de SBF, l'apatite est visible dans certains
substrats de Ti35Nb7Zr5Ta non déformés et des échantillons déformés par HPT
4,5 GPa.
Figure 19 : Observations MEB-FEG des échantillons Ti35Nb7Zr5Ta soumis à un
traitement acide à l’HCl puis à un traitement alcalin avec NaOH non déformé et déformé
par HPT suite aux tests de bioactivité à 1, 7 et 14 jours dans du SBF.

Résumé détaillé en Français 253
Échantillons soumis à un traitement acide à l’H3PO4 puis à un traitement
alcalin avec NaOH.
Les observations au microscope électronique à balayage (MEB) illustrées à
la figure 20 indiquent que, même après 14 jours d'immersion dans la solution
physiologique, aucune formation d'apatite n'est détectée à la surface des
substrats.
Figure 20 : Observations MEB-FEG des échantillons Ti35Nb7Zr5Ta soumis à un
traitement acide à l’H3PO4 puis à un traitement alcalin avec NaOH d'alliage non déformé et
déformé par HPT suite aux tests de bioactivité à 1, 7 et 14 jours dans du SBF.

Influence de traitements de surface sur les propriétés de résistance à la corrosion d’alliages de titane à grains ultrafins pour des applications biomédicales 254
Récapitulatif
Les essais de corrosion et test de bioactivité ont été réalisés pour les
alliages de Ti13Nb13Zr et Ti35Nb7Zr5Ta avec des surfaces modifiées et
déformées par HPT. La caractérisation électrochimique a été réalisée par courbes
de polarisation et impédance électrochimique. En ce qui concerne le courant de
passivation (Ipass) obtenu à partir des courbes de polarisation, il a été observé que
les échantillons à surface polie (nue) et les échantillons traités chimiquement (HCl,
H3PO4 + NaOH) ont des valeurs de Ipass du même ordre de grandeur (10-6 A·cm-
2).
D'autre part, les échantillons non déformés et les échantillons déformés par
HPT ne montrent pas une grande différence entre les valeurs du courant de
passivation (à l'exception des échantillons anodisés). Il a été observé que la
présence de TiO2 présente la plus grande valeur de résistance de la couche
poreuse externe, ce qui suggère une résistance accrue à la corrosion. Ceci est
plus clair pour Ti13Nb13Zr, où les valeurs de résistance présentées sont de l'ordre
de 3x10⁷ (Ω·cm2).
En outre, les traitements chimiques ont tendance à diminuer la valeur de la
résistance de la couche d'oxyde protectrice, lorsque la pression de déformation
augmente. Cette réduction de la résistance à la corrosion a été attribuée à la
microstructure hors équilibre formée par la déformation HPT. De ce fait,le film
d'oxyde de la couche la plus externe est plus sensible à la dissolution de la couche
interne, ce qui indique une structure plus défectueuse de la couche externe.
Les micrographies obtenues par MEB-FEG ont montré que, pour
Ti13Nb13Zr et Ti35Nb7Zr5Ta immergé dans une solution de SBF pendant 14
jours, aucun des échantillons avec des surfaces polies ne présente de formation
d’apatite sur la surface, c'est-à-dire qu'ils ne sont pas bioactifs. Cela confirme que
la couche de TiO2 initiale inerte créée sur la surface des substrats polis ne suffit
pas pour favoriser la formation de tissu entre l'os et l'implant spontanément.

Résumé détaillé en Français 255
Le comportement observé pour les substrats polies a également été
observé pour les échantillons de surface soumis à un traitement acide à l'H3PO4
puis à un traitement alcalin avec NaOH pour l'alliage Ti35Nb7Zr5Ta, ce qui indique
que, malgré la présence de phosphate sur la surface, ledit matériau n’acquiert
aucune activité biologique. En revanche, au cours du même traitement de surface,
les surfaces des échantillons d'alliage Ti13Nb13Zr ont montré une bioactivité
pendant des périodes allant de un à sept jours dans des conditions non déformées
et déformées.
Les surfaces avec des nanotubes de TiO2 sur l'alliage de Ti13Nb13Zr dans
un état non déformé commence à produire une couche d'apatite entre un et sept
jours, tandis que les échantillons déformés ont formé des dépôts de l'apatite à
partir des 24 premières heures. Cependant, le même traitement de surface ne s'est
pas révélé aussi efficace pour les échantillons de Ti35Nb7Zr5Ta. Dans ce cas, les
échantillons (déformés ou non) ont seulement commencé à présenter une couche
d'apatite à partir dès le quatorze jours.
Enfin, cette étude a montré que les traitements de modification de surface
sont bénéfiques pour promouvoir l’ostéointégration et également que la
déformation plastique sévère favorise la bioactivité.
Références
[1] G. Manivasagam, D. Dhinasekaran, A. Rajamanickam, Biomedical implants:
Corrosion and its Prevention-A Review, Recent Patents Corros. Sci. 2
(2010) 40–54. doi:10.2174/1877610801002010040.
[2] M. Niinomi, Mechanical properties of biomedical titanium alloys, Mater. Sci.
Eng. A. 243 (1998) 231–236. doi:10.1016/S0921-5093(97)00806-X.
[3] M. Niinomi, D. Kuroda, K. Fukunaga, M. Morinaga, Y. Kato, T. Yashiro, A.
Suzuki, Corrosion wear fracture of new β type biomedical titanium alloys,

Influence de traitements de surface sur les propriétés de résistance à la corrosion d’alliages de titane à grains ultrafins pour des applications biomédicales 256
Mater. Sci. Eng. A. 263 (1999) 193–199. doi:10.1016/S0921-
5093(98)01167-8.
[4] A. Najdahmadi, A. Zarei-Hanzaki, E. Farghadani, Mechanical properties
enhancement in Ti–29Nb–13Ta–4.6 Zr alloy via heat treatment with no
detrimental effect on its biocompatibility, Mater. Des. 54 (2014) 786–791.
doi:10.1016/j.matdes.2013.09.007.
[5] K.K. Wang, L.J. Gustavson, J.H. Dumbleton, Microstructure and properties
of a new beta titanium alloy, Ti-12Mo-6Zr-2Fe, developed for surgical
implants, in: Med. Appl. Titan. Its Alloy. Mater. Biol. Issues, ASTM
International, 1996.
[6] P.L. Ferrandini, F.F. Cardoso, S.A. Souza, C.R. Afonso, R. Caram, Aging
response of the Ti–35Nb–7Zr–5Ta and Ti–35Nb–7Ta alloys, J. Alloys
Compd. 433 (2007) 207–210. doi:10.1016/j.jallcom.2006.06.094.
[7] H.J. Rack, J.I. Qazi, Titanium alloys for biomedical applications, 26 (2006)
1269–1277. doi:10.1016/j.msec.2005.08.032.
[8] S. Zherebtsov, G. Salishchev, R. Galeyev, K. Maekawa, Mechanical
properties of Ti–6Al–4V titanium alloy with submicrocrystalline structure
produced by severe plastic deformation, Mater. Trans. 46 (2005) 2020–
2025. doi:10.2320/matertrans.46.2020.
[9] a. Azushima, R. Kopp, a. Korhonen, D.Y. Yang, F. Micari, G.D. Lahoti, P.
Groche, J. Yanagimoto, N. Tsuji, a. Rosochowski, a. Yanagida, Severe
plastic deformation (SPD) processes for metals, CIRP Ann. - Manuf.
Technol. 57 (2008) 716–735. doi:10.1016/j.cirp.2008.09.005.
[10] Y.T. Zhu, T.G. Langdon, The fundamentals of nanostructured materials
processed by severe plastic deformation, Jom. 56 (2004) 58–63.
doi:10.1007/s11837-004-0294-0.

Résumé détaillé en Français 257
[11] D.A.G. Pérez, J. Junior, A. Moreira, C.S. Kiminami, C. Bolfarini, W.J. Botta,
Ultrafine-Grained Ti-13Nb-13Zr Alloy Produced by Severe Plastic
Deformation, Mater. Res. 20 (2017) 404–410. doi:10.1590/1980-5373-mr-
2017-0037.
[12] K. Sharman, P. Bazarnik, T. Brynk, A. Gunay Bulutsuz, M. Lewandowska, Y.
Huang, T.G. Langdon, Enhancement in mechanical properties of a β-
titanium alloy by high-pressure torsion, J. Mater. Res. Technol. 4 (2015) 79–
83. doi:10.1016/j.jmrt.2014.10.010.
[13] M. Kulkarni, A. Mazare, E. Gongadze, Š. Perutkova, V. Kralj-Iglič, I. Milošev,
P. Schmuki, A. Iglič, M. Mozetič, Titanium nanostructures for biomedical
applications, Nanotechnology. 26 (2015) 62002. doi:10.1088/0957-
4484/26/6/062002.
[14] R.Z. Valiev, I.P. Semenova, V. V. Latysh, H. Rack, T.C. Lowe, J. Petruzelka,
L. Dluhos, D. Hrusak, J. Sochova, Nanostructured titanium for biomedical
applications, Adv. Eng. Mater. 10 (2008) 15–17.
doi:10.1002/adem.200800026.
[15] H. Miyamoto, Corrosion of Ultrafine Grained Materials by Severe Plastic
Deformation, an Overview, Mater. Trans. 57 (2016) 559–572.
doi:10.2320/matertrans.M2015452.
[16] J. Lu, Y. Zhang, W. Huo, W. Zhang, Y. Zhao, Y. Zhang, Electrochemical
corrosion characteristics and biocompatibility of nanostructured titanium for
implants, Appl. Surf. Sci. 434 (2018) 63–72.
doi:10.1016/j.apsusc.2017.10.168.
[17] M. Takeuchi, Y. Abe, Y. Yoshida, Y. Nakayama, M. Okazaki, Y. Akagawa,
Acid pretreatment of titanium implants, 24 (2003) 1821–1827.
doi:10.1016/S0142-9612(02)00576-8.

Influence de traitements de surface sur les propriétés de résistance à la corrosion d’alliages de titane à grains ultrafins pour des applications biomédicales 258
[18] W.F. Oliveira, I.R.S. Arruda, G.M.M. Silva, G. Machado, L.C.B.B. Coelho,
M.T.S. Correia, Functionalization of titanium dioxide nanotubes with
biomolecules for biomedical applications, Mater. Sci. Eng. C. 81 (2017)
597–606. doi:10.1016/j.msec.2017.08.017.
[19] J.E.G. Hulshoff, K. Van Dijk, J.E. De Ruijter, F.J.R. Rietveld, L.A. Ginsel,
J.A. Jansen, Interfacial phenomena: An in vitro study of the effect of calcium
phosphate (Ca‐P) ceramic on bone formation, J. Biomed. Mater. Res. 40
(1998) 464–474. doi:10.1002/(SICI)1097-4636(19980605)40:3<464::AID-
JBM18>3.0.CO;2-J.
[20] S. Nishiguchi, T. Nakamura, M. Kobayashi, H.-M. Kim, F. Miyaji, T. Kokubo,
The effect of heat treatment on bone-bonding ability of alkali-treated
titanium, Biomaterials. 20 (1999) 491–500. doi:10.1016/S0142-
9612(98)90203-4.
[21] M.J. Filiaggi, N.A. Coombs, R.M. Pilliar, Characterization of the interface in
the plasma-sprayed HA coating/Ti-6Al-4V implant system, J. Biomed. Mater.
Res. 25 (1991) 1211–1229. doi:10.1002/jbm.820251004.
[22] K.S. Brammer, C.J. Frandsen, S. Jin, TiO2 nanotubes for bone regeneration,
Trends Biotechnol. 30 (2012) 315–322. doi:10.1016/j.tibtech.2012.02.005.
[23] A.P. Zhilyaev, T.G. Langdon, Using high-pressure torsion for metal
processing: Fundamentals and applications, Prog. Mater. Sci. 53 (2008)
893–979. doi:10.1016/j.pmatsci.2008.03.002.
[24] X. Liu, P.K. Chu, C. Ding, Surface modification of titanium , titanium alloys ,
and related materials for biomedical applications, 47 (2005) 49–121.
doi:10.1016/j.mser.2004.11.001.
[25] H. Tsuchiya, J.M. Macak, L. Müller, J. Kunze, F. Müller, P. Greil, S.
Virtanen, P. Schmuki, Hydroxyapatite growth on anodic TiO2 nanotubes, J.
Biomed. Mater. Res. Part A. 77A (2006) 534–541. doi:10.1002/jbm.a.30677.

Résumé détaillé en Français 259
[26] V.P. Parkhutik, V.I. Shershulsky, Theoretical modelling of porous oxide
growth on aluminium, J. Phys. D. Appl. Phys. 25 (1992) 1258.
doi:10.1088/0022-3727/25/8/017.
[27] G.K. Grimes, Craig A., Mor, TiO2 nanotube arrays: synthesis, properties,
and applications, 2009. doi:10.1007/978-1-4419-0068-5.
[28] Y. Bai, I.S. Park, H.H. Park, M.H. Lee, T.S. Bae, W. Duncan, M. Swain, The
effect of annealing temperatures on surface properties, hydroxyapatite
growth and cell behaviors of TiO2 nanotubes, Surf. Interface Anal. 43 (2011)
998–1005. doi:10.1002/sia.3683.
[29] P. Roy, S. Berger, P. Schmuki, TiO2 nanotubes: synthesis and applications,
Angew. Chemie. 50 (2011) 2904–2939. doi:10.1002/anie.201001374.
[30] F. Hilario, Synthèse et caractérisations de nanotubes de TiO2 pour
applications biomédicales: propriétés électrochimiques et bioactivité, (2017).
[31] L. Le Guéhennec, A. Soueidan, P. Layrolle, Y. Amouriq, Surface treatments
of titanium dental implants for rapid osseointegration, Dent. Mater. 23 (2007)
844–854. doi:10.1016/j.dental.2006.06.02.
[32] H. Kim, F. Miyaji, T. Kokubo, T. Nakamura, Preparation of bioactive Ti and
its alloys via simple chemical surface treatment, J. Biomed. Mater. Res. An
Off. J. Soc. Biomater. Japanese Soc. Biomater. 32 (1996) 409–417.
doi:10.1002/(sici)1097-4636(199611)32:3<409::aid-jbm14>3.0.co;2-.
[33] T. Kokubo, H. Takadama, How useful is SBF in predicting in vivo bone
bioactivity?, Biomaterials. 27 (2006) 2907–2915.
doi:10.1016/j.biomaterials.2006.01.017.
[34] B. Torres, A. Seyeux, S. Zanna, B. Tribollet, P. Marcus, I. Frateur, Influence
of BSA adsorption on the oxide layers developed on 70Cu-30Ni alloy in
static artificial seawater, Matériaux Tech. 101 (2013) 106.

Influence de traitements de surface sur les propriétés de résistance à la corrosion d’alliages de titane à grains ultrafins pour des applications biomédicales 260
[35] F. Hilario, V. Roche, A. Jorge Junior, R. Nogueira, Application of the
transmission line model for porous electrodes to analyse the impedance
response of TiO2 nanotubes in physiological environment, 2017.
doi:10.1016/j.electacta.2017.09.045.
[36] S.A.A. Yahia, L. Hamadou, A. Kadri, N. Benbrahim, E.M.M. Sutter, Effect of
anodizing potential on the formation and EIS characteristics of TiO2
nanotube arrays, J. Electrochem. Soc. 159 (2012) K83–K92.
doi:10.1149/2.077204jes.
[37] P. Pu, H. Cachet, E.M.M. Sutter, Electrochemical impedance spectroscopy
to study photo-induced effects on self-organized TiO2 nanotube arrays,
Electrochim. Acta. 55 (2010) 5938–5946.
[38] B. Hirschorn, M.E. Orazem, B. Tribollet, V. Vivier, I. Frateur, M. Musiani,
Determination of effective capacitance and film thickness from constant-
phase-element parameters, Electrochim. Acta. 55 (2010) 6218–6227.
doi:10.1016/j.electacta.2009.10.065.

Resumo detalhado em português 261
INFLUÊNCIA DOS TRATAMENTOS DE SUPERFÍCIE NAS PROPRIEDADES DE
RESISTÊNCIA À CORROSÃO DE LIGAS DE TITÂNIO DE GRÃO ULTRAFINO
PARA APLICAÇÕES EM IMPLANTES
RESUMO DETALHADO EM PORTUGUÊS
INTRODUÇÃO
Os dispositivos biomédicos atualmente em uso (próteses, implantes) têm
um desempenho satisfatório em muitos casos. No entanto, às vezes, o corpo
reage à inserção do dispositivo e pode levar à sua rápida substituição. Neste
contexto, titânio (Ti) e as suas ligas são atualmente um dos materiais mais
procurados para implantes ortopédicos e dentais devido à sua excelente
biocompatibilidade e resistência à corrosão [1].
No entanto, as propriedades mecânicas do titânio e suas ligas devem estar
próximas do tecido ósseo como pré-requisito para o sucesso dos implantes
ortopédicos. Nesse contexto, as ligas (α+β) e β têm atraído considerável interesse,
pois apresentam baixo módulo de elasticidade, que resulta em uma melhor
interação entre o implante e o osso [2]. Além disso, as ligas (α+β) e β podem ser
obtidas a partir de elementos metálicos considerados biocompatíveis como Nb,
Ta, Zr, Mo e Sn [3].
O interesse recente na redução do módulo de elasticidade resultou no
desenvolvimento de uma nova geração de ligas de titânio para aplicações
ortopédicas, incluindo Ti29Nb13Ta4.6Zr [4], o Ti12Mo6Zr2Fe (TMZF) [5],
Ti35Nb7Zr5Ta (TNZT) [6] e Ti13Nb13Zr [7].
Além disso, o módulo de elasticidade, outras propriedades mecânicas das
ligas de titânio, tal como a dureza, resistência e ductilidade pode ser melhorada
significativamente através da utilização de deformação plástica severa (SPD-
Severe Plastic Deformation, em inglês) [8]. Devido à microestrutura de grãos
ultrafinos obtida por este processo [9]. As técnicas de SPD mais comumente

Influência dos tratamentos de superfície nas propriedades de resistência
à corrosão de ligas de titânio de grão ultrafino para aplicações em implantes 262
aplicadas são extrusão de canal angular (ECAP-Equal Channel Angular Pressing)
e torção sob alta pressão (HPT-High Pressure Torsion) [10].
Nosso grupo de pesquisa estudou o acima mencionado no artigo intitulado
"Ultrafine-Grained Ti13Nb13Zr Alloy produced by Severe Plastic Deformation" [11].
Neste trabalho, foi observado o efeito da técnica de HPT no aumento da
microdureza da liga Ti13Nb13Zr. O valor de microdureza aumentou
significativamente de 220 HV para 402 HV para a pressão aplicada de 4,5 GPa.
Além disso, o refinamento do tamanho de grão (200 μm no estado inicial a 130
nm) também foi observado.
Por outro lado, os trabalhos anteriores sobre ligas de titânio e titânio
processadas por SPD têm se concentrado em estudar a relação entre a
microestrutura obtida e as propriedades mecânicas [12–14]. No entanto, poucos
estudos relacionam a microestrutura obtida pelo SPD e a resistência à corrosão
das ligas de titânio [15].
O comportamento corrosivo das ligas de titânio depende principalmente das
propriedades do filme passivo (composição e espessura) e da microestrutura do
substrato (tamanho do grão e densidade de discordâncias) [16]. A baixa taxa de
dissolução e a inércia química dos produtos de dissolução da camada passiva de
óxido de titânio (TiO2) permitem que o osso se desenvolva e se osseointegre com
a superfície da liga de titânio [17].
Desta forma, a resposta biológica de um implante depende das
propriedades físico-químicas da superfície [18]. Recentemente, métodos de
modificação de superfície de implantes de titânio têm sido estudados, tais como
revestimentos de fosfato de cálcio (Ca3(PO4)2) [19], tratamentos alcalinos e
térmicos [20], revestimentos por plasma [21] e nanotubos de TiO2 [22]. Como
forma de melhorar a integração dos implantes.
Portanto, com o objetivo de avançar no entendimento das propriedades
mecânicas e de corrosão de materiais à base de titânio para aplicações
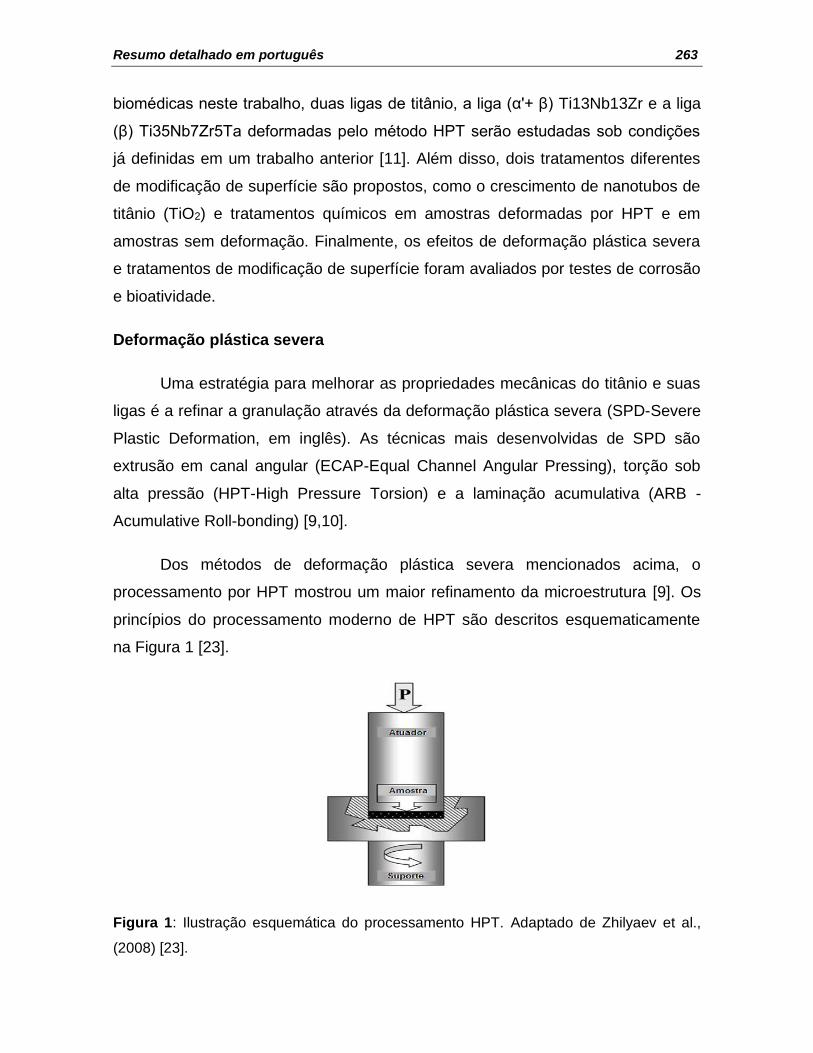
Resumo detalhado em português 263
biomédicas neste trabalho, duas ligas de titânio, a liga (α'+ β) Ti13Nb13Zr e a liga
(β) Ti35Nb7Zr5Ta deformadas pelo método HPT serão estudadas sob condições
já definidas em um trabalho anterior [11]. Além disso, dois tratamentos diferentes
de modificação de superfície são propostos, como o crescimento de nanotubos de
titânio (TiO2) e tratamentos químicos em amostras deformadas por HPT e em
amostras sem deformação. Finalmente, os efeitos de deformação plástica severa
e tratamentos de modificação de superfície foram avaliados por testes de corrosão
e bioatividade.
Deformação plástica severa
Uma estratégia para melhorar as propriedades mecânicas do titânio e suas
ligas é a refinar a granulação através da deformação plástica severa (SPD-Severe
Plastic Deformation, em inglês). As técnicas mais desenvolvidas de SPD são
extrusão em canal angular (ECAP-Equal Channel Angular Pressing), torção sob
alta pressão (HPT-High Pressure Torsion) e a laminação acumulativa (ARB -
Acumulative Roll-bonding) [9,10].
Dos métodos de deformação plástica severa mencionados acima, o
processamento por HPT mostrou um maior refinamento da microestrutura [9]. Os
princípios do processamento moderno de HPT são descritos esquematicamente
na Figura 1 [23].
Figura 1: Ilustração esquemática do processamento HPT. Adaptado de Zhilyaev et al.,
(2008) [23].

Influência dos tratamentos de superfície nas propriedades de resistência
à corrosão de ligas de titânio de grão ultrafino para aplicações em implantes 264
O corpo de prova em formato de disco é posicionado entre dois atuadores,
onde são submetidos à pressão aplicada, P, de alguns GPa em temperatura
ambiente ou a quente. Enquanto a pressão é aplicada, uma deformação através
de rotação é realizada no corpo de prova. Forças de atrito na superfície deformam
o disco por cisalhamento, assim o processo ocorre sob pressão quase hidrostática
[23].
Neste projeto, as ligas de Ti13Nb13Zr e Ti35Nb7Zr5Ta em forma de discos
de 10 mm de diâmetro e 1 mm de espessura foram processadas por HPT. O
processamento foi realizado à temperatura ambiente. Os discos foram
processados sob pressões de 1,0 e 4,5 GPa e três voltas foram aplicadas usando
uma velocidade de rotação de 3 rpm.
Tratamentos de modificação de superfície.
Titânio e suas ligas são amplamente utilizados em dispositivos e
componentes biomédicos, especialmente como substitutos de tecidos duros, bem
como em aplicações cardíacas e cardiovasculares, devido às suas propriedades
desejáveis, como módulo de elasticidade relativamente baixo, boa resistência à
fadiga, conformabilidade, usinabilidade, resistência à corrosão e
biocompatibilidade. No entanto, o titânio e suas ligas não podem atender a todos
os requisitos clínicos devido às suas inferiores propriedades tribológicas [24].
Portanto, a fim de melhorar as propriedades biológicas, químicas e mecânicas das
ligas do titânio e titânio, os tratamentos de modificação de superfície são
frequentemente realizados. Os tratamentos de modificação de superfície usados
neste trabalho serão explicados em breve.
Nanotubos de TiO2
Titânio é amplamente utilizado para a fabricação de dispositivos biomédicos
e como a superfície do implante é responsável pelo processo de osseointegração,
é essencial modificar essa superfície para obter uma melhor biocompatibilidade.
Além disso, a adesão de uma superfície nanoestruturada aumenta em

Resumo detalhado em português 265
comparação com as superfícies metálicas usuais, demonstrando que os
nanotubos melhoram a osseointegração. Superfícies contendo nanotubos de TiO2
aumentam o crescimento celular e aumentam a deposição de hidroxiapatita (HAp)
[25]. A hidroxiapatita (Ca10(PO4)6(OH)2) tem similaridade química e estrutural com
o componente inorgânico da matriz óssea.
Crescimento de nanoestruturas de TiO2 por anodização eletroquímica.
Normalmente, os testes de anodização são realizados em uma célula
eletroquímica de dois ou três eletrodos com uma liga de titânio como ânodo, uma
folha de platina como o cátodo e, no caso de uma célula de três eletrodos com um
eletrodo Ag/AgCl como o eletrodo de referência. Um potencial constante é
aplicado usando uma fonte de energia DC [13].
Os principais processos na formação de nanotubos de TiO2 são (1) o
crescimento de óxido sobre a superfície do metal devido à interação do metal com
os íons de O2- ou OH- [26]. Após a formação de uma camada de óxido inicial,
estes ânions migram através da camada de óxido para atingir a interface de metal
/ óxido de onde reagem com o metal. (2) Migração de íons metálicos (Ti4+) do
metal na interface metal / óxido; Os cátions Ti4+ serão ejetados da interface metal /
óxido sob a aplicação de um campo elétrico que se moverá em direção à interface
óxido / eletrólito [27]. (3) Oxidação assistida por campo elétrico do óxido na
interface óxido / eletrólito. Devido ao campo elétrico aplicado, a ligação Ti-O sofre
polarização e é enfraquecida, promovendo a dissolução dos cátions metálicos. Os
cátions de Ti4+ se dissolvem no eletrólito, e os ânions livres de O2- migram em
direção à interface metal / óxido, processo (1), para interagir com o metal [27]. (4)
Dissolução química do metal, ou óxido, pelo eletrólito ácido. A dissolução química
do TiO2 no eletrólito de HF desempenha um papel crucial na formação de
nanotubos, ao invés de estruturas nanoporosas simples [27].
No presente trabalho foi investigada a formação de nanotubos de TiO2, por
anodização eletroquímica das ligas Ti13Nb13Zr e Ti35Nb7Zr5Ta, utilizando
soluções orgânicas contendo fluoretos.

Influência dos tratamentos de superfície nas propriedades de resistência
à corrosão de ligas de titânio de grão ultrafino para aplicações em implantes 266
Estrutura cristalina dos nanotubos de TiO2 e tratamentos térmicos
Posteriormente a anodização, os nanotubos de TiO2 são geralmente
amorfos [28,29]. Após o tratamento térmico (geralmente sob ar ou oxigênio), os
nanotubos de TiO2 podem cristalizar em forma de anatase ou rutilo; a conversão
para uma estrutura cristalizada pode ter um impacto significativo nas propriedades
mecânicas, ópticas, eletrônicas, químicas e biomédicas [30].
Para este projeto foi realizado tratamento térmico em superfícies com
nanotubos de TiO2, o tratamento térmico foi realizado a uma temperatura de 550 °
C por 2 horas para formar uma mistura de fases de anatase e rutilo.
Tratamento Ácido
O tratamento com ácido é frequentemente usado para remover o óxido e a
contaminação para obter acabamentos superficiais limpos e uniformes, gerando
também micro rugosidade superficial. Takeuchi et al. investigaram a eficiência de
descontaminação de três ácidos, Na2S2O8, H2SO4 e HCl, para a superfície de
titânio e descobriram que o HCl era um excelente agente de descontaminação
porque podia facilmente dissolver sais de titânio sem fragilizá-lo [17]. Demonstrou-
se que o ataque ácido melhora grandemente a osseointegração devido a que
favorece a formação de tecido ósseo entre a interface implante e osso [31]. Para
este trabalho, os ácidos clorídrico e fosfórico são de particular interesse, com o
objetivo de observar qual ácido favorece a formação da hidroxiapatita.
Tratamento alcalino
Um método químico simples foi estabelecido para induzir a bioatividade do
titânio e suas ligas. Quando substratos de ligas de titânio foram tratados com
solução aquosa de NaOH 10M e subsequentemente tratados termicamente a 60 °
C, uma camada fina de titanato de sódio foi formada em suas superfícies [32].
Assim, os substratos tratados formaram uma camada de apatita densa e uniforme
em suas superfícies em fluido corporal simulado (SBF) com concentrações iônicas
quase iguais às do plasma sanguíneo humano [32].

Resumo detalhado em português 267
Caracterização inicial das amostras da liga Ti13Nb13Zr
Diferentes condições superfície são estudadas neste trabalho, a fim de
resumir todas as superfícies modificadas com e sem deformação plástica severa.
A Tabela 1 nos mostra de uma maneira geral todas as superfícies de trabalhos
utilizadas nos testes de corrosão e bioatividade.
Tabela 1: Superfícies de trabalho iniciais da liga Ti13Nb13Zr com diferentes tratamentos
de modificação de superfície e com e sem processamento por HPT.

Influência dos tratamentos de superfície nas propriedades de resistência
à corrosão de ligas de titânio de grão ultrafino para aplicações em implantes 268
Caracterização eletroquímica da Liga Ti13Nb13Zr
Para reproduzir o mais próximo possível das condições do corpo humano,
as medidas eletroquímicas são realizadas em um meio fisiológico. Uma solução
que simula o fluido corporal (SBF-Simulated body fluid) foi utilizada como eletrólito
(NaCl 8,035 g L-1, KCl 0,225 g L-1, NaHCO3 0,355 g L-1, K2HPO4·3H2O 0,231 g L-1,
MgCl2·6H2O 0,311 g L-1, CaCl2 0,292 g L-1 e Na2SO4 0,072 g L-1). Ela reproduz a
parte inorgânica do plasma sanguíneo humano (não contém nenhum composto
orgânico e células). Neste estudo, a solução SBF foi preparada de acordo com o
protocolo detalhado proposto por Kokubo et al. (2006) [33] e a norma ISO 23317:
2014.
As medidas eletroquímicas apresentadas a seguir são, portanto, destinadas a
avaliar o impacto do tratamento de modificação de superfície e a deformação
plástica severa nas propriedades eletroquímicas em SBF para a liga Ti13Nb13Zr.
Algumas considerações para mencionar dos testes eletroquímicos realizados
para todas as condições existentes e para ambas as ligas (Ti13Nb13Zr e
Ti35Nb7Zr5Ta) são:
• Para reproduzir as condições fisiológicas da melhor forma possível, todas
as medições foram feitas no escuro.
• Por razões de reprodutibilidade, as medidas são repetidas três vezes (em
uma amostra diferente a cada vez, mas com a mesma morfologia e mesma
estrutura cristalina).
• As curvas de polarização são registradas em um intervalo de potencial de -
30 mV a +1.20 V em relação ao OCP (Open Circuit Potential), com uma
velocidade de varredura de 0,50 mV s-1.
• As simulações dos espectros EIS para todas as amostras foram realizadas
usando o software Simad desenvolvido pelo Laboratório de Interfaces e
Sistemas Eletroquímicos (LISE).

Resumo detalhado em português 269
• As medidas de espectroscopia de impedância são registradas para uma
faixa de frequência de 20 kHz a 20 mHz. A amplitude do sinal de
perturbação sinusoidal é de 10 mVrms.
Amostras polidas
As Figuras 2((a) e (b)) mostram as curvas de polarização anódicas e os
diagramas de Nyquist respectivamente em SBF a 37 ° C dos substratos com
superfície polida da liga Ti13Nb13Zr não processadas e processadas por HPT.
-0,8 -0,4 0,0 0,4 0,810
-10
10-9
10-8
10-7
10-6
10-5
10-4
i (A
/cm
2)
E vs SCE (V)
Sem deformar
1 GPa, 3 voltas
4.5 GPa, 3 voltas
0,0 5,0x10⁴
1,0x10⁵
0,0
5,0x10⁴
1,0x10⁵
1,5x10⁵
-''(
c
m2
)
'( cm2)
Sem deformar
1 GPa
4.5 GPa
Figura 2: Curvas de polarização anódica (a) e diagramas de Nyquist (b) dos substratos
polidos da liga Ti13Nb13Zr não processadas e processadas por HPT em meio fisiológico
em uma solução de SBF a pH 7,4 a 37 ° C.
As densidades de corrente, representadas no eixo das ordenadas da Figura
2(a), foram calculadas dividindo-se a corrente medida pela área geométrica (0,283
cm²). Considera-se que a corrente medida na região do anodo se deve
principalmente à reação de oxidação dos substratos ao TiO2, o que contribui para
o espessamento da camada passiva. Esta reação, que ocorre na interface de
metal/óxido [30].
As correntes de passivação são semelhantes para as condições sem
deformar como para as deformadas por HPT. Inicialmente para amostra sem
a) b)

Influência dos tratamentos de superfície nas propriedades de resistência
à corrosão de ligas de titânio de grão ultrafino para aplicações em implantes 270
deformar, a corrente de passivação tem um valor aproximado de: 2,00 µA / cm2.
Para amostras com deformação plástica severa, as correntes de passivação são:
2,95 µA / cm2, para a amostra com 1 GPa de deformação e 2,45 µA / cm2 para a
amostra com 4,5 GPa de deformação. Portanto, a deformação plástica severa não
tem efeito significativo na corrente de passivação para as amostras deformadas
comparando com o substrato sem deformação.
Para finalizar a caracterização eletroquímica das superfícies polidas, as
amostras foram submetidas a medidas de espectroscopia de impedância
eletroquímica. A Figura 2(b) mostra as medições da impedância por médio do
diagrama de Nyquist. A observação dos diagramas de Nyquist revela que a forma
do espectro de impedância para todos os substratos (arco) é típica de um sistema
capacitivo-resistivo (associações de fenômenos capacitivos, isto é, acumulações
de cargas e fenômenos resistivos, ou seja, transferências de carga ou resistência
de uma camada).
Os espectros de impedância experimentais foram analisados ajustando-se
a um circuito elétrico equivalente apropriado que descreve as propriedades do
sistema sob investigação. Como modelo, foi considerado para amostras com
bicamada composta de uma camada porosa externa e uma camada interna
densa. A Figura 3 apresenta o modelo selecionado o qual é representado por um
circuito equivalente Rs + Qa / (Ra+ (Qdl / Rct)). Onde Rs é a resistência da solução,
Ra é a resistência da camada porosa externa, Rct é a resistência à transferência de
carga, Qa é o elemento de fase constante para a camada porosa externa e Qdl é o
elemento de fase constante para a dupla camada elétrica na interface da camada
interna densa -eletrólito.

Resumo detalhado em português 271
Figura 3: Circuito equivalente usado para modelar os resultados dos substratos polidos
da liga Ti13Nb13Zr não processadas e processadas por HPT em meio fisiológico em uma
solução de SBF a pH 7,4 a 37 ° C.
Os resultados do ajuste do modelo são apresentados na Tabela 2. Em
geral, valores de resistência da solução entre 19 e 22 (Ω·cm2) e também altos
valores de resistência à transferência de carga entre 1,7x10⁵ e 3x10⁵ (Ω·cm2) são
observados, indicando uma alta resistência à corrosão. Além disso, as
capacidades efetivas (Ceff) da camada externa porosa e da camada interna densa
foram calculadas a partir dos parâmetros do elemento de fase constante usando a
fórmula Brug [34]:
𝐶𝑒𝑓𝑓(𝐵𝑟𝑢𝑔) = 𝑄1𝛼(𝑅𝑒
−1 + 𝑅𝑡−1)
𝛼−1𝛼
Esses valores de capacitância são dados na Tabela 2. Os valores de
capacitância para a camada externa porosa (Ceff(a)) foram entre 7 e 16 μF·cm−2.
Por outro lado, os resultados obtidos para a camada interna da barreira (Ceff(dl))
foram entre 17 a 20 µF·cm-2, que são típicos para uma capacitância de uma dupla
camada elétrica.
Considerando a camada como um capacitor planar, a espessura do filme
passivo δ (em nm) pode ser obtida a partir da equação:
𝛿 =𝜖 · 𝜖0
𝐶𝑒𝑓𝑓
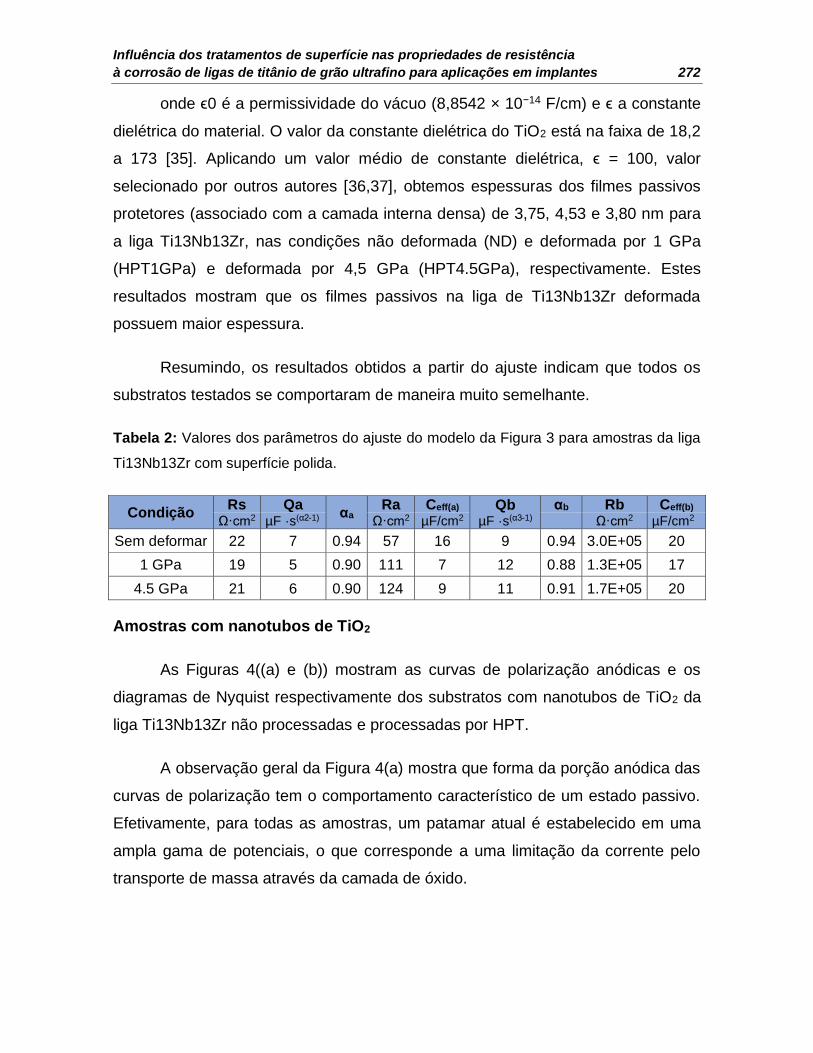
Influência dos tratamentos de superfície nas propriedades de resistência
à corrosão de ligas de titânio de grão ultrafino para aplicações em implantes 272
onde ϵ0 é a permissividade do vácuo (8,8542 × 10⁻¹⁴ F/cm) e ϵ a constante
dielétrica do material. O valor da constante dielétrica do TiO2 está na faixa de 18,2
a 173 [35]. Aplicando um valor médio de constante dielétrica, ϵ = 100, valor
selecionado por outros autores [36,37], obtemos espessuras dos filmes passivos
protetores (associado com a camada interna densa) de 3,75, 4,53 e 3,80 nm para
a liga Ti13Nb13Zr, nas condições não deformada (ND) e deformada por 1 GPa
(HPT1GPa) e deformada por 4,5 GPa (HPT4.5GPa), respectivamente. Estes
resultados mostram que os filmes passivos na liga de Ti13Nb13Zr deformada
possuem maior espessura.
Resumindo, os resultados obtidos a partir do ajuste indicam que todos os
substratos testados se comportaram de maneira muito semelhante.
Tabela 2: Valores dos parâmetros do ajuste do modelo da Figura 3 para amostras da liga
Ti13Nb13Zr com superfície polida.
Condição Rs Qa
αa Ra Ceff(a) Qb
µF ·s(α3-1) αb Rb Ceff(b)
Ω·cm2 µF ·s(α2-1) Ω·cm2 µF/cm2 Ω·cm2 µF/cm2
Sem deformar 22 7 0.94 57 16 9 0.94 3.0E+05 20
1 GPa 19 5 0.90 111 7 12 0.88 1.3E+05 17
4.5 GPa 21 6 0.90 124 9 11 0.91 1.7E+05 20
Amostras com nanotubos de TiO2
As Figuras 4((a) e (b)) mostram as curvas de polarização anódicas e os
diagramas de Nyquist respectivamente dos substratos com nanotubos de TiO2 da
liga Ti13Nb13Zr não processadas e processadas por HPT.
A observação geral da Figura 4(a) mostra que forma da porção anódica das
curvas de polarização tem o comportamento característico de um estado passivo.
Efetivamente, para todas as amostras, um patamar atual é estabelecido em uma
ampla gama de potenciais, o que corresponde a uma limitação da corrente pelo
transporte de massa através da camada de óxido.

Resumo detalhado em português 273
0,0 0,3 0,6 0,910
-10
10-9
10-8
10-7
10-6
10-5
10-4
i (A
/cm
2)
E vs SCE (V)
Sem deformar
1 GPa, 3 voltas
4.5 GPa, 3 voltas
0,0 1,0x10⁵
0,0
1,0x10⁵
2,0x10⁵
3,0x10⁵
4,0x10⁵
-''(
c
m2
)
'( cm2)
Sem deformar
1 GPa
4.5 GPa
Figura 4: Curvas de polarização anódica (a) e diagramas de Nyquist (b) dos substratos
com nanotubos de TiO2 da liga Ti13Nb13Zr não processadas e processadas por HPT em
meio fisiológico em uma solução de SBF a pH 7,4 a 37 ° C.
As correntes de passivação têm uma mudança drástica em comparação
com substratos polidos. Inicialmente para amostra sem deformar, a corrente de
passivação da liga Ti13Nb13Zr com TiO2 e nanotubos recozidos tem
aproximadamente o valor: 0,012 µA / cm2. Para amostras com deformação
plástica severa, as correntes de passivação são: 0,017 µA / cm2, para a amostra
com 1 GPa de deformação e 0,033 µA / cm2 para a amostra com 4,5 GPa de
deformação. Portanto, parece que a deformação plástica severa causa um ligeiro
aumento na corrente de passivação em comparação com o substrato sem
deformação.
A Figura 4(b) mostra as medições da impedância por médio do diagrama de
Nyquist. A observação dos diagramas de Nyquist revela que a forma do espectro
de impedância para todos os substratos é pseudo-capacitivo (inclinado em linha
reta), isto é, que as trocas de elétrons e, portanto, as reações, são muito limitadas
ou que a camada de óxido é muito resistiva.
a) b)
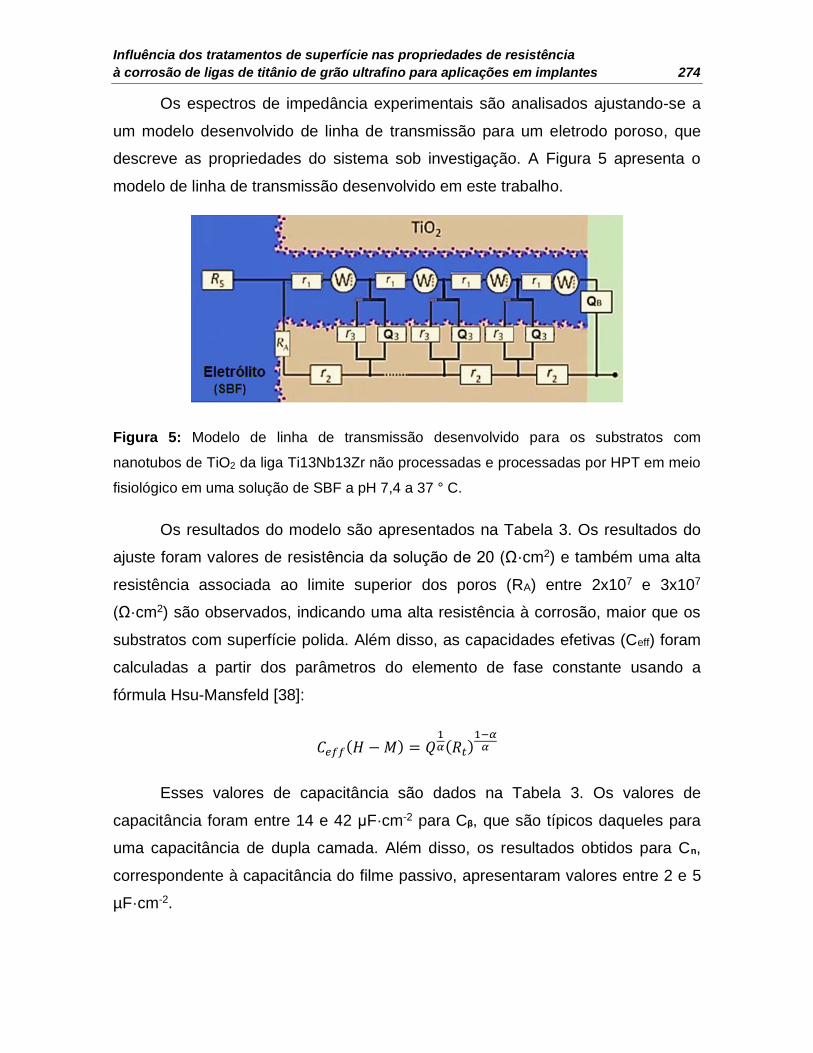
Influência dos tratamentos de superfície nas propriedades de resistência
à corrosão de ligas de titânio de grão ultrafino para aplicações em implantes 274
Os espectros de impedância experimentais são analisados ajustando-se a
um modelo desenvolvido de linha de transmissão para um eletrodo poroso, que
descreve as propriedades do sistema sob investigação. A Figura 5 apresenta o
modelo de linha de transmissão desenvolvido em este trabalho.
Figura 5: Modelo de linha de transmissão desenvolvido para os substratos com
nanotubos de TiO2 da liga Ti13Nb13Zr não processadas e processadas por HPT em meio
fisiológico em uma solução de SBF a pH 7,4 a 37 ° C.
Os resultados do modelo são apresentados na Tabela 3. Os resultados do
ajuste foram valores de resistência da solução de 20 (Ω·cm2) e também uma alta
resistência associada ao limite superior dos poros (RA) entre 2x10⁷ e 3x10⁷
(Ω·cm2) são observados, indicando uma alta resistência à corrosão, maior que os
substratos com superfície polida. Além disso, as capacidades efetivas (Ceff) foram
calculadas a partir dos parâmetros do elemento de fase constante usando a
fórmula Hsu-Mansfeld [38]:
𝐶𝑒𝑓𝑓(𝐻 − 𝑀) = 𝑄1𝛼(𝑅𝑡)
1−𝛼𝛼
Esses valores de capacitância são dados na Tabela 3. Os valores de
capacitância foram entre 14 e 42 μF·cm-2 para Cβ, que são típicos daqueles para
uma capacitância de dupla camada. Além disso, os resultados obtidos para Cn,
correspondente à capacitância do filme passivo, apresentaram valores entre 2 e 5
µF·cm-2.
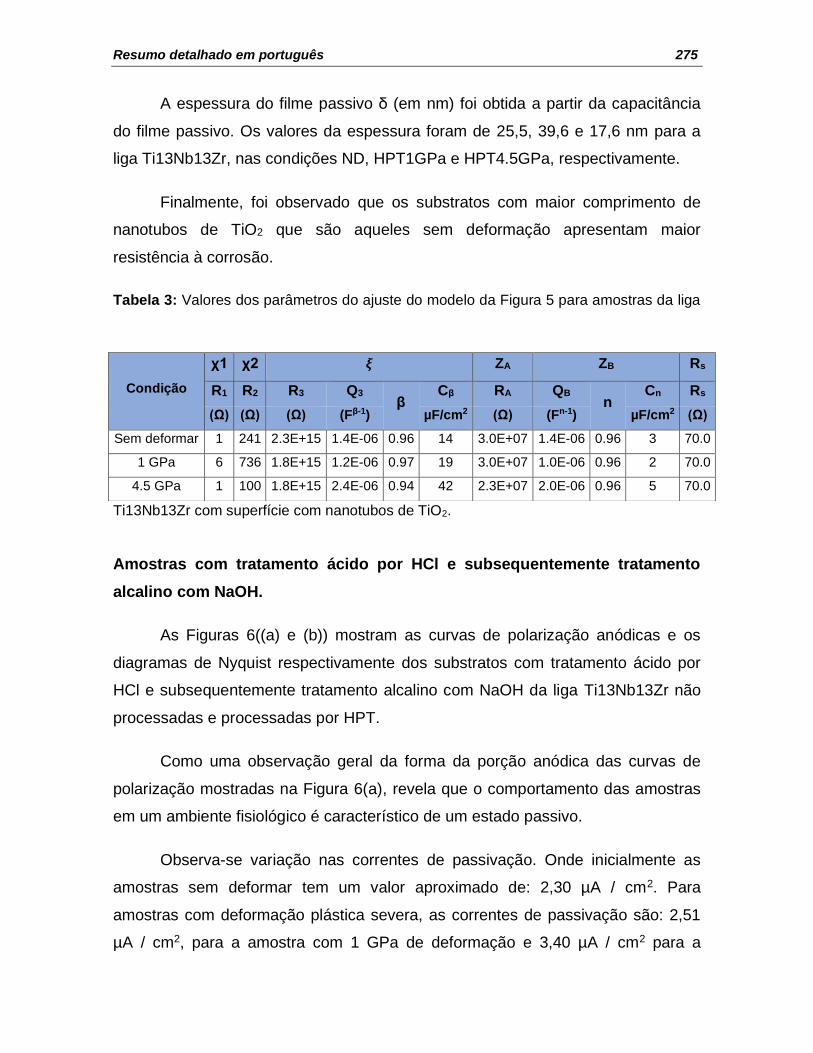
Resumo detalhado em português 275
A espessura do filme passivo δ (em nm) foi obtida a partir da capacitância
do filme passivo. Os valores da espessura foram de 25,5, 39,6 e 17,6 nm para a
liga Ti13Nb13Zr, nas condições ND, HPT1GPa e HPT4.5GPa, respectivamente.
Finalmente, foi observado que os substratos com maior comprimento de
nanotubos de TiO2 que são aqueles sem deformação apresentam maior
resistência à corrosão.
Tabela 3: Valores dos parâmetros do ajuste do modelo da Figura 5 para amostras da liga
Ti13Nb13Zr com superfície com nanotubos de TiO2.
Amostras com tratamento ácido por HCl e subsequentemente tratamento
alcalino com NaOH.
As Figuras 6((a) e (b)) mostram as curvas de polarização anódicas e os
diagramas de Nyquist respectivamente dos substratos com tratamento ácido por
HCl e subsequentemente tratamento alcalino com NaOH da liga Ti13Nb13Zr não
processadas e processadas por HPT.
Como uma observação geral da forma da porção anódica das curvas de
polarização mostradas na Figura 6(a), revela que o comportamento das amostras
em um ambiente fisiológico é característico de um estado passivo.
Observa-se variação nas correntes de passivação. Onde inicialmente as
amostras sem deformar tem um valor aproximado de: 2,30 µA / cm2. Para
amostras com deformação plástica severa, as correntes de passivação são: 2,51
µA / cm2, para a amostra com 1 GPa de deformação e 3,40 µA / cm2 para a
Condição
χ1 χ2 𝝃 ZA ZB Rs
R1 R2 R3 Q3 β
Cβ RA QB n
Cn Rs
(Ω) (Ω) (Ω) (Fβ-1) µF/cm2 (Ω) (Fn-1) µF/cm2 (Ω)
Sem deformar 1 241 2.3E+15 1.4E-06 0.96 14 3.0E+07 1.4E-06 0.96 3 70.0
1 GPa 6 736 1.8E+15 1.2E-06 0.97 19 3.0E+07 1.0E-06 0.96 2 70.0
4.5 GPa 1 100 1.8E+15 2.4E-06 0.94 42 2.3E+07 2.0E-06 0.96 5 70.0

Influência dos tratamentos de superfície nas propriedades de resistência
à corrosão de ligas de titânio de grão ultrafino para aplicações em implantes 276
amostra com 4,5 GPa de deformação. Deste modo, a deformação plástica severa
causa um ligeiro aumento na corrente de passivação em comparação com o
substrato sem deformação.
-0,4 0,0 0,4 0,810
-10
10-9
10-8
10-7
10-6
10-5
10-4
i (A
/cm
2)
E vs SCE (V)
Sem deformar
1 GPa, 3 voltas
4.5GPa, 3 voltas
0,0 1,0x10⁵
0,0
1,0x10⁵
2,0x10⁵
'( cm2)
-''(
c
m2
)
Sem deformar
1 GPa
4.5 GPa
Figura 6: Curvas de polarização anódica (a) e diagramas de Nyquist (b) dos substratos
com tratamento ácido por HCl e subsequentemente tratamento alcalino com NaOH da liga
Ti13Nb13Zr não processadas e processadas por HPT em meio fisiológico em uma
solução de SBF a pH 7,4 a 37 ° C.
A Figura 6(b) mostra as medições da impedância por médio do diagrama de
Nyquist. A observação dos diagramas de Nyquist revela que a forma do espectro
de impedância para todos os substratos (arco) é típica de um sistema capacitivo-
resistivo.
Os espectros de impedância experimentais são analisados ajustando-se a
um circuito elétrico equivalente apropriado que descreve as propriedades do
sistema sob investigação. Os espectros foram ajustados usando o circuito Rs + (Qb
/ Rb) + Qa /(Ra+(Qdl / Rct)), onde Rs representa a resistência da solução, Rb e Qb
representam a resistência e o elemento de fase constante para a camada porosa
externa, Ra e Qa representam a resistência e o elemento de fase constante para a
camada porosa intermédia, Rct e Qdl representam a resistência à transferência de
a) b)

Resumo detalhado em português 277
carga e o elemento de fase constante para a dupla camada elétrica na interface
camada interna densa- eletrólito. A Figura 7 apresenta o modelo selecionado.
Figura 7: Circuito equivalente usado para modelar os resultados dos substratos com
tratamento ácido por HCl e subsequentemente tratamento alcalino com NaOH da liga
Ti13Nb13Zr não processadas e processadas por HPT em meio fisiológico em uma
solução de SBF a pH 7,4 a 37 ° C.
Os resultados do ajuste do modelo e a capacitância efetiva associada ao
CPE calculada com a equação de Brug são apresentados na Tabela 4. A partir do
ajuste, obtemos valores de resistência da solução entre 20 e 22 (Ω·cm2) e também
altos valores de resistência à transferência de carga entre 6x10⁵ e 8x10⁵ (Ω·cm2),
indicando uma alta resistência à corrosão com valores levemente maiores que as
amostras com superfície polidas.
Com relação às capacitâncias, os valores para a capacitância da dupla
camada elétrica (Ceff (dl)) foram entre 14 e 19 μF·cm−2. Os valores de capacitância
para a camada externa porosa (Ceff(b)) e a camada porosa intermediária (Ceff(a))
foram menores que Ceff (dl).
Além disso, a espessura do filme passivo δ (em nm) foi obtida a partir da
capacitância da camada interna densa. Os valores da espessura foram de 4,05,

Influência dos tratamentos de superfície nas propriedades de resistência
à corrosão de ligas de titânio de grão ultrafino para aplicações em implantes 278
4,30 e 5,41 nm para a liga Ti13Nb13Zr, nas condições ND, HPT1GPa e
HPT4.5GPa, respectivamente. Estes resultados mostram que os filmes passivos
na liga de Ti13Nb13Zr deformada possuem maior espessura.
Tabela 4: Valores dos parâmetros do ajuste do modelo da Figura 7 para amostras da liga
Ti13Nb13Zr submetidas ao tratamento ácido por HCl e subsequentemente tratamento
alcalino com NaOH.
Condição
Elemento Sem deformar 1 GPa 4.5 GPa
Rs (Ω· cm2) 22 20 20
Qb (µF ·s(αb-1)) 52 28 43
αb 0.70 0.76 0.72
Rb (Ω· cm2) 28 15 15
Ceff(b) (µF/ cm2) 2.2 2.0 2.0
Qa (µF ·s(αa-1)) 19 11 55
αa 0.70 0.75 0.70
Ra (Ω· cm2) 7 2 10
Ceff(a) (µF/ cm2) 0.4 0.3 0.5
Qdl (µF ·s(αdl-1)) 21 39 19
αdl 0.98 0.90 0.96
Rct (Ω· cm2) 7.6E+05 6.8E+05 6.0E+05
Ceff(dl) (µF/cm2) 19 18 14
Amostras com tratamento ácido por H3PO4 e subsequentemente tratamento
alcalino com NaOH.
As Figuras 8((a) e (b)) mostram as curvas de polarização anódicas e os
diagramas de Nyquist respectivamente dos substratos com tratamento ácido por
H3PO4 e subsequentemente tratamento alcalino com NaOH da liga Ti13Nb13Zr
não processadas e processadas por HPT.

Resumo detalhado em português 279
-0,8 -0,4 0,0 0,4 0,810
-10
10-9
10-8
10-7
10-6
10-5
10-4
i (A
/cm
2)
E vs SCE (V)
Sem deformar
1 GPa, 3 voltas
4.5 GPa, 3 voltas
0,0 1,0x10⁵
0,0
5,0x10⁴
1,0x10⁵
1,5x10⁵
2,0x10⁵
-''(
c
m2
)
'( cm2
)
Sem deformar
1 GPa
4.5 GPa
Figura 8: Curvas de polarização anódica (a) e diagramas de Nyquist (b) dos substratos
com tratamento ácido por H3PO4 e subsequentemente tratamento alcalino com NaOH da
liga Ti13Nb13Zr não processadas e processadas por HPT em meio fisiológico em uma
solução de SBF a pH 7,4 a 37 ° C.
Observa-se o mesmo comportamento visto anteriormente para as outras
curvas de polarização onde a porção anódica das curvas de polarização revela um
comportamento passivo das amostras em SBF.
As correntes de passivação no estado sem deformar da liga Ti13Nb13Zr
com ataque ácido-ácido por H3PO4 e subsequentemente tratamento alcalino por
NaOH tem aproximadamente o valor de 4,05 µA / cm2. Para amostras com
deformação plástica severa, as correntes de passivação são: 5,13 µA / cm2, para a
amostra com 1 GPa de deformação e 4,21 µA / cm2 para a amostra com 4,5 GPa
de deformação. Portanto, parece que a deformação plástica severa não tem efeito
para altas pressões na corrente de passivação quando comparamos com o
substrato sem deformação.
A Figura 8(b) mostra as medições da impedância por médio do diagrama de
Nyquist. A observação dos diagramas de Nyquist revela que a forma do espectro
de impedância para todos os substratos é característica de um sistema capacitivo-
a) b)

Influência dos tratamentos de superfície nas propriedades de resistência
à corrosão de ligas de titânio de grão ultrafino para aplicações em implantes 280
resistivo. Os espectros de impedância experimentais são analisados ajustando-se
com o mesmo circuito elétrico equivalente utilizado para as amostras com ataque
ácido por HCl (Ver Figura 7).
Os resultados do ajuste do modelo e a capacitância efetiva associada ao
CPE calculada com a equação de Brug são apresentados na Tabela 5.
Tabela 5: Valores dos parâmetros do ajuste do modelo da Figura 7 para amostras da liga
Ti13Nb13Zr submetidas ao tratamento ácido por H3PO4 e subsequentemente tratamento
alcalino com NaOH.
Condição
Elemento Sem deformar 1 GPa 4.5 GPa
Rs (Ω· cm2) 20 20 20
Qb (µF ·s(αb-1)) 42 15 15
αb 0.72 0.81 0.78
Rb (Ω· cm2) 13 2 10
Ceff(b) (µF/ cm2) 1.9 1.3 1.2
Qa (µF ·s(αa-1)) 65 42 14
αa 0.78 0.82 0.77
Ra (Ω· cm2) 78 44 20
Ceff(a) (µF/ cm2) 9 8 1.0
Qdl (µF ·s(αdl-1)) 14 12 32
αdl 0.96 0.98 0.91
Rct (Ω· cm2) 5.1E+05 4.5E+05 7.1E+05
Ceff(dl) (µF/cm2) 10 10 15
Em geral, valores de resistência da solução de 20 (Ω·cm2) e também altos
valores de resistência à transferência de carga entre 5x10⁵ e 7x10⁵ (Ω·cm2) são
observados, indicando uma alta resistência à corrosão com valores levemente
maiores que as amostras com superfície polidas.
Com relação às capacitâncias, os valores para a capacitância da dupla
camada elétrica (Ceff (dl)) foram entre 10 e 15 μF·cm−2. Os valores de capacitância

Resumo detalhado em português 281
para a camada externa porosa (Ceff(b)) e a camada porosa intermediária (Ceff(a))
foram menores que Ceff (dl).
A espessura do filme passivo δ (em nm) foi obtida a partir da capacitância
da camada interna densa. Os valores da espessura foram de 7,62, 7,43 e 5,03 nm
para a liga Ti13Nb13Zr, nas condições ND, HPT1GPa e HPT4.5GPa,
respectivamente. Estes resultados mostram que o tratamento químico contribui
com o aumento da espessura do filme passivo.
Testes de bioatividade da liga Ti13Nb13Zr
Testes de bioatividade, cujo princípio é avaliar a capacidade do material
para formar espontaneamente apatita na superfície quando é imerso em SBF.
Essa capacidade é um critério essencial para determinar a biocompatibilidade de
um material. Neste estudo foram examinados depósitos de apatita após 1, 7 e 14
dias de imersão em SBF para as amostras da liga Ti13Nb13Zr com distintas
modificação de superfície assim como os diferentes graus de deformação por
HPT.
Amostras polidas
As observações de microscopia eletrônica de varrido (MEV) mostradas na
Figura 9, indicam que mesmo após 14 dias de imersão na solução fisiológica,
nenhuma formação de apatita é detectada nas superfícies dos substratos polidos
(independentemente da deformação por HPT).
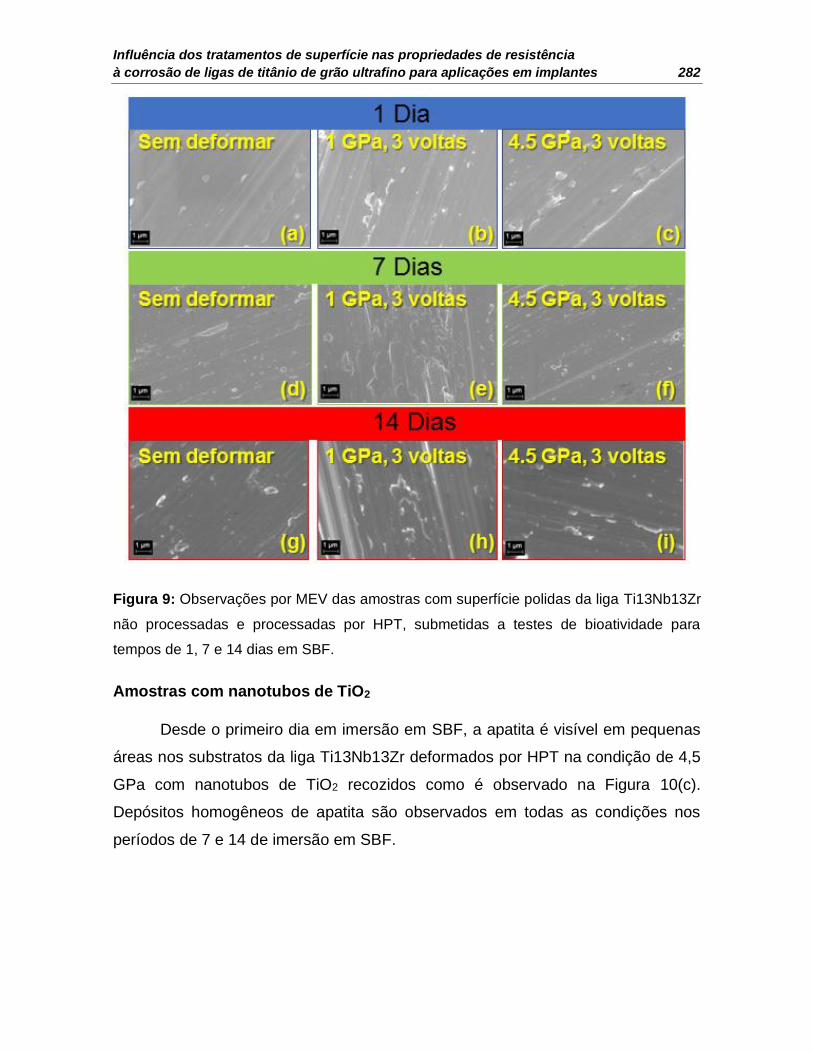
Influência dos tratamentos de superfície nas propriedades de resistência
à corrosão de ligas de titânio de grão ultrafino para aplicações em implantes 282
Figura 9: Observações por MEV das amostras com superfície polidas da liga Ti13Nb13Zr
não processadas e processadas por HPT, submetidas a testes de bioatividade para
tempos de 1, 7 e 14 dias em SBF.
Amostras com nanotubos de TiO2
Desde o primeiro dia em imersão em SBF, a apatita é visível em pequenas
áreas nos substratos da liga Ti13Nb13Zr deformados por HPT na condição de 4,5
GPa com nanotubos de TiO2 recozidos como é observado na Figura 10(c).
Depósitos homogêneos de apatita são observados em todas as condições nos
períodos de 7 e 14 de imersão em SBF.
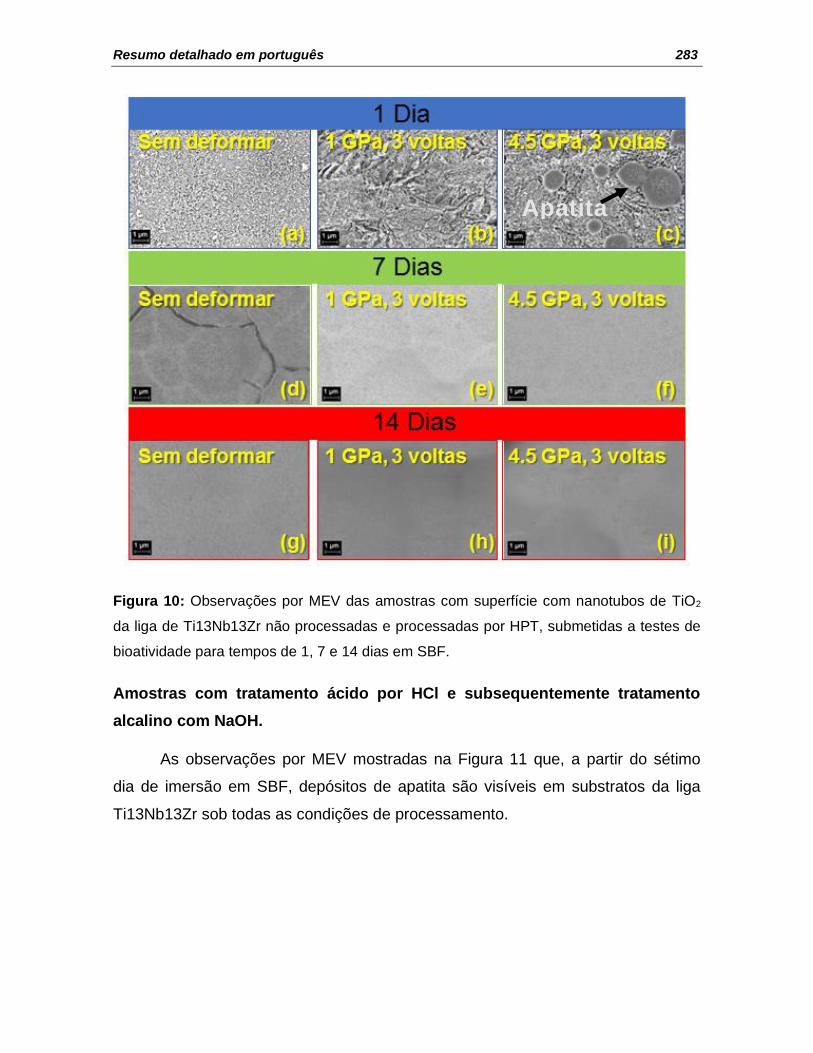
Resumo detalhado em português 283
Figura 10: Observações por MEV das amostras com superfície com nanotubos de TiO2
da liga de Ti13Nb13Zr não processadas e processadas por HPT, submetidas a testes de
bioatividade para tempos de 1, 7 e 14 dias em SBF.
Amostras com tratamento ácido por HCl e subsequentemente tratamento
alcalino com NaOH.
As observações por MEV mostradas na Figura 11 que, a partir do sétimo
dia de imersão em SBF, depósitos de apatita são visíveis em substratos da liga
Ti13Nb13Zr sob todas as condições de processamento.
Apatita

Influência dos tratamentos de superfície nas propriedades de resistência
à corrosão de ligas de titânio de grão ultrafino para aplicações em implantes 284
Figura 11: Observações por MEV das amostras com superfície com tratamento ácido por
HCl e subsequentemente tratamento alcalino com NaOH da liga de Ti13Nb13Zr não
processada e processada por HPT, submetidas a testes de bioatividade para tempos de
1, 7 e 14 dias em SBF.
Amostras com tratamento ácido por H3PO4 e subsequentemente tratamento
alcalino com NaOH.
As observações por MEV mostradas na Figura 12, indicam que a partir do
sétimo dia de imersão em SBF, depósitos de apatita são visíveis em substratos da
liga Ti13Nb13Zr sob todas as condições de processamento.
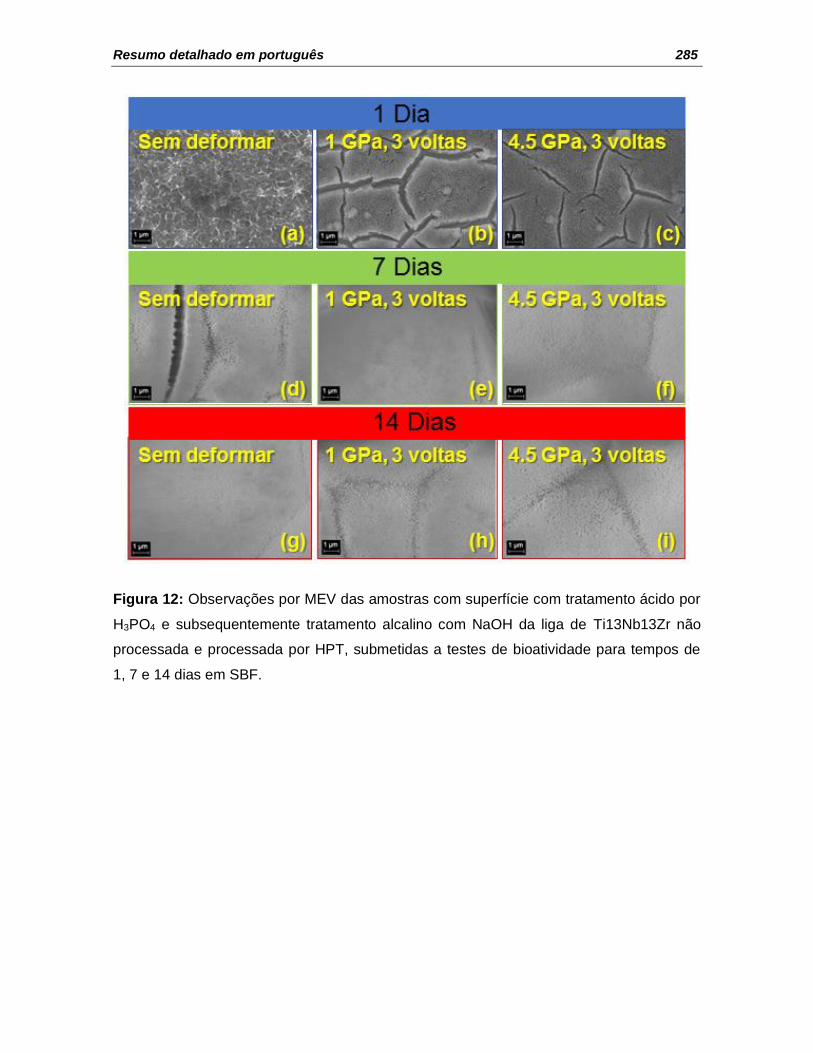
Resumo detalhado em português 285
Figura 12: Observações por MEV das amostras com superfície com tratamento ácido por
H3PO4 e subsequentemente tratamento alcalino com NaOH da liga de Ti13Nb13Zr não
processada e processada por HPT, submetidas a testes de bioatividade para tempos de
1, 7 e 14 dias em SBF.

Influência dos tratamentos de superfície nas propriedades de resistência
à corrosão de ligas de titânio de grão ultrafino para aplicações em implantes 286
Caracterização inicial das amostras da liga Ti35Nb7Zr5Ta
Diferentes condições superfície são estudadas neste trabalho, a fim de
resumir todas as superfícies modificadas com e sem deformação plástica severa.
A Tabela 6 nos mostra de uma maneira geral todas as superfícies de trabalhos
utilizadas nos testes de corrosão e bioatividade.
Tabela 6: Superfícies de trabalho iniciais da liga Ti35Nb7Zr5Ta com diferentes
tratamentos de modificação de superfície, com e sem processamento por HPT.
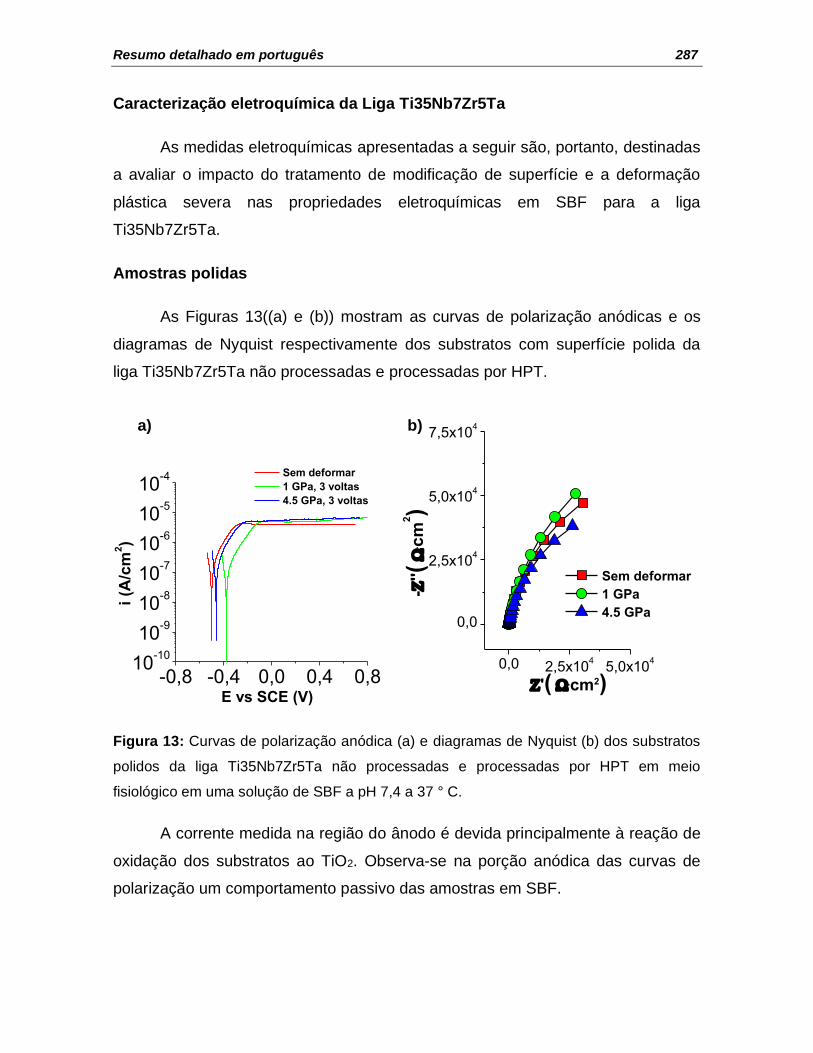
Resumo detalhado em português 287
Caracterização eletroquímica da Liga Ti35Nb7Zr5Ta
As medidas eletroquímicas apresentadas a seguir são, portanto, destinadas
a avaliar o impacto do tratamento de modificação de superfície e a deformação
plástica severa nas propriedades eletroquímicas em SBF para a liga
Ti35Nb7Zr5Ta.
Amostras polidas
As Figuras 13((a) e (b)) mostram as curvas de polarização anódicas e os
diagramas de Nyquist respectivamente dos substratos com superfície polida da
liga Ti35Nb7Zr5Ta não processadas e processadas por HPT.
-0,8 -0,4 0,0 0,4 0,810
-10
10-9
10-8
10-7
10-6
10-5
10-4
i (A
/cm
2)
E vs SCE (V)
Sem deformar
1 GPa, 3 voltas
4.5 GPa, 3 voltas
0,0 2,5x10⁴
5,0x10⁴
0,0
2,5x10⁴
5,0x10⁴
7,5x10⁴
-''(
c
m2
)
'( cm2)
Sem deformar
1 GPa
4.5 GPa
Figura 13: Curvas de polarização anódica (a) e diagramas de Nyquist (b) dos substratos
polidos da liga Ti35Nb7Zr5Ta não processadas e processadas por HPT em meio
fisiológico em uma solução de SBF a pH 7,4 a 37 ° C.
A corrente medida na região do ânodo é devida principalmente à reação de
oxidação dos substratos ao TiO2. Observa-se na porção anódica das curvas de
polarização um comportamento passivo das amostras em SBF.
a) b)

Influência dos tratamentos de superfície nas propriedades de resistência
à corrosão de ligas de titânio de grão ultrafino para aplicações em implantes 288
Nota-se na condição sem deformar uma corrente de passivação com um
valor de: 3,52 µA / cm2. Para amostras com deformação plástica severa, as
correntes de passivação são: 5,18 µA / cm2, para a amostra com 1 GPa de
deformação e 6,03 µA / cm2 para a amostra com 4,5 GPa de deformação.
Portanto, parece que a deformação plástica severa causa um ligeiro aumento na
corrente de passivação em comparação com o substrato sem deformação.
A Figura 13(b) mostra as medições da impedância por médio do diagrama
de Nyquist. A observação dos diagramas de Nyquist revela que a forma do
espectro de impedância para todos os substratos é característica de um sistema
capacitivo-resistivo. Os espectros de impedância experimentais são analisados
ajustando-se com o mesmo circuito elétrico equivalente utilizado para as amostras
da liga Ti13Nb13Zr com superfície polida (Ver Figura 3).
Os resultados do ajuste do modelo e a capacitância efetiva associada ao
CPE calculada com a equação de Brug são apresentados na Tabela 7. A partir do
ajuste, obtemos valores de resistência da solução entre 21 e 22 (Ω·cm2) e também
altos valores de resistência à transferência de carga entre 1x10⁵ e 1.7x10⁵ (Ω·cm2)
são observados, indicando uma alta resistência à corrosão.
Por outro lado, os valores de capacitância para a camada porosa externa
(Ceff(a)) foram entre 12 a 17 μF·cm-2. Além disso, os resultados obtidos para a
dupla camada elétrica (Ceff(dl)) foram entre 40 a 49 µF·cm-2.
A espessura do filme passivo δ (em nm) foi obtida a partir da capacitância
da camada interna densa. Os valores da espessura foram de 1,52, 1,90 e 1,70 nm
para a liga Ti35Nb7Zr5Ta, nas condições ND, HPT1GPa e HPT4.5GPa,
respectivamente. Estes resultados mostram que os filmes passivos na liga
Ti35Nb7Zr5Ta deformada possuem maior espessura.

Resumo detalhado em português 289
Tabela 7: Valores dos parâmetros do ajuste do modelo da Figura 3 para amostras da liga
Ti35Nb7Zr5Ta com superfície polida.
Condição Rs Qa
αa Ra Ceff(a) Qb
µF ·s(α3-1) αb Rb Ceff(b)
Ω·cm2 µF ·s(α2-1) Ω·cm2 µF/cm2 Ω·cm2 µF/cm2
Sem deformar 20 10 0.91 77 17 23 0.93 1.1E+05 49
1 GPa 21 10 0.89 129 15 22 0.91 1.7E+05 40
4.5 GPa 21 9 0.89 186 12 28 0.89 1.1E+05 44
Amostras com nanotubos de TiO2
As Figuras 14((a) e (b)) mostram as curvas de polarização anódicas e os
diagramas de Nyquist respectivamente dos substratos com nanotubos de TiO2 da
liga Ti35Nb7Zr5Ta não processadas e processadas por HPT.
0,0 0,3 0,6 0,910
-10
10-9
10-8
10-7
10-6
10-5
10-4
i (A
/cm
2)
E vs SCE (V)
Sem deformar
1 GPa, 3 voltas
4.5 GPa, 3 voltas
0,0 5,0x10⁴
0,0
5,0x10⁴
1,0x10⁵
1,5x10⁵
-''(
c
m2
)
'( cm2)
Sem deformar
1 GPa
4.5 GPa
Figura 14: Curvas de polarização anódica (a) e diagramas de Nyquist (b) dos substratos
com nanotubos de TiO2 da liga Ti35Nb7Zr5Ta não processadas e processadas por HPT
em meio fisiológico em uma solução de SBF a pH 7,4 a 37 ° C.
A forma da porção anódica das curvas de polarização mostrada na Figura
14(a) revela que o comportamento das amostras em um ambiente fisiológico é
característico de um estado passivo.
a) b)

Influência dos tratamentos de superfície nas propriedades de resistência
à corrosão de ligas de titânio de grão ultrafino para aplicações em implantes 290
Inicialmente, a corrente de passivação da liga Ti35Nb7Zr5Ta sem deformar
tem um valor aproximado de: 0,16 µA / cm2. Para amostras com deformação
plástica severa, as correntes de passivação são: 0,19 µA / cm2, para a amostra
com 1 GPa de deformação e 0,52 µA / cm2 para a amostra com 4,5 GPa de
deformação. Portanto, parece que a deformação plástica severa causa um ligeiro
aumento na corrente de passivação em comparação com o substrato sem
deformação.
A Figura 14(b) mostra as medições da impedância por médio do diagrama
de Nyquist. A observação dos diagramas de Nyquist revela que a forma do
espectro de impedância para todos os substratos é pseudo-capacitivo (inclinado
em linha reta), isto é, que as trocas de elétrons e, portanto, as reações, são muito
limitadas ou que a camada de óxido é muito resistiva.
Os espectros de impedância experimentais são analisados ajustando-se ao
mesmo modelo de linha de transmissão utilizado para a liga de Ti13Nb13Zr com
nanotubos de TiO2 (Ver Figura 5).
Os resultados do ajuste do modelo e a capacitância efetiva associada ao
CPE calculada com a equação deHsu-Mansfeld são apresentados na Tabela 8.
Em geral, valores de resistência da solução entre 20 e 21 (Ω·cm2) e também uma
alta resistência associada ao limite superior dos poros (RA) entre 2x10⁶ e 8x10⁶
(Ω·cm2) foram observados, indicando uma alta resistência à corrosão e este valor
é maior em comparação com os substratos com superfície polida.
Os valores de capacitância foram entre 33 e 66 μF·cm-2 para Cβ, que são
típicos daqueles para uma capacitância de dupla camada. Além disso, os
resultados obtidos para Cn, correspondente à capacitância do filme passivo,
apresentaram valores entre 2 e 4 µF·cm-2.
A espessura do filme passivo δ (em nm) foi obtida a partir da capacitância
do filme passivo. Os valores da espessura foram de 47,4, 34,3 e 22,3 nm para a
liga Ti35Nb7Zr5Ta, nas condições ND, HPT1GPa e HPT4.5GPa, respectivamente.
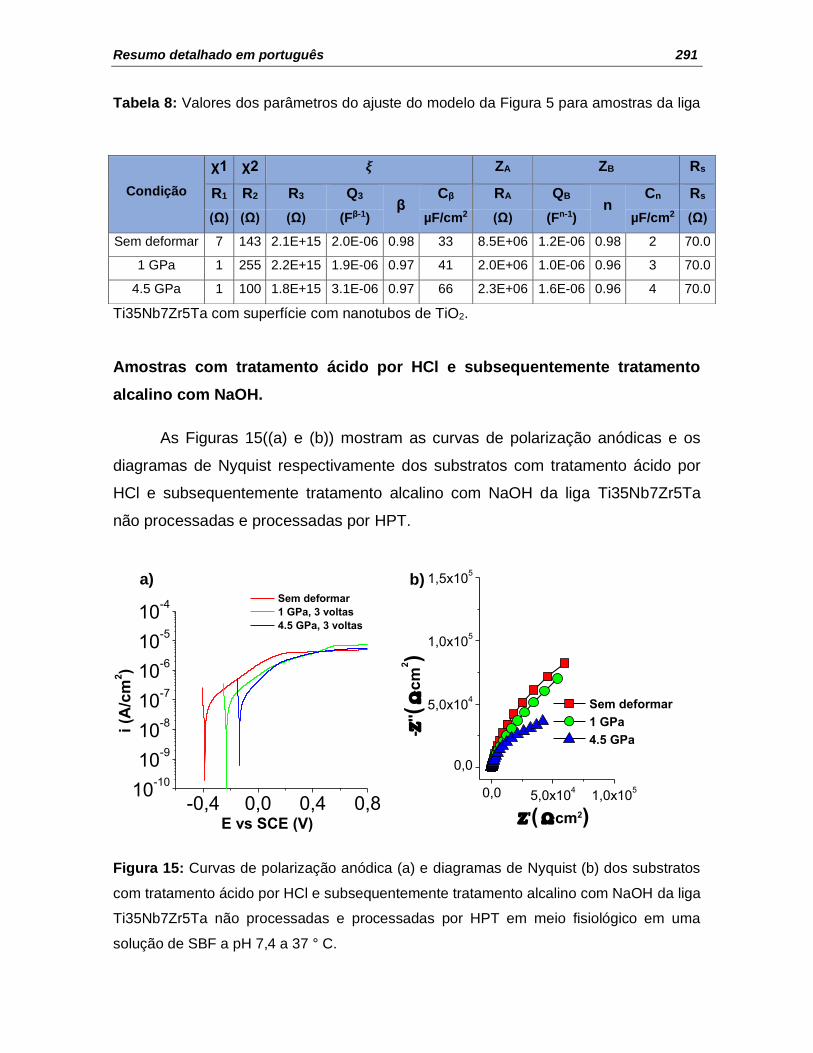
Resumo detalhado em português 291
Tabela 8: Valores dos parâmetros do ajuste do modelo da Figura 5 para amostras da liga
Ti35Nb7Zr5Ta com superfície com nanotubos de TiO2.
Amostras com tratamento ácido por HCl e subsequentemente tratamento
alcalino com NaOH.
As Figuras 15((a) e (b)) mostram as curvas de polarização anódicas e os
diagramas de Nyquist respectivamente dos substratos com tratamento ácido por
HCl e subsequentemente tratamento alcalino com NaOH da liga Ti35Nb7Zr5Ta
não processadas e processadas por HPT.
Sem deformar
1 GPa, 3 voltas
4.5 GPa, 3 voltas
-0,4 0,0 0,4 0,810
-10
10-9
10-8
10-7
10-6
10-5
10-4
i (A
/cm
2)
E vs SCE (V)
Sem deformar
1 GPa
4.5 GPa
0,0 5,0x10⁴
1,0x10⁵
0,0
5,0x10⁴
1,0x10⁵
1,5x10⁵
-''(
c
m2
)
'( cm2)
Figura 15: Curvas de polarização anódica (a) e diagramas de Nyquist (b) dos substratos
com tratamento ácido por HCl e subsequentemente tratamento alcalino com NaOH da liga
Ti35Nb7Zr5Ta não processadas e processadas por HPT em meio fisiológico em uma
solução de SBF a pH 7,4 a 37 ° C.
Condição
χ1 χ2 𝝃 ZA ZB Rs
R1 R2 R3 Q3 β
Cβ RA QB n
Cn Rs
(Ω) (Ω) (Ω) (Fβ-1) µF/cm2 (Ω) (Fn-1) µF/cm2 (Ω)
Sem deformar 7 143 2.1E+15 2.0E-06 0.98 33 8.5E+06 1.2E-06 0.98 2 70.0
1 GPa 1 255 2.2E+15 1.9E-06 0.97 41 2.0E+06 1.0E-06 0.96 3 70.0
4.5 GPa 1 100 1.8E+15 3.1E-06 0.97 66 2.3E+06 1.6E-06 0.96 4 70.0
a) b)

Influência dos tratamentos de superfície nas propriedades de resistência
à corrosão de ligas de titânio de grão ultrafino para aplicações em implantes 292
As amostras exibem um comportamento passivo para uma amplia gama de
potenciais. Inicialmente, a corrente de passivação para as amostras sem
deformação tem aproximadamente um valor de: 4,58 µA / cm2. Para amostras com
deformação plástica severa, as correntes de passivação são: 7,20 µA / cm2, para a
amostra com 1 GPa de deformação e 5,21 µA / cm2 para a amostra com 4,5 GPa
de deformação. Portanto, parece que a deformação plástica severa causa um
ligeiro aumento na corrente de passivação em comparação com o substrato sem
deformação.
A Figura 15(b) mostra as medições da impedância por médio do diagrama
de Nyquist. A observação dos diagramas de Nyquist revela que a forma do
espectro de impedância para todos os substratos é característica de um sistema
capacitivo-resistivo. Os espectros de impedância experimentais foram analisados
ajustando-se com o mesmo circuito elétrico equivalente utilizado para as amostras
da liga Ti13Nb13Zr com ataque ácido por HCl (Ver Figura 7).
Os resultados do ajuste do modelo e a capacitância efetiva associada ao
CPE calculada com a equação de Brug são apresentados na Tabela 9. A partir do
ajuste, obtemos valores de resistência da solução entre 20 e 21 (Ω·cm2) e também
são observados altos valores de resistência à transferência de carga entre 8,4x10⁴
e 3x10⁵ (Ω·cm2), indicando uma alta resistência à corrosão com valores levemente
maiores que as amostras com superfície polidas.
Com relação às capacitâncias, os valores para a capacitância da dupla
camada elétrica (Ceff (dl)) foram entre 10 e 18 μF·cm−2. Os valores de capacitância
para a camada externa porosa (Ceff(b)) e a camada porosa intermediária (Ceff(a))
foram menores que Ceff (dl).
Além disso, a espessura do filme δ (em nm) foi obtida a partir da
capacitância da camada interna densa. Os valores da espessura foram de 4,07,
7,87 e 7,43 nm para a liga Ti35Nb7Zr5Ta, nas condições ND, HPT1GPa e
HPT4.5GPa, respectivamente. Estes resultados mostram que os filmes passivos
na liga de Ti35Nb7Zr5Ta deformada possuem maior espessura.

Resumo detalhado em português 293
Tabela 9: Valores dos parâmetros do ajuste do modelo da Figura 7 para amostras da liga
Ti35Nb7Zr5Ta submetidas ao tratamento ácido por HCl e subsequentemente tratamento
alcalino com NaOH.
Condição
Elemento Sem deformar 1 GPa 4.5 GPa
Rs (Ω·cm2) 21 20 20
Qb (µF ·s(αb-1)) 42 40 40
αb 0.72 0.72 0.72
Rb (Ω·cm2) 10 9 3
Ceff(b) (µF/cm2) 1.8 1.6 1.1
Qa (µF ·s(αa-1)) 19 33 47
αa 0.70 0.71 0.80
Ra (Ω·cm2) 1 1 24
Ceff(a) (µF/cm2) 0.2 0.5 7.3
Qdl (µF ·s(αdl-1)) 32 17 12
αdl 0.93 0.93 0.98
Rct (Ω·cm2) 3.3E+05 2.7E+05 8.4E+04
Ceff(dl) (µF/cm2) 18 10 10
Amostras com tratamento ácido por H3PO4 e subsequentemente tratamento
alcalino com NaOH.
As Figuras 16((a) e (b)) mostram as curvas de polarização anódicas e os
diagramas de Nyquist respectivamente dos substratos com tratamento ácido por
H3PO4 e subsequentemente tratamento alcalino com NaOH da liga Ti35Nb7Zr5Ta
não processadas e processadas por HPT.
Como todas as amostras analisadas, observa-se um comportamento
passivo para uma ampla gama de potenciais. Inicialmente, a corrente de
passivação para as amostras sem deformar tem aproximadamente um valor de:
8,24 µA / cm2. Para amostras com deformação plástica severa, as correntes de
passivação são: 10,80 µA / cm2, para a amostra com 1 GPa de deformação e

Influência dos tratamentos de superfície nas propriedades de resistência
à corrosão de ligas de titânio de grão ultrafino para aplicações em implantes 294
10,80 µA / cm2 para a amostra com 4,5 GPa de deformação. Portanto, parece que
a deformação plástica severa causa um ligeiro aumento na corrente de passivação
em comparação com o substrato sem deformação.
Sem deformar
1 GPa, 3 voltas
4.5 GPa, 3 voltas
-0,4 0,0 0,4 0,810
-10
10-9
10-8
10-7
10-6
10-5
10-4
i (A
/cm
2)
E vs SCE (V)
Sem deformar
1 GPa
4.5 GPa
0,0 5,0x10⁴
1,0x10⁵
0,0
5,0x10⁴
1,0x10⁵
1,5x10⁵
-''(
c
m2
)
'( cm2)
Figura 16: Curvas de polarização anódica (a) e diagramas de Nyquist (b) dos substratos
com tratamento ácido por H3PO4 e subsequentemente tratamento alcalino com NaOH da
liga Ti35Nb7Zr5Ta não processadas e processadas por HPT em meio fisiológico em uma
solução de SBF a pH 7,4 a 37 ° C.
A Figura 16(b) mostra as medições da impedância por médio do diagrama
de Nyquist. A observação dos diagramas de Nyquist revela que a forma do
espectro de impedância para todos os substratos é característica de um sistema
capacitivo-resistivo. Os espectros de impedância experimentais são analisados
ajustando-se com o mesmo circuito elétrico equivalente utilizado para as amostras
da liga Ti13Nb13Zr com ataque ácido por H3PO4 (Ver Figura 7).
Os resultados do ajuste do modelo são apresentados na Tabela 10. A partir
do ajuste, obtemos valores de resistência da solução de 20 (Ω·cm2) e também
altos valores de resistência à transferência de carga entre 2x10⁴ e 2x10⁵ (Ω·cm2),
indicando uma alta resistência à corrosão.
a) b)

Resumo detalhado em português 295
Com relação às capacitâncias, os valores para a capacitância da dupla
camada elétrica (Ceff (dl)) foram entre 10 e 19 μF·cm−2. Os valores de capacitância
para a camada externa porosa (Ceff(b)) e a camada porosa intermediária (Ceff(a))
foram menores que Ceff (dl).
A espessura do filme passivo δ (em nm) foi obtida a partir da capacitância
da camada interna densa. Os valores da espessura foram 3,98, 7,62 e 7,69 nm
para a liga Ti35Nb7Zr5Ta, nas condições ND, HPT1GPa e HPT4.5GPa,
respectivamente. Estes resultados mostram que os filmes passivos na liga de
Ti35Nb7Zr5Ta deformada possuem maior espessura.
Tabela 10: Valores dos parâmetros do ajuste do modelo da Figura 7 para amostras da
liga Ti35Nb7Zr5Ta submetidas ao tratamento ácido por H3PO4 e subsequentemente
tratamento alcalino com NaOH.
Condição
Elemento Sem deformar 1 GPa 4.5 GPa
Rs (Ω·cm2) 20 20 20
Qb (µF ·s(αb-1)) 40 53 15
αb 0.73 0.70 0.80
Rb (Ω·cm2) 9 7 4
Ceff(b) (µF/cm2) 1.8 1.6 1.3
Qa (µF ·s(αa-1)) 6 6 37
αa 0.72 0.78 0.84
Ra (Ω·cm2) 3 1 10
Ceff(a) (µF/cm2) 0.1 4.3 7.5
Qdl (µF ·s(αdl-1)) 47 54 54
αdl 0.88 0.80 0.80
Rct (Ω·cm2) 2.2E+05 1.0E+05 2.5E+04
Ceff(dl) (µF/cm2) 19 10 10

Influência dos tratamentos de superfície nas propriedades de resistência
à corrosão de ligas de titânio de grão ultrafino para aplicações em implantes 296
Testes de bioatividade da liga Ti35Nb7Zr5Ta
Neste estudo foram examinados depósitos de apatita após 1, 7 e 14 dias de
imersão em SBF para as amostras da liga Ti35Nb7Zr5Ta com distintas
modificação de superfície assim como os diferentes graus de deformação por
HPT.
Amostras polidas
As observações microscopia eletrônica de varrido (MEV) mostram na Figura
17 que, mesmo após 14 dias de imersão na solução fisiológica, nenhuma
formação de apatita é detectada nas superfícies dos substratos polidos da liga
Ti35Nb7Zr5Ta.
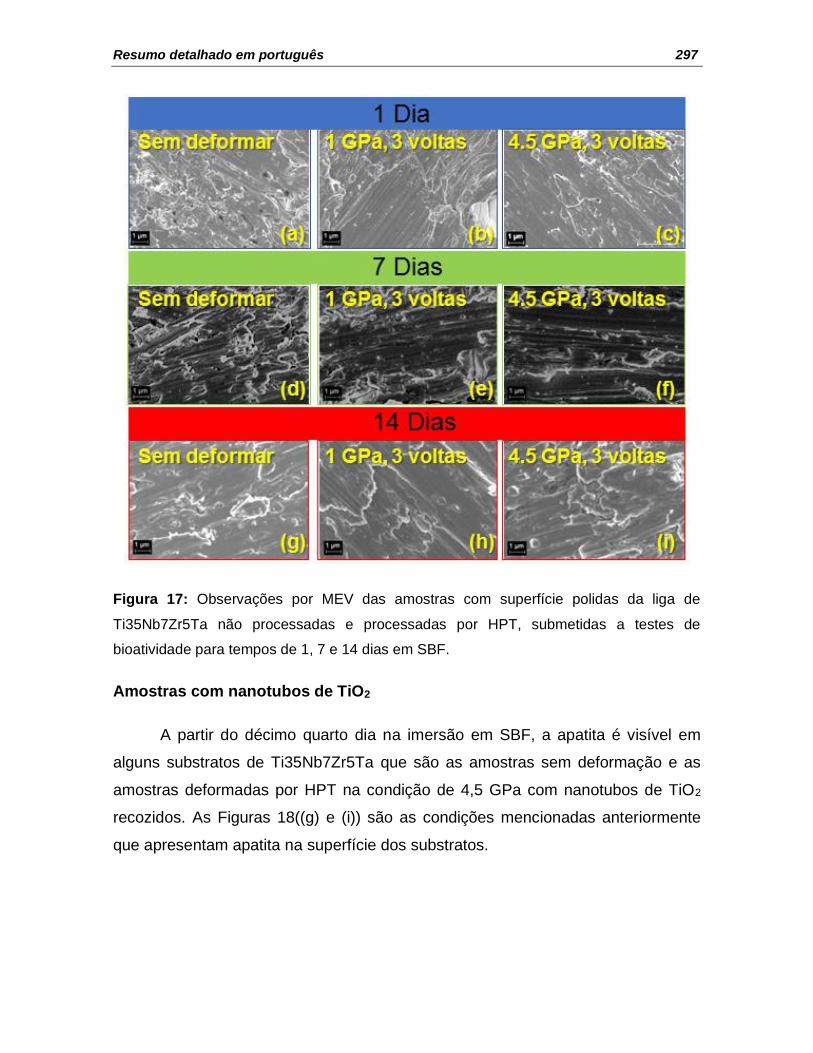
Resumo detalhado em português 297
Figura 17: Observações por MEV das amostras com superfície polidas da liga de
Ti35Nb7Zr5Ta não processadas e processadas por HPT, submetidas a testes de
bioatividade para tempos de 1, 7 e 14 dias em SBF.
Amostras com nanotubos de TiO2
A partir do décimo quarto dia na imersão em SBF, a apatita é visível em
alguns substratos de Ti35Nb7Zr5Ta que são as amostras sem deformação e as
amostras deformadas por HPT na condição de 4,5 GPa com nanotubos de TiO2
recozidos. As Figuras 18((g) e (i)) são as condições mencionadas anteriormente
que apresentam apatita na superfície dos substratos.

Influência dos tratamentos de superfície nas propriedades de resistência
à corrosão de ligas de titânio de grão ultrafino para aplicações em implantes 298
Figura 18: Observações por MEV das amostras com superfície com nanotubos de TiO2
da liga de Ti35Nb7Zr5Ta não processadas e processadas por HPT, submetidas a testes
de bioatividade para tempos de 1, 7 e 14 dias em SBF.
Amostras com tratamento ácido por HCl e subsequentemente tratamento
alcalino com NaOH.
As observações microscopia eletrônica de varrido (MEV) mostram que a
partir do décimo quarto dia na imersão em SBF, a apatita é visível em alguns
substratos da liga Ti35Nb7Zr5Ta. Os substratos sem deformação e deformados
por HPT na condição de 4,5 GPa são aqueles que formaram apatita na sua
superfície e podem ser observados nas Figuras 19((g) e (i)).

Resumo detalhado em português 299
Figura 19: Observações por MEV das amostras com superfície com tratamento ácido por
HCl e subsequentemente tratamento alcalino com NaOH da liga de Ti35Nb7Zr5Ta não
processada e processada por HPT, submetidas a testes de bioatividade para tempos de
1, 7 e 14 dias em SBF.
Amostras com tratamento ácido por H3PO4 e subsequentemente tratamento
alcalino com NaOH.
As observações microscopia eletrônica de varrido (MEV) mostram na Figura
20 que, mesmo após 14 dias de imersão na solução fisiológica, nenhuma
formação de apatita é detectada nas superfícies dos substratos
(independentemente da deformação por HPT).
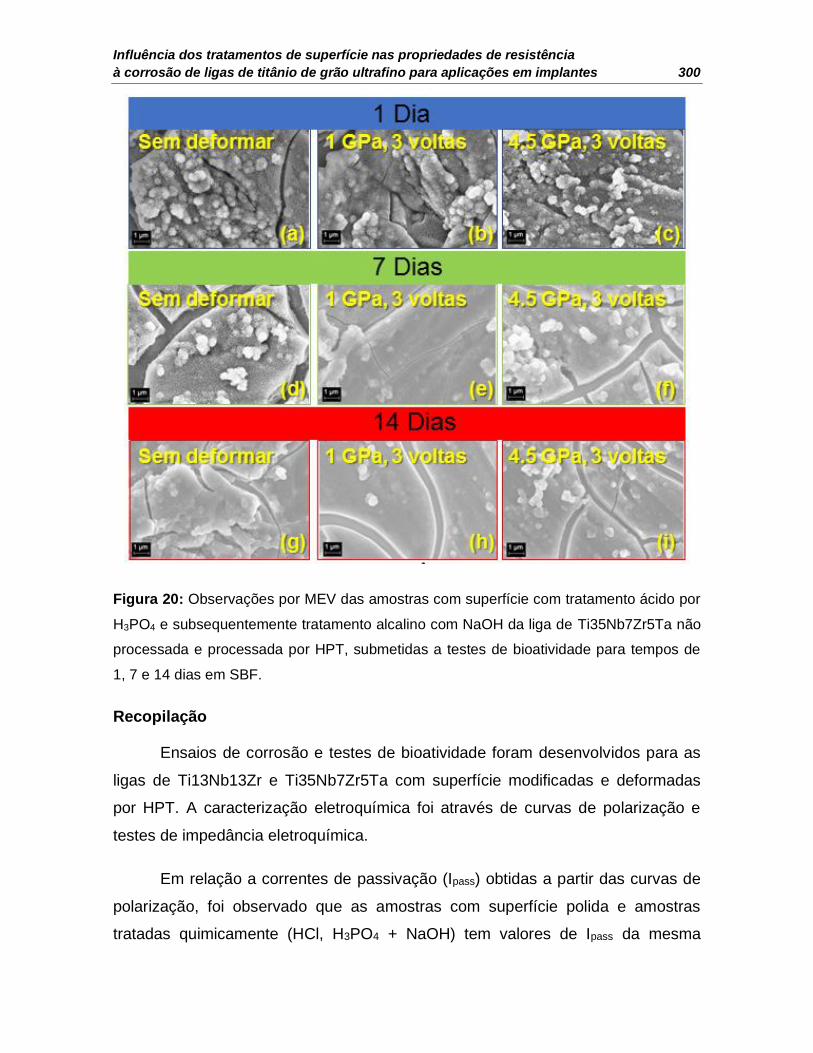
Influência dos tratamentos de superfície nas propriedades de resistência
à corrosão de ligas de titânio de grão ultrafino para aplicações em implantes 300
Figura 20: Observações por MEV das amostras com superfície com tratamento ácido por
H3PO4 e subsequentemente tratamento alcalino com NaOH da liga de Ti35Nb7Zr5Ta não
processada e processada por HPT, submetidas a testes de bioatividade para tempos de
1, 7 e 14 dias em SBF.
Recopilação
Ensaios de corrosão e testes de bioatividade foram desenvolvidos para as
ligas de Ti13Nb13Zr e Ti35Nb7Zr5Ta com superfície modificadas e deformadas
por HPT. A caracterização eletroquímica foi através de curvas de polarização e
testes de impedância eletroquímica.
Em relação a correntes de passivação (Ipass) obtidas a partir das curvas de
polarização, foi observado que as amostras com superfície polida e amostras
tratadas quimicamente (HCl, H3PO4 + NaOH) tem valores de Ipass da mesma

Resumo detalhado em português 301
ordem de grandeza (10-6 A ·cm-2). Por outro lado, não foi observada uma grande
diferença para as correntes de passivação entre amostras sem deformação e
deformadas por HPT (exceto as amostras anodizadas).
Observou-se que a presença de nanoestruturas de TiO2 possui o maior
valor de resistência da camada porosa externa, o que significa que foi a condição
com maior resistência à corrosão. Isto é melhor observado na liga Ti13Nb13Zr,
onde os valores de resistência são apresentados na ordem de 3x10⁷ (Ω·cm2). Por
outro lado, os tratamentos químicos tendem a diminuir o valor da resistência da
camada protetora de óxido, quando a pressão de deformação aumenta. Está
redução de resistência à corrosão foi atribuída às microestruturas de não equilíbrio
formadas durante o processamento de HPT. O acima mencionado faz com que a
camada externa do filme de óxido seja mais suscetível à dissolução do que a
camada interna, o que indica uma estrutura mais defeituosa da camada externa.
As micrografias de obtidas por MEV mostraram que para as ligas de
Ti13Nb13Zr e Ti35Nb7Zr5Ta mesmo imersas em SBF durante 14 dias, nenhuma
das amostras com superfícies polidas formou apatita na sua superfície, ou seja,
não são bioativas. Isto confirma que a camada inicial inerte de TiO2 criada na
superfície dos substratos polidos não é suficiente para promover a formação de
tecido entre o osso e o implante espontaneamente.
O comportamento observado pelos substratos polidos foi também
observado para amostras de liga Ti35Nb7Zr5Ta tratada com H3PO4 e ativada com
NaOH, indicando que, mesmo começando com fosfato na superfície, o referido
material não adquire bioatividade utilizando tais tratamento de superfície. Por
contraste, durante o mesmo tratamento de superfície, as superfícies das amostras
da liga Ti13Nb13Zr mostraram bioatividade em períodos entre sete e quatorze
dias em condições deformadas e não deformadas.
As superfícies com nanotubos de TiO2 da liga Ti13Nb13Zr na condição não
deformada começou a produzir uma camada de apatita entre sete e quatorze dias,
enquanto as amostras deformadas formaram apatita a partir das primeiras 24

Influência dos tratamentos de superfície nas propriedades de resistência
à corrosão de ligas de titânio de grão ultrafino para aplicações em implantes 302
horas. No entanto, o mesmo tratamento de superfície provou não ser tão eficaz
para as amostras da liga Ti35Nb7Zr5Ta. Neste caso, amostras (deformadas ou
não) só começaram a produzir alguma camada de apatia aos quatorze dias.
Finalmente, este estudo mostrou que os tratamentos de modificação de
superfície são benéficos para promover a osseointegração e também a
deformação plástica severa promove a bioatividade, desta forma os substratos
testados tem um grande potencial para aplicações biomédicas.
Referências
[1] G. Manivasagam, D. Dhinasekaran, A. Rajamanickam, Biomedical implants:
Corrosion and its Prevention-A Review, Recent Patents Corros. Sci. 2
(2010) 40–54. doi:10.2174/1877610801002010040.
[2] M. Niinomi, Mechanical properties of biomedical titanium alloys, Mater. Sci.
Eng. A. 243 (1998) 231–236. doi:10.1016/S0921-5093(97)00806-X.
[3] M. Niinomi, D. Kuroda, K. Fukunaga, M. Morinaga, Y. Kato, T. Yashiro, A.
Suzuki, Corrosion wear fracture of new β type biomedical titanium alloys,
Mater. Sci. Eng. A. 263 (1999) 193–199. doi:10.1016/S0921-
5093(98)01167-8.
[4] A. Najdahmadi, A. Zarei-Hanzaki, E. Farghadani, Mechanical properties
enhancement in Ti–29Nb–13Ta–4.6 Zr alloy via heat treatment with no
detrimental effect on its biocompatibility, Mater. Des. 54 (2014) 786–791.
doi:10.1016/j.matdes.2013.09.007.
[5] K.K. Wang, L.J. Gustavson, J.H. Dumbleton, Microstructure and properties
of a new beta titanium alloy, Ti-12Mo-6Zr-2Fe, developed for surgical
implants, in: Med. Appl. Titan. Its Alloy. Mater. Biol. Issues, ASTM
International, 1996.

Resumo detalhado em português 303
[6] P.L. Ferrandini, F.F. Cardoso, S.A. Souza, C.R. Afonso, R. Caram, Aging
response of the Ti–35Nb–7Zr–5Ta and Ti–35Nb–7Ta alloys, J. Alloys
Compd. 433 (2007) 207–210. doi:10.1016/j.jallcom.2006.06.094.
[7] H.J. Rack, J.I. Qazi, Titanium alloys for biomedical applications, 26 (2006)
1269–1277. doi:10.1016/j.msec.2005.08.032.
[8] S. Zherebtsov, G. Salishchev, R. Galeyev, K. Maekawa, Mechanical
properties of Ti–6Al–4V titanium alloy with submicrocrystalline structure
produced by severe plastic deformation, Mater. Trans. 46 (2005) 2020–
2025. doi:10.2320/matertrans.46.2020.
[9] a. Azushima, R. Kopp, a. Korhonen, D.Y. Yang, F. Micari, G.D. Lahoti, P.
Groche, J. Yanagimoto, N. Tsuji, a. Rosochowski, a. Yanagida, Severe
plastic deformation (SPD) processes for metals, CIRP Ann. - Manuf.
Technol. 57 (2008) 716–735. doi:10.1016/j.cirp.2008.09.005.
[10] Y.T. Zhu, T.G. Langdon, The fundamentals of nanostructured materials
processed by severe plastic deformation, Jom. 56 (2004) 58–63.
doi:10.1007/s11837-004-0294-0.
[11] D.A.G. Pérez, J. Junior, A. Moreira, C.S. Kiminami, C. Bolfarini, W.J. Botta,
Ultrafine-Grained Ti-13Nb-13Zr Alloy Produced by Severe Plastic
Deformation, Mater. Res. 20 (2017) 404–410. doi:10.1590/1980-5373-mr-
2017-0037.
[12] K. Sharman, P. Bazarnik, T. Brynk, A. Gunay Bulutsuz, M. Lewandowska, Y.
Huang, T.G. Langdon, Enhancement in mechanical properties of a β-
titanium alloy by high-pressure torsion, J. Mater. Res. Technol. 4 (2015) 79–
83. doi:10.1016/j.jmrt.2014.10.010.
[13] M. Kulkarni, A. Mazare, E. Gongadze, Š. Perutkova, V. Kralj-Iglič, I. Milošev,
P. Schmuki, A. Iglič, M. Mozetič, Titanium nanostructures for biomedical

Influência dos tratamentos de superfície nas propriedades de resistência
à corrosão de ligas de titânio de grão ultrafino para aplicações em implantes 304
applications, Nanotechnology. 26 (2015) 62002. doi:10.1088/0957-
4484/26/6/062002.
[14] R.Z. Valiev, I.P. Semenova, V. V. Latysh, H. Rack, T.C. Lowe, J. Petruzelka,
L. Dluhos, D. Hrusak, J. Sochova, Nanostructured titanium for biomedical
applications, Adv. Eng. Mater. 10 (2008) 15–17.
doi:10.1002/adem.200800026.
[15] H. Miyamoto, Corrosion of Ultrafine Grained Materials by Severe Plastic
Deformation, an Overview, Mater. Trans. 57 (2016) 559–572.
doi:10.2320/matertrans.M2015452.
[16] J. Lu, Y. Zhang, W. Huo, W. Zhang, Y. Zhao, Y. Zhang, Electrochemical
corrosion characteristics and biocompatibility of nanostructured titanium for
implants, Appl. Surf. Sci. 434 (2018) 63–72.
doi:10.1016/j.apsusc.2017.10.168.
[17] M. Takeuchi, Y. Abe, Y. Yoshida, Y. Nakayama, M. Okazaki, Y. Akagawa,
Acid pretreatment of titanium implants, 24 (2003) 1821–1827.
doi:10.1016/S0142-9612(02)00576-8.
[18] W.F. Oliveira, I.R.S. Arruda, G.M.M. Silva, G. Machado, L.C.B.B. Coelho,
M.T.S. Correia, Functionalization of titanium dioxide nanotubes with
biomolecules for biomedical applications, Mater. Sci. Eng. C. 81 (2017)
597–606. doi:10.1016/j.msec.2017.08.017.
[19] J.E.G. Hulshoff, K. Van Dijk, J.E. De Ruijter, F.J.R. Rietveld, L.A. Ginsel,
J.A. Jansen, Interfacial phenomena: An in vitro study of the effect of calcium
phosphate (Ca‐P) ceramic on bone formation, J. Biomed. Mater. Res. 40
(1998) 464–474. doi:10.1002/(SICI)1097-4636(19980605)40:3<464::AID-
JBM18>3.0.CO;2-J.
[20] S. Nishiguchi, T. Nakamura, M. Kobayashi, H.-M. Kim, F. Miyaji, T. Kokubo,
The effect of heat treatment on bone-bonding ability of alkali-treated

Resumo detalhado em português 305
titanium, Biomaterials. 20 (1999) 491–500. doi:10.1016/S0142-
9612(98)90203-4.
[21] M.J. Filiaggi, N.A. Coombs, R.M. Pilliar, Characterization of the interface in
the plasma-sprayed HA coating/Ti-6Al-4V implant system, J. Biomed. Mater.
Res. 25 (1991) 1211–1229. doi:10.1002/jbm.820251004.
[22] K.S. Brammer, C.J. Frandsen, S. Jin, TiO2 nanotubes for bone regeneration,
Trends Biotechnol. 30 (2012) 315–322. doi:10.1016/j.tibtech.2012.02.005.
[23] A.P. Zhilyaev, T.G. Langdon, Using high-pressure torsion for metal
processing: Fundamentals and applications, Prog. Mater. Sci. 53 (2008)
893–979. doi:10.1016/j.pmatsci.2008.03.002.
[24] X. Liu, P.K. Chu, C. Ding, Surface modification of titanium , titanium alloys ,
and related materials for biomedical applications, 47 (2005) 49–121.
doi:10.1016/j.mser.2004.11.001.
[25] H. Tsuchiya, J.M. Macak, L. Müller, J. Kunze, F. Müller, P. Greil, S.
Virtanen, P. Schmuki, Hydroxyapatite growth on anodic TiO2 nanotubes, J.
Biomed. Mater. Res. Part A. 77A (2006) 534–541. doi:10.1002/jbm.a.30677.
[26] V.P. Parkhutik, V.I. Shershulsky, Theoretical modelling of porous oxide
growth on aluminium, J. Phys. D. Appl. Phys. 25 (1992) 1258.
doi:10.1088/0022-3727/25/8/017.
[27] G.K. Grimes, Craig A., Mor, TiO2 nanotube arrays: synthesis, properties,
and applications, 2009. doi:10.1007/978-1-4419-0068-5.
[28] Y. Bai, I.S. Park, H.H. Park, M.H. Lee, T.S. Bae, W. Duncan, M. Swain, The
effect of annealing temperatures on surface properties, hydroxyapatite
growth and cell behaviors of TiO2 nanotubes, Surf. Interface Anal. 43 (2011)
998–1005. doi:10.1002/sia.3683.

Influência dos tratamentos de superfície nas propriedades de resistência
à corrosão de ligas de titânio de grão ultrafino para aplicações em implantes 306
[29] P. Roy, S. Berger, P. Schmuki, TiO2 nanotubes: synthesis and applications,
Angew. Chemie. 50 (2011) 2904–2939. doi:10.1002/anie.201001374.
[30] F. Hilario, Synthèse et caractérisations de nanotubes de TiO2 pour
applications biomédicales: propriétés électrochimiques et bioactivité, (2017).
[31] L. Le Guéhennec, A. Soueidan, P. Layrolle, Y. Amouriq, Surface treatments
of titanium dental implants for rapid osseointegration, Dent. Mater. 23 (2007)
844–854. doi:10.1016/j.dental.2006.06.02.
[32] H. Kim, F. Miyaji, T. Kokubo, T. Nakamura, Preparation of bioactive Ti and
its alloys via simple chemical surface treatment, J. Biomed. Mater. Res. An
Off. J. Soc. Biomater. Japanese Soc. Biomater. 32 (1996) 409–417.
doi:10.1002/(sici)1097-4636(199611)32:3<409::aid-jbm14>3.0.co;2-.
[33] T. Kokubo, H. Takadama, How useful is SBF in predicting in vivo bone
bioactivity?, Biomaterials. 27 (2006) 2907–2915.
doi:10.1016/j.biomaterials.2006.01.017.
[34] B. Torres, A. Seyeux, S. Zanna, B. Tribollet, P. Marcus, I. Frateur, Influence
of BSA adsorption on the oxide layers developed on 70Cu-30Ni alloy in
static artificial seawater, Matériaux Tech. 101 (2013) 106.
[35] F. Hilario, V. Roche, A. Jorge Junior, R. Nogueira, Application of the
transmission line model for porous electrodes to analyse the impedance
response of TiO2 nanotubes in physiological environment, 2017.
doi:10.1016/j.electacta.2017.09.045.
[36] S.A.A. Yahia, L. Hamadou, A. Kadri, N. Benbrahim, E.M.M. Sutter, Effect of
anodizing potential on the formation and EIS characteristics of TiO2
nanotube arrays, J. Electrochem. Soc. 159 (2012) K83–K92.
doi:10.1149/2.077204jes.

Resumo detalhado em português 307
[37] P. Pu, H. Cachet, E.M.M. Sutter, Electrochemical impedance spectroscopy
to study photo-induced effects on self-organized TiO2 nanotube arrays,
Electrochim. Acta. 55 (2010) 5938–5946.
[38] B. Hirschorn, M.E. Orazem, B. Tribollet, V. Vivier, I. Frateur, M. Musiani,
Determination of effective capacitance and film thickness from constant-
phase-element parameters, Electrochim. Acta. 55 (2010) 6218–6227.
doi:10.1016/j.electacta.2009.10.065.