Influence of slow oscillation on hippocampal activity...
20
Taxidis, Jiannis and Mizuseki, Kenji and Mason, Robert and Owen, Markus R. (2013) Influence of slow oscillation on hippocampal activity and ripples through cortico-hippocampal synaptic interactions, analyzed by a cortical-CA3-CA1 network model. Frontiers in Computational Neuroscience, 7 (Februa). 19/1-19/19. ISSN 1662-5188 Access from the University of Nottingham repository: http://eprints.nottingham.ac.uk/2904/1/HippocampTaxidis.pdf Copyright and reuse: The Nottingham ePrints service makes this work by researchers of the University of Nottingham available open access under the following conditions. This article is made available under the Creative Commons Attribution licence and may be reused according to the conditions of the licence. For more details see: http://creativecommons.org/licenses/by/2.5/ A note on versions: The version presented here may differ from the published version or from the version of record. If you wish to cite this item you are advised to consult the publisher’s version. Please see the repository url above for details on accessing the published version and note that access may require a subscription. For more information, please contact [email protected]
Transcript of Influence of slow oscillation on hippocampal activity...

Taxidis, Jiannis and Mizuseki, Kenji and Mason, Robert and Owen, Markus R. (2013) Influence of slow oscillation on hippocampal activity and ripples through cortico-hippocampal synaptic interactions, analyzed by a cortical-CA3-CA1 network model. Frontiers in Computational Neuroscience, 7 (Februa). 19/1-19/19. ISSN 1662-5188
Access from the University of Nottingham repository: http://eprints.nottingham.ac.uk/2904/1/HippocampTaxidis.pdf
Copyright and reuse:
The Nottingham ePrints service makes this work by researchers of the University of Nottingham available open access under the following conditions.
This article is made available under the Creative Commons Attribution licence and may be reused according to the conditions of the licence. For more details see: http://creativecommons.org/licenses/by/2.5/
A note on versions:
The version presented here may differ from the published version or from the version of record. If you wish to cite this item you are advised to consult the publisher’s version. Please see the repository url above for details on accessing the published version and note that access may require a subscription.
For more information, please contact [email protected]

ORIGINAL RESEARCH ARTICLEpublished: 05 February 2013
doi: 10.3389/fncom.2013.00003
Influence of slow oscillation on hippocampal activity andripples through cortico-hippocampal synaptic interactions,analyzed by a cortical-CA3-CA1 network modelJiannis Taxidis 1,2*, Kenji Mizuseki3†, Robert Mason4 and Markus R. Owen1
1 Centre for Mathematical Biology and Medicine, School of Mathematical Sciences, University of Nottingham, Nottingham, UK2 Division of Biology, Computation and Neural Systems, California Institute of Technology, Pasadena, CA, USA3 Center for Molecular and Behavioral Neuroscience, Rutgers, The State University of New Jersey, New Jersey, NJ, USA4 Queen’s Medical Centre, School of Biomedical Sciences, University of Nottingham, Nottingham, UK
Edited by:
Tomoki Fukai, RIKEN Brain ScienceInstitute, Japan
Reviewed by:
Hiroshi Okamoto, RIKEN BrainScience Institute, JapanVassilis Cutsuridis, Federation ofResearch and Technology—Hellas,Greece
*Correspondence:
Jiannis Taxidis, Computation andNeural Systems, California Instituteof Technology, 1200 E. CaliforniaBoulevard, Mail Code 136-93,Pasadena, CA 91125, USA.e-mail: [email protected]†Present address:
Kenji Mizuseki, Allen Institute forBrain Science, Seattle, WA, USA.
Hippocampal sharp wave-ripple complexes (SWRs) involve the synchronous discharge ofthousands of cells throughout the CA3-CA1-subiculum-entorhinal cortex axis. Their strongtransient output affects cortical targets, rendering SWRs a possible means for memorytransfer from the hippocampus to the neocortex for long-term storage. Neurophysiologicalobservations of hippocampal activity modulation by the cortical slow oscillation (SO) duringdeep sleep and anesthesia, and correlations between ripples and UP states, supportthe role of SWRs in memory consolidation through a cortico-hippocampal feedback loop.We couple a cortical network exhibiting SO with a hippocampal CA3-CA1 computationalnetwork model exhibiting SWRs, in order to model such cortico-hippocampal correlationsand uncover important parameters and coupling mechanisms controlling them. Thecortical oscillatory output entrains the CA3 network via connections representing themossy fiber input, and the CA1 network via the temporoammonic pathway (TA). Thespiking activity in CA3 and CA1 is shown to depend on the excitation-to-inhibition ratio,induced by combining the two hippocampal inputs, with mossy fiber input controllingthe UP-state correlation of CA3 population bursts and corresponding SWRs, whereasthe temporoammonic input affects the overall CA1 spiking activity. Ripple characteristicsand pyramidal spiking participation to SWRs are shaped by the strength of the Schaffercollateral drive. A set of in vivo recordings from the rat hippocampus confirms amodel-predicted segregation of pyramidal cells into subgroups according to the SO statewhere they preferentially fire and their response to SWRs. These groups can potentiallyplay distinct functional roles in the replay of spike sequences.
Keywords: hippocampus, slow oscillation, sharp waves, ripples, mossy fibers, temporoammonic pathway,
correlations
INTRODUCTIONThe standard model for memory consolidation assumes that newmemories are stored temporarily in hippocampal and parahip-pocampal areas, and are later transferred to the neocortex, duringslow wave sleep (SWS), for long-term storage (Buzsáki, 1989,2006; Eichenbaum, 2000). However, the question of how infor-mation flows between neocortex and hippocampus during SWSis still unresolved. A series of recent observations suggest a gen-eral drive from cortex to hippocampus during SWS (Siapas andWilson, 1998; Sirota et al., 2003; Hahn et al., 2006, 2007; Isomuraet al., 2006; Mölle et al., 2006). These studies focus on the tem-poral relationships between intrinsic rhythmic oscillations foundin the cortex and hippocampus, particularly the slow oscillation(SO) and the sharp wave-ripple complexes (SWRs) respectively.
The SO is an intrinsic cortical oscillation (Timofeev andSteriade, 1996; Sanchez-Vives and McCormick, 2000; Timofeevet al., 2000), observed virtually simultaneously throughout allneocortical areas during SWS and anesthesia (Steriade, 2006).
It consists of rhythmically recurring (usually <1 Hz) step-liketransitions in neuronal membrane potentials between depolar-izing envelopes with superimposed action potentials (UP states)and silent, hyperpolarized (DOWN) states. Various theoreti-cal and computational approaches of different architectures andcomplexities have addressed potential cellular and/or networkmechanisms underlying such oscillations (Bazhenov et al., 2002;Compte et al., 2003; Hill and Tononi, 2005; Holcman andTsodyks, 2006; Parga and Abbott, 2007).
The SWR consists of a large negative local field potential(LFP) peak in the CA1 dendritic layer (sharp wave), accompaniedby transient ∼150–200 Hz oscillatory patterns (ripples) locatedin the CA1 pyramidal layer LFP (Buzsáki et al., 1992; Ylinenet al., 1995). Fast-scale replays of temporal patterns of correlatedplace cells during SWRs (Skaggs and McNaughton, 1996; Leeand Wilson, 2002; Foster and Wilson, 2006; Diba and Buzsáki,2007) and post-learning memory impairments caused by rippledisruption (Girardeau et al., 2009) indicate a role for SWRs as
Frontiers in Computational Neuroscience www.frontiersin.org February 2013 | Volume 7 | Article 3 | 1
COMPUTATIONAL NEUROSCIENCE

Taxidis et al. A network model of cortico-hippocampal coupling
a possible vehicle for memory transfer to the prefrontal corticalareas (PFC) (Peyrache et al., 2009). SWRs are observed syn-chronously throughout the hippocampus (Chrobak and Buzsáki,1996) and are the result of strong depolarizing inputs from CA3population bursts, exciting CA1 pyramidal cells and interneuronsthrough the Schaffer collaterals (Buzsáki et al., 1992; Csicsvariet al., 2000; Maier et al., 2003). The numerous CA1 interneurontypes exhibit diverse spiking responses to SWRs with some typesincreasing their spiking while others become silent (Klausbergerand Somogyi, 2008), potentially serving a mechanism for thereplay of the stored place cell temporal patterns (Cutsuridis andHasselmo, 2010, 2011). Based on the observation that basket cellsdramatically increase their firing during SWRs (Klausberger andSomogyi, 2008), firing in phase with ripples (Ylinen et al., 1995;Csicsvari et al., 1999), a recent modeling study of a CA3-CA1network proposed a ripple generation mechanism, relying onsynchronous CA1 perisomatic interneuronal activity and strongfast-decaying recurrent inhibition (Taxidis et al., 2012).
Temporal correlations between neocortical and hippocampalLFPs and unit activity during SO have revealed a strong SO-modulated cortico-hippocampal coupling. The overall corticalactivity precedes hippocampal by tens of ms and ripple occur-rence increases during UP states (Siapas and Wilson, 1998; Sirotaet al., 2003; Isomura et al., 2006; Mölle et al., 2006; Sullivan et al.,2011). In extra- and intra-cellular recordings in the neocortex,entorhinal cortex, and hippocampus of anesthetized and natu-rally sleeping rodents, the SO was shown to engage entorhinalcells as well, while hippocampal spiking is also SO-modulated,with neurons in the dentate region discharging mostly during cor-tical UP states (Isomura et al., 2006; Hahn et al., 2007; Sullivanet al., 2011). A study on anesthetized and naturally sleeping ratsreported that most CA3 neurons were preferentially active dur-ing DOWN states, organized in gamma frequency oscillations,while most CA1 cells fired predominantly in UP states, yieldinga correlation of the overall CA1 activity with the SO (Isomuraet al., 2006). In contrast, a study on anesthetized mice reporteda mixed correlation of CA3 membrane potentials with neocorti-cal UP states, some being depolarized and others hyperpolarized,while most CA1 pyramidal cells were found to be anti-correlatedwith the SO, being hyperpolarized during UP states (Hahn et al.,2007). Whole-cell recordings from CA1 dendritic R-LM interneu-rons (Freund and Buzsáki, 1996), also revealed a SO modulationof their membrane potentials (Hahn et al., 2006), indicating thatCA1 interneuronal activity can also be SO-modulated.
These results suggest a feedforward control of the SO over hip-pocampal activity that can potentially be a key feature of memoryconsolidation processes, with UP states causing neuronal reacti-vation of newly encoded information in hippocampal circuitrythat can be fed back to the cortex during ripples (Mehta, 2007).However, the temporal and functional cross-talk between cortexand hippocampus during sleep and anesthesia and the networkmechanisms that control the hippocampal SO-modulation andthe UP states-ripples correlation are still not well understood.We try to unravel these mechanisms from a modeling perspec-tive by coupling an established computational model of a corticalnetwork exhibiting SO (Compte et al., 2003) and the aforemen-tioned CA3-CA1 network model reproducing many hippocampal
intrinsic dynamics and exhibiting SWRs (Taxidis et al., 2012).The cortical output entrains the hippocampal model via con-nections to CA3, representing mossy fibers (MF), and to CA1,representing the temporoammonic pathway (TA). We examinehow the spiking activity and network dynamics of both CAareas depend on the excitation-to-inhibition balance, inducedby the cortical SO output. Our results suggest that the mossyfiber input determines the UP-state correlation or anticorrela-tion of CA3 population bursts, and consequently SWRs, whilethe temporoammonic input controls the overall spiking activityof CA1 in relation to UP/DOWN states. Particular ripple charac-teristics (oscillation frequency, spike-field phase-locking) dependmainly on the Schaffer collateral input to CA1. The combina-tion of both inputs segregates CA1 pyramidal cells into foursubsets according to the SO state where they preferentially fireand whether they actively participate in ripple spiking. We verifythe model-predicted characteristics of these groups by compar-ing them against a set of in vivo hippocampal recordings fromnaturally sleeping rats.
MATERIALS AND METHODSEXPERIMENTAL SETUP, RECORDINGS, AND In vivo DATA ANALYSISThe experimental data presented here were collected in thelab of György Buzsáki. Detailed information about the surgi-cal, experimental, recording, and spike sorting procedures hasbeen described elsewhere (Csicsvari et al., 1999; Mizuseki et al.,2009, 2011). Briefly, three male Long-Evans rats (250–400 g) wereimplanted with a 4- or 8-shank silicon probe in the right dorsalhippocampus under isoflurane anesthesia (1–1.5%) and recordedfrom dorsal CA1 pyramidal layers. Another 4-shank silicon probewas also implanted in the right dorsocaudal medial entorhinalcortex. Each shank had eight recording sites and inter-shank dis-tance was 200 μm. Recordings sites were staggered to provide atwo-dimensional arrangement (20 μm vertical separations). TheEC probe was positioned so that the different shanks recordedfrom different layers. The position of the electrodes was con-firmed histologically and reported previously in detail (Mizusekiet al., 2009).
LFPs and multiple single neurons activity were recorded fromCA1 and EC simultaneously while the animals run on a variety ofenvironments and during sleep sessions, preceding and followingthe exploration tasks (Mizuseki et al., 2009). Signals were ampli-fied (1000×), bandpass-filtered (1–5 kHz) and acquired contin-uously at 20 kHz (DataMax system; RC Electronics) at 16-bitresolution. After recording, the signals were down-sampled to1250 Hz for the LFP analysis. Spike sorting was performed auto-matically, using KlustaKwik (Harris et al., 2000), followed bymanual adjustment of the clusters (Klusters software package,Hazan et al., 2006). Only units with clear refractory periodsand well-defined cluster boundaries were included in the anal-yses (Harris et al., 2000). Classification of pyramidal cells andinterneurons of hippocampal and entorhinal cortical neurons wasdescribed previously (Mizuseki et al., 2009). All protocols wereapproved by the Institutional Animal Care and Use Committee ofRutgers University.
SWS periods were detected using the ratio of the power intheta band (6–10 Hz) to delta band (1–4 Hz) of LFP, followed by
Frontiers in Computational Neuroscience www.frontiersin.org February 2013 | Volume 7 | Article 3 | 2
Taxidis et al. A network model of cortico-hippocampal coupling
manual adjustment with the aid of visual inspection of whitenedpower spectra and the raw traces (Sirota et al., 2008; Mizusekiet al., 2011). DOWN-to-UP transitions were detected by thresh-olding the smoothed multiunit spiking activity of entorhinal cells.Ripple events were detected by thresholding the bandpassed (140–230 Hz) CA1 pyramidal layer LFP [see Mizuseki et al. (2009,2011) for details]. The ripple timings refer to the time of eachevent’s spectral peak.
To assess whether CA1 cells fired preferentially during the UPor DOWN states, the firing rate of each cell was calculated for350 ms around each DOWN-to-UP transition in 100 ms bins,overlapping by 90 ms and was normalized by its total mean. Theposition of the maximum firing rate point relative to −60 msfrom the state transition (where the average firing is at baselinelevel, see Figure 6A), was used to classify the cell as an “UP-cell”or “DOWN-cell.”
To assess whether each ripple took place during an UP orDOWN state, the closest DOWN-to-UP transition was detected.If the ripple preceded this transition by a time between −60 msand −350 ms, it was taken to have occurred during a DOWNstate (see Figures 6A and C). In all other cases it was assumedto have happened during an UP state. Note that reducing byhalf the time interval assigned to DOWN-ripples (−60 ms up to−175 ms) reduced the total number of DOWN-ripples but didnot severely affect our results.
The peri-ripple firing rate of each cell was calculated for 200 msaround each ripple in 5 ms bins overlapping by 4 ms. The meanfiring rate per ripple was calculated for each cell. The baselinefiring, used to assess spiking increase during the average rip-ple, refers to the segments of the mean rate that are more than40 ms away from the ripple peak. Cells that did not produce anyspikes around the DOWN-to-UP or the ripple windows werediscarded (2.7%).
All significance tests in section “Correlations of CA1Pyramidal Spiking to UP-states and Ripples Depend on theCombined Schaffer and Temporoammonic Inputs. Comparisonwith In vivo recordings” refer to P = 0.001 2-sample or pairedt-tests accordingly on the maximum firing rate increase.
CORTICAL MODELWe implemented a computational cortical network model devel-oped in a study of a possible SO-generating mechanism (Compteet al., 2003). In brief, it consists of a one-dimensional arrayof equidistantly distributed pyramidal cells and interneurons,in a 4:1 ratio. The former are modeled by a two-compartment(dendritic and axosomatic) regular-spiking Hodgkin-Huxley cell,including various ionic currents (Compte et al., 2003), andthe latter by the single-compartment fast-spiking Wang–Buzsákicell (Wang and Buzsáki, 1996). A fixed number of connectionsbetween cells is assigned (on average 20 per cell on each celltype), with an implemented heterogeneity among the popula-tion. These connections are distributed to the neighbors aroundeach cell with a Gaussian probability distribution, centered on thecell. Excitatory connections are more widespread than inhibitoryones. Excitatory postsynaptic currents (EPSCs) are AMPA- andNMDA-mediated, and inhibitory ones are GABA-mediated. Thismodel was shown to exhibit robust UP and DOWN states,
alternating at frequency <1 Hz, closely resembling the corticalSO (Compte et al., 2003, 2008). Spontaneous pyramidal spikesinitiate UP states in non-specific sites, which spread through-out the network via recurrent excitation, regulated by inhibition,and are terminated by the buildup of hyperpolarizing currents,particularly the Na+-dependent K+ current IKNa.
A version of the original model was implemented, includ-ing 1000 pyramidal cells and 250 interneurons and a modifiedsynaptic-interaction scheme. Whenever a presynaptic spike isdetected (with detection threshold at 10 mV for the membranepotential of the presynaptic cell) a fixed instantaneous increaseis given in the postsynaptic cell’s synaptic conductance. Thisincrease is set to be 1/3 of the corresponding parameter αsyn
in Compte et al. (2003) for excitatory connections and 1/2 forinhibitory ones. Moreover, in the original model each synapsein a cell is modeled by an independent post-synaptic variable,whereas in our implementation each cell has one “total” variablefor each synaptic type. We therefore adjusted the overall excita-tion by reducing the original model’s maximal excitatory con-ductances (to 4.15 nS and 0.225 nS for pyramidal-to-pyramidalAMPA and NMDA synapses respectively, and to 0.5 nS and0.11 nS for pyramidal-to-interneuron synapses. Original valueswere 5.4, 0.9, 2.25, and 0.5 nS respectively) and we enhancedinhibition by reducing the GABA reversal potential from −70to −75 mV. Finally, note that the maximum sodium-dependentpotassium conductance gKNa, in the dendritic compartment ofcortical pyramidal cells has been reduced to 0.5 mS/cm2 fromthe original value 1.33 mS/cm2 (Compte et al., 2003). This isdone to increase the excitability of pyramidal cells, prolonging(shortening) the duration of UP (DOWN) states. The resultingapproximately equal duration of UP and DOWN states allows anunbiased temporal analysis of correlations between hippocam-pal activity and the two SO states. With these modifications,the network reproduces all the basic characteristic propertiesof the original one, i.e., alternating UP/DOWN states with fre-quency <1 Hz (∼0.83 Hz) and UP-state firing rates of ∼15 Hz forpyramidal cells and ∼30 Hz for interneurons.
CA3-CA1 MODELThe detailed morphology of the CA3-CA1 hippocampal net-work model has been extensively described in a previous studyof SWRs in the rat hippocampus (Taxidis et al., 2012). BothCA areas consist of one dimensional arrays of 1000 pyramidalcells and 100 interneurons, equidistantly distributed. Pyramidalcells are modeled by the two-compartment (dendritic and axoso-matic) Pinsky–Rinzel cell (Pinsky and Rinzel, 1994). All interneu-rons are considered perisomatic basket cells and are modeledby the Wang–Buzsáki model (Wang and Buzsáki, 1996). Bothare Hodgkin–Huxley cell models that accurately capture the fir-ing properties of the respective cell types (Taxidis et al., 2012).All connectivity parameters and synaptic strengths were inspiredfrom the literature so that the final topology of both areas, whilesimplified, is as realistic as possible [see Taxidis et al. (2012)for details and justification of parameter values]. Briefly, theconnectivity scheme is again based on a Gaussian probabilitydistribution of connections around each cell, similar to the cor-tical model. The SD of the Gaussian is again larger for pyramidal
Frontiers in Computational Neuroscience www.frontiersin.org February 2013 | Volume 7 | Article 3 | 3

Taxidis et al. A network model of cortico-hippocampal coupling
cells than interneurons, mimicking extensive excitatory axons andmore locally constrained inhibition (Bernard and Wheal, 1994;Traub et al., 1999).
CA3 is characterized by an extensive recurrent excitatory net-work, with no inhibition between interneurons. In accordancewith anatomical studies (Sik et al., 1993; Traub et al., 1999), pyra-midal cells make 55 connections (29% of their total 190) to otherCA3 pyramidal cells, five connections (2.6%) to CA3 interneuronsand 130 connections (68.4%) forming Schaffer collaterals to CA1cells. This yields a connectivity probability of 10.62% betweenany CA3 pyramidal-pyramidal pair [within the estimated 15%upper limit for the intact CA3 (Bernard and Wheal, 1994)] and∼10% connectivity probability for pyramidal-interneuron pairs(Miles et al., 1988; Traub and Miles, 1991). Interneurons make68 connections on nearby CA3 pyramidal cells, forming multiplecontacts with each targeted cell (Traub et al., 1999), resulting ina high connectivity probability within their connections-cluster(Miles et al., 1988; Traub and Miles, 1991).
In contrast to CA3, a strong and dense recurrent inhibitorynetwork underlies CA1 topology, while connections betweenpyramidal cells are omitted. Interneurons make 400 and 100connections with nearby pyramidal cells and interneuronsrespectively, making multiple contacts with each cell (Buhlet al., 1994) and yielding high connectivity probabilities aroundeach interneuron (Bartos et al., 2007). Pyramidal cells con-tact 20 interneurons on average in their extensive connections-cluster, making mostly monosynaptic connections (Gulyás et al.,1993), yielding a connectivity probability of 30% (Knowles andSchwartzkroin, 1981).
Moreover, CA3 drives CA1 through a set of excitatory con-nections, depolarizing both pyramidal cells and interneurons,mimicking Schaffer collaterals. Each CA3 pyramidal cell con-tacts 130 CA1 neurons on average, with connections distributedaccording to a Gaussian probability centered on the correspond-ing CA1 pyramidal cell and covering roughly two thirds ofthe total network length (Li et al., 1994). To include multi-ple contacts on each targeted cell (Sorra and Harris, 1993) andto implement a strong Schaffer-drive to CA1 (Andersen et al.,2007) 13 synapses are assigned for each Schaffer connection oninterneurons. The strength of the Schaffer drive varies throughoutthe CA1 pyramidal cells, by assigning to each cell a number
of synapses per incoming Schaffer connection, taken from aGaussian distribution: |13 ± 13| (mean and SD), taking the abso-lute value to avoid negative numbers [see Taxidis et al. (2012) fordetails]. Thus, a subset of cells receives stronger excitation thanaverage, constituting a “strongly-driven subset.” The numbers ofsynapses-per-Schaffer connection are changed in some of the sim-ulations to induce an increased Schaffer drive, as explained in the“Results” section.
Both networks have individually been shown to reproducevarious anatomical properties and functional features of therespective CA areas. Most importantly, the CA3 network exhibitstheta-periodic quasi-synchronized population bursts, with sparsepyramidal spiking, whereas the interneuronal network in CA1oscillates at gamma frequencies and can synchronize further atripple frequency range. The full CA3-CA1 model was shown togenerate SWRs in CA1 as a response to the CA3 bursts, accuratelyreproducing all basic ripple characteristics (Taxidis et al., 2012).
SYNAPTIC INTERACTIONS AND GENERAL CORTICO-HIPPOCAMPALCONNECTIVITYIn both the cortical and hippocampal networks all excitatory con-nections target the dendritic compartment of pyramidal cells,whereas inhibitory ones target the axosomatic compartment. Allpostsynaptic currents within and between the individual net-works are given by:
Isyn = gsynssyn(V − Vsyn
)(1)
where gsyn is a fixed conductance, V is the membrane poten-tial of the postsynaptic cell and Vsyn is the reversal potentialof the synapse. The postsynaptic variable ssyn is instantaneouslyincreased by a fixed value αsyn when an action potential arrivesat the synapse and then decays exponentially with decay timeτsyn [except for the NMDA currents in the cortical network, asexplained in Compte et al. (2003)]. For all relevant parametervalues of the individual network and hippocampal models, seeCompte et al. (2003) and Taxidis et al. (2012) along with theaforementioned adjustments for the cortical network. All synap-tic parameter values, for the cortico-hippocampal connectionsbetween the individual models, are summarized in Table 1 andare explained in detail in the following two sections.
Table 1 | Parameter values for the instantaneous increase αsyn of the postsynaptic variable ssyn for all types of cortico-hippocampal synapses
in the model.
αsyn EPSP (mV) EPSC (nA) Reported EPSP (mV) Reported EPSC (nA) References
PFC-CA3
PY 70 5 4.5 2–12 0.2 Yamamoto et al., 1987;Jonas et al., 1993
IN 0.5 0.25 0.03 0.03 Lawrence et al., 2004
PFC-CA1PY 2 0.16 0.13 0.16 Otmakhova et al., 2002
IN 2 1 0.13 1 Empson andHeinemann, 1995
The resulting EPSPs and EPSCs on pyramidal cells (PY) and interneurons (IN) and the ones reported through physiological recordings (where available) are also
displayed. All PSPs in the model were measured from a background membrane potential of −74.5 mV for cortical pyramidal cells, −65.3 mV for CA3 pyramidal cells,
−62.6 mV for CA1 pyramidal cells and −62 mV for all interneurons.
Frontiers in Computational Neuroscience www.frontiersin.org February 2013 | Volume 7 | Article 3 | 4

Taxidis et al. A network model of cortico-hippocampal coupling
Figure 1A shows the basic wiring diagram used to couplethe cortical and hippocampal model. We add the various cou-pling mechanisms progressively and examine them individuallyand in combination. The cortical network is taken to repre-sent the prefrontal cortex (PFC) and sends output to both CA3and CA1 areas. Since the SO has been shown to extend evento the entorhinal cortex (Isomura et al., 2006; Sullivan et al.,2011), we assume that the cortical output also represents the out-put produced by the SO of the entorhinal cortex that reachesthe hippocampus. CA1 receives direct input from the entorhi-nal layer 3 (EC3) via the TA, so the PFC-to-CA1 connectionrepresents multistep pathways originating from PFC and reach-ing CA1 through EC3. The afferent connections in CA3 are theMF originating from the dentate gyrus (DG) which has alsobeen shown to partially participate in the SO (Isomura et al.,2006; Hahn et al., 2007; Sullivan et al., 2011). We thereforeassume that the cortical output that is fed into CA3 representsa polysynaptic pathway passing through the entorhinal cortexand the DG. Direct monosynaptic projections from the entorhi-nal cortex to CA3 are ignored, since their effect is consideredto be much weaker than the mossy fiber input (Andersen et al.,2007).
0
2
4x 10⁵
Cor
tical
Act
ivity
(nA
)
2
4 x 10⁵
Aver
age
DO
WN
-UP
1 sec
C
B
A
EC3
PFC
CA1
CA3
DG MF
TA
SC
lags (msec)
FIGURE 1 | (A) Schematic diagram of the full cortico-hippocampalconnectivity implemented in our computational network model. The cortexprovides input to both CA3 and CA1 through the dentate gyrus (DG) mossyfiber connections (MF) and the entorhinal cortex layer 3 (EC3)temporoammonic pathway (TA). (B) Total cortical synaptic activity (grey) ofthe cortical network during SO. All UP states are detected when theactivity exceeds 0.45 × SD and the window between the end of each UPstate until the end of the next is taken as an SO cycle (black lines).(C) Resulting average SO cycle (black line) of the cortical synaptic activity.(Time 0 ms corresponds to maximum UP-state activity in all figures ofaverage SO cycle).
CONNECTIVITY OF THE MOSSY FIBERS AND TEMPOROAMMONICPATHWAYThe direct cortex-to-hippocampus connections in the model rep-resent polysynaptic pathways involving many types of cells andtherefore they are highly simplified. Nevertheless, our goal is forboth CA areas to receive a realistic input.
MF in the rat hippocampus is mostly oriented transverse tothe longitudinal axis of CA3, with very limited overlap in the sep-totemporal direction (Amaral and Witter, 1989; Andersen et al.,2007). Temporoammonic connections are more widespread inCA1 and are topographically organized, with each EC3 axon cov-ering about one quarter of the septotemporal CA1 axis (Andersenet al., 2007). For simplification, we assign here uniform prob-ability distributions for both types of connections, so that thecortical output will be spread over the entire extent of the CAareas. This is done so that the wave propagation of UP states inthe cortical model (Compte et al., 2003) is not reproduced in thehippocampus.
Both MF and the TA have been shown to excite pyramidal cellsand interneurons in their respective target areas (Empson andHeinemann, 1995; Acsady et al., 1998; Gabbott et al., 2002), sowe implemented connections from cortical cells to both cell typesin CA3 and CA1. To reduce further the number of free parame-ters, we fix the magnitude of the unitary excitatory postsynapticpotentials (EPSPs), so that only the number of connections topyramidal cells and interneurons varies between different sim-ulations. The EPSP and/or EPSC levels, shown in Table 1, aretaken from the literature [partly summarized in Cutsuridis et al.(2010)].
The implemented mossy fiber EPSP to pyramidal cells is 5 mV,within the reported range of 2–12 mV (Yamamoto et al., 1987),although the EPSC is much higher than reported (4.5 vs. 0.2 nA).However, EPSCs up to 1 nA have been recorded (Cutsuridis et al.,2010). The implemented synapse triggers spikes in the CA3 pyra-midal cell after a train of four spikes at 40 Hz (not shown) inagreement with recordings (Henze et al., 2002). The implementedEPSC in CA3 interneurons (30 pA) is similar to the recordedquantal EPSC (Lawrence et al., 2004), although a correspondingaverage EPSP has not been reported.
The TA synapses lie in the stratum lacunosum moleculare ofCA1, exciting the distal dendrites of pyramidal cells (Colbert andLevy, 1992). As a result, they are relatively weak and get atten-uated along the dendrites, producing very small depolarizationsin the somatic compartment that have little effect on the fir-ing properties of the cell (Colbert and Levy, 1992; Empson andHeinemann, 1995; Jarsky et al., 2005). We thus assign a smallsomatic EPSP magnitude to these connections, 0.16 mV, which iscomparable to the Schaffer collateral EPSP (Sayer et al., 1990).A similar magnitude has also been used in a complex simula-tion of the TA effect on pyramidal cells (Jarsky et al., 2005).The corresponding EPSC peaks at 0.13 nA which is close to thereported 0.16 nA (Otmakhova et al., 2002). Moreover, the TAinput exerts a powerful feedforward inhibition in CA1, withEC3 cells possibly targeting strata lacunosum moleculare- andradiatum-lying inhibitory neurons as well (Colbert and Levy,1992; Empson and Heinemann, 1995). We model this inhibitionby assigning direct connections to CA1 interneurons, although
Frontiers in Computational Neuroscience www.frontiersin.org February 2013 | Volume 7 | Article 3 | 5

Taxidis et al. A network model of cortico-hippocampal coupling
our interneurons represent pyramidal-layer perisomatic basketcells. The implemented EPSP is 1 mV, as suggested by recordings(Empson and Heinemann, 1995), and the peak EPSC is the sameas in pyramidal cells.
SIMULATIONS OF EXTRACELLULAR RECORDINGS AND DETECTION OFUP STATES, CA3 BURSTS, AND RIPPLESWe model extracellular synaptic activity in the cortex usingthe total post-synaptic currents from all types of connections,summed over the whole cortical network. All firing rates arecalculated by summing spikes from cells of the correspondingnetwork over 30 ms non-overlapping bins.
UP states are detected either (1) through synaptic activity,whenever the total post-synaptic current exceeds a 0.45 × SDdetection threshold, or (2) through the average firing rate ofall cortical pyramidal cells, calculated in 30 ms non-overlappingbins, whenever it exceeds 0.2 × SD, where SD is the standarddeviation of the respective measures over the whole simulation.Any UP states closer than 100 ms are taken as one. By visualinspection, we ensured that both procedures resulted in correctUP-state detection. An SO cycle is considered to begin at the endof a detected UP state and last until the end of the next one, thusincluding one DOWN state followed by one UP (Figure 1B).
CA3 population bursts are detected through the average fir-ing rate of all CA3 pyramidal cells, calculated in 10 ms non-overlapping bins, whenever it exceeds 1.5 × SD. The bursts’boundaries are set where the firing rate drops below 1.2 × SD.Visual inspection ensured that these criteria detected populationbursts correctly for all cases of interneuronal drive by the cortex(kDG−IN , see “Results” section).
Ripples are detected from the 150–200 Hz bandpass filteredtotal synaptic conductance summed over all connections thatwould correspond to somatic (pyramidal) layer recordings (soonly Schaffer excitatory synapses are ignored). This summationis done over a part of the CA1 network of length 560 μm inthe middle of the CA1 array, containing 50 pyramidal cells andsix interneurons which we will refer to as the “recording site”throughout the text [see Taxidis et al. (2012) for details and justifi-cation]. The root mean square (RMS) of the measure is calculatedin bins of 10 ms, overlapping by 50%, and its SD is derived overthe whole signal. Ripples are detected when the RMS exceeds a3 × SD threshold and their boundaries are set where the RMSdrops below 2 × SD. Events with less than 20 ms total durationare discarded and neighboring ripples less than 10 ms apart aretaken as one event. Similar algorithms were used in Csicsvari et al.(1999, 2000) and Klausberger et al. (2003). Note that spectralanalysis of CA1 interneuronal membrane potentials and ripple-related spike histograms include only cells in this “recordingsite.”
For the averaging over SO cycles, all detected pairs of DOWN-UP states are aligned using the maximum point of the total synap-tic current (or firing rate) as reference point (0 ms, Figure 1C),whereas for the averaging over ripples all detected ripple eventsare aligned over their minimum point. This point is also taken asthe reference time of each ripple when aligning them to their cor-responding SO state. Finally, when aligning cell spiking with theaverage SO cycle, the firing rate of each cell is averaged over all
cycles and turned into the z-score, i.e., its mean is subtracted andit is normalized by its standard deviation.
NUMERICAL METHODSAll models were implemented in the Python-based spiking neu-ral networks simulator Brian (Goodman and Brette, 2008),using a second-order Runge–Kutta method for all ordinary dif-ferential equations, with a time step of 0.05 ms. Spikes wererecorded at every time step, while all other variables wererecorded every 1 ms. Data analysis and plotting was performedin MATLAB. Power spectral densities and spike train correla-tions were computed using algorithms from the Neurospec 20numerical toolbox (Halliday and Rosenberg, 1999). The CircStattoolbox (Berens, 2009) was used for circular plotting and sta-tistical analysis of pyramidal spike phase-locking to the averageripple. Instantaneous phases of the average ripple were calculatedthrough the Hilbert transform and all phase locking significancep-values refer to V-tests for non-uniformity of phase distribu-tions with mean direction equal to −90◦ (corresponding to rippletroughs).
All results presented are taken from simulations producing 40 sof data (except for Figure 7 where 100 s were produced). Thesecontained 32 SO cycles of average duration ∼1210 ms (0.83 Hz).
RESULTSWe study the effects of each implemented cortico-hippocampalconnection separately and in combinations, by progressivelyadding the various contacts between the cortical and the two CAnetworks. We first explore the role of the mossy fiber input onCA3 population bursts and then the oscillatory responses in CA1resulting from the Schaffer collaterals. We next add the TA inputto CA1 and study its effects on cell spiking, with and withoutcombining it with the Schaffer input. Finally, we compare thepredicted correlations with SO states and ripples against a set ofin vivo recordings, collected in the György Buzsáki lab (Mizusekiet al., 2009, 2011; Sullivan et al., 2011). For clarity, all figuresinclude a diagram with the connections implemented for eachsimulation.
EFFECTS OF MOSSY FIBER INPUT ON CA3We first examine the effect of the cortical input on CA3 which,when driven by a noisy depolarizing current on all pyramidalcells, exhibits quasi-synchronized population bursts recurring attheta frequencies (Taxidis et al., 2012). Note that the theta rhyth-micity is due to the intrinsic bursting frequency range of the CA3single cell model (Pinsky and Rinzel, 1994).
MF have a very limited spatial extent along the longitudinalCA3 axis, with each granule cell having on average 10–18 largemossy terminals that target only 10–15 different CA3 pyrami-dal cells (Amaral et al., 1990). To simplify the almost one-to-onemossy fiber projections we assign only one connection fromeach pyramidal cell in the cortical network (which here rep-resents the DG as well) to CA3 pyramidal cells (kDG−PY = 1).This connection can reach any cell with uniform probabilitydistribution. Since both networks contain the same number ofpyramidal cells (n = 1000), each CA3 cell receives on average oneinput.
Frontiers in Computational Neuroscience www.frontiersin.org February 2013 | Volume 7 | Article 3 | 6

Taxidis et al. A network model of cortico-hippocampal coupling
MF have been shown to excite almost 10 times more CA3interneurons than pyramidal cells, but with much weaker con-nections involving small en passant boutons and very thin (filopo-dial) extensions of the mossy terminals (Acsady et al., 1998). Thiscan result in an overall feedforward inhibitory input to CA3 fromthe DG discharges (Mori et al., 2004), although the details of thecorresponding circuits are still not well understood. To exam-ine the effect of the feedforward excitation-to-inhibition ratio onthe emergence of CA3 bursts we performed simulations with dif-ferent average numbers of connections from each cortical cellto CA3 interneurons (kDG−IN ). Figures 2A,B contain the rasterplot of the cortical network exhibiting SO and the resulting CA3raster plots for three different cases of kDG−IN : no connections tointerneurons, one, or 10 connections per cortical cell. There are1000 cortical pyramidal cells sending output to 100 CA3 interneu-rons, so, in the latter two cases, each interneuron receives onaverage 10 × kDG−IN = 10 and 100 connections respectively.
When the SO output drives only pyramidal cells, (kDG−IN =0), the combined strong feedforward and recurrent excitationforces most cells above bursting threshold producing population
bursts in UP states, each involving on average ∼18% of (non-specific) CA3 pyramidal cells along with their interneuronal tar-gets. The resulting combination of dendritic excitation, somaticinhibition and after hyperpolarization of the bursting cells leavesthe network in a disorganized state once the cortical input isremoved. At the onset of the DOWN state, population eventsare less synchronous, involving small cell clusters that producewidespread feedback inhibition, preventing the emergence ofpopulation scale bursts. When interneurons receive weak exci-tation (kDG−IN = 1), the UP-state bursts become less coher-ent due to early interneuronal firing desynchronizing pyramidalcells, but DOWN states can now sustain more coherent burst-ing activity (∼10.39% of cells fire on an average burst). Inthe last case (kDG−IN = 10), feedforward UP-state inhibition onCA3 pyramidal cells becomes too strong for spikes to occur. Incontrast, the increased inhibition and the resulting lack of pyra-midal spikes organizes the pyramidal membrane potentials ina more uniform distribution at the onset of the DOWN state,resulting in highly synchronous DOWN-state population bursts(∼12.33% of cells fire on an average burst). Figure 2C displays
10
20
Num
ber
ofC
A3
Bur
sts
A
B
C
D
E
FIGURE 2 | Influence of the SO on CA3 activity in a computational
model of the mossy fiber input on CA3 (model diagram shown on
top). (A) SO in the cortical model acting as input to the CA3 model.Pyramidal cell spikes are shown in black and interneuronal ones in grey(y-axis corresponds to cell numbers in all raster plots). (B) Raster plots ofthe CA3 network when each cortical cell connects to one CA3 pyramidalcell and (from top) 0, 1 and 10 interneurons. The larger the feedforwardinhibition in CA3, the less (more) population bursts during the UP(DOWN) state. (C) Number of detected CA3 population bursts alignedwith the average SO cycle (thick black line) for all three cases of
interneuronal drive: 0 interneurons contacted by each cortical cell (dottedline), 1 interneuron (black line) and 10 interneurons (grey line). (D) Totalspike histogram of CA3 pyramidal cells correlated with the average SOcycle, when each cortical cell connects to one CA3 pyramidal cell andone interneuron. Interneurons exhibit a similar histogram (not shown).(E) Color-coded z-score normalized average firing rate of each CA3pyramidal cell (rows), arranged by their peak from top to bottom andaligned with the average SO cycle (white line) calculated from theaverage firing rate of the whole cortical network (arbitrary units). Thethree cases of interneuronal input in A are displayed again.
Frontiers in Computational Neuroscience www.frontiersin.org February 2013 | Volume 7 | Article 3 | 7
Taxidis et al. A network model of cortico-hippocampal coupling
the number of detected CA3 bursts in correlation with the aver-age SO cycle for all three cases of kDG−IN . The two extremecases of kDG−IN result in a tradeoff between the CA3 popu-lation activity and it’s SO-correlation. Strong UP state-drivenbursts (kDG−IN = 0), each involving only parts of the pyramidalpopulation, result in a disorganized DOWN state activity withcells being in various states of excitation, while intense UP-stateinterneuronal spiking (kDG−IN = 10) brings pyramidal cells in auniform (hyperpolarized) state, promoting the ensuing DOWN-state intrinsic CA3 bursting. A similar tendency of interneuronalactivity to promote such post-inhibitory “rebound” bursts hasbeen demonstrated through hippocampal electrophysiologicalrecordings (Cobb et al., 1995; Harris et al., 2001; Ellender et al.,2010).
To examine the correlation of individual CA3 pyramidal spik-ing with the SO for all three simulated cases, the firing rate of eachpyramidal cell was calculated and was averaged over the SO cycle,detected through the average firing rate of the cortical network.Figure 2E displays the z-score normalized average firing rate ofeach CA3 pyramidal cell, ordered according to the time of its fir-ing rate peak during the SO cycle. As expected, when kDG−IN =0, the majority of cells fire mostly during UP states, whereaswhen kDG−IN = 10, pyramidal cells fire almost exclusively duringDOWN states. In the intermediate case (kDG−IN = 1), roughlyhalf the cells fire preferentially during DOWN-state bursts, sincethey get too inhibited by UP state-induced inhibition to partic-ipate in population events, and the rest fire mostly during UPstates, where the excitation they receive drives them above spikingthreshold. Therefore this connectivity scheme effectively dividesthe pyramidal population into two distinct groups according totheir UP-state response. A similar mixed UP-state correlation andanticorrelation of pyramidal cells was observed in CA3 intracellu-lar recordings on anesthetized mice (Hahn et al., 2007). Moreoverby setting each cortical cell to contact one interneuron (kDG−IN =1) and one pyramidal cell (kDG−PY = 1), interneurons receive onaverage 10 times more connections than pyramidal cells, which isan anatomically realistic ratio (Acsady et al., 1998). We thus keepthis regime for the cortico-CA3 connectivity in the rest of thisstudy.
To examine the overall CA3 spiking activity, we detect allSO cycles through the average cortical synaptic activity andsuperimpose all CA3 pyramidal spikes accordingly to get thetotal spike histogram of pyramidal cells (Figure 2D). Althoughroughly half the cells respond preferentially to DOWN states(Figure 2E) the total spiking activity increases during UP stateswhere population bursts are more dense and engage more cells.Interneuronal spiking produces a similar histogram (not shown).We note that intracellular recordings on naturally sleeping ratssuggested a preferential CA3 DOWN-state firing (Isomura et al.,2006). Nevertheless, this DOWN-state correlation was associatedwith gamma-oscillatory population activity (not included in ourmodel), whereas most SWRs (and thus CA3 bursts) were stillobserved during UP states.
CA1 RESPONSES TO SCHAFFER COLLATERAL INPUTWe next examined the characteristics of CA1 responses to CA3population bursts during SO (with kDG−PY = kDG−IN = 1). We
omit the TA input, so that CA1 activity is driven purely by theSchaffer collaterals.
Since CA3 activity depends on the feedforward excitation-to-inhibition ratio induced by the SO, CA1 responses will alsodepend on it. When the input to CA3 is mostly excitatory (asin the case of kDG−IN = 1) most CA3 bursts and hence mostSWRs are expected to arise during UP states, which agrees withelectrophysiological studies (Sirota et al., 2003; Isomura et al.,2006; Mölle et al., 2006; Sullivan et al., 2011). Figure 3A displaysthe CA1 responses detected through our ripple-detection algo-rithm (top) and their histogram relative to the average SO cycle(bottom). As expected, more SWR-like events appear during theUP state in our particular setup (kDG−IN = 1). This picture isreversed when e.g., kDG−IN = 10 (not shown).
To assess whether these detected events can be consideredas ripples, we check if they share the established ripple fea-tures that the pure CA1 network has been shown to reproduce(Taxidis et al., 2012). In the isolated CA3-CA1 network, whenall CA3 pyramidal cells are driven by a noisy depolarizing cur-rent, the average membrane potential power spectral density ofCA1 interneurons in the recording site peaks in the range of 150–200 Hz, indicating that interneuronal oscillations underlie ripplegeneration (Taxidis et al., 2012). The frequency of the spectralpeak was shown to depend on the amount of excitation CA1receives through the Schaffer collaterals, i.e., the more pyrami-dal spikes in a CA3 burst, the higher the CA1 frequency. In thecurrent cortico-hippocampal model, where the UP states pro-duce both excitation and inhibition to CA3 and there is no inputduring DOWN states, the drive to CA1 is weaker on average.As a result, the spectral peak is largely lost, even for purely UP-state responses after removing all data segments correspondingto cortical DOWN states (Figure 3B, dotted line), implying thatinterneurons rarely participate in a synchronous population oscil-lation. Therefore, the Schaffer input implemented for the pureCA3-CA1 model is, in this case, insufficient to drive interneu-ronal spiking to ripple frequencies and additional excitatory driveis needed.
As in Taxidis et al. (2012), we split pyramidal cells into twogroups: those that receive less than 19.5 synapses-per-Schaffercollateral connection [1.5 × the mean (13) of the Gaussian distri-bution of synapses per Schaffer input] which constitute ∼70% ofthe population, and those that receive more than 19.5 synapses.We refer to the former group as the “moderately-driven subset”and the latter as the “strongly-driven subset.” Figure 3C showsthe total firing histograms of pyramidal cells of both groups,within the CA1 recording site, in correlation with the averagebandpassed ripple-like response. Rhythmic spiking in strongly-driven pyramidal cells is not significantly phase-locked to theaverage signal (P = 0.094), with firing peaks not overlapping withripple troughs (Figure 3C inset). This is an additional indicationof the low excitation that CA1 cells receive through the Schaffercollaterals, even during UP-state bursts.
Figure 3E depicts the total spike histograms of pyramidalcells of both groups in correlation with the average SO cycle.Strongly-driven cells (and interneurons, not shown) increasespiking during UP states, where the CA3 bursts involve morecells. In contrast, the majority of pyramidal cells that receive a
Frontiers in Computational Neuroscience www.frontiersin.org February 2013 | Volume 7 | Article 3 | 8

Taxidis et al. A network model of cortico-hippocampal coupling
0 50 100 150 200 250 300 350 400
1.1
1.2
1.3
1.4
Inte
rneu
rona
lP
ower
Spe
ctru
m
Frequency (Hz)
−1000 −800 −600 −400 −200 0 2000
400
800
1200
Pyr
amid
alH
isto
gram
lags(msec)
−50 −40 −30 −20 −10 0 10 20 30 40 50
30
Pyr
amid
alH
isto
gram
lags (msec)−50 −40 −30 −20 −10 0 10 20 30 40 50
50
Pyr
amid
alH
isto
gram
lags (msec)
−1000 −800 −600 −400 −200 0 2000
500
1000
1500P
yram
idal
His
togr
am
lags (msec)
lags (msec)
R
ippl
eH
isto
gram
Ave
rage
DO
WN
-UP
(nA
)A B
C
E
D
F
0.190
270
180 0
0.190
270
180 0
FIGURE 3 | CA1 spiking activity in the cortico-hippocampal
computational model, when the cortical network targets only CA3
(model diagram shown on top). (A) Raster of detected SWR-likeresponses (top) and their histogram (bottom) correlated with the averageSO cycle (thick line). Most SWRs appear during cortical UP states.(B) Power spectral density of the average membrane potential of CA1interneurons in the default recording site during UP states. With theoriginal Schaffer drive (dotted line), no peak appears at the ripplefrequency range (150–200 Hz), unlike in the pure CA3-CA1 network(Taxidis et al., 2012). After increasing the Schaffer collateral-drive, (solid
line) a peak at a broad ripple frequency range (100–200 Hz) appears.(C,D) Spike histograms of pyramidal cells (strongly-driven subset in greyand moderately-driven in black) correlated with the average ripple-likeresponse (black line, arbitrary units), with low (C) and high (D) Schafferdrive. Insets depict the spike phase distribution relative to the averageripple. (E,F) Spike histogram of CA1 pyramidal cells (strongly-drivensubset in grey and moderately-driven in black) correlated with theaverage SO cycle of the cortical firing rate (black line, arbitrary units),with low (E) and high (F) Schaffer drive. Spiking of moderately-drivencells decreases during UP states in both cases.
moderate or weak Schaffer-drive reduce firing during UP statesdue to increased interneuronal activity. They fire mostly in theDOWN states, when they can overcome the feedforward inhibi-tion. This supports observations on anesthetized mice where CA1cells were found to be hyperpolarized by UP states (Hahn et al.,2007) but is at odds with recordings on naturally sleeping ratswhere most CA1 pyramidal cells tended to fire during UP states(Isomura et al., 2006).
Therefore, additional excitation to CA1 is needed to induceUP-state preferential pyramidal spiking and robust ripple activ-ity, i.e., interneurons to fire synchronously at ripple frequencies(150–200 Hz) and strongly-driven pyramidal spiking to be phaselocked to ripple troughs. One straightforward way of inducingthis additional excitation is by increasing the Schaffer drive toCA1. We thus increased the number of synapses per Schafferconnection in CA1 interneurons to 20. For CA1 pyramidal cellsthe mean and SD of the Gaussian distribution of synapses perconnection was also set to 20 (this increased Schaffer input isimplemented in all following simulations). Figure 3B depicts theresulting power spectrum of the average interneuronal membrane
potential during UP states (solid line). The peak at ripple fre-quencies is restored, indicating that the interneurons now receiveenough excitation to oscillate synchronously at ripple frequencies.Moreover, the phase locking of the spike histogram of pyrami-dal cells during the average ripple (Figure 3D) has also beenrestored, with spikes being significantly locked to the averageripple trough (inset, P < 0.001). Nevertheless, the total spike his-togram of pyramidal cells during the average SO cycle (Figure 3F)reveals that the majority of cells, those that are moderately-drivenby CA3 (black bars), are still inhibited during UP states since theyare inhibited during ripples.
Conclusively, a strong Schaffer-drive restores interneuronalripple oscillations and the strongly-driven pyramidal cell spik-ing, restoring the main features of ripple events, but does notallow an overall UP-state preferential spiking of pyramidal cells,contradicting reports on naturally sleeping rats (Isomura et al.,2006). Different strengths or distributions of the Schaffer-driveover the pyramidal population, could either make moderately-driven cells fire during ripples, which is inconsistent with theobservation of most cells being silent (Ylinen et al., 1995), or
Frontiers in Computational Neuroscience www.frontiersin.org February 2013 | Volume 7 | Article 3 | 9

Taxidis et al. A network model of cortico-hippocampal coupling
it would still prevent them from spiking during ripples, contra-dicting the in vivo UP-state preferential spiking (Isomura et al.,2006). Therefore, an additional, external drive, unrelated to theSchaffer-input is necessary to produce the UP-state spiking, with-out making the majority of pyramidal cells participate in ripples.
EFFECTS OF TEMPOROAMMONIC INPUT ON CA1An alternative approach to further increase the drive to CA1 is toassign a direct cortical input through the TA pathway. The impor-tance of the TA for the SO-CA1 coupling has been implied byin vivo studies (Dickson et al., 2005; Wolansky et al., 2006) andindirectly by the role of TA input on CA1 spiking and plasticity(Remondes and Schuman, 2002) and on memory consolidation(Remondes and Schuman, 2004).
Although a topographic organization of the EC3 connectionsto the distal dendrites in the stratum lacunosum moleculare inCA1 has been described (Andersen et al., 2007), the exact detailsof this circuit are not well understood, e.g., how many CA1 pyra-midal cells or interneurons are contacted by a single EC3 axon.The TA input has been shown to have little effect on the firingproperties of postsynaptic pyramidal cells, but exerts a power-ful inhibitory effect on CA1 (Colbert and Levy, 1992; Empsonand Heinemann, 1995). Since inhibition can easily dominate inour network (the fixed pyramidal cell EPSP is much weaker thanthe interneuronal one, Table 1), we included few connections tointerneurons and a larger number to pyramidal cells, so that somecan overcome feedforward inhibition.
To test the isolated TA-input effect on CA1, we first removedthe Schaffer input and implemented various values for the num-bers of pyramidal and interneuronal cells that each cortical celltargets (kEC−PY and kEC−IN respectively). Figure 4A contains asegment of the cortical SO and Figure 4B shows the resulting CA1spike raster plots with different sets of kEC−PY and kEC−IN . Notethat again an interneuron receives on average 10 × kEC−IN con-nections. In all cases, DOWN states are accompanied by sparsespontaneous firing of CA1 pyramidal cells, depolarizing neigh-boring interneurons. When kEC−PY = 100 and kEC−IN = 1, pyra-midal activity is similar during UP and DOWN states. DoublingkEC−PY leads to more pyramidal spikes in the UP states and con-sequently more interneuronal ones as well, whereas increasingkEC−IN allows only few pyramidal cells to fire during UP states,with multiple spikes.
After restoring Schaffer collaterals, we calculated the z-scorenormalized firing rates of CA1 pyramidal cells and plotted them,similarly to Figure 2B, for the same combinations of kEC−PY
and kEC−IN as before (Figure 4C). Cells are again either corre-lated or anticorrelated with UP states. As expected, increasingonly the pyramidal drive results in more UP-state active cells(Figure 4C, middle), while increasing the interneuronal drive, hasthe opposite effect (Figure 4C, right). Nevertheless, the added TAinput is weaker than the Schaffer input, and does not appear tohave prominent effects on the features of ripple events. Strongerinterneuronal drive (as in the kEC−IN = 4 case) produces onlya small increase of the ripple-frequencies spectral peak of the
A
B
C
FIGURE 4 | Influence of the TA input on CA1 activity, in the
cortico-hippocampal computational model, without and with Schaffer
input (model diagrams are shown on top for each case). (A) SO in thecortical model acting as input to the CA1 model (pyramidal spikes are in blackand interneuronal in grey). (B) Three CA1 raster plots with the averagenumber of pyramidal cells and interneurons contacted by each cortical cell,
displayed on top. The Schaffer input from CA3 is removed here, to show theeffect of solely the TA input. (C) Color coded z-score normalized averagefiring rates of CA1 pyramidal cells, arranged by their peak from top to bottomand aligned with the average SO cycle (white line, arbitrary units). Thenumber of cells firing preferentially during UP states depends on the form ofthe TA input. The increased Schaffer input has been restored here.
Frontiers in Computational Neuroscience www.frontiersin.org February 2013 | Volume 7 | Article 3 | 10

Taxidis et al. A network model of cortico-hippocampal coupling
UP-state average interneuronal potential power spectrum (notshown), while the phase locking of pyramidal spikes to rippletroughs remains significant for all three cases of TA excitation-to-inhibition ratios (see Figure 5D).
Although the TA input does not determine the particular char-acteristics of the ripple activity, it affects the fraction of pyramidalcells that will overcome UP-state inhibition. Our model suggeststhat a strong TA-drive to CA1 pyramidal cells aids in reproducingthe CA1 UP-state spiking described in Isomura et al. (2006), whileits additional drive to interneurons enhances synchronous spikingat ripple frequencies. We thus fix the TA input to kEC−PY = 200
and kEC−IN = 2. A segment of the raster plot from all three net-works with these parameter values is shown in Figure 5A. Thetotal pyramidal spike histogram (Figure 5B) indicates that theadditional TA input lead to the increase of spiking activity of bothsubsets during UP states (compare with Figures 3E and F). Theripple histogram over the average SO cycle (Figure 5C) and theripple-correlated spike histogram (Figure 5D) ensure that againmost ripples appear during UP states and the phase locking ofspikes from the strongly-driven subset to the ripple troughs is stillhighly significant (P < 0.001). Moreover, in this set up, ∼11.5%of CA1 cells fire in the average ripple, which is in close agreement
F
0.190
270
180 0
A E
B
C
D
FIGURE 5 | Activity in the cortico-hippocampal model when the SO
drives directly both CA3 and CA1 (model diagram shown on top).
Each cortical cell targets 200 CA1 pyramidal and 2 interneuronal cells inCA1 through the TA input. (A) Raster plot of all three networks. (B,C)
Spike histogram of CA1 pyramidal cells (B, strongly-driven subset in greyand moderately-driven in black) and detected ripples histogram (C) incorrelation with the average SO cycle (black line, arbitrary units). Bothpyramidal cell subsets increase spiking during UP states (compare withFigures 3G,H). Ripple occurrence is again correlated with UP states.
(D) Spike histogram of pyramidal cells in the recording site, aligned withthe average ripple, and spike phase distribution relative to the averageripple (inset). The TA input did not significantly affect the spike phaselocking (compare with Figure 3D). (E) Color coded z-score firing rates ofCA1 pyramidal cells during the average SO cycle (white line). Cells arestacked according to the peak firing rate, from top to bottom. Thenumber of synapses per Schaffer collateral-connection that each cellreceives is plotted on the left. (F) Same as (E), for cells stackedaccording to this number of Schaffer synapses.
Frontiers in Computational Neuroscience www.frontiersin.org February 2013 | Volume 7 | Article 3 | 11

Taxidis et al. A network model of cortico-hippocampal coupling
with the reported percentage (10%) in naturally sleeping rats(Ylinen et al., 1995).
Finally, to examine the spiking activity of individual CA1cells, we repeated the z-score normalized firing rate calculationfor each cell, and arranged them according to either the time ofthe firing rate peak (Figure 5E) or the number of synapses-per-Schaffer input each cell receives (Figure 5F) which is plotted nextto each panel. Figure 5E indicates that, with the implementedcombination of TA and Schaffer drive, most CA1 pyramidal cellsfire preferentially during UP states [663 cells (70.6%) against276 (29.4%) firing mostly in DOWN states]. The correspondingSchaffer input is, on average, higher for these cells (the averagenumber of synapses per-Schaffer connection is 28.5 for the“UP-cells” and 13.7 for the “DOWN-cells”). In fact, Figure 5Fsuggests that the stronger the Schaffer drive, the higher theprobability that the cell will fire mostly in UP states (93% of thestrongly-driven cells fire mostly in UP states). Note, however,that some cells (7%) with strong Schaffer drive get too inhibitedin UP states and tend to fire more in DOWN states, while manyof the moderately-driven cells which are silent during DOWNstates, fire in UP states due to strong depolarizations from theTA input. In conclusion, the correlation of any particular cell’sspiking activity with the SO appears to depend on a combinationof both the Schaffer and the TA drive.
CORRELATIONS OF CA1 PYRAMIDAL SPIKING TO UP-STATES ANDRIPPLES DEPEND ON THE COMBINED SCHAFFER ANDTEMPOROAMMONIC INPUTS. COMPARISON WITH In vivoRECORDINGSOur results suggest that the combination of direct TA- and indi-rect DG-CA3-input from the cortex can segregate CA1 pyramidalcells into four subgroups, with distinct firing properties related tothe SO state where they preferentially fire and the extent of theirripple spiking:
1. Pyramidal cells that are excited by the TA input and receivestrong CA3 drive, are expected to fire preferentially during UP
states, and participate in all ripples, irrelevant of whether theytake place during UP or DOWN states.
2. Pyramidal cells excited by the TA input and receiving aver-age/weak CA3 drive. They should fire preferentially duringUP states but their firing increase during any ripple will beminimal.
3. Pyramidal cells inhibited by the TA input, receivingstrong/average CA3 drive. They would fire mostly dur-ing DOWN states, particularly during the ripples taking placethere. UP-state ripples should also transiently increase theirspiking activity, since the CA3 input appears to be morecritical during the ripple.
4. Pyramidal cells inhibited by the TA input and receiving aver-age/weak CA3 drive. They should fire preferentially duringDOWN states and also remain relatively silent during allripples.
The characteristics of these groups are summarized in Table 2.The model predicts that in the absence of a TA input, subgroups2 and 3 largely disappear, with the vast majority of cells forminggroup 4 and a minority in group 1 (Figure 3), as observed in anes-thetized mice (Hahn et al., 2007). With the additional TA drivemost cells are expected to form groups 2 and 4, with a minorityin groups 1 and 3. We tested this segregation on a set of clus-tered CA1 pyramidal cells (n = 2334) recorded from the dorsalCA1 of rats, during SWS preceding or following space explorationtasks (Mizuseki et al., 2009, 2011). Ripples were detected throughthe CA1 pyramidal layer LFP and DOWN-to-UP transition timesrefer to entorhinal spiking activity (see section “Materials andMethods”).
In accordance with (Isomura et al., 2006) average spikingof cells around DOWN-UP transitions was typically correlatedwith either the pre-transition or the post-transition segment(Figure 6A) and all cells were split into two groups (referred toas “UP-cells” and “DOWN-cells”) according to the SO state theycorrelate with (see “Materials and Methods”). 93.6% (n = 2185)were classified as UP-cells and 6.4% (n = 149) as DOWN-cells
Table 2 | Summary of the four CA1 pyramidal cell groups suggested by the computational model (see section “Correlations of CA1 Pyramidal
Spiking to UP-states and Ripples Depend on the Combined Schaffer and Temporoammonic inputs. Comparison with in vivo recordings”), and
detected in a set of in vivo electrophysiological data.
Strong schaffer collaterals input Average/weak schaffer collaterals input
Group 1 Group 2
Excitatory input from the UP-state preferential firing UP-state preferential firing
temporoammonic pathway Large spiking increase during all ripples Small spiking increase during all ripples
(17.8%) (75.8%)
Group 3 Group 4
DOWN-state preferential firing DOWN-state preferential firing
Inhibitory input from the Large spiking increase during DOWN-state ripples. Low spiking during any ripple
temporoammonic pathway Lower spiking increase in UP-state ripples
(1.3%) (5.1%)
They are classified according to their spiking correlation with SO states and ripples. These correlations are associated to the inputs they receive from CA3 and from
the entorhinal cortex. Percentages correspond to the ratio of in vivo recorded cells that were found to fall within each category.
Frontiers in Computational Neuroscience www.frontiersin.org February 2013 | Volume 7 | Article 3 | 12

Taxidis et al. A network model of cortico-hippocampal coupling
−300 −200 −100 0 100 200 300
−0.5
0
0.5
1
1.5
2
2.5
3
Nor
mal
ized
mea
n U
P−
and
D
OW
N−
cell
firin
g ra
tes
(Hz)
Cel
l num
ber
200
600
1000
1400
1800
2200
−300 −200 −100 0 100 200 3000.4
0.5
0.6
lags (msec)
Mea
n C
A1
firin
g ra
te (
Hz) −3
−2
−1
0
1
2
3
lags (msec)
Cel
l num
ber
200
600
1000
1400
1800
2200
−100 −80 −60 −40 −20 0 20 40 60 80 100
2
4
lags (msec)
Mea
n C
A1
firin
g ra
te (
Hz) −2
−1
0
1
2
3
4
5
6
−100 −80 −60 −40 −20 0 20 40 60 80 100lags (msec)
−5
0
5
10
Mea
n rip
ple
firin
g ra
tes
ofU
P/D
OW
Nce
lls (
Hz)
Mea
n no
rmal
ized
rippl
e fir
ing
rate
sof
UP
/DO
WN
cells
(H
z)
−5
0
5
10
−300 −200 −100 0 100 200 300
200
400
600
800
1000
1200
1400
1600
lags (msec)
Num
ber
of r
ippl
es
Mean ripple
occurrence rate (Hz)
0.4
0.2
0
0 5 10 15 20 25 30 35 40
50
100
150
200
250
Maximum firing rate increase of UP/DOWN cells during UP/DOWN−ripples
Firing rate increase (Hz)
Num
ber
of c
ells
CA
1 firing rates (z-score)
CA
1 firing rates (z-score)
A
B
C F
E
D
FIGURE 6 | Analysis on a set of in vivo multiunit recordings from the
rat CA1 pyramidal layer. (A) Color coded z-score average firing rate ofeach CA1 pyramidal cell (top) and mean population rate (bottom) aroundDOWN-to-UP transitions (thick line) assessed by entorhinal neuronalactivity. Thin black line indicates the time threshold for segregating cellsinto UP-state and DOWN-state correlated cells (−60 ms). (B) Averagefiring rates and standard deviations of UP-cells (blue) and DOWN-cells(red), normalized by their total means. (C) Number of ripples during UPstates (blue) and DOWN states (red), and average ripple occurrence rate
(black). (D) Color coded z-score average firing rate of each CA1 pyramidalcell (top) and mean population rate (bottom) around detected ripplepower peaks (black line). White lines indicate the average time limits ofdetected ripple episodes. (E) Mean firing rate of UP-cells (blue) andDOWN-cells (red) around the average ripple (top) and normalized by themean baseline activity (bottom). (F) Histograms of average maximumfiring rate increase from baseline of UP cells (blue) and DOWN-cells (red)during UP- and DOWN-ripples respectively. Lines indicate the 1.5 × meanincrease, for the classification into highly- and low-firing cells.
(Figure 6B). According to our model, this implies that the TAinput acts as an excitatory drive to the majority of CA1 neuronsduring SWS, promoting the emergence of groups 1 and 2.
All recorded ripple episodes were also separated intoevents that took place during a DOWN state (referred to asDOWN-ripples) or an UP state (UP-ripples). 90.1% of events(n = 111214) were classified as UP-ripples and 9.9% of events(n = 12229) as DOWN-ripples (Figure 6C). Note that the aver-age occurrence rate of ripple episodes is much higher in UP states,therefore the large abundance of UP-cells may also be related tothe increased number of SWRs during those (apart from the TAinput).
We examined the correlation of individual cell spiking withripples, where CA3 is expected to provide the prominent drive.Most cells increased their firing around the average ripple with themajority of cells exhibiting a firing peak 3–6 ms before the ripple
peak [Figure 6D, in accordance with (Csicsvari et al., 1999)].Figure 6E depicts the mean firing rate of UP- and DOWN-cellsaround the average ripple. UP cells show a significantly higher rateincrease (P < 0.001). This may be due to a stronger input fromCA3 (more coherent and/or widespread CA3 population bustsin UP states) and/or the additional TA input. When normalizingthe average firing rates by the mean baseline activity around theripples, the relative spiking increase becomes equal for both cellgroups, implying that the Schaffer-input received by either groupprovides a similar relative gain. Therefore, as in our model, the TAinput seems unlikely to severely affect ripple spiking responses.We return to this issue further below.
Next, each (UP-) DOWN-cell was classified according toits average firing rate increase during (UP-) DOWN-ripples.The classification threshold was set to 1.5× the mean firingrate increase of (UP-) DOWN-cells during the average (UP-)
Frontiers in Computational Neuroscience www.frontiersin.org February 2013 | Volume 7 | Article 3 | 13
Taxidis et al. A network model of cortico-hippocampal coupling
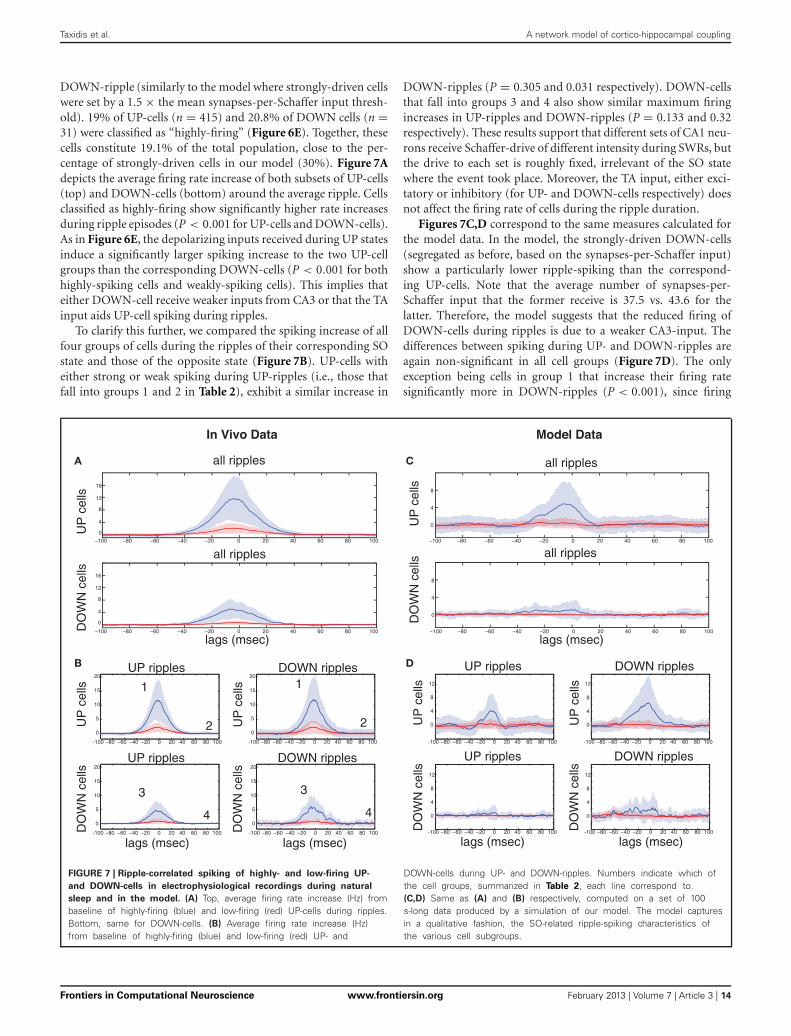
DOWN-ripple (similarly to the model where strongly-driven cellswere set by a 1.5 × the mean synapses-per-Schaffer input thresh-old). 19% of UP-cells (n = 415) and 20.8% of DOWN cells (n =31) were classified as “highly-firing” (Figure 6E). Together, thesecells constitute 19.1% of the total population, close to the per-centage of strongly-driven cells in our model (30%). Figure 7Adepicts the average firing rate increase of both subsets of UP-cells(top) and DOWN-cells (bottom) around the average ripple. Cellsclassified as highly-firing show significantly higher rate increasesduring ripple episodes (P < 0.001 for UP-cells and DOWN-cells).As in Figure 6E, the depolarizing inputs received during UP statesinduce a significantly larger spiking increase to the two UP-cellgroups than the corresponding DOWN-cells (P < 0.001 for bothhighly-spiking cells and weakly-spiking cells). This implies thateither DOWN-cell receive weaker inputs from CA3 or that the TAinput aids UP-cell spiking during ripples.
To clarify this further, we compared the spiking increase of allfour groups of cells during the ripples of their corresponding SOstate and those of the opposite state (Figure 7B). UP-cells witheither strong or weak spiking during UP-ripples (i.e., those thatfall into groups 1 and 2 in Table 2), exhibit a similar increase in
DOWN-ripples (P = 0.305 and 0.031 respectively). DOWN-cellsthat fall into groups 3 and 4 also show similar maximum firingincreases in UP-ripples and DOWN-ripples (P = 0.133 and 0.32respectively). These results support that different sets of CA1 neu-rons receive Schaffer-drive of different intensity during SWRs, butthe drive to each set is roughly fixed, irrelevant of the SO statewhere the event took place. Moreover, the TA input, either exci-tatory or inhibitory (for UP- and DOWN-cells respectively) doesnot affect the firing rate of cells during the ripple duration.
Figures 7C,D correspond to the same measures calculated forthe model data. In the model, the strongly-driven DOWN-cells(segregated as before, based on the synapses-per-Schaffer input)show a particularly lower ripple-spiking than the correspond-ing UP-cells. Note that the average number of synapses-per-Schaffer input that the former receive is 37.5 vs. 43.6 for thelatter. Therefore, the model suggests that the reduced firing ofDOWN-cells during ripples is due to a weaker CA3-input. Thedifferences between spiking during UP- and DOWN-ripples areagain non-significant in all cell groups (Figure 7D). The onlyexception being cells in group 1 that increase their firing ratesignificantly more in DOWN-ripples (P < 0.001), since firing
−80 −60 −40 −20 0 20 40 60 80 100
0
5
10
15
20
-100
−80 −60 −40 −20 0 20 40 60 80 100
0
5
10
15
20
-100 −80 −60 −40 −20 0 20 40 60 80 100
0
5
10
15
20
-100
−80 −60 −40 −20 0 20 40 60 80 100
0
5
10
15
20
-100
−80 −60 −40 −20 0 20 40 60 80 100-100
−80 −60 −40 −20 0 20 40 60 80 100-100 −80 −60 −40 −20 0 20 40 60 80 100-100
−80 −60 −40 −20 0 20 40 60 80 100-100
−100 −80 −60 −40 −20 0 20 40 60 80
0
4
8
12
16
all ripples all ripples
UP
cel
lsD
OW
N c
ells
UP
cel
lsD
OW
N c
ellsall ripples all ripples
UP ripples
UP ripples
UP
cel
lsD
OW
N c
ells
UP
cel
lsD
OW
N c
ells
DOWN ripples
DOWN ripples
100
0
4
8
12
16
−100 −80 −60 −40 −20 0 20 40 60 80 100
UP ripples
UP ripples
UP
cel
lsD
OW
N c
ells
UP
cel
lsD
OW
N c
ells
DOWN ripples
DOWN ripples
lags (msec) lags (msec) lags (msec) lags (msec)
lags (msec)lags (msec)
A
B D
C
0
4
8
0
4
8
−100 −80 −60 −40 −20 0 20 40 60 80 100
−100 −80 −60 −40 −20 0 20 40 60 80 100
0
4
8
12
0
4
8
12
0
4
8
12
0
4
8
121
2
1
2
3
4
3
4
In Vivo Data Model Data
FIGURE 7 | Ripple-correlated spiking of highly- and low-firing UP-
and DOWN-cells in electrophysiological recordings during natural
sleep and in the model. (A) Top, average firing rate increase (Hz) frombaseline of highly-firing (blue) and low-firing (red) UP-cells during ripples.Bottom, same for DOWN-cells. (B) Average firing rate increase (Hz)from baseline of highly-firing (blue) and low-firing (red) UP- and
DOWN-cells during UP- and DOWN-ripples. Numbers indicate which ofthe cell groups, summarized in Table 2, each line correspond to.(C,D) Same as (A) and (B) respectively, computed on a set of 100s-long data produced by a simulation of our model. The model capturesin a qualitative fashion, the SO-related ripple-spiking characteristics ofthe various cell subgroups.
Frontiers in Computational Neuroscience www.frontiersin.org February 2013 | Volume 7 | Article 3 | 14

Taxidis et al. A network model of cortico-hippocampal coupling
rates outside UP-ripples are high (unlike in the data where UPand DOWN activity in CA1 is not as distinct as in the model).Therefore, the TA input again appears not to influence spikingduring the actual ripples, whereas the CA3-drive is the criticalfactor. Conclusively, cells that receive the highest input from CA3will fire preferentially in UP states where SWRs are more frequent.Those that receive a weaker drive can still fire in ripples, but theTA input can either shift them to an UP-state or DOWN-statecorrelation. Cells with weak CA3 input will depend on the TAfor their correlation with the SO and will not actively partici-pate in ripple spiking. Finally, note that the reduced spiking ofDOWN-cells during UP-ripples in the model is mainly due to theTA inhibition that appears somewhat stronger in our model thanwhat is suggested by the recordings.
DISCUSSIONVarious studies have addressed the impact of the cortical SOon other brain areas including the thalamus and hippocampus,focusing on correlations between their intrinsic rhythms and theSO states (Siapas and Wilson, 1998; Sirota et al., 2003; Battagliaet al., 2004; Isomura et al., 2006; Mölle et al., 2006). These studiessupport the fundamental role of the SO in coupling rhythmicalactivity of thalamic and hippocampal circuits, with the intensecortical UP-state spiking exerting a strong drive on both areas,promoting their oscillatory events. The spiking activity of thevarious hippocampal areas during the SO has also been recentlystudied (Isomura et al., 2006; Hahn et al., 2007; Sullivan et al.,2011), occasionally with contradictory results.
To suggest potential functional mechanisms giving rise tothe observed UP state-hippocampal activity relationships and tothe contradictions between observations under different exper-imental protocols, we coupled a SO-exhibiting cortical net-work (Compte et al., 2003, 2008) with a CA3-CA1 networkmodel of SWRs (Taxidis et al., 2012). The implemented cortico-hippocampal connectivity (Figure 1) is a simplification of thedirect and indirect projections between PFC and hippocam-pus. We focused our analysis on how the spiking activity andintrinsic network dynamics of the two CA areas depend on theexcitation-to-inhibition balance, induced by the cortical SO. Toour knowledge, this is the first modeling study of the SO effects onhippocampal spiking and ripples. The main results from our sim-ulations can be summarized as follows: (1) The correlation of CA3population bursts, and corresponding CA1 SWRs, with the corti-cal SO are controlled by the feedforward excitation-to-inhibitionratio induced by the mossy fiber input. Pyramidal-targeted inputson CA3 lead to SWRs correlated with UP states, whereas an anti-correlation exists when feedforward inhibition is promoted bythe mossy input. (2) Ripple characteristics (interneuronal oscil-lation frequency and timing of pyramidal spikes) are controlledby the Schaffer input to CA1. This varies between CA1 cells butremains constant between UP-state and DOWN-state ripples. (3)The overall amount of CA1 spiking in relation to UP/DOWNstates is affected by the excitation-to-inhibition ratio induced viathe temporoammonic TA input. Stronger drive on CA1 pyrami-dal cells, than on interneurons, promotes UP state-correlated CA1pyramidal spiking and vice versa, without affecting ripple char-acteristics. (4) The combination of CA3 and TA inputs on CA1
segregates pyramidal cells into different groups depending on theSO state where they preferentially fire and whether they substan-tially spike during ripples or not. These groups, confirmed byin vivo recordings, may have distinct functional roles during SWSand the ensuing memory consolidation.
These observations are in agreement with previous Grangercausality-based (Baccalá and Sameshima, 2001) statistical anal-ysis, reporting that the mPFC drives hippocampal activity par-ticularly during short cortical UP-like states in anesthetized rats(Taxidis et al., 2010).
MOSSY FIBER INPUTOur model-suggested tradeoff between CA3 population activi-ties during the two SO states is generated by the CA3 network’sintrinsic dynamics. While pyramidal cells receive the UP-stateinput, weak or no drive to interneurons allows the network toself-organize into the population bursts seen in the isolated CA3network (Taxidis et al., 2012), but leaves it in a disorganized stateduring DOWN states, where cells are in various levels of excita-tion, leading to poor DOWN activity. In contrast, when interneu-ronal spiking dominates UP-states, pyramidal cells are left in amore uniform hyperpolarized state at the onset of DOWN states,where they can easily synchronize in spontaneous populationbursts. Such a tendency of interneuronal activity to synchronizepost-inhibitory pyramidal spiking has also been demonstrated inCA3 and CA1 in in vitro slices (Cobb et al., 1995; Ellender et al.,2010) and in vivo recordings (Harris et al., 2001). Since thesebursts will produce SWRs in CA1, the SO-induced excitation-to-inhibition ratio in CA3 will determine whether ripple occurrencewill be correlated or anticorrelated with UP states. Though strongfeedforward excitation in CA3 reproduces the widely reportedcorrelation of ripple activity with UP states (Sirota et al., 2003;Battaglia et al., 2004; Isomura et al., 2006; Mölle et al., 2006), ourmodel predicts that a selective blockade of the mossy fiber inputon CA3 pyramidal cells or an enhancement of UP-state interneu-ronal spiking will reduce the UP-state ripple occurrence and evenreverse it to a DOWN-state correlation.
The modeled CA3 pyramidal population can be separated intotwo groups, one being driven to spike by the UP state input andthe other silenced by the enhanced inhibition from neighboringinterneurons. A similar distinction was also found through in vivointracellular recordings on anesthetized mice, where CA3 pyrami-dal cell membrane potentials exhibited a mixed SO modulation,some being correlated with the UP state and some anticorre-lated (Hahn et al., 2007). However, a study on anesthetized andnaturally sleeping rats reported preferential firing of most cellsduring DOWN states, organized in gamma oscillations, whileSWRs are still UP-correlated (Isomura et al., 2006). We pro-pose that the increased DOWN-activity could be due to thegamma oscillations producing more overall firing than popula-tion bursts (Isomura et al., 2006; Sullivan et al., 2011), whilepopulation bursts, involving a cell minority, are still organizedby the mossy input, giving rise to UP-state SWRs. Since thecurrent version of our CA3 network does not support gammafrequency oscillations, this remains to be examined. Moreover,species-, anesthetic- or preparation-specific differences betweenthe two studies could result in differences in the input that
Frontiers in Computational Neuroscience www.frontiersin.org February 2013 | Volume 7 | Article 3 | 15

Taxidis et al. A network model of cortico-hippocampal coupling
CA3 receives through the SO, thus affecting the size of the twosubgroups.
Given the entrainment of the DG by the SO (Isomura et al.,2006; Hahn et al., 2007; Sullivan et al., 2011) CA3 is expected tobe under a barrage of dentate input during UP states, which islargely absent in DOWN states. However, our in vivo data analysissuggests that the excitatory input received by CA1 during SWRs isroughly fixed, irrespective of the SO state during which it tookplace, implying that the CA3 population bursts yielding SWRsdo not vary substantially in either state. This is suggestive of anintrinsic self-organized activity in CA3, promoted by the UP stateinput, but not shaped by it, similar to the independence of thehippocampal circuit organization proposed in the framework oftheta oscillations (Mizuseki et al., 2009). The CA3 architecture ofextensive recurrent excitation combined with feedback inhibitioncan support such self-organization.
TEMPOROAMMONIC AND SCHAFFER INPUTSThe ability of the TA-CA1 synapse to exhibit both long-term depression and potentiation (Remondes and Schuman,2002), and the dependence of CA1 spikes on the timing dif-ference between the TA and the Schaffer inputs (Empson andHeinemann, 1995; Remondes and Schuman, 2002; Jarsky et al.,2005), suggest the importance of the TA input during SWS.Correlations of R-LM interneurons (Freund and Buzsáki, 1996)with the SO (Hahn et al., 2006), and of CA1 spiking withpersistent entorhinal UP-state activity (Hahn et al., 2012), anddeficiencies of TA-lesioned rats in memory retrieval (Remondesand Schuman, 2004; Suh et al., 2011) support an active role of TAinput in promoting the SO entrainment to the hippocampus andits importance in spatial memory consolidation.
Our model suggests that strong Schaffer drive to CA1, variablefor pyramidal cells, is sufficient to reproduce coherent interneu-ronal ripple oscillations, but the majority of pyramidal cells wouldbe silenced during UP states (Taxidis et al., 2012), reminiscentof the UP-state hyperpolarization of CA1 cells found in anes-thetized mice (Hahn et al., 2007), but contradicting the observedUP-state correlated spiking in naturally sleeping rats [Figure 6and Isomura et al. (2006)]. This discrepancy was overcome in themodel by the inclusion of the SWR-independent TA input thatpromoted UP-state pyramidal firing without critically influencingSWR characteristics. Our simulations suggest that factors, such asanesthesia, that may suppress the TA input or alter it in favor ofinterneuronal activity could yield the observations in (Hahn et al.,2007). However, a specific minority of “strongly Schaffer-driven”cells would still fire in ripples, mostly during UP states, in con-trast with the rest of the population. This overall suppression ofUP-state spiking in most cells, particularly during UP-state rip-ples, may underlie the temporal association memory deficits thatwere recently observed in transgenic mice where entorhinal cellswere inhibited, depriving CA1 cells from the TA input (Suh et al.,2011).
Our combined modeling and in vivo analysis indicates thatthe main factor for determining the overall correlation of a CA1pyramidal cell with either of the SO states is the TA input. Sincemost cells fire mostly during UP states, we propose that this inputis largely excitatory for most of the CA1 population. Conversely,
the main factor for determining whether a cell will actively par-ticipate in ripple spiking is the Schaffer input, which appears tovary substantially among CA1 cells. Our observed variability inthe firing responses to SWRs has also been reported elsewhere,for both CA1 pyramidal cells (Royer et al., 2012) and interneu-rons (Csicsvari et al., 2000). Although in the model the variabilityis implemented in the number of Schaffer connections pyrami-dal cells receive, it may also be linked to either the strength of theSchaffer input on different CA1 pyramidal cells (Fernández-Ruizet al., 2012) or in the convergence of Schaffer collaterals on CA1cells or assemblies (Takahashi et al., 2012).
Apart from the effective segregation of the pyramidal popu-lation according to which SO state each cell correlates with andwhether it actively participates in ripple spiking, CA1 pyramidalcells have also been shown to be segregated according to whetheror not they shift their theta phase correlation between REMand non-REM sleep (Mizuseki et al., 2011). 35.1% of recordedcells that did exhibit a REM-related shift (a similar ratio to ourstrongly-Schaffer-driven group), also showed stronger entrain-ment by the SO and were more active during ripple spiking,and can be linked to our “strongly Schaffer-driven” cells. Thesecells are located mostly in deep sublayers of the CA1 stratumpyramidale, indicating that such sublayers may underlie differ-ent functional purposes (Mizuseki et al., 2011). Whether, thesegroups also reflect different functional roles, potentially linked tomemory consolidation processes, remains to be examined.
MODEL EXTENSIONSThe relatively simple network architecture developed here, offersa first modeling approach to the problem of SO-hippocampalcorrelations, shedding light on the role of important parametersand key components, but omitting many features of hippocampalcircuitry and cortico-hippocampal connections. Circuits such asmonosynaptic projections from CA1 to the PFC, from entorhinalcortex to CA3 through the perforant path, or even commissuralCA3 connections (Andersen et al., 2007) can provide delayedfeedback mechanisms that may potentially have a serious effect onthe timing and the excitation-to-inhibition ratio of the UP stateinput received by the two CA areas. Such circuits provide inter-esting potential extensions to the model, whose effects cannot bereadily predicted.
A simplification in our model architecture is the omission ofUP-state signal filtering by the DG. In vitro studies revealed thatthe mossy output to CA3 pyramidal cells can be excitatory orinhibitory, depending on the spiking frequency of the dentatecells in combination with facilitation (depression) of excitatory(inhibitory) inputs (Mori et al., 2004). Therefore, the UP statesignal arriving in CA3 and the induced excitation-to-inhibitionratio could be altered by dentate activity. The future addition of adistinct DG network to our model could shed some light on thefinal form of the UP state signal that arrives in CA3.
SWR generation in the model is based solely on perisomaticinhibition, excluding various types of interneurons that areinvolved in SWRs (Klausberger and Somogyi, 2008). Recentoptogenetic studies have shown dendritic interneurons to be crit-ical for the pyramidal output (Lovett-Barron et al., 2012; Royeret al., 2012) or the regulation between TA and Schaffer inputs
Frontiers in Computational Neuroscience www.frontiersin.org February 2013 | Volume 7 | Article 3 | 16

Taxidis et al. A network model of cortico-hippocampal coupling
(Leão et al., 2012) and computational models have included avariety of interneuronal types in mechanisms for place cell pat-tern learning and replay (Cutsuridis and Hasselmo, 2010, 2011).Future model versions can address the role of such interneu-rons on the cortico-hippocampal communication and ripplegeneration.
The inclusion of neuronal networks from other brain areas,like the DG or thalamic subregions which influence hippocam-pal activity, would shed further light on the general cortico-hippocampal cross-talk during deep sleep. Recently, it wasshown that decoupling such circuitries can lead to disruptedcorrelations between intrinsic hippocampal and thalamocorti-cal oscillations (Phillips et al., 2012). Most importantly, theinclusion of plasticity in the involved synapses and of more
complex membrane currents would also help a detailed studyof the process of temporal pattern transfer through the hip-pocampus and eventually to PFC during SWRs, for memoryconsolidation.
ACKNOWLEDGMENTSThe authors would like to warmly thank Albert Compte for hishelp and advice in implementing the cortical model, GyörgyBuzsáki, Christof Koch, Anton Sirota, and Erik Schomburg forhelpful discussions, Steve Coombes for his valuable help in con-structing our computational model, Uri Maoz for his help instatistical analysis and all reviewers for their constructive recom-mendations. This work was funded by the Marie Curie Network,MMBNOTT, Project No. MEST-CT-2005-020723).
REFERENCESAcsady, L., Kamondi, A., Sik, A.,
Freund, T., and Buzsáki, G. (1998).GABAergic cells are the major post-synaptic targets of mossy fibers inthe rat hippocampus. J. Neurosci. 18,3386–3403.
Amaral, D. G., Ishizuka, N., andClaiborne, B. (1990). Neurons,numbers and the hippocampalnetwork. Prog. Brain Res. 83, 1–11.
Amaral, D. G., and Witter, M. P. (1989).The three-dimensional organiza-tion of the hippocampal forma-tion: a review of anatomical data.Neuroscience 31, 571–591.
Andersen, P., Morris, R., Amaral, D.,Bliss, T., and O’Keefe, J. (2007). TheHippocampus Book. New York, NY:Oxford University Press.
Baccalá, L. A., and Sameshima, K.(2001). Partial directed coherence:a new concept in neural struc-ture determination. Biol. Cybern. 84,463–474.
Bartos, M., Vida, I., and Jonas, P.(2007). Synaptic mechanisms ofsynchronized gamma oscillationsin inhibitory interneuron networks.Nat. Rev. Neurosci. 8, 45–56.
Battaglia, F. P., Sutherland, G. R.,and McNaughton, B. L. (2004).Hippocampal sharp wave burstscoincide with neocortical “up-state”transitions. Learn. Mem. 11,697–704.
Bazhenov, M., Timofeev, I., Steriade,M., and Sejnowski, T. J. (2002).Model of thalamocortical slow-wavesleep oscillations and transitionsto activated states. J. Neurosci. 22,8691–8704.
Berens, P. (2009). CircStat: a MATLABtoolbox for circular statistics. J. Stat.Softw. 31, 1–21.
Bernard, C., and Wheal, H. V. (1994).Model of local connectivity pat-terns in CA3 and CA1 areas ofthe hippocampus. Hippocampus 4,497–529.
Buhl, E. H., Halasy, K., and Somogyi,P. (1994). Diverse sources of hip-pocampal unitary inhibitory post-synaptic potentials and the numberof synaptic release sites. Nature 368,823–828.
Buzsáki, G. (1989). Two-stage model ofmemory trace formation: a role for“noisy” brain states. Neuroscience31, 551–570.
Buzsáki, G. (2006). Rhythms of theBrain. New York, NY: OxfordUniversity Press.
Buzsáki, G., Horvath, Z., Urioste, R.,Hetke, J., and Wise, K. (1992).High-frequency network oscillationin the hippocampus. Science 256,1025–1027.
Chrobak, J. J., and Buzsáki, G. (1996).High-frequency oscillations inthe output networks of thehippocampal-entorhinal axis ofthe freely behaving rat. J. Neurosci.16, 3056–3066.
Cobb, S. R., Buhl, E. H., Halasy,K., Paulsen, O., and Somogyi, P.(1995). Synchronization of neu-ronal activity in hippocampus byindividual GABAergic interneurons.Nature 378, 75–78.
Colbert, C. M., and Levy, W. B. (1992).Electrophysiological and pharmaco-logical characterization of perforantpath synapses in CA1: mediation byglutamate receptors. J. Neurophys.68, 1–8.
Compte, A., Reig, R., Descalzo, V.F., Harvey, M. A., Puccini, G. D.,and Sanchez-Vives, M. V. (2008).Spontaneous high-frequency(10–80 Hz) oscillations during upstates in the cerebral cortex in vitro.J. Neurosci. 28, 13828–13844.
Compte, A., Sanchez-Vives, M. V.,McCormick, D. A., and Wang,X. J. (2003). Cellular and net-work mechanisms of slow oscil-latory activity (<1 Hz) and wavepropagations in a cortical networkmodel. J. Neurophys. 89, 2707–2725.
Csicsvari, J., Hirase, H., Czurko, A.,Mamiya, A., and Buzsáki, G. (1999).Oscillatory coupling of hippocam-pal pyramidal cells and interneu-rons in the behaving rat. J. Neurosci.19, 274–287.
Csicsvari, J., Hirase, H., Mamiya, A.,and Buzsáki, G. (2000). Ensemblepatterns of hippocampal CA3-CA1neurons during sharp wave–associated population events.Neuron 28, 585–594.
Cutsuridis, V., Graham, B., Cobb, S.,and Vida, I. (2010). HippocampalMicrocircuits: A ComputationalModeler’s Resource Book. New York,NY: Springer Verlag.
Cutsuridis, V., and Hasselmo, M.(2010). “Dynamics and functionof a CA1 model of the hippocam-pus during theta and ripples,” inICANN 2010, Part I, LNCS 6352,eds K. Diamantaras, W. Duch, andL. S. Iliadis (Berlin, Heidelberg:Springer-Verlag), 230–240.
Cutsuridis, V., and Hasselmo, M.(2011). Spatial memory sequenceencoding and replay during mod-eled theta and ripple oscillations.Cogn. Comput. 3, 554–574.
Diba, K., and Buzsáki, G. (2007).Forward and reverse hippocampalplace-cell sequences during ripples.Nat. Neurosci. 10, 1241–1242.
Dickson, C. T., Wolansky, T. D., andKerber, J. W. (2005). Neocorticalmodulation of the hippocampalslow oscillation via the entorhi-nal cortex. Soc. Neurosci. Abstr. 31,275.273.
Eichenbaum, H. (2000). A cortical–hippocampal system for declara-tive memory. Nat. Rev. Neurosci. 1,41–50.
Ellender, T. J., Nissen, W., Colgin, L. L.,Mann, E. O., and Paulsen, O. (2010).Priming of hippocampal populationbursts by individual perisomatic-targeting interneurons. J. Neurosci.30, 5979–5991.
Empson, R. M., and Heinemann, U.(1995). The perforant path projec-tion to hippocampal area CA1 inthe rat hippocampal-entorhinal cor-tex combined slice. J. Physiol. 484,707–720.
Fernández-Ruiz, A., Makarov, V. A.,Benito, N., and Herreras, O. (2012).Schaffer-specific local field poten-tials reflect discrete excitatory eventsat gamma frequency that may firepostsynaptic hippocampal CA1units. J. Neurosci. 32, 5165–5176.
Foster, D. J., and Wilson, M. A. (2006).Reverse replay of behaviouralsequences in hippocampal placecells during the awake state. Nature440, 680–683.
Freund, T. F., and Buzsáki, G. (1996).Interneurons of the hippocampus.Hippocampus 6, 347–470.
Gabbott, P., Headlam, A., and Busby,S. (2002). Morphological evi-dence that CA1 hippocampalafferents monosynaptically inner-vate PV-containing neurons andNADPH-diaphorase reactive cells inthe medial prefrontal cortex (Areas25/32) of the rat. Brain Res. 946,314–322.
Girardeau, G., Benchenane, K., Wiener,S. I., Buzsáki, G., and Zugaro, M.B. (2009). Selective suppression ofhippocampal ripples impairs spa-tial memory. Nat. Neurosci. 12,1222–1223.
Goodman, D., and Brette, R. (2008).Brian: a simulator for spik-ing neural networks in Python.Front. Neuroinf. 2:5. doi: 10.3389/neuro.11.005.2008.
Gulyás, A. I., Miles, R., Sik, A., Toth,K., Tamamaki, N., and Freund, T.F. (1993). Hippocampal pyrami-dal cells excite inhibitory neuronsthrough a single release site. Nature366, 683–687.
Hahn, T. T. G., McFarland, J. M.,Berberich, S., Sakmann, B., andMehta, M. R. (2012). Spontaneous
Frontiers in Computational Neuroscience www.frontiersin.org February 2013 | Volume 7 | Article 3 | 17
Taxidis et al. A network model of cortico-hippocampal coupling
persistent activity in entorhinal cor-tex modulates cortico-hippocampalinteraction in vivo. Nat. Neurosci.15, 1531–1538.
Hahn, T. T. G., Sakmann, B., andMehta, M. R. (2006). Phase-lockingof hippocampal interneurons’membrane potential to neocorticalup-down states. Nat. Neurosci. 9,1359–1361.
Hahn, T. T. G., Sakmann, B., andMehta, M. R. (2007). Differentialresponses of hippocampal sub-fields to cortical up–down states.Proc. Natl. Acad. Sci. U.S.A. 104,5169–5174.
Halliday, D. M., and Rosenberg, J.R. (1999). “Time and frequencydomain analysis of spike trainand time series data,” in ModernTechniques in Neuroscience Research,eds U. Windhorst and H. Johansson(Berlin: Springer-Verlag), 503–543.
Harris, K. D., Henze, D. A., Csicsvari, J.,Hirase, H., and Buzsáki, G. (2000).Accuracy of tetrode spike sepa-ration as determined by simulta-neous intracellular and extracellu-lar measurements. J. Neurophys. 84,401–414.
Harris, K. D., Hirase, H., Leinekugel,X., Henze, D. A., and Buzsáki,G. (2001). Temporal interactionbetween single spikes and complexspike bursts in hippocampal pyra-midal cells. Neuron 32, 141–149.
Hazan, L., Zugaro, M., and Buzsáki,G. (2006). Klusters, neuroScope,NDManager: a free software suitefor neurophysiological data process-ing and visualization. J. Neurosci.Methods 155, 207–216.
Henze, D. A., Wittner, L., and Buzsáki,G. (2002). Single granule cells reli-ably discharge targets in the hip-pocampal CA3 network in vivo. Nat.Neurosci. 5, 790–795.
Hill, S., and Tononi, G. (2005).Modeling sleep and wakefulnessin the thalamocortical system.J. Neurophys. 93, 1671–1698.
Holcman, D., and Tsodyks, M.(2006). The emergence of up anddown states in cortical networks.PLoS Comput. Biol. 2:e23. doi:10.1371/journal.pcbi.0020023
Isomura, Y., Sirota, A., Özen, S.,Montgomery, S., Mizuseki, K.,Henze, D. A., et al. (2006).Integration and segregation ofactivity in entorhinal-hippocampalsubregions by neocortical slowoscillations. Neuron 52, 871–882.
Jarsky, T., Roxin, A., Kath, W. L., andSpruston, N. (2005). Conditionaldendritic spike propagation follow-ing distal synaptic activation of hip-pocampal CA1 pyramidal neurons.Nat. Neurosci. 8, 1667–1676.
Jonas, P., Major, G., and Sakmann,B. (1993). Quantal components ofunitary EPSCs at the mossy fibersynapse on CA3 pyramidal cells ofrat hippocampus. J. Physiol. 472,615–663.
Klausberger, T., Magill, P. J., Márton,L. F., Roberts, J. D. B., Cobden, P.M., Buzsáki, G., et al. (2003). Brain-state-and cell-type-specific firing ofhippocampal interneurons in vivo.Nature 421, 844–848.
Klausberger, T., and Somogyi, P.(2008). Neuronal diversity andtemporal dynamics: the unity ofhippocampal circuit operations.Science 321, 53–57.
Knowles, W. D., and Schwartzkroin,P. A. (1981). Local circuit synapticinteractions in hippocampal brainslices. J. Neurosci. 1, 318–322.
Lawrence, J. J., Grinspan, Z. M., andMcBain, C. J. (2004). Quantal trans-mission at mossy fiber targets in theCA3 region of the rat hippocampus.J. Physiol. 554, 175–193.
Leão, R. N., Mikulovic, S., Leão, K. E.,Munguba, H., Gezelius, H., Enjin,A., et al. (2012). OLM interneu-rons differentially modulate CA3and entorhinal inputs to hippocam-pal CA1 neurons. Nat. Neurosci. 15,1524–1530.
Lee, A. K., and Wilson, M. A. (2002).Memory of sequential experience inthe hippocampus during slow wavesleep. Neuron 36, 1183–1194.
Li, X. J., Somogyi, P., Ylinen, A., andBuzsáki, G. (1994). The hippocam-pal CA3 network: an in vivo intra-cellular labeling study. J. Comp.Neurol. 339, 181–208.
Lovett-Barron, M., Turi, G. F., Kaifosh,P., Lee, P. H., Bolze, F., Sun, X.,et al. (2012). Regulation of neuronalinput transformations by tunabledendritic inhibition. Nat. Neurosci.15, 423–430.
Maier, N., Nimmrich, V., and Draguhn,A. (2003). Cellular and networkmechanisms underlying sponta-neous sharp wave-ripple complexesin mouse hippocampal slices.J. Physiol. 550, 873–887.
Mehta, M. R. (2007). Cortico-hippocampal interaction duringup-down states and memoryconsolidation. J. Neurosci. 10,13–15.
Miles, R., Traub, R. D., and Wong, R. K.(1988). Spread of synchronous fir-ing in longitudinal slices from theCA3 region of the hippocampus.J. Neurophysiol. 60, 1481–1496.
Mizuseki, K., Diba, K., Pastalkova,E., and Buzsáki, G. (2011).Hippocampal CA1 pyramidal cellsform functionally distinct sublayers.Nat. Neurosci. 14, 1174–1181.
Mizuseki, K., Sirota, A., Pastalkova, E.,and Buzsáki, G. (2009). Theta oscil-lations provide temporal windowsfor local circuit computation inthe entorhinal-hippocampal loop.Neuron 64, 267–280.
Mölle, M., Yeshenko, O., Marshall, L.,Sara, S. J., and Born, J. (2006).Hippocampal sharp wave-rippleslinked to slow oscillations in ratslow-wave sleep. J. Neurophys. 96,62–70.
Mori, M., Abegg, M. H., Gähwiler,B. H., and Gerber, U. (2004). Afrequency-dependent switch frominhibition to excitation in a hip-pocampal unitary circuit. Nature431, 453–456.
Parga, N., and Abbott, L. F. (2007).Network model of spontaneousactivity exhibiting synchronoustransitions between up and downstates. Front. Neurosci. 1:57–66. doi:10.3389/neuro.01.1.1.004.2007
Peyrache, A., Khamassi, M.,Benchenane, K., Wiener, S. I.,and Battaglia, F. P. (2009). Replayof rule-learning related neural pat-terns in the prefrontal cortex duringsleep. Nat. Neurosci. 12, 919–926.
Phillips, K. G., Bartsch, U., McCarthy,A. P., Edgar, D. M., Tricklebank, M.D., Wafford, K. A., et al. (2012).Decoupling of sleep-dependent cor-tical and hippocampal interactionsin a neurodevelopmental model ofschizophrenia. Neuron 76, 526–533.
Pinsky, P. F., and Rinzel, J. (1994).Intrinsic and network rhythmogen-esis in a reduced Traub model forCA3 neurons. J. Comput. Neurosci.1, 39–60.
Otmakhova, N. A., Otmakhov, N.,and Lisman, J. E. (2002). Pathway-specific properties of AMPA andNMDA-mediated transmission inCA1 hippocampal pyramidal cells.J. Neurosci. 22, 1199–1207.
Remondes, M., and Schuman, E. M.(2002). Direct cortical input mod-ulates plasticity and spiking in CA1pyramidal neurons. Nature 416,736–740.
Remondes, M., and Schuman, E. M.(2004). Role for a cortical input tohippocampal area CA1 in the con-solidation of a long-term memory.Nature 431, 699–703.
Royer, S., Zemelman, B. V., Losonczy,A., Kim, J., Chance, F., Magee, J. C.,et al. (2012). Control of timing, rateand bursts of hippocampal placecells by dendritic and somatic inhi-bition. Nat. Neurosci. 15, 769–775.
Sanchez-Vives, M. V., and McCormick,D. A. (2000). Cellular and networkmechanisms of rhythmic recurrentactivity in neocortex. Nat. Neurosci.3, 1027–1034.
Sayer, R. J., Friedlander, M. J., andRedman, S. J. (1990). The timecourse and amplitude of EPSPsevoked at synapses between pairsof CA3/CA1 neurons in the hip-pocampal slice. J. Neurosci. 10,826–836.
Siapas, A. G., and Wilson, M. A. (1998).Coordinated interactions betweenhippocampal ripples and corticalspindles during slow-wave sleep.Neuron 21, 1123–1128.
Sik, A., Tamamaki, N., and Freund, T.F. (1993). Complete axon arboriza-tion of a single CA3 pyramidalcell in the rat hippocampus,and its relationship with postsy-naptic parvalbumin-containinginterneurons. Eur. J. Neurosci. 5,1719–1728.
Sirota, A., Csicsvari, J., Buhl, D., andBuzsáki, G. (2003). Communicationbetween neocortex and hippocam-pus during sleep in rodents.Proc. Natl. Acad. Sci. U.S.A. 100,2065–2069.
Sirota, A., Montgomery, S., Fujisawa,S., Isomura, Y., Zugaro, M., andBuzsáki, G. (2008). Entrainmentof neocortical neurons and gammaoscillations by the hippocampaltheta rhythm. Neuron 60, 683–697.
Skaggs, W. E., and McNaughton, B.L. (1996). Replay of neuronal fir-ing sequences in rat hippocampusduring sleep following spatial expe-rience. Science 271, 1870–1873.
Sorra, K. E., and Harris, K. M. (1993).Occurrence and three-dimensionalstructure of multiple synapsesbetween individual radiatum axonsand their target pyramidal cells inhippocampal area CA1. J. Neurosci.13, 3736–3748.
Steriade, M. (2006). Grouping of brainrhythms in corticothalamic systems.Neuroscience 137, 1087–1106.
Suh, J., Rivest, A. J., Nakashiba, T.,Tominaga, T., and Tonegawa, S.(2011). Entorhinal cortex layer IIIinput to the hippocampus is crucialfor temporal association memory.Science 334, 1415–1420.
Sullivan, D., Csicsvari, J., Mizuseki,K., Montgomery, S., Diba, K., andBuzsáki, G. (2011). Relationshipsbetween hippocampal sharp waves,ripples, and fast gamma oscillation:influence of dentate and entorhi-nal cortical activity. J. Neurosci. 31,8605–8616.
Takahashi, N., Kitamura, K., Matsuo,N., Mayford, M., Kano, M.,Matsuki, N., et al. (2012). Locallysynchronized synaptic inputs.Science 335, 353–356.
Taxidis, J., Coomber, B., Mason, R.,and Owen, M. R. (2010). Assessingcortico-hippocampal functional
Frontiers in Computational Neuroscience www.frontiersin.org February 2013 | Volume 7 | Article 3 | 18

Taxidis et al. A network model of cortico-hippocampal coupling
connectivity under anesthesia andkainic acid using generalized partialdirected coherence. Biol. Cybern.102, 327–340.
Taxidis, J., Coombes, S., Mason, R.,and Owen, M. R. (2012). Modelingsharp wave-ripple complexesthrough a CA3-CA1 networkmodel with chemical synapses.Hippocampus 22, 995–1017.
Timofeev, I., Grenier, F., Bazhenov,M., Sejnowski, T. J., and Steriade,M. (2000). Origin of slow cor-tical oscillations in deafferentedcortical slabs. Cereb. Cortex 10,1185–1199.
Timofeev, I., and Steriade, M. (1996).Low-frequency rhythms in thethalamus of intact-cortex anddecorticated cats. J. Neurophys. 76,4152–4168.
Traub, R. D., Jefferys, J. G., andWhittington, M. A. (1999). FastOscillations in Cortical Circuits.Cambridge, MA: The MITPress.
Traub, R. D., and Miles, R. (1991).Neuronal Networks of theHippocampus. New York, NY:Cambridge University Press.
Wang, X. J., and Buzsáki, G. (1996).Gamma oscillation by synaptic inhi-bition in a hippocampal interneu-ronal network model. J. Neurosci.16, 6402–6413.
Wolansky, T., Clement, E. A., Peters,S. R., Palczak, M. A., and Dickson,C. T. (2006). Hippocampal slowoscillation: a novel EEG state andits coordination with ongoing neo-cortical activity. J. Neurosci. 26,6213–6229.
Yamamoto, C. D., Higashima, M., andSawada, S. (1987). Quantal analy-sis of potentiating action of phor-bolester on synaptic transmission inthe hippocampus. Neurosci. Res. 5,28–38.
Ylinen, A., Bragin, A., Nadasdy, Z.,Jando, G., Szabo, I., Sik, A., et al.(1995). Sharp wave-associatedhigh-frequency oscillation (200 Hz)in the intact hippocampus: networkand intracellular mechanisms.J. Neurosci. 15, 30–46.
Conflict of Interest Statement: Theauthors declare that the researchwas conducted in the absence of anycommercial or financial relationshipsthat could be construed as a potentialconflict of interest.
Received: 28 November 2012; accepted:21 January 2013; published online: 05February 2013.Citation: Taxidis J, Mizuseki K, MasonR and Owen MR (2013) Influence ofslow oscillation on hippocampal activityand ripples through cortico-hippocampalsynaptic interactions, analyzed by acortical-CA3-CA1 network model.Front. Comput. Neurosci. 7:3. doi:10.3389/fncom.2013.00003Copyright © 2013 Taxidis, Mizuseki,Mason and Owen. This is an open-access article distributed under the termsof the Creative Commons AttributionLicense, which permits use, distributionand reproduction in other forums, pro-vided the original authors and sourceare credited and subject to any copy-right notices concerning any third-partygraphics etc.
Frontiers in Computational Neuroscience www.frontiersin.org February 2013 | Volume 7 | Article 3 | 19