
Influence of SiO2 Fillers on Sliding Wear Resistance and...
18
Journal of Minerals & Materials Characterization & Engineering , Vol. 8, No.7, pp 513-530, 2009 jmmce.org Printed in the USA. All rights reserved 513 Influence of SiO 2 Fillers on Sliding Wear Resistance and Mechanical Properties of Compression Moulded Glass Epoxy Composites B. Shivamurthy a , Siddaramaiah b and M.S. Prabhuswamy c a. Department of Mechanical Engineering , K.V.G. College of Engineering, Kurunjibag, Sullia-574237, D.K. Karnataka, India. b Department of Polymer Science and Technology, and c Department of Mechanical Engineering, Sri Jayachamarajendra College of Engineering, Mysore – 570 006, India *Corresponding Author: [email protected] ABSTRACT The E-glass woven fabric-epoxy (LY 556) (GE) composites have been fabricated with varying amounts of silicon oxide (SiO 2 ) particulate filler viz., 3, 6 and 9 wt % by compression molding followed by hot curing. The fabricated composites were characterized by mechanical properties such as tensile behaviour, flexural behaviour and interlaminar shear strength (ILSS). The effect of silica content on the sliding wear properties such as wear loss, specific wear rate and coefficient of friction of GE composites have been investigated at velocity of 5m/s and constant abrading distance of 1200 m with different loads viz., 30N, 60N and 90N by using pin-on-disc machine. Wear out surface of all the composites were studied using scanning electron microscopy (SEM). 1. INTRODUCTION Polymer based materials are finding increasing use in many applications owing to their strength, lightness, ease of processing and availability of wider choice of systems [1]. One of the areas where their use has been found to be particularly advantageous is the situation involving contact wear. Due to the low coefficient of friction and also the ability to maintain loads, some specific grades of polymer are used in place of the traditional metal based materials in recent times [2,3]. It is therefore, imperative to give greater thrust to the examination of this aspect through increased research activities in the materials. One such possible method to widen the approach is to adopt fillers/whiskers into the polymeric matrix systems. A second method would be to resort
Transcript of Influence of SiO2 Fillers on Sliding Wear Resistance and...

Journal of Minerals & Materials Characterization & Engineering, Vol. 8, No.7, pp 513-530, 2009 jmmce.org Printed in the USA. All rights reserved
513
Influence of SiO2 Fillers on Sliding Wear Resistance and Mechanical Properties of Compression Moulded Glass Epoxy Composites
B. Shivamurthya, Siddaramaiahb and M.S. Prabhuswamyc
a.Department of Mechanical Engineering , K.V.G. College of Engineering, Kurunjibag, Sullia-574237, D.K. Karnataka, India.
bDepartment of Polymer Science and Technology, and cDepartment of Mechanical Engineering,
Sri Jayachamarajendra College of Engineering, Mysore – 570 006, India
*Corresponding Author: [email protected]
ABSTRACT The E-glass woven fabric-epoxy (LY 556) (GE) composites have been fabricated with varying amounts of silicon oxide (SiO2) particulate filler viz., 3, 6 and 9 wt % by compression molding followed by hot curing. The fabricated composites were characterized by mechanical properties such as tensile behaviour, flexural behaviour and interlaminar shear strength (ILSS). The effect of silica content on the sliding wear properties such as wear loss, specific wear rate and coefficient of friction of GE composites have been investigated at velocity of 5m/s and constant abrading distance of 1200 m with different loads viz., 30N, 60N and 90N by using pin-on-disc machine. Wear out surface of all the composites were studied using scanning electron microscopy (SEM).
1. INTRODUCTION Polymer based materials are finding increasing use in many applications owing to their strength, lightness, ease of processing and availability of wider choice of systems [1]. One of the areas where their use has been found to be particularly advantageous is the situation involving contact wear. Due to the low coefficient of friction and also the ability to maintain loads, some specific grades of polymer are used in place of the traditional metal based materials in recent times [2,3]. It is therefore, imperative to give greater thrust to the examination of this aspect through increased research activities in the materials. One such possible method to widen the approach is to adopt fillers/whiskers into the polymeric matrix systems. A second method would be to resort

514 B. Shivamurthy, Siddaramaiah and M.S. Prabhuswamy Vol.8, No.7
to the use of continuous fibrous/woven cloth/and high performance fiber cloths like carbon, aramid and basalt in many forms as reinforcement and study its response to wear and friction. In view of above two methods, many researchers have studied with various shapes, sizes, types and compositions of fibers and fillers in many numbers of matrices [4–16]. However, the woven fabric composites are getting acceptance in many engineering applications such as in circuit board, marine, aerospace, transportation and other industries for several reasons. They are commonly used in industry to manufacture composite components due to their ease of use, improve structural performance and reduction in cost. They provide better resistance to impact than unidirectional composites and display behavior that is closer to that of a fully isotropic material [12-14]. Modification of woven fabric reinforced composites by incorporation of fillers has been a popular research activity in the plastics industry since the properties of resultant materials may be significantly changed by the introduction of fillers and fabrics [15]. Suresha et al [24] investigated the friction and wear behavior of glass-epoxy composite with and without graphite. They fabricated neat glass-epoxy composite and graphite filled glass-epoxy composite with three different percentages of filler. They concluded the graphite filled glass-epoxy composite shows higher resistance to slide wear as compared to plain glass-epoxy composites. Gewen et al [28] investigated the mechanical and tribological properties of phenolic resin- based friction composite filled with several inorganic fillers. They observed the petroleum coke increases the bending strength and hardness in phenolic resin based friction composites. The talcum powder (TP) and hexagonal boron nitride were used as friction modifier, increases the wear resistance of the phenolic resin based composites with in the volume fraction 5-10% and 5-15% respectively. Further increase in volume fraction of friction modifier decreases the bending strength and harmful to the wear resistance. Bulent et al [31] studied hybrid friction materials made up of basalt fiber and ceramic fiber. They kept ceramic fiber content constant at 10% volume and varied basalt fiber from 0 to 40% and they observed the coefficient of friction increased with increasing fiber content. The specific wear rate decreases with increase in total fiber content up to 30% by volume, further increase in fiber volume increase the specific wear. Increasing sliding speed and disc temperature resulted in increase in wear rate and size of the wear debris at higher load. Zhang et al [36] investigated the mechanical properties and wear properties of silicon carbide (SiC) and alumina (Al2O3) whisker- reinforced epoxy composites. Silicon carbide and alumina whiskers can significantly improves the flexural modulus and wear resistance of the epoxy composites. Various researchers [16-35] have reported that the wear resistance of polymers is improved by the addition of fillers such as mica, talc, calcium carbonate, kaolin, wallastonite, feldspar, graphite, MoS2, CuO, CuS, Al2O3 etc. Though literature survey cited above reveals that, there is an ample scope to understand and establish the wear mechanism of glass woven fabric reinforced particulate filler filled epoxy composites. In this research article authors reported the sliding wear behavior of silicon dioxide (SiO2) particulate filler loaded glass fabric-epoxy composites subjected to three different loads

Vol.8, No.7 Influence of SiO2 Fillers on Sliding Wear Resistance and Mechanical Properties 515
with constant velocity and abrading distance. The wear loss, specific wear rate and coefficient of friction have been measured and compared with the unfilled glass- epoxy composite. Also, the effects of SiO2 filler content on mechanical properties of the composites have been studied. 2. EXPERIMENTAL 2.1. Materials In this investigation, composites were fabricated using bidirectional plain-woven E-glass fabrics (density of 200 g/m2) as reinforcement. Epoxy resin LY556, hardener HT907 and accelerator DY062 supplied by M/s. Huntsman Polymers, Germany used as matrix material. 30µ size silicon oxide (SiO2) particles obtained by M/s. Jyothi chemicals, India, were used as filler. The matrix was prepared by mixing epoxy resin, LY 556 and hardener HT 907 in the ratio 100:80 by volume at 600C. Silicon oxide fillers are dried in controlled temperature of 130 0C for about 4 hrs before incorporation into epoxy. The calculated amount of SiO2 is incorporated to the epoxy mixture with constant stirring followed by 2 % by weight of accelerator DY06. The composite of 300 mm x 300 mm x 3mm were fabricated by compression moulding method. The resin was coated on 16 layer of E-glass fabric using brush and roller and it was kept in between the pressing plates of 350 mm x 350 mm size. A layer of polyester film was provided in between the plate and composite surface for easy release and to obtain smooth and uniform surface on the composites. Resin impregnated stock of 16 layers of fabrics was pressed in H-type hydraulic press (capacity 40T) under pressure of 0.5 MPa and temperature 140oC for about 2 hr. The composition of fabricated composites is given in Table 1.
Table 1. Formulation of fabricated SiO2 filled glass –epoxy composites. Composite
Code
Content of SiO2 filler (Wt. %)
Resin content(Wt. %)
Content of E-glass cloth (Wt. %)
GE 0 50 50 3SGE 3 47 50 6SGE 6 44 50 9SGE 9 41 50
2.2. Techniques The fabricated composites have been characterized by physico-mechanical and tribological behaviours Density of composites was measured according to ASTM D 792 – 86 (displacement method) using Mettler electronic balance with an accuracy of ± 0.0001g/cc. Surface hardness of

516 B. Shivamurthy, Siddaramaiah and M.S. Prabhuswamy Vol.8, No.7
composite was investigated as per ASTM D 785 on Rockwell hardness testing machine for 10kg minor load and 140kg major load. Tensile behaviours as per ASTM- D 638 were investigated by using Loyds LR 100K, Universal tensile testing machine. A three point bending technique was adopted for flexural test as per ASTM-D790 standard for all composites. The impact strength was determined using izod impact tester pendulum type (PSI make, India) as per ASTM-D256 specification. The interlaminar shear strength (ILSS) was investigated according to ASTM D2344-76 (short beam shear test method). In each case to evaluate the physico-mechanical properties, five samples were tested and the average valve reported. Sliding wear frictional properties of the composites were investigated by pin-on-disc machine according to ASTM D G 99. In this investigation pin was pressed against a rotating disc such that the contact surface of the pin is flat. The cured composite laminates were cut using a diamond tipped cutter to yield wear test coupons of size 8mm dia. The test samples were then glued using an adhesive to pins of size 8mm diameter and 25 mm length. Sliding wear test was carried out at constant velocity (5 m/s) and for constant sliding distance (1.2 km) at various normal applied loads viz., 30N, 60N and 90N.
3. RESULTS AND DISCUSSION 3.1. Mechanical Properties 3.1.1. Density The density of SiO2 filled GE composites lies in the range 2.1369 to 2.2530 g/cc which is slightly higher than unfilled GE composite density (2.1164 g/cc). This is due to increase in high dense SiO2 filler content in GE composites. 3.1.2. Surface hardness In this investigation, slight increase in surface hardness (72HRB-GEC composite to78HRB-9SGEC composite) due to the addtion of SiO2 fillers in the composites is observed.
3.1.3. Tensile properties In this investigation, tensile strength, young’s modulus and percentage of elongation at fracture of SiO2 loaded GE composites of five samples in each type are tested and average results were plotted is as shown in Figure 1(a)-(d). Figure 1(a) shows the tensile load versus elongation behavior of SiO2 filled and unfilled GE composites. It is observed that, the 3SGE, 6SGE and 9SGE specimens exhibits higher young’s modulus, lower percentage of elongation and lower tensile strength compared to GE specimens. As the filler content increases in the GE composites,
Vol.8, No.7 Influence of SiO2 Fillers on Sliding Wear Resistance and Mechanical Properties 517
the Young’s modulus increases and decreases the tensile strength and elongation. The unfilled GE composite exhibits highest tensile strength (322 Mpa), lowest young modulus (6708 Mpa), further due to addition of fillers at 3,6 and 9 wt % reduces the tensile strength to 280, 273 and 237 Mpa and increases the young’s modulus to 7865,8639 and 9713 Mpa respectively. The elongation reduces from unfilled GE composites of 4.8% to 2.44% of 9 wt % SiO2 filled GE composite. This indicates that the composites property changes from ductile to tough and rigid, due to addition of SiO2 particles in glass epoxy composite. The toughness and rigidness of the composite increased with increase in content of SiO2 particles in the composite. Also the 9SGE specimen exhibits lowest tensile strength compared to other specimens may be due to agglomeration of fillers in the resin at higher percentage of fillers. 3.1.4. Flexural properties Due to the of addition of SiO2 particles in GE composites flexural strength increase, unfilled GE composites exhibits lowest flexural strength of 365 Mpa, 3 wt% and 6 wt% SiO2 particles filled GE composites exhibits highest flexural strength 401 and 406 Mpa. Further increase in addition of filler reduces the flexural strength to 387 Mpa (9wt% of filler content composite). However, addition of filler content in glass epoxy composite increases the flexural strength. 3.1.5. Interlaminar shear strength Observed from the short beam technique, the interlaminar shear strength (ILSS) of SiO2 particles filled GE composites higher than unfilled GE composite. ILSS increases from 9.8 Mpa of unfilled GE composite to 11 Mpa of 6 wt % SiO2 particles filled GE composite. Further increase in content of SiO2 particles in GE composites decreases the ILSS 3.1.6. Impact strength By the result of izod impact test, it was observed that the energy obsorbed by the composite decreases from 0.1633 J/mm in unfilled GE composite to 0.08J/mm in 9 wt% SiO2 filled GE composite is shown in Figure 1(f). In fact it was verified experimentally by several research groups all over the world, that micro particle of metallic or inorganic type prove the ability to reinforce effectively thermoplastic and also thermosetting polymer matrices and improves the mechanical properties. But the improvement depends on filler volume content. The quality of the interface in composites, i.e. the static adhesion strength as well as the interfacial stiffness, usually plays a very important role in the materials capability to transfer stresses and elastic deformation from the matrix to the filler. If filler interaction is poor, the particles are unable to carry any part of the external load, in that case the strength of the composite lower. If the bonding between the fillers and matrix is

518 B. Shivamurthy, Siddaramaiah and M.S. Prabhuswamy Vol.8, No.7
instead strong enough, the effective load and deformation transfer takes place between the matrix and filler improves the strength. But another important fact that, the bonding between fillers and matrix more related to dispersion state of the particles in the matrix phase.
Figure1. Plots of mechanical properties of SiO2 filler filled and unfilled GE composites (a) tensile load versus elongation, (b) tensile strength, (c) young’s modulus, (d) elongation at break, (e) flexural strenght and (f) impact strength.
a
b
c d
e f

Vol.8, No.7 Influence of SiO2 Fillers on Sliding Wear Resistance and Mechanical Properties 519
In the present investigation at 3 wt% and 6wt% of filler loaded GE composites exhibits higher flexural and ILSS and higher young’s modulus compared to unfilled GE composites. Further increase in filler content (as in the case of 9 wt% filler loaded composite) reduces the flexural and ILS Strength. This is due to the poor matrix and filler interface which was due to agglomeration of SiO2 particles at higher percentage of loading. This agglomerate would remain in the matrix and stress concentration locally and easily induce the initiation of the final failure. By the result of izod impact test, it was observed that the impact strength decreases with increased addition of fillers in GE composites. This is due to embrittling effects occur at higher filler contents, where more agglomerates are likely to be found. Higher impact strength at lower filler contents on the other hand justifies lower stress concentrations. As toughened epoxy resin matrics classified as brittle materials, addition of SiO2 fillers dominates the brittleproperty in the GE composite but also increases the toughness of the composite which is exibits in the tensile test results. The correlation of flexural strength with tensile strength of woven fabric glass epoxy composite was investigated by many researchers. Whitney [36] developed an eqvation σuf = 1.52σut for glass epoxy composite and σuf = 1.33σut for carbon epoxy composite. This equation was verified by Bullock [37] and Whitney et al [38] by experiment results and proved the same. In present investigation, the results obtained by tensile and flexural strength proves the above relations verymuch better in SiO2 particulate filled GE compsoites than unfilled GE composites. 3.2. Sliding Wear Studies 3.2.1. Sliding wear loss
Figure 2 shows the wear loss of unfilled GE and SiO2 particulate filled GE composites for different loads of 30N, 60N and 90N. It is evident from the figure2 that irrespective of the type of sample used; there is an increase in wear loss with increase of normal applied load. The unfilled GE composite exhibited considerably higher wear loss of 0.0095g than SiO2 particle filled glass epoxy composites. By increasing the load from 30 to 90N, the wear loss of unfilled GE composite has increased from 0.0015g to 0.0095g, which is higher as compared to 3SGEC which has wear loss increased from 0.0011g to 0.0066g at same range of applied load. The highest wear loss of 0.0076g and 0.0089g is seen in 9SGE at loads of 30N and 60N. But the wear loss in unfilled glass epoxy composite is seen lowest at lower loads and highest at higher loads compared to other type of composite. This indicates that unfilled GE composite wear loss is more sensitive with respect to normal applied load. Whereas, in case of SiO2 particle filled glass epoxy composites particularly 6SGE and 9SGE composites, the wear loss is less load dependent compared to 3SGE composite and unfilled glass epoxy composite. This indicates the higher percentage fillers in the composite helps in increasing the wear resistance at higher loads.

520 B. Shivamurthy, Siddaramaiah and M.S. Prabhuswamy Vol.8, No.7
However, as per the results plotted in the Figure 2, the 3SGE composite shows better wear resistance at 30N and 60N loads compared to all other types of composites and 6SGE composite exhibits better wear performance at higher load. But it is also is observed from the experimentation, that severe wear takes place due to catastrophic fracture and dislodging of SiO2
particles from the upper surface of the composite specimen as soon as composite specimen pin come in contact with the wear disc at lower loads. The wear loss effect due to this phenomenon increases with increase in content of fillers. But high filler content composite exhibits steady wear loss after reaching a steady wear situation as shown in Figure 2. Higher wear loss is observed in 9SGE composite due to weak in matrix reinforcement and filler interaction. This result is supported by decreased flexural strength, tensile strength and impact strength.
Figure 2. Plot of wear loss versus normal load of unfilled and SiO2 particulate filled composites.
3.2.2. Specific wear rate The result of specific wear rate of unfilled GE and SiO2 filled composites for an abrading distance of 1.2 km at different loads (30N, 60N and 90N) with a constant sliding velocity 5m/s is as shown in Figure 3 and values are tabulated in Table 2. It is observed that the specific wear rate decreases with increase in applied normal load in case of 6SGE and 9SGE composites and increases with increase in applied load in case of unfilled GE composite and 3SGE composite. The 3SGE composite shows lowest specific wear rate than other composite at 30 and 60N load. The 6SGE composite shows lowest specific wear rate at higher load. Due to addition of SiO2
filler in the composite, low specific wear rate exhibits at higher loads in case of 3SGE and 6SGE composite. But in case of 9SGEC, due addition of more filler leads to agglomeration, this reduces matrix and reinforcement filler interaction due to less adhesion. Unfilled GE composite exhibits the highest specific wear rate of 4.1x10⁻⁸ g/N-m, 7.98 x10⁻⁸ g/N-m and 8.75x10⁻⁸ g/N-m at applied normal loads of 30N, 60N and 90N respectively. The lowest specific wear rate is observed as 3.0x10⁻⁸ g/N-m, 4.70 x10⁻⁸ g/N-m and 6.1x10⁻⁸ g/N-m at

Vol.8, No.7 Influence of SiO2 Fillers on Sliding Wear Resistance and Mechanical Properties 521
applied normal loads 30N, 60N and 90N respectively. In the case of 6SGcomposites it exhibits specific wear rate of 9.10 x10⁻⁸ g/N-m and 2.11 x10⁻⁷ g/N-m at loads 30N, 60N respectively and for 9SGE it exhibits 5.00 x10⁻⁸ g/N-m and 1.11 x10⁻⁷ g/N-m at applied normal loads 30N, 60N respectively, which is more than specific wear rates of GE composite and more than 3SGE composites at the same range of load. Hence, at 30 to 60N 3SGE composite shows better result. From this it is evident that the wear resistance of glass epoxy composite increases with increase in filler content up to 3wt%. 3wt% till 6 wt% reduces the wear resistance and increases the specific wear rate slightly. Further increase in filler content beyond 6wt% reduces the wear resistance and increases the specific wear rate significantly. This is attributed to the fact that, in 3wt % filled glass epoxy composite, the dispersion of filler is uniform and better adhesion between the matrix and filler and reinforcement. Where as due to higher content of filler in 6SGE and 9SGE composites, may be poor adhesion results higher wear rate. Also it is observed that in unfilled GE composites and 3SGE composites, specific wear increases with increase in load where as the specific wear rate in both 6SGE and 9SGE composites exhibits decrease in wear rate with increase in load. This indicates a steady wear loss is observed at higher percent of filler loaded composite compared to unfilled and low percent filler loaded composites. This is very much important in selecting and designing long life of component with tolerable wear limit. Table 2. Specific wear rate (g / N-m) and (σe)-1 factor of unfilled and SiO2 particles filled glass
epoxy composites. Load Type of composite
GEC 3SGEC 6SGEC 9SGEC 30N 4.1E-08 3.00E-08 9.10E-08 2.11E-07 60N 7.9E-08 4.70E-08 5.00E-08 1.11E-07 90N 8.7E-08 6.10E-08 4.00E-08 8.20E-08 (σe)-1 0.0647 0.1003 0.1159 0.1729
Figure 3. Plot of Specific wear rate versus type of composites
522 B. Shivamurthy, Siddaramaiah and M.S. Prabhuswamy Vol.8, No.7
Many researcher developed different models to analyze the wear of polymer composite materials. Viswanath et al [39] developed an empirical equation for the wear of polymers, in that wear equation, the volume loss of polymer material while sliding on a pin-on-disc machine is expressed in terms of the operating conditions, material properties and counter surface roughness. Both linear and non linear relationships of volume loss with other variables are considered in evaluating dimensionless wear coefficient. The correlations of wear loss with selected mechanical properties such as (σe) factor (where, σ is the ultimate tensile strength and e is the ultimate elongation), hardness (H) have been reported in single-pass studies of polymer composites [40, 41]. Lancaster [47] stated that the product of σ and e is a very important factor which controls the abrasive wear behavior of composite. Generally fibers / filler reinforcement increases the tensile strength (σ) of neat polymer, they decrease the ultimate elongation (e) and hence the product (σ e) may become smaller than that of neat polymer. Hence, reinforcement usually leads deterioration in the abrasive wear resistance. The model proposed by Ratner et al. [41] states that rate of material removal is inversely proportional to the product of stress and strain at rupture. Poomali et al [42] conducted studies on mechanical and wear behavior of PMMA/TPU blends. In there work neat PMMA and 95/5 PMMA/TPU blend wear volume loss decreased with increase in σe factor. But increase of TPU grater than 5% in PMMA showed increase in the wear volume loss even though the factor σe is increasing. Suresh et al [43] carried out wear study to determine the effect of glass fiber content on wear behavior of polyurethane composite. The relation between specific wear rate and (σe)-1 was studied, no linear trend was observed. In the present work, specific wear rate decreases with increase of (σe)-1valve up to 3wt% of filler content. Further increase of filler content > 6wt%, the specific wear rate increases with increase in (σe)-1 value of the composite and it fallows the Ratner statement [41]. Hence it is clear from the above discussion that 3wt% filler content gives better wear resistance because of optimum mechanical property (highest modulus and lowest (σe)-1 factor compared to other composites) of the composites. This is achieved by the good interface between filler and matrix. 3.3. Coefficient of Friction Coefficient of friction decreases with increase in load in all types of SiO2 particulate filled GE composites and unfilled GE composites as shown in Figure 4 and Table 4. The 3 wt% SiO2
particulate filled GE composite exhibits highest coefficient of friction and 6 wt% SiO2 particulate filled GE composite exhibits very low coefficient of friction for all loads. More fluctuation of coefficient of friction is observed for the same loads in SiO2 particulate filled composite due to

Vol.8, No.7 Influence of SiO2 Fillers on Sliding Wear Resistance and Mechanical Properties 523
dislodging of SiO2 particle from the specimen surface and traps in between specimen and abrading metal counter plate surface.
Table 4. Coefficient of friction of unfilled and SiO2 particles filled glass epoxy composites.
Load Type of composite
GEC 3SGEC 6SGEC 9SGEC 30N 0.456 0.528 0.422 0.484 60N 0.397 0.51 0.404 0.413 90N 0.317 0.4 0.317 0.366
Figure 4. Plot of coefficient of friction at different loads of unfilled and SiO2 particulate filled composites SEM photomicrographs of unfilled GE composite worn surface at 30N, 60N and 90N (at a constant sliding velocity 5m/s and constant sliding distance of 1200m) is as shown in Figure 5 (a), (b) and (c) respectively. From these photomicrographs it is observed that at 30N load matrix wear is more predominant than fiber in the composite. Also it was observed the matrix and fiber wear in the composite at load 60N as shown in Figure 5(b). Further increased in load to 90N, severe damages to the fibers and matrix observed (Figure 5(c)). Surface morphology

524 B. Shivamurthy, Siddaramaiah and M.S. Prabhuswamy Vol.8, No.7
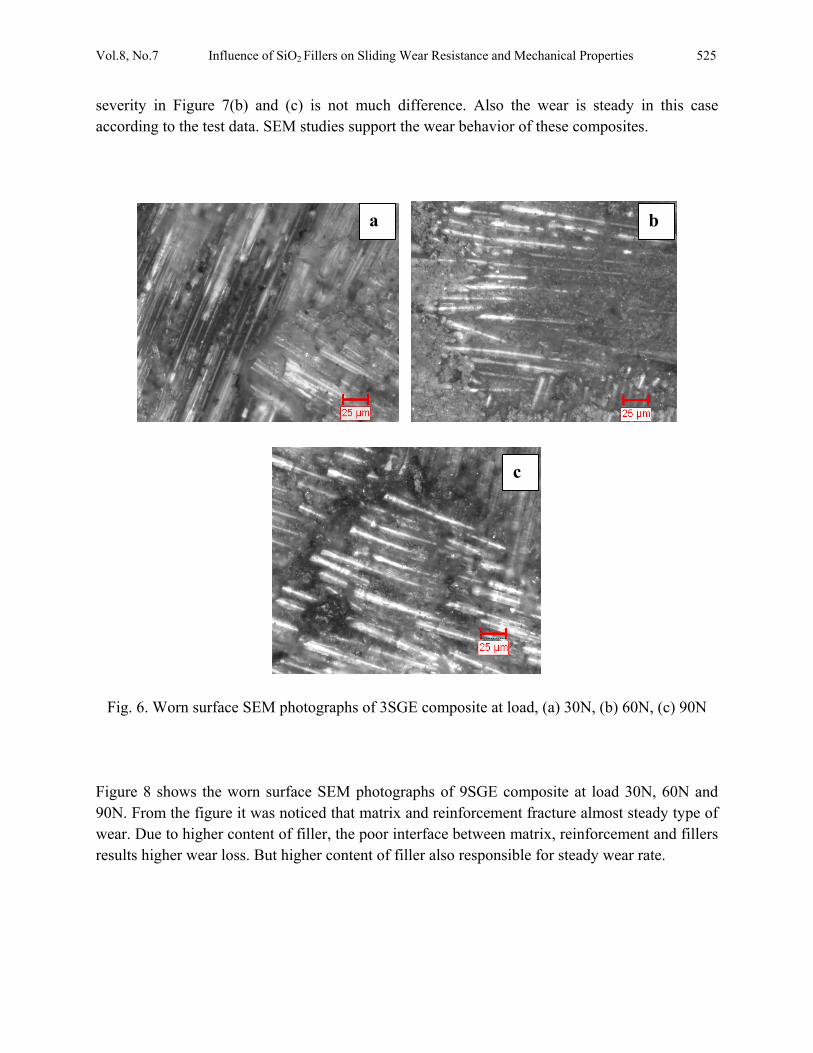
Figure 6 shows the SEM photomicrographs of worn surface of 3wt % SiO2 particulate filled GE composite. At 30N load only the part of matrix removed and no fiber damage is observed and fiber also not visible due to hidden in the matrix (represented in Figure (a)) and fillers. At 60N load a portion of fibers observed and not in full, due to wear, the interface bonded matrix removed from the fibers. But at 90N load observed more number of fibers in the photomicrograph and damaged fibers which are representing like discontinued lines as presented in Figure 6(c). Also interface matrix detached from the fiber surface observed in case of applied load 90N.
Figure 5. Worn surface SEM photographs of unfilled GE composite at load; (a) 30N, (b) 60N and (c) 90N
Worn surface SEM photographs of 6SGE composite at load 30N, 60N and at 90N are as shown in Figure 7 (a), (b) and (c) respectively. At 30N load only the portion of matrix removed and no fiber damage is observed, at higher loads (> 60N) fiber damage observed but the surface damage
a b
c
Vol.8, No.7 Influence of SiO2 Fillers on Sliding Wear Resistance and Mechanical Properties 525
severity in Figure 7(b) and (c) is not much difference. Also the wear is steady in this case according to the test data. SEM studies support the wear behavior of these composites.
Fig. 6. Worn surface SEM photographs of 3SGE composite at load, (a) 30N, (b) 60N, (c) 90N
Figure 8 shows the worn surface SEM photographs of 9SGE composite at load 30N, 60N and 90N. From the figure it was noticed that matrix and reinforcement fracture almost steady type of wear. Due to higher content of filler, the poor interface between matrix, reinforcement and fillers results higher wear loss. But higher content of filler also responsible for steady wear rate.
a b
c

526 B. Shivamurthy, Siddaramaiah and M.S. Prabhuswamy Vol.8, No.7
Figure 7. Worn surface SEM photomicrographs of 6SGE composite at load; (a) 30N, (b) 60N, and (c) 90N
4. CONCLUSIONS The following are the salient observation made from the above investigation
Increase in filler content in the GE composite enhances the young’s modulus, flexural strength, surface hardness, brittleness and decreases the tensile strength and elongation at break.
SiO2 particulate filled GE composites tensile strength and flexural strength follows very near the relation σuf = 1.52σut when compared to unfilled GE composites.
The interlaminar shear strength improved after incorporation of fillers, 6 wt% SiO2 filler content GE composites exhibits maximum inter laminar shear strength (11 Mpa).
Unfilled GE composite and 3wt% SiO2 particulate filled GE composite sliding wear loss and specific wear rate strongly influenced by the applied load as compared to other GE composites.
a b
c

Vol.8, No.7 Influence of SiO2 Fillers on Sliding Wear Resistance and Mechanical Properties 527
The 3 and 6 wt% of SiO2 particulate filled GE composites exhibits good performance in flexural and sliding wear resistance. Further increase in filler loading was not beneficial to flexural and sliding wear performance.
The 6 and 9 wt % of SiO2 particulate filled composite exhibits steady wear rate.
Figure 8. Worn surface SEM photographs of 9SGE composite at load; (a) 30N, (b) 60N and (c)
90N
REFERENCES
1. ASM Handbook, 1992, Vol.8, ASM International, Materials Park, Qhio, USA. 2. S.K.Sinha and S.K.Biswas, Effect of sliding speed on friction and wear of uni-directional
aramid fibre-phenolic resin composite, J. Matls. Sci., 30 (1995) 2430.
a b
c

528 B. Shivamurthy, Siddaramaiah and M.S. Prabhuswamy Vol.8, No.7
3. A.VardaRajuu,S.V.SanjeevKumar,G.BabuRao,.G.M.Shashidhara,H.Jiasongand Z.Jun,J.of Reinforced plastics and Comp.,21(200)1591
4. J.Bijwe,U.S.Tewari and P.Vasudevan,Wear studies of short glass fiber reinforced polyetherimide composites, Wear, 132 (1989) 247.
5. B.S.Tripaty and M.J.Furey, Tribological behavior of unidirectional graphite-epoxy and carbon-PEEK composites, Wear, 162–164 (1993) 385.
6. H.Pihtili and N.Tosun, Effect of load and speed on the wear behavior of woven glass fabrics and aramid fibre-reinforced composites, Wear, 252 (2002) 979-984.
7. W.J. Bartz, X.Jinfen and B.Viswanth, Wear behavior and failure mechanism of bonded solid lubricants, Wear, 150 (1991) 231-246.
8. K.Friedrich, Friction and wear of polymer composites, Elsevier: Amsterdam, 1986. 9. M.Cirino, K.Friedrich and R.B. Pipes, The effect of fiber orientation on the abrasive wear
behavior of polymer composite materials, Wear, 121 (1988) 127-141. 10. N.H.Sung, N.P. Suh, Effect of fiber orientation on friction and wear of fiber reinforced
polymeric composites, Wear, 53 (1979) 129-141. 11. K.Tanaka, Y.Uchyama, Int. Proceed.of the JSLE-ASLE Intl. Lubrication Conf.;
T.Sakurai, Ed.; Elsevier Science Publisher: Tokyo, Japan, 1975. 12. J.L.Abot, A.Yasmin, A.J.Jacobsen and I.M.Daniel, In-plane mechanical, thermal and
viscoelastic properties of a satin fabric carbon/epoxy composite, Comp. Sci. & Tech., 64 (2004) 263-268.
13. R.Park and J.Jang, Comp. Sci. and Tech., 58 (10), (1998) 1621-1628. 14. J. Bijwe, Rekha Rattan, Influence of weave of carbon fabric in polyetherimide
composites in various wear situations. Wear, 263(2007)984–991. 15. W.I. J. Zaini, M.Y.A. Fuad, Ismail, M.S. Mansor, and J. Mustafah. The effect of filler
content and size on the mechanical properties of polypropylene/Oil palm wood flour composites. Polym. Intl., 40 (1996) 51-55.
16. K.Friedrich, Micro structural efficiency and fracture toughness of short fiber/thermoplastic matrix composites, Composites Sci. and Tech.., 22 (1985) 43-74.
17. V.K.Srivastava, and J.P.Pathak, Friction and wear properties of bushising bearing of graphite filled short glass fiber composites in dry sliding, Wear, 197 (1-2) (1996) 145-150.
18. V.K. Srivastava, J.P.Pathak and K.Tahzibi, Wear and friction characteristics of mica filled fibre reinforced epoxy composites, Wear, 152 (2), (1992) 343-350.
19. Kishore, P.Sampathkumaran, S.Seetharamu, Vyantheya, S.Murali and R.K. Kumar, SEM observations of the effect of velocity and load on the slide wear characteristics glass-fabric- epoxy composites with different fillers, Wear, 237 (1), (2000) 20-27.
20. S.Bahadur, D.Gong and J.W.Anderegg, The Role of copper composite as fillers in the transfer film formation and wear of nylon, Wear, 154 (2) (1992) 207-223.
21. N.G.Hung, N.Chand, Structure and wear characteristics of graphite /UHMWPE composite, J. Res. Ind., 40 (1995) 297-302.

Vol.8, No.7 Influence of SiO2 Fillers on Sliding Wear Resistance and Mechanical Properties 529
22. L.Rey, N.Poisson, A.Maazouz and H.Sautereau, Enhancement of crack propagation resistance in epoxy resin by introducing poly dimethyl siloxane particle, J. Mat. Sci., 34 (1999) 1775-1781.
23. Dipa Ray and R. Gnanamoorthy, Friction and wear behavior of vinylester resin matrix composites filled with fly ash particles, J. Reinforced Plastics and Comp., 26 (2007) 5.
24. B.Suresha, G.Chandramohan, P.Sampathkumaran and S.Sethuramu, Investigation of the friction and wear behavior of glass-epoxy composite with and without graphite filler, J. Reinforced Plastics and Comp., 26 (2007) 81.
25. N.Dayanda jawali, B.Siddeswarappa and Siddaramaiah, Physico-mechanical properties, machinability and morphological behavior of short glass fibre- reinforced nylon 6 composites, J. Reinforced Plastics and Comp., 25(2006) 1409.
26. B.Suresh, S.Kshama, A.V.Vidhya and Siddaramaiah, Investigation of tribological behavior of carbon- epoxy composite system, Natl. Conf. on Recent Trends in Mechanical Engineering, held at SJCE Mysore, (2006).
27. A.Mandal, M.Chakraborty and B.S.Murthy, Effect of TiB2 particles on sliding wear behavior of Al-4Cu alloy, Wear, 262(2007)60-166.
28. Gewen Yi and Fengyuan Yan .Mechanical and tribological properties of phenolic resin- based friction composite filled with several inorganic fillers.Wear, 262(2007)121-129.
29. Jayashree bijwe , J. Indumathi and A. K. Ghosh, Evaluation of engineering polymeric composites for abrasive wear performance, J. of Reinforced Plastics and Comp., 18(1999)1573.
30. Navinchand, U. K. Dwivedi and M. K. Sharma, Development and tribological behavior of UHMWPE filled epoxy gradient composites, Wear, 262(2007)184-190.
31. BulentOzturk, Fazh Arslan and Sultan Ozturk, Hot wear properties of ceramic and basalt fiber reinforced hybrid friction materials, Tribo. Intl. 40(2007)37-48.
32. B.Z.Jang, J.Y.Liau, R.Hwang and W.K.Shih, Structure –properties relationships in thermoplastic particulate and ceramic whisker- modified epoxy resins, J. of Reinforced Plastics and Comp., 8(1989)322-331.
33. Y.Zhang, C.A.Pickles and J.Cameron, The production and mechanical properties of silicon carbide and alumina whisker- reinforced epoxy composites, J. of Reinforced Plastics and Comp., l.11(1992)1176.
34. Kishore, P.Sampathkumaran, S.Seetharamu, P.Thomas, and M. Janardhana, A study on the effect of the type and content of filler in epoxy-glass composite system on the friction and wear characteristics, Wear, 259 (1-6), (2005) 634-641.
35. J. Wang, M. Gu, Songhao and S.GE,The role of the influence of MoS2 on the tribological properties of carbon fibre reinforced Nylon1010 composites, Wear, 255 (1-6),( 2003) 774-779.
36. J.M.Whitney,I.M.Daniel and R.B.Pipes, Experimental mechanics of fiber reinforced composite materials, Society for experimental mechanics, Brook field centerconnectieut,1984.

530 B. Shivamurthy, Siddaramaiah and M.S. Prabhuswamy Vol.8, No.7
37. R.E.Bullock, Strength ratios of composite materials in flexural and tension, J. of Composite Materials, 8 (1974) 200.
38. J.M.Whitney and M.Knight, The relationship between tensile strength and flexural strength in fiber-reinforced composite. Experimental Mechanics, 20 (1980) 211.
39. N.Viswanath and D.G.Bellow, Development of an equation for the wear of polymers. Wear, 181-183(1995)42-49
40. J.K. Lancaster,Friction and wear, in:A.D.Jenkins(Ed), polymer science:A material science hand book, North Holland, Amsterdam,959-1046(1972).
41. S.N.Ratner, I.I.Farberova, O.V.Radynkevich and E.G. Lure, Sov.Plast., 7 (1964) 37-47. 42. Poomali,Siddaramaiah,B.Suresha and Joong-HeeLee,Mechanical and three body abrasive
wear behavior of PMMA/TPU blends, Material Sci.and Engg.,A 1-5(2008) 43. B.Suresha, C.Chandramohan,N.Dayanda Jawali and Siddaramaiah, Effect of short glass
fiber content on three-body wear behaviour of polyurethane composites.J.of Composite materials,41(2007)2701-2713


