Influence of Service Quality and Corporate Image
194
THE INFLUENCE OF SERVICE QUALITY AND CORPORATE IMAGE ON CUSTOMER SATISFACTION AMONG UNIVERSITY STUDENTS IN KENYA Edward Otieno Owino A Thesis Submitted in Fulfillment of the Requirements for the Award of the Degree of Doctor of Philosophy in Business Administration, School of Business, University of Nairobi 2013
Transcript of Influence of Service Quality and Corporate Image
THE INFLUENCE OF SERVICE QUALITY AND
CORPORATE IMAGE ON CUSTOMER SATISFACTION
AMONG UNIVERSITY STUDENTS IN KENYA
Edward Otieno Owino
A Thesis Submitted in Fulfillment of the Requirements for the Award of
the Degree of Doctor of Philosophy in Business Administration,
School of Business, University of Nairobi
2013
ii
DECLARATION
This thesis is my original work and has not been submitted for degree in any other
university
Signed: ………………………… Date……………………
EDWARD OTIENO OWINO
Registration Number: D80/80121/2009
This thesis has been submitted for examination with our approval as university
supervisors.
Signed: ………………………… Date……………………
Prof. Francis N. Kibera
Department of Business Administration
School of Business, University of Nairobi
Signed: ………………………… Date……………………
Dr. Justus Munyoki
Department of Business Administration
School of Business, University of Nairobi
Signed: ………………………… Date……………………
Prof. Gituro Wainaina
Department of Management Science
School of Business, University of Nairobi
iii
COPYRIGHT
All rights reserved. No part of this thesis may be used or reproduced in any form by any
means, or stored in database or retrieval system, without prior permission of the author or
University of Nairobi on that behalf except in the case of brief quotations embodied in
reviews, articles and research papers. Making copies of any part of this thesis for the
purpose other than personal use is violation of the Kenyan and International Copyright
Laws. For information, contact Edward Otieno Owino at the following address.
P.O. Box 23604 - 00100
NAIROBI
KENYA
Tel. Office : +254 208 561 803
Mobile: +254 0722-254 867
Email: [email protected]

iv
DEDICATION
This PhD. thesis is dedicated to my spouse Sherine, son Steve and daughter Marione.
Thank you for your encouragement and sacrifices.
v
ACKNOWLEDGEMENTS
My greatest appreciation and gratitude goes to my supervisors, Professor Francis Kibera,
Dr. Justus Munyoki and Professor Gituro Wainaina. They played an imperative role in
blue printing this document and in inculcating knowledge on the author. It is because of
their devotion, scholarly critique, academic rigor, insightful thinking, continued support
and guidance that this work stood the test of time. To the lead supervisor, Professor
Kibera thank you very much for grounding the subject content and theoretical context of
this study, thank you very much Professor Gituro for sowing the PhD seed in me and for
your leadership during the data analysis process and thank you very much Dr. Munyoki
for doing all the dirty work that resulted in this clean thesis. I acknowledge the academic
team that sat for hours on end in the boardroom at Lower Kabete Campus as they shaped
this document.
We spent many hours with my class mate Juliana Namada as we engaged in academic
discourses that positively impacted on this document. Thank you Juliana, for the
corrections, disagreements, insights and more so for the challenges; you were always a
step ahead of me. Professor Joshua Gisemba Bagaka's (Cleveland State University -
USA) played a pivotal role in training me and subsequently guiding my data analysis, for
this reasons I say thank you. Dr. Muchiri Mwangi (Formerly Kenya College of
Accountancy, now KCA University) provided constructive critique of the document from
time to time leading to invaluable improvement. I appreciate KCA University for partly
sponsoring my studies and grunting me time off from work to complete critical stages of
the study. I wish to appreciate Cosmas Kemboi for ensuring the document is referenced
and cited as per requirements. Thank you Hedwig Ombunda for editing this thesis and
improving on its formatting. I wish to appreciate Charles Kyengo for coding,
transcribing and cleaning the data. I will forever be grateful to my parents Didacus
Owino and Mary Owino. I will remember their support in my studies and upbringing.
Overall, I thank God for his mercy and grace.
vi
ABSTRACT
The primary objective of this study was to identify the nature and significance of the
relationship between service quality, corporate image and customer satisfaction. The
specific objectives of the study were to determine the dimensions of service quality that
influence customer satisfaction; establish the difference in service quality perception
amongst universities students; determine the relationship between service quality and
corporate image; determine the relationship between service quality and corporate image;
establish the relationship between corporate image and customer satisfaction and assess
the extent to which corporate image meditates the relationship between service quality
and customer satisfaction. The research hypotheses were derived from the research
objectives. A positivist paradigm guided the study. A cross sectional sample survey was
used to collect data from stratified randomly selected respondents. A seventy seven item
scale instrument designed for universities with specific focus on performance was self-
administered to 750 respondents. Descriptive analysis was used to profile the
respondents, while factor analysis was employed to determine potent service quality
dimensions in universities. Analysis of Variance (ANOVA) test was used in comparative
analysis linear regression analysis was used to test the research hypotheses and
hierarchical regression analysis was employed to ascertain the predictive power of the
service quality dimensions on customer satisfaction. An examination of the first research
objective revealed four dimensions of service quality as human elements reliability,
service blue print, human element responsiveness and non-human elements. The four
dimensions had eigenvalues greater 1 and Cronbach’s alpha greater than 0.700, they were
considered adequate and reliable in explaining variations in customer satisfaction. Human
elements reliability with a Cronbach’s alpha of 0.931 and corporate image with
Cronbach’s alpha of 0.909, had the greatest influence on customer satisfaction. The study
established the existence of a significant difference in the dimensions of service quality
that influence customer satisfaction between public and private university students along
the four service quality dimensions. A statistically significant relationship was
established between service quality and customer satisfaction. The relationship between
service quality and corporate image was statistically significant. Further findings revealed
that a statistically significant relationship existed between corporate image and customer
satisfaction. A test of the mediated relationship confirmed that the relationship between
service quality and customer satisfaction was partially mediated by corporate image, an
observation that adds to existing literature by uncovering the mediating effect of
corporate image on the relationship between service quality and customer satisfaction
amongst university students. The study recommends that the regulatory authority should
standardize the human and non-human elements in the learning environment to assure all
students of equal value irrespective of where they experience the service. The results of
the study imply that university management has to invest in service reliability and
corporate brand building because the two have profound influence on university publics.
It is further recommended that the industry regulator adopts the research instrument as a
standard index of measuring student satisfaction and hence as a tool of evaluating and
ranking service quality in universities. The study concluded that service quality has a
strong influence on customer satisfaction; however there may be other factors that affect
customer satisfaction.
vii
TABLE OF CONTENTS
DECLARATION............................................................................................................... ii
COPYRIGHT ................................................................................................................... iii
DEDICATION.................................................................................................................. iv
ACKNOWLEDGEMENTS ............................................................................................. v
ABSTRACT ...................................................................................................................... vi
LIST OF TABLES ........................................................................................................... xi
LIST OF FIGURES ....................................................................................................... xiii
ABBREVIATIONS AND ACRONYMS ...................................................................... xiv
CHAPTER ONE: INTRODUCTION ............................................................................. 1
1.1 Background of the Study ........................................................................................ 1
1.1.1 The Construct of Service Quality .......................................................................... 2
1.1.2 Corporate Image .................................................................................................... 3
1.1.3 Customer Satisfaction ........................................................................................... 4
1.1.4 Service Quality and Customer Satisfaction........................................................... 5
1.1.5 Higher Education in Kenya ................................................................................... 6
1.2 Research Problem ................................................................................................... 7
1.3 Research Objectives ................................................................................................ 9
1.4 Value of the Study .................................................................................................. 9
1.5 Organization of the Thesis .................................................................................... 11
1.6 Summary ............................................................................................................... 12
CHAPTER TWO: LITERATURE REVIEW .............................................................. 13
2.1 Introduction ........................................................................................................... 13
2.2 Theoretical Foundation of the Study..................................................................... 13
2.3 Measurement of Service Quality .......................................................................... 17
2.4 Measuring Customer Satisfaction ......................................................................... 19
2.5 Service Quality and Customer Satisfaction in Universities .................................. 22
2.6 Measurement of Customer Satisfaction in Universities........................................ 23
2.7 Corporate Image and Customer Satisfaction in Universities ................................ 24
2.8 Service Quality, Corporate Image and Customer Satisfaction ............................. 25
2.9 Summary of Knowledge Gaps .............................................................................. 26
viii
2.10 Conceptual Framework ......................................................................................... 30
2.11 Conceptual Hypotheses ......................................................................................... 32
2.12 Summary ............................................................................................................... 32
CHAPTER THREE: RESEARCH METHODOLOGY ............................................. 33
3.1 Introduction ........................................................................................................... 33
3.2 Research Philosophy ............................................................................................. 33
3.3 Research Design.................................................................................................... 34
3.4 Target Population .................................................................................................. 35
3.5 Sample and Sampling Procedure .......................................................................... 35
3.6 Data Collection ..................................................................................................... 37
3.7 Reliability and Validity of the Study .................................................................... 38
3.8 Operationalization of Study Variables .................................................................. 39
3.9 Data Analysis ........................................................................................................ 39
3.10 Summary ............................................................................................................... 41
CHAPTER FOUR: DATA ANALYSIS AND DISCUSSION OF THE RESULTS . 42
4.1 Introduction ........................................................................................................... 42
4.2 Response Rate ....................................................................................................... 42
4.3 Internal Consistency of Study Variables............................................................... 43
4.4 Demographic Profile of University Students ........................................................ 46
4.5 Factors Influencing Customer Satisfaction in Universities in Kenya ................... 53
4.6 Factors Influencing Customer Satisfaction in Private Universities in Kenya....... 61
4.7 Factors Influencing Customer Satisfaction in Public Universities in Kenya ........ 66
4.8 Comparative Analysis of Service Quality in Private and Public Universities ...... 72
4.9 Relationship Between Service Quality, Corporate Image and Customer
Satisfaction ............................................................................................................ 76
4.10 Relationship Between Human Elements and Customer Satisfaction ................... 80
4.11 Relationship Between Non-Human Elements and Customer Satisfaction ........... 84
4.12 Relationship Between Service Blueprint and Customer Satisfaction ................... 86
4.13 Relationship Between Core Service and Customer Satisfaction .......................... 88
4.14 Mediating Effect of Corporate Image ................................................................... 91
4.14.1 Relationship Between Service Quality and Customer Satisfaction .................. 91
ix
4.14.2 Relationship Between Service Quality and Corporate Image ........................... 94
4.14.3 Relationship Between Corporate Image and Customer Satisfaction ................ 96
4.14.4 Mediating Effect of Corporate Image ............................................................... 99
4.15 Influence of Service Quality and Corporate Image on Customer Satisfaction ....... 103
4.16 Discussion of the Results ........................................................................................ 112
4.16.1 Dimensions of Service Quality that Influence Customer Satisfaction ....... 112
4.16.2 Comparative Analysis of Dimensions of Service Quality in Universities . 114
4.16.3 Influence of Service Quality on Customer Satisfaction ............................. 115
4.16.4 The Relationship Between Service Quality and Corporate Image ............. 118
4.16.5 Influence of Corporate Image on Customer Satisfaction ........................... 119
4.16.6 Mediating Effect of Corporate Image on the Relationship Between Service
Quality and Customer Satisfaction ................................................................... 120
4.17 Summary ............................................................................................................. 120
CHAPTER FIVE : SUMMARY, CONCLUSION AND RECOMMENDATIONS 122
5.1 Introduction ......................................................................................................... 122
5.2 Summary ............................................................................................................. 122
5.3 Conclusion .......................................................................................................... 123
5.4 Implications......................................................................................................... 124
5.4. 1 Theoretical Implications................................................................................... 124
5.4. 2 Managerial Implications................................................................................... 125
5.6 Policy Recommendations.................................................................................... 128
5.7 Recommended Areas for further Research ......................................................... 129
5.8 Limitation of the Study ....................................................................................... 130
REFERENCES .............................................................................................................. 131
APPENDICES ............................................................................................................... 139
Appendix 1: Introduction Letter ..................................................................................... 139
Appendix 2: Cover Letter: Institutional .......................................................................... 140
Appendix 4: Universities Authorized to Operate in Kenya, 2013 .................................. 145
Appendix 4a: Student Enrolment by Sex in Universities, 2007/2008-2011/2012 .......... 149
Appendix 4b: Student Enrolment: Bachelor’s Degree Programmes 2009/2010 ............ 149
Appendix 5: Service Quality Battery .............................................................................. 151

x
Appendix 6: Study Variables and Their Operationalization ........................................... 152
Appendix 7: Summary of Research Objectives, Hypotheses, Analytical Methods and
Interpretation of Results ............................................................................................. 157
Appendix 8: Normality Test of Service Quality ............................................................. 162
Appendix 11: Descriptive Statistics of Entire Data Set .................................................. 165
Appendix 12: Normality Test Using Histograms ........................................................... 166
Appendix 13: Normality Test Stem-and-Leaf Plot ......................................................... 167
Appendix 14: Normality Test Using Q-Q Plots .............................................................. 168
Appendix 15: Exploratory Factor Analysis Descriptive Statistics of Combined Data ... 169
Appendix 16: Unrotated Component Matrix of Combined Data.................................... 170
Appendix 17: Communalities of Combined Data ........................................................... 171
Appendix 18: Unrotated Component Matrix of Private University Data ....................... 172
Appendix 19: Unrotated Component Matrix of Public University Data ........................ 173
Appendix 20: Kaiser-Meyer-Olkin and Bartlett's Test ................................................... 174
Appendix 21: Linearity Test of Customer Satisfaction and Service Quality.................. 175
Appendix 22: Homoscedasticity Test ............................................................................. 176
Appendix 23: Test of Multicollinearity .......................................................................... 177
Appendix 24: Test of Multicollinearity Based on Correlation between Factors ............ 178
Appendix 25: Examining Existence of Significant Outliers and Unusual Cases ........... 179
xi
LIST OF TABLES
Table 2.1: Summary of Knowledge Gaps .................................................................................. 27
Table 3.1 Sample Size ............................................................................................................... 36
Table 4.1: Response Rate ........................................................................................................... 43
Table 4.2: Inter-Item Correlation Matrix ................................................................................... 44
Table 4.3: Item-Total Statistics .................................................................................................. 45
Table 4.4: Sample Profile ........................................................................................................... 47
Table 4.5: Correlation of Demographic Profile and Customer Satisfaction .............................. 49
Table 4.6: Chi-Square Tests of University Category and Customer Satisfaction ...................... 50
Table 4.7: Chi-Square Tests Between Sponsorship and Customer Satisfaction ........................ 50
Table 4.8: Cross Tabulation of University Category and Gender of Respondent ..................... 51
Table 4.9: Chi-Square Tests of Association Between University Category and Gender ........... 51
Table 4.10: Cross Tabulation of University Category and Where You Get Sponsorship ....... 52
Table 4.11: Chi-Square Tests of University Category and Sponsorship Source ..................... 52
Table 4.12: Total Variance Explained by the Combined Data ................................................ 55
Table 4.13: Rotated Component Matrix of Kenyan Universities ............................................ 60
Table 4.14: Total Variance Explained in Private University Data ........................................... 62
Table 4.15: Rotated Component Matrix of Private Universities Data ..................................... 65
Table 4.16: Total Variance Explained in Public Universities .................................................. 67
Table 4.17: Rotated Component Matrix of Public Universities ............................................... 70
Table 4.18: Factor Ranking Based on Exploratory Factor Analysis and Reliability Test ....... 71
Table 4.19: Analysis of Variance of Combined Public and Private Data ................................ 74
Table 4.20: Descriptive of the Service Quality Dimensions .................................................... 75
Table 4.21: Cross Tabulation of University Category and Overall Satisfaction ...................... 76
Table 4.22: Model Summary of Human Elements and Customer Satisfaction ....................... 82
Table 4.23: Analysis of Variance Statistics of Human Elements ............................................ 82
Table 4.24: Coefficients of Human Elements .......................................................................... 83
Table 4.25: Model Summary of Non-human Elements and Customer Satisfaction ................ 85
Table 4.26: Analysis of Variance Statistics of Non-human Elements ..................................... 85
Table 4.27: Coefficients of Non-human Elements and Customer Satisfaction ....................... 86
Table 4.28: Model Summary of Service Blue Print and Customer Satisfaction ...................... 87
xii
Table 4.29: Analysis of Variance Statistics of Service Blue Print ........................................... 87
Table 4.30: Coefficients of Service Blueprint and Customer Satisfaction .............................. 88
Table 4.31: Model Summary of Core Service and Customer Satisfaction .............................. 89
Table 4.32: Analysis of Variance Statistics of Core Service and Customer Satisfaction ........ 90
Table 4.33: Coefficients of Core Service Elements and Customer Satisfaction ...................... 90
Table 4.34: Model Summary of Service Quality and Customer Satisfaction .......................... 92
Table 4.35: Analysis of Variance Statistics of Service Quality and Customer
Satisfaction ............................................................................................................ 93
Table 4.36: Coefficients of Service Quality Elements and Customer Satisfaction.................. 93
Table 4.37: Model Summary of Service Quality and Corporate Image .................................. 95
Table 4.38: Analysis of Variance Statistics of Service Quality and Corporate Image ........... 95
Table 4.39: Coefficients of Service Quality and Corporate Image .......................................... 96
Table 4.40: Model Summary of Corporate Image and Customer Satisfaction ........................ 97
Table 4.41: Analysis of Variance Statistics of Corporate Image and Customer
Satisfaction ............................................................................................................ 98
Table 4.42: Coefficients of Corporate Image and Customer Satisfaction ............................... 98
Table 4.43: Model Summary of Model Mediated by Corporate Image ................................. 100
Table 4.44: Analysis of Variance Statistics of Model Mediated by Corporate Image .......... 101
Table 4.45: Coefficients of Model Mediated by Corporate Image ........................................ 102
Table 4.46: Model Summary of Service Quality, Corporate Image and Customer
Satisfaction .......................................................................................................... 105
Table 4. 47: Analysis of Variance Statistics of Service Quality, Corporate Image and
Customer Satisfaction ......................................................................................... 106
Table 4.48: Coefficients of the Integrated Model of Service Quality, Corporate Image
and Customer Satisfaction .................................................................................. 107
Table 4.49: Summary of Results of Hypotheses Testing ....................................................... 111
xiii
LIST OF FIGURES
Figure 2.1: Howard Sheth Model…………………...…………………….……………14
Figure 2.2: Conceptual Framework…………………………………………….………31
Figure 4.1: Scree Plot of Combined Public and Private Data………….………...….…55
Figure 4.2: Empirical Model of Service Quality, Corporate Image and Customer
Satisfaction ………………….………………………………………………………….109
xiv
ABBREVIATIONS AND ACRONYMS
ACSI American Customer Satisfaction Index
AMOS Analysis of Moment Structure
ANOVA Analysis of Variance
CFA Confirmatory Factor Analysis
CHE Commission for Higher Education
CFI Comparative Fit Index
CSI Customer Satisfaction Index
CUE Commission for University Education
ECSI European Customer Satisfaction Index
EFA Exploratory Factor Analysis
EFQM European Framework for Quality Management
HEdPERF Higher Education Performance only
LISREL LInear Structured RELationship
KMO Kaiser-Meyer-Olkin
MoE Ministry of Education
MoHE Ministry of Higher Education
OLS Ordinary Least Squares
PCA Principal Component Analysis
PHEd Performance-Based Higher Education
PIMS Profit Impact of Marketing Strategy
PLS Partial Least Squares
RM RASCH model
SCSI Swedish Customer Satisfaction Barometer
SEM Structural Equation Modeling
SERVQUAL Service Quality Model
SERVPERF Performance Based Service Quality Model
SQM-HEI Service Quality Measurement in Higher Education
SSS Self Sponsored Students
TQM Total Quality Management
1
CHAPTER ONE
INTRODUCTION
1.1 Background of the Study
This chapter presents an overview of the concepts of service quality, corporate image and
customer satisfaction. It provides a historical development of the higher education sector
in Kenya, states the research problem, highlights the research objectives, presents the
value of the study and provides a summary of the organization of the thesis.
The higher education service sector is one of the fastest growing industries in Kenya. The
rapid growth in this sector is characterized by increased student enrolment, reduced
Government funding of public universities, heightened expectation of service quality by
the overly savvy customers, emergence of competitive private universities and
acquisition of middle level colleges by public universities to cater for excess demand
(Economic Survey 2012; Magutu, Mbeche, Nyaoga, Ongeri, & Ombati, 2010). Service
quality in education is therefore gaining prominence with the main stay remaining, high
service quality for enhanced customer satisfaction and retention. Unfortunately, in the
face of this metamorphosis, Ngware, Onsomu and Manda, (2005) observe that existing
and projected supply of public education in Kenya continuously falls short of demand for
quality education leading to low customer satisfaction.
The construct of service quality has spurred scholarly debate with extant literature
revealing absence of consensus on the measurement of service quality, owing to service
intangibility, heterogeneity and multidimensionality (Navarro et al., 2005). Empirical
review by Kang and James (2004) and Kay and Pawitra (2001) points at convergence in
thought that the Service Quality (SERVQUAL) model pioneered by Parasuraman, Berry,
and Zeithaml (1985) is widely acceptable in the measurement of service quality. Despite
its widespread use, scholars continue to question its completeness, operationalization and
conceptualization (Sureshchandar, Rajendran & Anatharaman, 2002).
2
Interest in measurement of service quality is attributed to the relationship between service
quality and costs, profitability, customer satisfaction and retention (Shekarchizadeh, Rasli
& Hon-Tot, 2011). Analysis of the Profit Impact of Marketing Strategy (PIMS) database
by Buzzel and Gale (1987) evidenced a positive relationship between perceived quality
and organization’s financial performance. In this regard therefore, Alves and Raposo
(2010) posit that service quality has emerged as an impetus to managerial strength and
competitiveness.
1.1.1 The Construct of Service Quality
A service refers to any activity that one party offers to another which is essentially
intangible and through some form of exchange satisfies an identified need (Zeithaml,
Bitner, & Gremler, 2006). Service quality is considered by Zeithaml (1987) as
consumer’s judgment about an entity’s overall excellence or superiority. Kibera (1996)
posit that service quality is the conformance of a service to customer specification and
expectation, while Kimonye (1998) elucidates that service quality is the degree of match
between expected and actual service provided by the service giver and that the higher the
fit, the higher the level of customer satisfaction. In contrast, Kang and James (2004)
observed that the construct of service quality centers on the perceived quality, a position
supported by Sultan and Wong (2010), who described service quality as a form of
attitude representing a long run overall evaluation. This study adopted the later position
and defines service quality ‘as a form of attitude representing customers long run overall
evaluation of a service after a service encounter.’
The protagonist of quality management in organizations, include: Joseph Juran (1950’s),
Edward Deming (1950’s) and Philip Crosby (1980’s) whose works culminated in the
promulgation of the concept of Total Quality Management (TQM). Magutu et al. (2010)
explained that based on TQM policies, different approaches have been adopted for
studying quality management in universities, including self-assessment and external
assessment of the institutions, accreditation and certification systems and they proposed
the adoption of a Quality Management (QM) model at the University of Nairobi. Becket
and Brookes (2008) attest to the fact that besides TQM, many more models have been

3
adopted by higher education institutions in measuring service quality, but in their critique
they note that these models are industry based. They identify the models as including:
European Framework for Quality Management (EFQM), Balanced Scorecard, Malcom
Baldridge Award, International Standards Organization (ISO) 9000, Business Process
Re-engineering and SERVQUAL.
The heterogeneous nature of services, result in service differential between service
providers or even within the same service context. Parasuraman et al. (1985), pioneered
the gaps model that explains why customers experience quality differential. In a
subsequent study, Parasuraman et al. (1988, p.5) gave the definition; “service quality is
the degree of discrepancy between customers’ normative expectations for the service and
their perceptions of the service performance”. They applied this conceptualization in the
construction of 22 item scale instrument (SERVQUAL model) shown in Appendix 5. The
SERVQUAL battery has since been widely adopted as a tool for measuring service
quality and customer satisfaction. Sureshchandar et al. (2002) acknowledges
SERVQUAL forms the cornerstone along which all other works have been actualized.
1.1.2 Corporate Image
Corporate image is the overall impression left in the customers’ mind as a result of
accumulated feelings, ideas, attitudes and experiences with the organization, stored in
memory, transformed into a positive/negative meaning; retrieved to reconstruct image
and recalled when the name of the organization is heard or brought to ones’ mind (Hatch
et al., 2003 & Abd-El-Salam, 2013). Image has been described as subjective knowledge,
as an attitude and as a combination of product characteristics that are different from the
physical product but are nevertheless identified with the product (Erickson et al., 1984).
Examples include tradition, ideology, company name, reputation, price levels, and the
quality communicated by each person interacting with the service firm. For this reason,
Zimmer and Golden (1988) describe corporate image as the overall impression left on the
minds of customers, as a “gestalt”. According to Kotler and Fox (1995), image is based
on incomplete information and it may differ for the various publics of an institution.
4
Since organizations have several different publics, Dowling (1988) suggests that a
company does not have one image but multiple images. Therefore service quality is
described in terms of physical quality, interactive quality and corporate quality by
Lehtinen and Lehtinen (1982) who also suggest that corporate quality refers to the image
attributed to a service provider by its current and potential customers and that, compared
with the other two quality dimensions, corporate quality tends to be more stable over
time. Kang and James (2004) demonstrated that functional and technical quality of a
service influences perception of service quality, but these influences are strongly
moderated by image of the service provider. Kandampully and Hu (2007) observed that
corporate image consist of two components; the first is functional such as the tangible
characteristics that can be measured and evaluated easily. The second is emotional
including feelings, attitudes and beliefs that one has towards the organization. University
image is therefore defined by Alves and Raposo (2010) as the sum of all the beliefs an
individual has towards the university.
1.1.3 Customer Satisfaction
Kotler and Keller (2006) view customer satisfaction as a person’s feelings of pleasure or
disappointment resulting from comparing product’s perceived performance (or outcome)
in relation to his or her expectation. In a related definition, Juran (1991) posit that
customer satisfaction is the result achieved when service or product features respond to
customers need and when the company meets or exceeds customer’s expectation over the
lifetime of a product or service. Customer satisfaction is described by Bolton and Drew
(1991) as a judgment made on the basis of a specific service encounter. Oliver (1981)
viewed satisfaction as an emotional reaction which influences attitude and is
consumption specific. In a university context, Elliot and Shin (2002: 198) observed that
student satisfaction was a “short-term attitude resulting from an evaluation of the
student’s educational experience or as a student’s subjective evaluation of the various
outcomes and experiences with education and campus life”. Most definitions favor the
notion of consumer satisfaction as a response to an evaluation process, however Giese
and Cote (2000) observed that there is an overriding theme of consumer satisfaction as a
summary concept (a fulfillment response (Oliver 1997); affective response (Halstead,
5
Hartman, & Schmidt 1994); overall evaluation (Fornell 1992); psychological state
(Howard and Sheth 1969)). In this study, customer satisfaction is defined as the results
achieved when service or product features respond to customers need.
Brown (1998) postulates that there is a connection between satisfaction and profitability
and that customer satisfaction measurement should include an understanding of the gap
between customer expectations and performance perceptions. Customer satisfaction
theories reveal the existence of a significant relationship between service quality and
customer satisfaction in higher education (Navarro et al., 2005). In connecting the two
Shieh (2006) noted that customer satisfaction was the level of service quality
performance that met user’s expectation.
1.1.4 Service Quality and Customer Satisfaction
The debate on the relationship between service quality and satisfaction has been spurred
by academicians including; Spreng and Singh (1993) who established that the higher the
level of service quality the higher the level of customer satisfaction, Stafford et al.,
(1998) deduced that service quality and customer satisfaction are distinct but related,
while Shekarchizadeh et al. (2011) posit that customer satisfaction is antecedent to
service quality. Satisfaction is generally associated with one particular transaction at a
particular time and has been described by Spreng et al., (1996) as an emotional reaction
to a product or service experience. Service quality on the other hand is more congruent
with a long term attitude. Overall, satisfaction is more experimental, transitory and
transaction-specific, while service quality is believed to be more enduring.
Athiayman (1997) posits that even though the study of the relationships between
perceived quality and satisfaction is relatively new within the university scope, it must
not be forgotten that the purpose of services whether public or private, is user
satisfaction. In addition, Navarro et al. (2005) notes that most studies in higher education
designate the student as the element in the best position to evaluate the teaching received
through a measurement of the levels of satisfaction. The student plays the customer role
because they are both the receiver and subsequent users of the training given by the
6
university. In support, Shekarchizadeh et al. (2011) added that in educational institution,
the student is the consumer, whose satisfaction the institution must seek to maximize.
1.1.5 Higher Education in Kenya
The Education Act of 1968 revised in 1980, assigned the role of managing formal
education to the Ministry of Education (MOE). According to United Nations Educational,
Scientific and Cultural Organization (UNESCO, 2010) in May 2008, the responsibility of
technical, tertiary and higher education was transferred to the Ministry of Higher
Education Science and Technology (MOHES & T). In 1984, the 7-4-2-3 education
system was replaced with the 8-4-4 education system. The 8-4-4 system has been
critiqued as negatively affecting the quality of Kenyan education system (Amutabi, 2003
& Muda 1999 in Makori, 2005). The 8-4-4 education system requires a student to spend
eight years in primary schooling, four years in secondary level before joining university
where the student spends a minimum of four years depending on the course undertaken.
Unlike many education systems in the world, the Kenyan education system does not have
the advanced level of education; this has raised quality issues over the years.
The history of universities in Kenya can be traced back to 1961, when the then Royal
College, Nairobi was elevated to university status under the name of the University of
East Africa. Coinciding with Kenya’s independence from Britain in 1963, the University
of East Africa enrolled 571 students in its debut intake, making it the first university in
Kenya (Mutula, 2002). Since then, the higher education system has expanded (Magutu et
al., 2010).
The overhaul of the Kenyan education in 1984 saw public universities double their intake
to accommodate ordinary level and advanced level students in the 1990/91 intake. In the
year 1998, public universities citing idle capacity, need to bridge financial gap and create
a window of opportunity for thousands of Kenyans who could not access university
education, public universities invested in Module II or the parallel degree programme
(Government of Kenya, 1988) – Kamunge Report. Module II allowed Self Sponsored
Students (SSS) to pursue higher education without being accommodated within the

7
university premises. Private universities emerged soon after to bridge the gap not filled
by public universities (Abagi, Nzomo & Otieno, 2005). The mounting demand for higher
education led the Government to establish the Commission for Higher Education (CHE)
in 1985 through an Act of Parliament (The Universities Act Cap 210B), to regulate
growth and quality in higher education in Kenya (Commission of University Education -
CUE, 2013). Ngware et al. (2005) noted that currently CHE had been reduced to a body
that charters and issues letters of interim authority as specified in the University Act
(210B) but had no control over the service quality of universities thereafter. For this and
other reasons, CUE was enacted to replace CHE in 2013.
1.2 Research Problem
The search for a measurement tool of service quality lays the backbone of service quality
theory (Gronroos, 1982 & Parasuraman et al., 1985). This study is anchored on the
consumer behavior theory fronted by Howard and Sheth (1969). From the Howard and
Sheth (1969) model, quality is antecedent to satisfaction, but several organizations do not
offer service quality that meets customers’ needs, resulting in customer gaps. The Gap-
model by Parasuraman et al. (1988) presents the service manager’s dilemma as that of not
knowing what customers want from the organization. The search for a generic tool of
measuring service quality and customer satisfaction has led to the emergence of two
predominant models, SERVQUAL model and Service Performance (SERVPEF) model.
Despite the widespread use of the SERVQUAL model, its dimensionality and
operationalization is ambivalent. The SERVPEF theorists have advanced a performance
based measure and exemplified it over the disconfirmation model (Carman, 1990 and
Cronin & Taylor, 1992). Limited empirical literature is available on the use of
performance based models in universities in Kenya. The SERVQUAL model has five
dimensions, Sureshchandar et al. (2002) amalgamated the dimensions of service quality
into two factors and introduced three additional dimensions; core service, non-human
elements and corporate social responsibility. In this study corporate social responsibility
was replaced with corporate image and guided by the critique of the dimensionality of
SERVQUAL advanced by Buttle (1996). This study proposed that the original five
dimensions of service quality be consolidated into two; human elements (reliability,
8
responsiveness, assurance, empathy) and non-human elements (physical evidence). Two
other dimensions were introduced and tested; core service and service blueprint. The
study therefore proposed an examination of an improved four factor service quality
construct as antecedent to customer satisfaction.
Kang and James (2004) introduced image as a moderating variable between functional
qualities, technical qualities and perceived service quality. Similarly, guided by a
performance based measure, Che and Ting (2002) regrouped the dimension of service
quality into two; technical qualities and functional qualities and linked them to customer
satisfaction. However their analysis left out corporate image, whose influence this study
sought to examine. While testing the mediating effect, Abd-El-Salam (2013) examined
the role of corporate image and reputation in mediating the relationship between service
quality and customer loyalty. In contrast, this study sought to examine the mediating role
of corporate image on the relationship between service quality and customer satisfaction.
A variety of quality models have been customized for higher education including; the
Higher Education Performance (HEdPERF) only construct by Abdullah (2006), the
Performance-Based Higher Education (PHEd) service quality model by Sultan and Wong
(2010) and the Quality Measurement in Higher Education in India (SQM-HEI) model by
Senthilkumar and Arulraj (2010). The emergent models have been tested and accepted in
developed countries. The operationalization of these models in universities in developing
nations in Africa is yet to be tested. This study tested a performance based model.
The dimensions of service quality in higher education context vary from one institution to
another, from one country to another and even from culture to culture, posing a
contextual debate. In Kenya, the rapid expansion of university education led to
impecunious conditions and deteriorated quality of university education in terms of
quality of teaching and research, library facilities, overcrowding in halls of residence,
student riots and staff dissolution (Mutula, 2002). Mwaka et al. (2011) adds that the high
enrolment levels have led to the quantity vis a vis quality debate and ultimately a
phenomenon described as non-education. Under this circumstance, the sustainability of
service quality and customer satisfaction in universities in Kenya became questionable.
9
On the premise of the study background and emergent issues on the relationship between
service quality, customer satisfaction and corporate image, knowledge gaps were
identified. Key amongst them was that while previous studies examined the three
variables in isolation or in pairs, this study adopted an integrated approach and sought to
establish the influence of service quality and university image on students’ satisfaction.
The study sought answers to the research question, ‘what was the nature of relationship
between service quality, corporate image and customer satisfaction amongst university
students in Kenya?’
1.3 Research Objectives
Overall, the study sought to assess the relationship between service quality, corporate
image and customer satisfaction among university students in Kenya. The specific
objectives of the study were to:
(i) Determine the dimensions of service quality that influence customer satisfaction
in universities in Kenya
(ii) Establish the difference in service quality perception amongst universities
students
(iii) Examine the relationship between service quality and customer satisfaction.
(iv) Determine the relationship between service quality and corporate image.
(v) Establish the relationship between corporate image and customer satisfaction.
(vi) Assess the extent to which corporate image mediates the relationship between
service quality and customer satisfaction.
1.4 Value of the Study
This study contributes to academicians by providing knowledge in service marketing
theory on dimensions of service quality in universities not manifest in prevailing service
quality models. One service quality dimension ignored by SERVQUAL, service blueprint
was established and its significant effect on customer satisfaction proven. It was
established that the five dimensions of SERVQUAL (predominant in literature) can be
reduced to two – human elements and non-human elements. The study proposed a four

10
dimension construct made up of: human elements, non-human elements, service blueprint
and core service. Human element was the dimensions with the highest predictive power
on customer satisfaction were. Human elements is a multi-dimensional construct, defined
by reliability, responsiveness and assurance that service providers must appreciate and
invest more resources in to maximize customer satisfaction and returns on investment.
The direct beneficiaries of this study are universities. The benefits include an empirical
determination that service quality is perceived differently by students in public and
private universities and the development of a customer survey instrument for universities.
It was established that service quality dimensions vary between private university
students and public university students. This means the service marketing strategies used
by private universities may differ from those used by public universities, hence the need
for contingent policies, procedures and business strategy in each context. This
observation led the study to posit that in reference to contextual matters the service
quality dimensions may vary from one service context to another. While this study has
led to the derivation of a reliable instrument in measuring customer satisfaction in the
context of Kenyan universities, other service context might require tailored instruments.
The resulting instrument is customized for higher institutions of learning and can be
adopted as a benchmarking device for competitive advantage.
Emergence of a significant relationship between corporate image and customer
satisfaction sends a strong signal to managers of universities that corporate branding is
imperative to organizational performance. A greater understanding of the overall effect
that service quality and corporate image on customers satisfaction can assist management
in strengthening their weak service attributes and in predicting the best strategies that can
catapult competitive performance. The study findings are invaluable to service firms
because they can aid service managers in designing services that are market driven to
meet customer expectation while optimizing firm performance. The study revealed the
drivers of customer gaps, whose identification, will help firms mitigate on dissatisfies and
focus on hygiene factors for success.
11
The study findings can guide higher education stakeholders including CUE, MOE and
Government of Kenya (GOK) in developing essential education policies. The regulatory
authority CUE will draw frameworks on service quality dimensions most preferred by
students, and be able to design educational policies addressing such customer needs.
Service quality dimensions addressing human elements of a service will lead to
generation of policies on professional competence of the service providers, while non-
human elements will guide in policy formulation addressing physical facility
requirements for provision of quality services. The core service dimension of service
quality policy will address the content of the curriculum, the most effective teaching
methodology, the curriculum preferred by the market and whose ultimate results is
enhanced education quality and production of quality graduates who can positively
impact the national development of this country. The MOE and GOK will adopt these
policies as benchmarks against which to evaluate a university’s performance and the
emergent generalized instrument can be adopted as a standard measure of university
students’ satisfaction index.
The economic significance of services, particularly higher education services, cannot be
ignored, in Kenya and world over. According to the latest economic researches and
indicators (ISO Survey, 2006; EuroStat, 2007) a substantial part of the economic
activities takes place in the service sector and this tendency is likely to continue. The
GoK is in pursuit of Vision 2030, whose focus is to propel Kenya into a newly
industrialized nation status by 2030 (Government of Kenya, 2007). Universities will play
an imperative role of mediating the attainment of Vision 2030. This is because education
and training at university level is expected to create a dependable and sustainable
workforce in the form of human resource capital for national growth and development.
1.5 Organization of the Thesis
This study has five chapters; Chapter one provides a conceptual background on service
quality, corporate image and customer satisfaction. It further presents a contextual
background on historical development of higher education sector in Kenya, covers the
statement of the problem, research objectives and significance of the study. The second

12
chapter presents a comprehensive review of literature on the key study variables service
quality, corporate image, customer satisfaction and their relationship and thereafter points
out the knowledge gap which this study sought to fill. The chapter also presents the
conceptual framework depicting the independent variables, dependent variable, the
mediating variable and the research hypotheses. A total of nine hypotheses were
formulated on the basis of the research objectives.
Chapter three covers the research methodology adopted in this study and provides an
explanation of the research philosophy that guides the study, the underlying research
design, the target population and the sampling procedure employed. The chapter explains
the data collection methods used and includes the questionnaire design, validation,
reliability test of the instrument, operationalization of study variables and a brief
prologue of the data analysis process.
In Chapter four, the results of data analysis are presented. The data was subjected to
internal consistency/reliability test, descriptive statistical tests were undertaken, followed
by inferential statistics, which allowed for hypotheses testing and use of regression
models for prediction of the influence of the independent variables on the dependent
variable. Chapter five presents a summary of findings, centering on a summarized version
of the findings under each objective followed by conclusion and recommendations of the
study.
1.6 Summary
This chapter gave a background to the study, introduced the concepts of service quality,
corporate image and customer satisfaction. The chapter gave an overview of the study
context which was the higher education industry in Kenya. The research problem was
stated and the research question identified. In this chapter, the general objective was
stated and the specific research objectives identified. The value of the study was
explained and the organization of the thesis presented.
13
CHAPTER TWO
LITERATURE REVIEW
2.1 Introduction
This chapter presents a review of literature on improvements to the service quality
measurement models overtime. The theoretical foundation is provided, followed by a
critique of the SERVQUAL model, an empirical analysis of the measurement of service
quality, corporate image and customer satisfaction leading to the derivation of summary
of knowledge gaps. A conceptual framework is proposed and study hypotheses presented.
2.2 Theoretical Foundations of the Study
The study is anchored on the service quality theory advanced by Gronroos (1982) and
promulgated by Parasuraman et al. (1985). It is premised on the consumer behavior
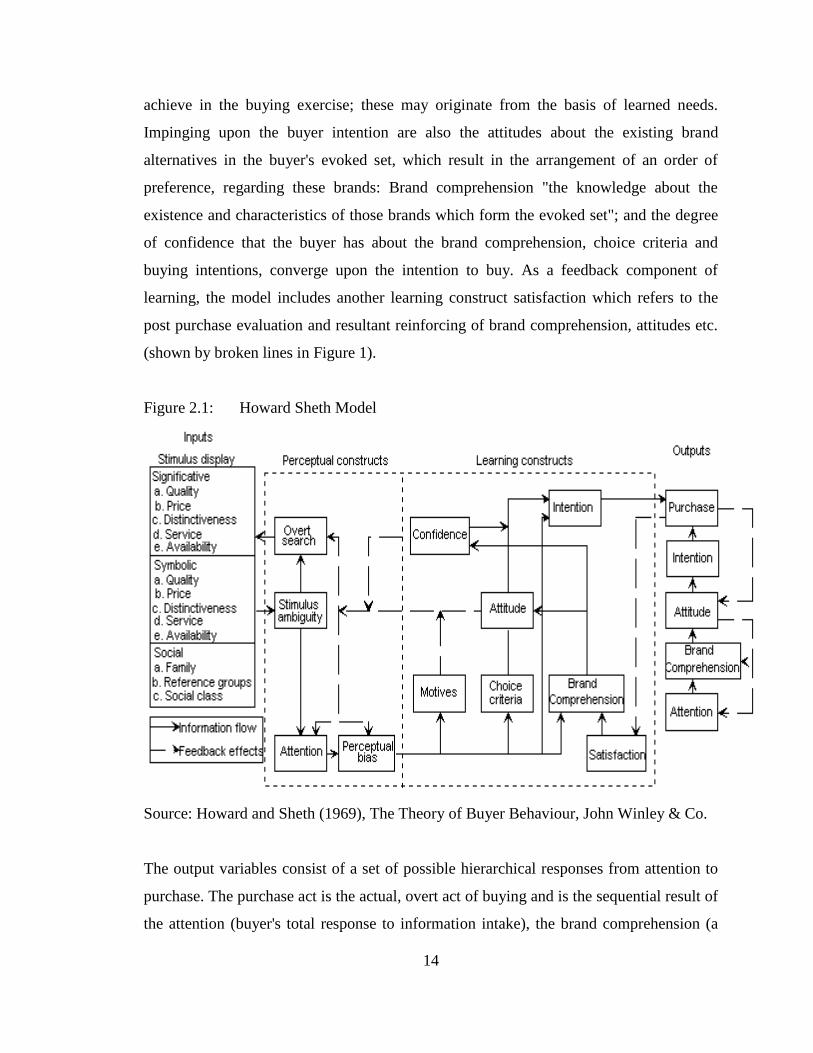
theory fronted by Howard and Sheth (1969). Figure 1 encapsulates four steps of the
Howard Sheth model as encompassing the stimulus inputs, hypothetical constructs,
response outputs and exogenous variables.
The model shows consumers get stimulated to think about buying by quality, price,
distinctiveness, service and availability from the signicative and symbolic aspects. The
hypothetical constructs have been classified in two, the perceptual constructs and the
learning constructs. The perceptual constructs explain the way the individual perceives
and responds to the information from the input variables. All the information that is
received may not merit `attention' and the intake is subject to perceived uncertainty and
lack of meaningfulness of information received (stimulus ambiguity). This ambiguity
may lead to an overt search for information about the product. Finally, the information
that is received, may be, according to the buyer's own frame of reference and pre-
disposition, distorted (perceptual bias). The learning constructs explains the stages ‘from
when the buyer develops motives to his satisfaction in a buying situation’.
The purchase intention is an outcome of the interplay of buyer motives, choice criteria,
brand comprehension, resultant brand attitude and the confidence associated with the
purchase decision. The motives are representative of the goals that the buyer seeks to
14
achieve in the buying exercise; these may originate from the basis of learned needs.
Impinging upon the buyer intention are also the attitudes about the existing brand
alternatives in the buyer's evoked set, which result in the arrangement of an order of
preference, regarding these brands: Brand comprehension "the knowledge about the
existence and characteristics of those brands which form the evoked set"; and the degree
of confidence that the buyer has about the brand comprehension, choice criteria and
buying intentions, converge upon the intention to buy. As a feedback component of
learning, the model includes another learning construct satisfaction which refers to the
post purchase evaluation and resultant reinforcing of brand comprehension, attitudes etc.
(shown by broken lines in Figure 1).
Figure 2.1: Howard Sheth Model
Source: Howard and Sheth (1969), The Theory of Buyer Behaviour, John Winley & Co.
The output variables consist of a set of possible hierarchical responses from attention to
purchase. The purchase act is the actual, overt act of buying and is the sequential result of
the attention (buyer's total response to information intake), the brand comprehension (a
15
statement of buyer knowledge in the product class), brand attitude (referring to the
evaluation of satisfying potential of the brand) and the buyer intention (a verbal statement
made in the light of the above externalizing factors that the preferred brand will be
bought the next time the buying is necessitated). The model also includes exogenous
variables which are not defined but are taken as constant. These influence all or some of
the constructs explained above and through them, the output. Some of the exogenous
variables are importance of the purchase, time at the disposal of the buyer, personality
traits and financial status.
Service quality traces its theoretical background to the pioneering works of Juran (1950s)
and Deming (1950s) who laid the foundry works on the measurement of quality in
manufacturing plants paving way to the contemporary subject of total quality
management and specifically service quality (Deming, 1986). The construct of service
quality as conceptualized in the literature, centers on SERVQUAL model that posits that
service quality depends on the nature of the discrepancy between Expected Service (ES)
and Perceived Service (PS). When ES is greater than PS, service quality is less than
satisfactory, when ES is less than PS, service quality is more than satisfactory and when
ES equals PS service quality equals satisfaction (Parasuraman et al.,1985).
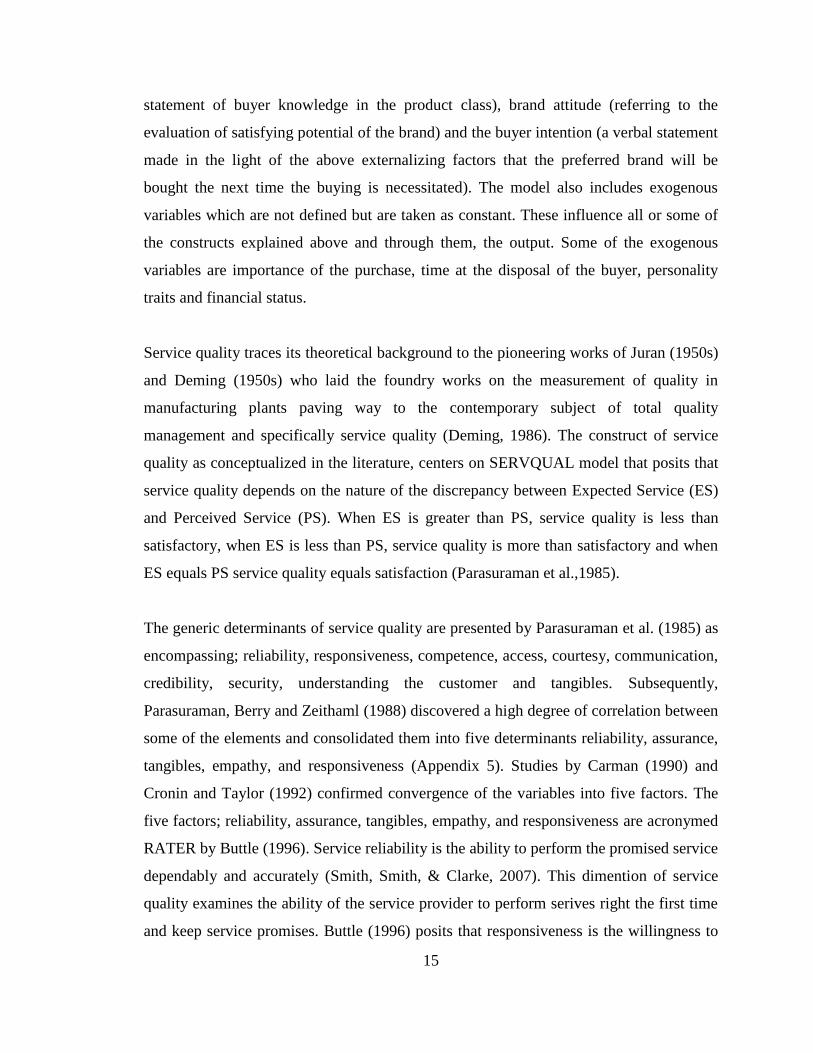
The generic determinants of service quality are presented by Parasuraman et al. (1985) as
encompassing; reliability, responsiveness, competence, access, courtesy, communication,
credibility, security, understanding the customer and tangibles. Subsequently,
Parasuraman, Berry and Zeithaml (1988) discovered a high degree of correlation between
some of the elements and consolidated them into five determinants reliability, assurance,
tangibles, empathy, and responsiveness (Appendix 5). Studies by Carman (1990) and
Cronin and Taylor (1992) confirmed convergence of the variables into five factors. The
five factors; reliability, assurance, tangibles, empathy, and responsiveness are acronymed
RATER by Buttle (1996). Service reliability is the ability to perform the promised service
dependably and accurately (Smith, Smith, & Clarke, 2007). This dimention of service
quality examines the ability of the service provider to perform serives right the first time
and keep service promises. Buttle (1996) posits that responsiveness is the willingness to
16
help customers and provide prompt service. A service provider is responsive if they are
prompt in service delivery, is willing to help customers and has service staff who
responds to customer requests. Smith et al. (2007) and Kay and Pawitra, (2001) both
agree that assurance is knowledge and courtesy of employees and their ability to convey
trust and confidence. The service provider must instill confidence in customers in the
process of transacting, make customer feel safe and display courtesy cosnsitently.
Robledo (2001) suggests that empathy is the approachability, ease of access and effort
taken to understand customers' needs. Empathy is the individual attention given to
customers including showing care and empathy in handling claims and accidents.
Tangibility is the physical evidence of the service, meaning physical facilities,
appearance of personnel, tools or equipment used to provide the service (Sureshchandar
et al., 2002).
Despite the popularity of SERVQUAL model, Gronroos (1982) and Lehtinen and
Lehtinen (1982) posit that SERVQUAL does not account for three dimensions, technical,
functional, and image. Buttle (1996) identifies the shortfalls of SERVQUAL as including
paradigmatic objection, gaps model, process orientation, dimensionality, expectations,
item composition, polarity and scale points. Carman (1990) notes that SERVQUAL is
not generic and needs to be customized to the service in question and he suggests that
service quality has more dimensions than the five in RATER scale and that the item
factor relationships in SERVQUAL are unstable. Abdullah (2006) for instance, changed
the wordings of items in formulating HEdPERF construct. Brown et al. (1993) contest the
measurement of service quality using a difference score. A test of dimensionality focused
on managerial perception led Johnston et al. (1995) to establish 12 dimensions including:
access, appearance, availability, cleanliness, comfort, communication, competence,
courtesy, friendliness, reliability, responsiveness, and security.
In contrast, Navarro et al. (2005) asserts that service quality is best described by the
customer because the customer is the receiver and subsequent user of the service. Cronin
and Taylor (1992) took issue with the conceptualization of SERVQUAL. In their study,
the perception components of SERVPERF outperformed SERVQUAL, which led them
17
to conclude that the disconfirmation paradigm was inappropriate for measuring perceived
service quality. A position questioned by Robledo (2001), who exemplifies SERVPEX
model over other models. The SERVPEX formulation has 26 items and a three factor
structure that define quality in airline service as highly dependent on tangibles, reliability
and customer care.
In analyzing the scale item of SERVQUAL, Sureshchandar et al. (2002) observes that
most of the items in SERVQUAL focus on human interaction in the service delivery and
the rest of the tangible facets of the service and that the instrument failed to address the
systemization of a service. They therefore modified the determinants into five factors
core service product, human element of service delivery, systematization of service
delivery (non-human element), tangibles and social responsibility. Using the grey system
theory, Che and Ting (2002) suggest that service quality is a different concept from
customer satisfaction. The researchers regrouped the 10 factors in Parasuraman et al.
(1985) formulation into two; technical qualities and functional qualities. While grey
system was preferred by Che and Ting (2002), literature points at the prominence of
Structural Equation Modeling (SEM). Kang and James (2004) proposed a five factor
model comprising functional quality, technical quality, image, overall service quality and
customer satisfaction. They employed SEM in confirming the significance of the
proposed five factor structure. The researchers demonstrated that functional and technical
quality influence perception of service quality, but this influence is moderated by image
of the service provider and that the effect of functional quality on image was larger than
the effect of technical quality.
2.3 Measurement of Service Quality
Becket and Brookes (2008) observed that quality in universities can be interpreted and
measured in a number of different ways and that there is still no universal consensus on
how best to manage quality within universities. According to the Gap-model the
perceived service quality is “the degree and direction of the discrepancy between
consumers’ perceptions and expectations” (Parasuraman et al.,1988, p. 17). The
introduction of the SERVQUAL model stimulated the search for a general scale and
18
instrument for the measurement of service quality by both scholars and industry
practitioners. Robledo (2001) observed that the SERVQUAL model has since been
improved on, promulgated and promoted by researchers resulting in new models across
the globe. However, Aldridge and Rowley (1998) content that the most widely used and
debated tool of measuring service quality remains the SERVQUAL instrument. The
concept that underpins all these instruments is that customers’ assessment of service
quality is a key determinant of customer satisfaction (Robledo, 2001).
In contrast to tangible goods whose quality dimensions are easier to identify and describe,
articulation of service quality is challenging. Zeithaml (2006) identified two schools of
thought or paradigms applied in measurement of service quality as the disconfirmation
measures and performance only measures. Parasuraman et al. (1988) formulated the
expectation minus performance measure, popularly known as the disconfirmation
paradigm. The authors posit that, quality = expectation – perception.
The performance only measure of service quality requires that customers rate the
performance of a service after the service encounter. Performance only measure
originated from the foundry works of Carman (1990) and Cronin and Taylor (1992).
Performance only measures avoid the need to measure customer’s expectations of a
service, arguing that while the idea of defining service quality in terms of its expectations
may sound good in principle, actual measurement of expectation can be difficult. While
contextualizing SERVPEF in universities, Abdullah (2006) proposed the HEdPERF
construct. In a rejoining study, Sultan and Wong (2010) developed the PHEd model. The
authors of PHEd model presents it as a better instrument that overcomes the weakness of
SERVPERF and HEdPERF.
At a first glance, privatization of higher education was presumed to provide solutions to
the scarcity of qualified personnel with a degree level of education (Deloitte and Touche,
1994), but Oanda (2008) reports that privatization of higher education was not developed
out of a policy context initiated by Government leading to quality gaps. Ajayi (2006)
notes that this phenomenon is not novel, because in Nigeria, the demand for higher
19
education led to the advent of private higher education institutions whose emergence
catapulted quality issues.
2.4 Measuring Customer Satisfaction
Satisfaction is a latent variable that cannot be observed (Battisti, Nicolini & Salini, 2010).
Analysis of satisfaction can only be performed indirectly by employing proxy variables.
As a result, the measurement of satisfaction has remained debatable amongst scholars.
Several analytical methods of measuring customer satisfaction have been proposed
including; SEM using Linear Structured Relationship (LISREL), Partial Least Squares
(PLS), factor analysis using principal component analysis method, non-linear regression
model with latent variables, monotonic regression model and logistic regression.
The original interest in customer satisfaction research was on the customer’s experience
with a product episode or service encounter (Anderson et al., 1994). More recent studies
have focused on cumulative satisfaction, where satisfaction is defined as customer’s
overall experience to date with a product or service provider. This approach to
satisfaction provides a more direct and comprehensive measure of a customer’s
consumption utility, subsequent behaviors and economic performance (Fornell et al.,
1996). The European Customer Satisfaction Index (ECSI) was built upon a cumulative
view of satisfaction. The ECSI was developed by European organization for quality and
European foundation for quality management, was first introduced in 1999 across 11
European countries (Zaim, Turkyilmaz, Tarim, Ucar, & Akkas, 2010). The ECSI model
is a structural model based on the assumptions that customer satisfaction is caused by
some factors such as Perceived Quality (PQ), Perceived Value (PV), expectations of
customers, and image of a firm. These factors are the presumed antecedents of overall
customer satisfaction. The model also estimates the results when a customer is satisfied
or not. Each factor in the ECSI model is a latent construct which is operationalized by
multiple indicators (Fornell, 1992).
Swedish Customer Satisfaction Barometer (SCSB), reported in 1989 by Fornell (1992)
was the first national Customer Satisfaction Index (CSI). It was applied to 130 companies
20
from 32 Swedish industries. In 1992, the German customer barometer was introduced.
The study was conducted for 52 industry sectors in Germany (Meyer & Dornach, 1996).
The original SCSB model contained two primary antecedents of satisfaction perceived
performance and customer expectations. These two antecedents were expected to have a
positive effect on satisfaction.
The American Customer Satisfaction Index (ACSI) was developed in 1993. Fornell et al.,
(1996) observed that the ACSI survey was conducted for seven main economic sectors,
35 industries, and more than 200 companies with revenues totaling nearly 40 percent of
the US Gross Domestic Product (GDP). The ACSI model build upon the original SCSB
model specifications adapted in the distinct characteristics of the US economy. The main
differences between the original SCSB model and ACSI model was the addition of a PQ
component, as distinct from PV, and the addition of measures for customer expectations.
The ACSI model predicts that as both PV and PQ increase, customer satisfaction should
also increase (Anderson et al., 1994). There are two fundamental differences between the
ACSI and ECSI models. First, ECSI model does not include the complaint behavior
construct as a consequence of satisfaction. Second, ECSI model incorporates company
image as a latent variable in the model. In ECSI model, company image is expected to
have a direct effect on customer expectations, satisfaction and loyalty (Grigoroudis &
Siskos, 2003).
The first national model, Turkish Customer Satisfaction Index (TCSI), was reported as a
pilot study in the fourth quarter of 2005 by Turkish Quality Association (Kal-Der) and
KA Research Limited. Since, the measurement model of TCSI is same as ACSI model, it
included customer expectations, PQ, PV, customer satisfaction, customer loyalty and
customer complaints constructs. Aydin and Ozer (2005) developed and tested a new
model for Turkish Global System for Mobile (GSM) users. The structural model they
used included some new constructs, such as switching cost, trust, and complaint handling.
They collected the data from 1,662 GSM users in four Turkish cities using a face-to-face
survey. In their study, the model was estimated using maximum likelihood based
covariance structure analysis method namely LISREL. Zaim et al. (2010) concluded that

21
the main influencers of customer satisfaction in the Turkish CSI were, image, perceived
quality, perceived value respectively.
The RASCH Model (RM) has been endorsed by Battisti et al. (2010) as particularly
appropriate when analyzing quality and satisfaction levels together. The RM was first
proposed in the 1960s to evaluate ability tests by Rasch (1960). This technique allows for
the identification of a set of quantitative measures that are invariable and independent of
any subjective and objective traits. The RASCH analysis supplied two sets of coefficients
which allowed for the simultaneous evaluation of the subjective feature related to the
degree of satisfaction and the objective feature related to quality. Instead of the output
being a synthetic measurement of the two aspects, RM provides a score assigned to each
individual and each item along a continuum. Through these scores it is then possible to
carry out descriptive analyses on the sample/population according to the judgments
expressed. These tests were based on a set of items and the assessment of a test subject’s
ability depended on two factors: relative ability and the item’s intrinsic difficulty. In
recent years RM model has been employed in the evaluation of services (De Battisti et
al., 2005); in this context the two factors become the subject’s (the customer’s)
satisfaction and the item’s quality.
Smith et al. (1999) presented the Kanos’ model of customer satisfaction with service
encounter involving service failure and recovery. Using a set of hypotheses, the study
described the effects of service recovery efforts in various failure contexts on customers'
perceptions of justice and judgments of satisfaction. The model provided a framework for
considering how service failure context (type and magnitude) and service recovery
attributes (compensation, response speed, apology, initiation) influenced customer
evaluations through disconfirmation and perceived justice, thereby influencing
satisfaction with the service failure/recovery encounter.
A service failure/recovery encounter can be viewed as an exchange in which the
customer experiences a loss due to the failure and the organization attempts to provide a
gain, in the form of a recovery effort, to make up for the customer's loss. This notion is

22
adapted from social exchange and equity theories (Walster, & Berscheid, 1978). Service
failure/recovery encounters can be considered mixed exchanges with both utilitarian and
symbolic dimensions. Utilitarian exchange involves economic resources, such as money,
goods, or time, whereas symbolic exchange involves psychological or social resources,
such as status, esteem, or empathy (Bagozzi, 1975). A service failure/recovery encounter
is viewed as a series of events in which a service failure triggers a procedure that
generates economic and social interaction between the customer and the organization,
through which an outcome is allocated to the customer.
Kano’s model, demonstrates that for both restaurants and hotels, positive perceptions of
distributive, procedural, and interactional justice significantly enhance customer
satisfaction. As expected, disconfirmation also has a positive and complementary
influence on satisfaction. The results also imply that, in managing relationships with
customers, organizations should consider perceptions of justice, especially after service
failures occur (Smith et al., 1999). In both service contexts, customers were less satisfied
after a process failure than after an outcome failure. This suggests that, in face-to-face
service encounters, process failures (such as inattentive service), which are directly
attributable to the behavior of frontline employees, may detract more from satisfaction
than outcome failures (such as unavailable service), which result from behind-the scenes
events. In the hotel context, the results showed that both compensation and a speedy
response had a greater incremental impact on customers' justice evaluations when the
failure was less severe. The added value of these recovery resources was reduced as the
customer's loss gets larger (the magnitude of the failure increases). This result provided
insight into how customers value recovery efforts, which can help organizations gauge
whether they are unnecessarily overcompensating customers.
2.5 Service Quality and Customer Satisfaction in Universities
The ultimate goal of offering services in public or private is to satisfy customers.
Aldridge and Rowley (1998) suggest that the two concepts, quality and satisfaction, are
related and that a series of transactions leads to perceptions of good quality and hence
customer satisfaction. The concept of service quality covers a broad range of issues in the
23
university context, including the teaching effort of the professors and the overall
experience of the student with the totality of service offered by the university (Joseph and
Joseph, 1997). This calls for an understanding of the quality of teaching, the facilities, the
support staff and the physical evidence of the university.
An examination of service quality in terms of functional and technical quality led Kang
and James (2004) to conclude that the two are antecedent to customer satisfaction. The
quality of teaching has a significant influence on student satisfaction according to
Navarro et al. (2005), who also concluded that overall service quality had a positive
influence on customer satisfaction. Shekarchizadeh et al. (2011) concluded that increased
student dissatisfaction may result from poor service quality. They observed that services
provided by the universities did not match the expectation of international university
student’s leading to dissatisfaction. This empirical evidence shows that service quality
has positive influence on customer satisfaction.
2.6 Measurement of Customer Satisfaction in Universities
Brown and Clignet (2000) observed that institutions of higher learning up to recently
placed insignificant emphasis on evaluating customer satisfaction, viewing the same as a
reserve of commercial enterprises only. According to Kelysey and Bond (2001) the
measurement of customer satisfaction has become a concern of academic institutions and
this observation led them to identify seven factors that explained variations in customer
satisfaction in universities as including customer’s positive experience, commitment of
staff, availability of staff, recommendation of alternative processes, alternative sources of
information by staff, approachability of management and assistance provided by the
centre staff to customers. This study relied on means and standard deviation in analysis,
but descriptive statistics is less appropriate for prediction purposes.
In addition, Navarro et al. (2005) points out that modern university are faced with the
challenge of appearance of professionals who seek to update their knowledge and who,
for these institutions, represent a student with unique needs. Using factor analysis, the
study revealed three major components as comprising, the teaching staff, organization

24
and enrolment. Despite identifying the three, Navarro et al. (2005) failed to recognize
them as service quality dimensions. Smith et al. (2007), evaluated service quality in
universities and concluded that the application of SERVQUAL in the public sector can
produce different results from those found in private sector services but they however did
not examine the strength of relationship between service quality and customer
satisfaction. Becket and Brookes (2008) concluded that many universities rely heavily on
industrial quality models including TQM, European Framework for Quality Management
(EFQM), Balanced Score Card, ISO 9000 and SERVQUAL which they observed had
proved beneficial in addressing quality assurance in administrative functions rather than
in technical service delivery. But they questioned the ability of current management and
leadership in universities to effectively apply the industrial models.
Fronting a performance based paradigm, Sultan and Wong (2010) revealed eight factors
that influence customer satisfaction in Japanese universities as dependability,
effectiveness, capability, efficiency, competencies, assurance, unusual situation
management, and semester syllabus and using SEM, the authors developed PHEd.
However, the study did not undertake a comparative operationalization of this model
between public and private universities. Senthilkumar and Arulraj (2010) generated
SQM-HEI that was used to demonstrate that quality of education was based on the best
faculty, excellent physical resources, having a wide range of disciplines and
employability of the graduates. In SQM-HEI, placement was presented as mediating
factor for various dimensions of quality education. The study however used convenience
and judgmental sampling which limits generalization of the findings.
2.7 Corporate Image and Customer Satisfaction in Universities
In a range of competitive industries, corporate image is presented as a basis of sustainable
competitive advantage. Abd-El-Salam, Shawky and El-Nahas (2013) equate corporate
image to brand equity. Image was presented by Alves and Raposo (2010) as a basis of
competition in higher education institutions. Corporate image was identified as an
important factor in the overall evaluation of a firm (Bitner, 1990) and is argued to be
what comes to the mind of a customer when they hear the name of a firm (Nguyen,

25
2006). Zaim et al. (2010) attested that image was the construct with the greatest influence
on student satisfaction and that institutional image was a relevant determinant of student
loyalty. Thus, if the institutional image rises or falls by a unit, satisfaction increases or
diminishes by the same proportion. University image comprise several components
including academic reputation, campus appearance, cost, personal attention, location,
distance from home, graduate and professional preparation and career placement.
According to Fram (1982), university image is usually seen as a Gestalt (organized
whole) therefore university image is often composed of ideas about faculty, the
curriculum, the teaching quality and the tuition-quality relationship. In order to truly
understand its image, a university should survey current students, alumni and the local
community. In this way, Arpan et al. (2003) found three stable factors influence
university image: academic attributes, athletic attributes and news media coverage but
only academic attributes were consistent across groups.
A favorable image is viewed as a critical aspect of a company’s ability to maintain its
market position, as image has been related to core aspects of organizational success like
customer patronage (Granbois, 1981; Korgaonkar et al., 1985). Studies have found that
university institutional image and reputation strongly affect retention and loyalty
(Nguyen & Leblanc, 2001). After graduating, a satisfied student may continue to support
the academic institution, whether financially or through word of mouth to other
prospective students.
2.8 Service Quality, Corporate Image and Customer Satisfaction
The works of Lehtinen and Lehtinen (1982) integrates physical quality, interactive
quality and corporate (image) quality. This analysis seems to exclude customer
satisfaction, but is supported by the findings of Gronroos (1982) who identified two
service quality dimensions, the technical aspect (“what” service is provided) and the
functional aspect (“how” the service is provided). Putting the works of the two authors
together led to the emergence of the European perspective to service quality
encompassing three dimensions, technical, functional, and image.

26
Noting that a lot of studies have been done to examine the relationship between service
quality and customer satisfaction, Kang and James (2004) observed that limited literature
exist to link service quality, image and customer satisfaction. They proposed a conceptual
schema linking functional quality, technical quality to image and customer satisfaction.
They argued that several studies focus on the linkage between the functional service
quality and customer satisfaction and fail to examine the effect of technical quality. Kang
and James (2004) affirmed the multidimensionality of service quality, particularly the
fact that SERVQUAL was incomplete and they demonstrated that image strengthens the
relationship between service quality perception and customer satisfaction. Despite this
empirical evidence of the linkage between service quality, image and customer
satisfaction, the study failed to clearly explain the construct of technical quality of
services attributing this shortfall to lack of previous literature.
In relating service quality, customer satisfaction and image, Nguyen and LeBlanc (1998)
indicated that satisfaction and service quality are positively related to value and that
quality exerts a stronger influence on value than satisfaction. Their findings also showed
that customers receiving higher levels of service quality will form a favorable image of
an institution. The authors however deduced that research on the concept of corporate
image had focused mainly on tangible goods producing firms and that little work had
been reported on customer’s image assessment in services.
2.9 Summary of Knowledge Gaps
The review of literature reveals a number of gaps as shown in Table 2.1. While literature
points at emphasis of the disconfirmation paradigm, this study adopted a perception
paradigm. Although several dimensions of service quality have been pointed out in
literature, this study sought to examine their significance in explaining changes in
customer satisfaction in universities. The limited effort to link service quality and
university image to customer satisfaction led this study to hypothesize that service quality
and image were antecedents to customer satisfaction.
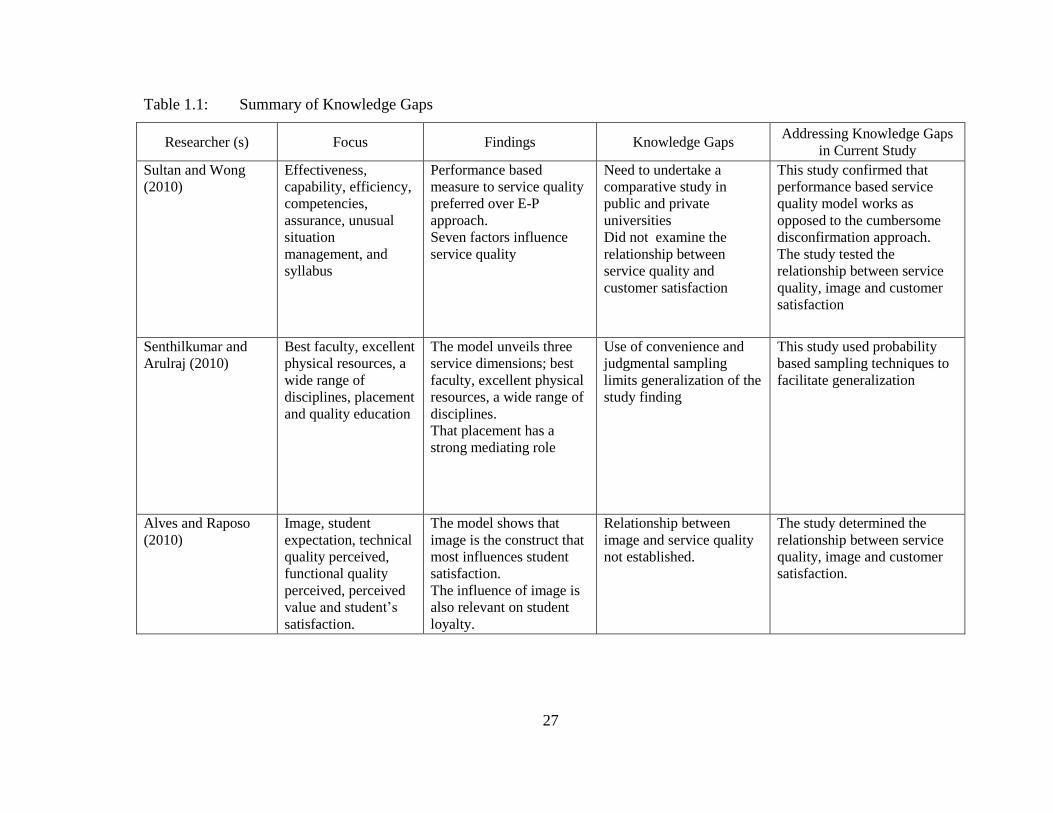
27
Table 1.1: Summary of Knowledge Gaps
Researcher (s) Focus Findings Knowledge Gaps Addressing Knowledge Gaps
in Current Study
Sultan and Wong
(2010)
Effectiveness,
capability, efficiency,
competencies,
assurance, unusual
situation
management, and
syllabus
Performance based
measure to service quality
preferred over E-P
approach.
Seven factors influence
service quality
Need to undertake a
comparative study in
public and private
universities
Did not examine the
relationship between
service quality and
customer satisfaction
This study confirmed that
performance based service
quality model works as
opposed to the cumbersome
disconfirmation approach.
The study tested the
relationship between service
quality, image and customer
satisfaction
Senthilkumar and
Arulraj (2010)
Best faculty, excellent
physical resources, a
wide range of
disciplines, placement
and quality education
The model unveils three
service dimensions; best
faculty, excellent physical
resources, a wide range of
disciplines.
That placement has a
strong mediating role
Use of convenience and
judgmental sampling
limits generalization of the
study finding
This study used probability
based sampling techniques to
facilitate generalization
Alves and Raposo
(2010)
Image, student
expectation, technical
quality perceived,
functional quality
perceived, perceived
value and student’s
satisfaction.
The model shows that
image is the construct that
most influences student
satisfaction.
The influence of image is
also relevant on student
loyalty.
Relationship between
image and service quality
not established.
The study determined the
relationship between service
quality, image and customer
satisfaction.
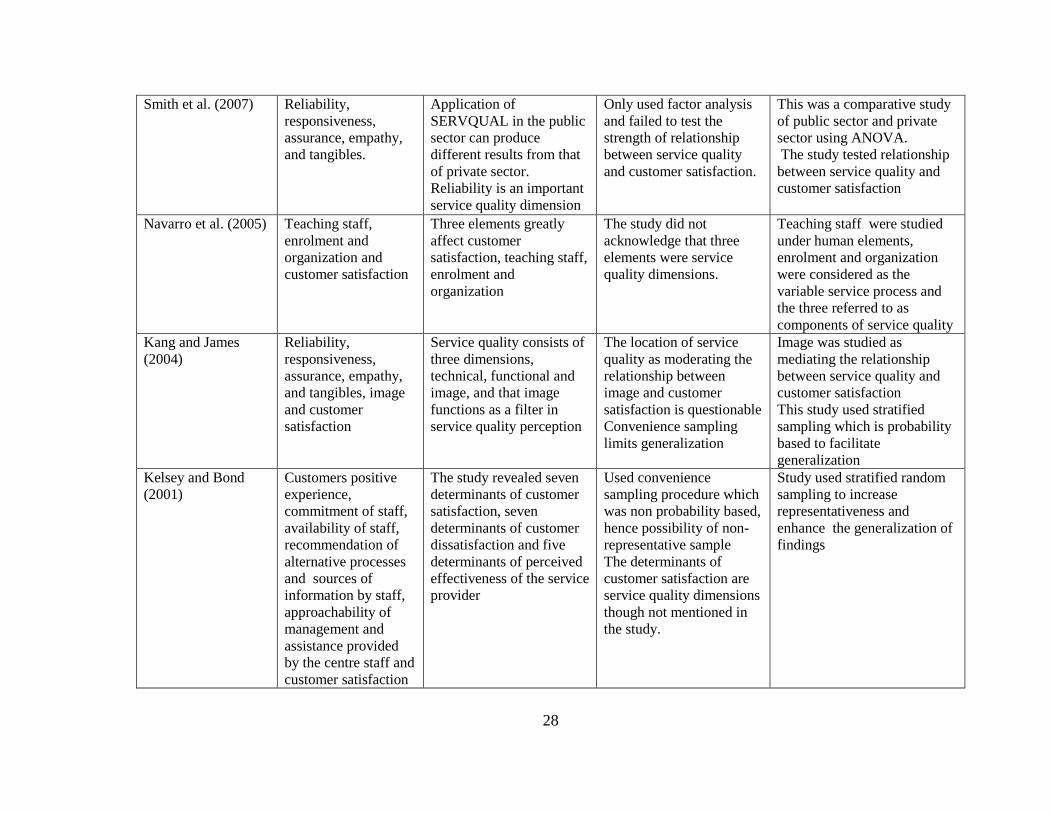
28
Smith et al. (2007) Reliability,
responsiveness,
assurance, empathy,
and tangibles.
Application of
SERVQUAL in the public
sector can produce
different results from that
of private sector.
Reliability is an important
service quality dimension
Only used factor analysis
and failed to test the
strength of relationship
between service quality
and customer satisfaction.
This was a comparative study
of public sector and private
sector using ANOVA.
The study tested relationship
between service quality and
customer satisfaction
Navarro et al. (2005)
Teaching staff,
enrolment and
organization and
customer satisfaction
Three elements greatly
affect customer
satisfaction, teaching staff,
enrolment and
organization
The study did not
acknowledge that three
elements were service
quality dimensions.
Teaching staff were studied
under human elements,
enrolment and organization
were considered as the
variable service process and
the three referred to as
components of service quality
Kang and James
(2004)
Reliability,
responsiveness,
assurance, empathy,
and tangibles, image
and customer
satisfaction
Service quality consists of
three dimensions,
technical, functional and
image, and that image
functions as a filter in
service quality perception
The location of service
quality as moderating the
relationship between
image and customer
satisfaction is questionable
Convenience sampling
limits generalization
Image was studied as
mediating the relationship
between service quality and
customer satisfaction
This study used stratified
sampling which is probability
based to facilitate
generalization
Kelsey and Bond
(2001)
Customers positive
experience,
commitment of staff,
availability of staff,
recommendation of
alternative processes
and sources of
information by staff,
approachability of
management and
assistance provided
by the centre staff and
customer satisfaction
The study revealed seven
determinants of customer
satisfaction, seven
determinants of customer
dissatisfaction and five
determinants of perceived
effectiveness of the service
provider
Used convenience
sampling procedure which
was non probability based,
hence possibility of non-
representative sample
The determinants of
customer satisfaction are
service quality dimensions
though not mentioned in
the study.
Study used stratified random
sampling to increase
representativeness and
enhance the generalization of
findings
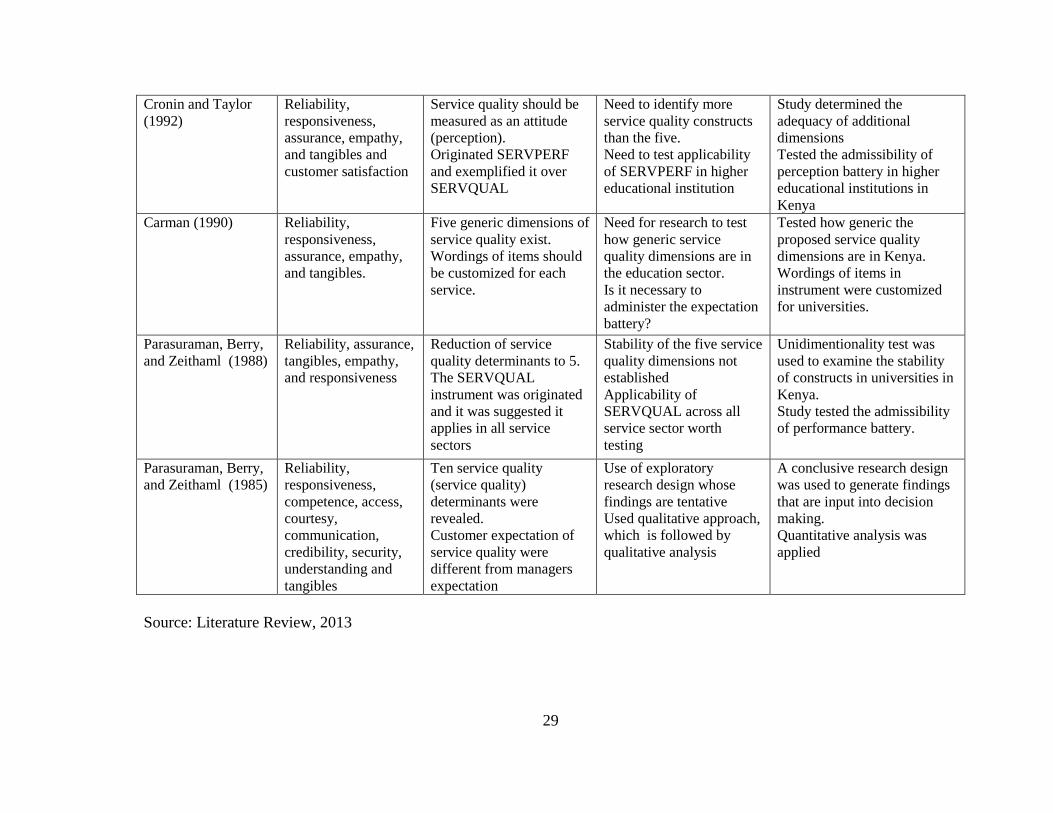
29
Cronin and Taylor
(1992)
Reliability,
responsiveness,
assurance, empathy,
and tangibles and
customer satisfaction
Service quality should be
measured as an attitude
(perception).
Originated SERVPERF
and exemplified it over
SERVQUAL
Need to identify more
service quality constructs
than the five.
Need to test applicability
of SERVPERF in higher
educational institution
Study determined the
adequacy of additional
dimensions
Tested the admissibility of
perception battery in higher
educational institutions in
Kenya
Carman (1990)
Reliability,
responsiveness,
assurance, empathy,
and tangibles.
Five generic dimensions of
service quality exist.
Wordings of items should
be customized for each
service.
Need for research to test
how generic service
quality dimensions are in
the education sector.
Is it necessary to
administer the expectation
battery?
Tested how generic the
proposed service quality
dimensions are in Kenya.
Wordings of items in
instrument were customized
for universities.
Parasuraman, Berry,
and Zeithaml (1988)
Reliability, assurance,
tangibles, empathy,
and responsiveness
Reduction of service
quality determinants to 5.
The SERVQUAL
instrument was originated
and it was suggested it
applies in all service
sectors
Stability of the five service
quality dimensions not
established
Applicability of
SERVQUAL across all
service sector worth
testing
Unidimentionality test was
used to examine the stability
of constructs in universities in
Kenya.
Study tested the admissibility
of performance battery.
Parasuraman, Berry,
and Zeithaml (1985)
Reliability,
responsiveness,
competence, access,
courtesy,
communication,
credibility, security,
understanding and
tangibles
Ten service quality
(service quality)
determinants were
revealed.
Customer expectation of
service quality were
different from managers
expectation
Use of exploratory
research design whose
findings are tentative
Used qualitative approach,
which is followed by
qualitative analysis
A conclusive research design
was used to generate findings
that are input into decision
making.
Quantitative analysis was
applied
Source: Literature Review, 2013
30
2.10 Conceptual Framework
The study adopted the conceptual framework in Figure 2. In the framework, the
independent variables and the mediating variable were precursors to the dependent
variable. The conceptual schema identified service quality as the independent variable
and corporate image as the mediating variable, while customer satisfaction was the
dependent variable.
Instead of examining only one direct causal relationship between service quality and
customer satisfaction, the proposed meditational model hypothesized that the independent
variable (service quality) influenced the mediator variable (corporate image) which in
turn influenced the dependent variable (customer satisfaction). A mediating variable is
one that links an independent variable and a dependent variable. It was further proposed
that a mediating variable had a strong influencing effect on the relationship between
independent variables and the dependent variable.
Corporate image is the net result of the combined experiences, impressions, beliefs,
feelings and knowledge that people have about a company. These subtle elements send
strong signals towards improving the organizations image and consequently influence
customer satisfaction. Customer satisfaction is achieved when service quality meets
customer needs, makes customers re-buy and makes customers display willingness to tell
others.
Initially, the study proposed four dimensions of service quality; human elements, non-
human elements, service blueprint and core service. Human element was a construct
coined to recapitulate the aspects of service delivery strongly driven by the activities of
the boundary spanners during the service encounter and included reliability,
responsiveness, assurance and empathy. Non-human elements referred to the physical
evidence in service environment. Service blueprint defined the procedures, systems and
technology that would make a service a seamless one. The core service was encapsulated
as the “content” of a service and it portrayed the “what” of a service, meaning the service
product was whatever feature that was offered in a service.
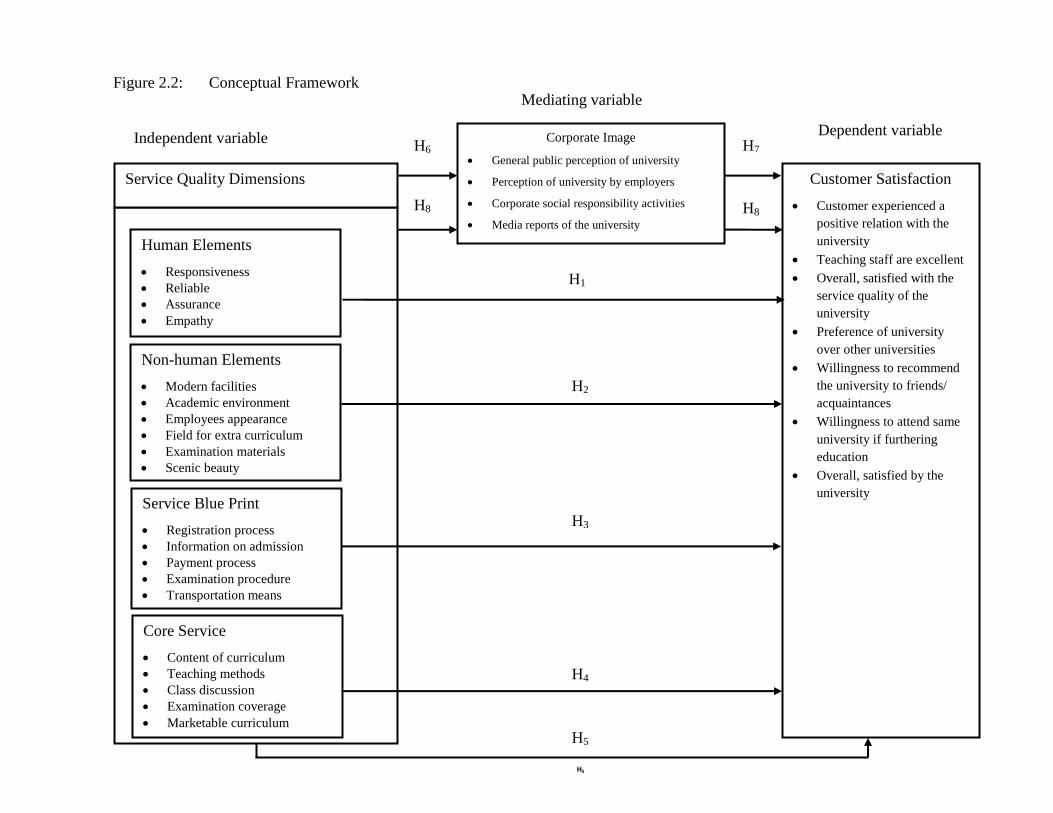
31
H2
H7
H3
H6
Non-human Elements
Modern facilities
Academic environment
Employees appearance
Field for extra curriculum
Examination materials
Scenic beauty
Human Elements
Responsiveness
Reliable
Assurance
Empathy
Service Blue Print
Registration process
Information on admission
Payment process
Examination procedure
Transportation means
Core Service
Content of curriculum
Teaching methods
Class discussion
Examination coverage
Marketable curriculum
Corporate Image
General public perception of university
Perception of university by employers
Corporate social responsibility activities
Media reports of the university
Customer Satisfaction
Customer experienced a
positive relation with the
university
Teaching staff are excellent
Overall, satisfied with the
service quality of the
university
Preference of university
over other universities
Willingness to recommend
the university to friends/
acquaintances
Willingness to attend same
university if furthering
education
Overall, satisfied by the
university
Service Quality Dimensions
H1
H4
H5
H5
H8
Figure 2.2: Conceptual Framework
Conceptual Framework
H8
Independent variable
Mediating variable
Dependent variable
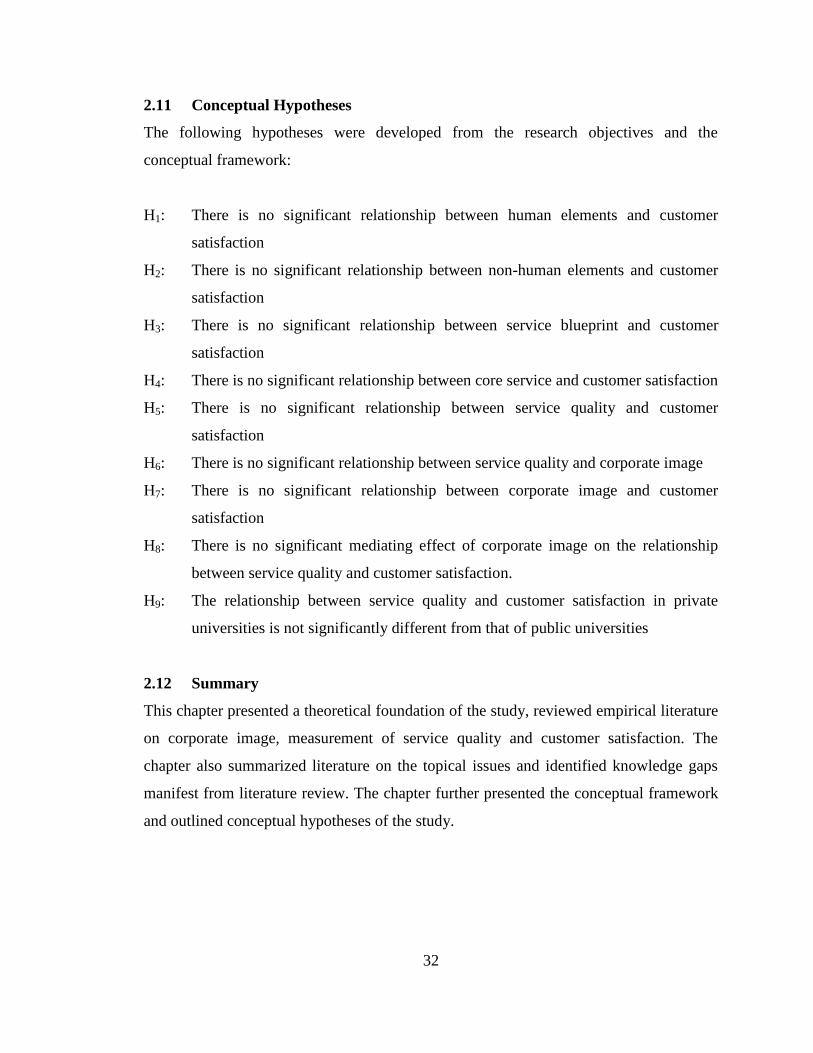
32
2.11 Conceptual Hypotheses
The following hypotheses were developed from the research objectives and the
conceptual framework:
H1: There is no significant relationship between human elements and customer
satisfaction
H2: There is no significant relationship between non-human elements and customer
satisfaction
H3: There is no significant relationship between service blueprint and customer
satisfaction
H4: There is no significant relationship between core service and customer satisfaction
H5: There is no significant relationship between service quality and customer
satisfaction
H6: There is no significant relationship between service quality and corporate image
H7: There is no significant relationship between corporate image and customer
satisfaction
H8: There is no significant mediating effect of corporate image on the relationship
between service quality and customer satisfaction.
H9: The relationship between service quality and customer satisfaction in private
universities is not significantly different from that of public universities
2.12 Summary
This chapter presented a theoretical foundation of the study, reviewed empirical literature
on corporate image, measurement of service quality and customer satisfaction. The
chapter also summarized literature on the topical issues and identified knowledge gaps
manifest from literature review. The chapter further presented the conceptual framework
and outlined conceptual hypotheses of the study.

33
CHAPTER THREE
RESEARCH METHODOLOGY
3.1 Introduction
The methodology adopted in this study provided a design that empirically addresses the
identified research problem and recaps how the study results can be replicated,
generalised and employed in prediction for effective decision making. The methodology
adopted describes the population, sampling procedure, instrumentation and data
collection approach used. It allowed for description of the influence of service quality and
corporate image on customer satisfaction among university students in Kenya.
3.2 Research Philosophy
Research philosophy is the underlying assumptions and intellectual structure upon which
research in a field of inquiry is based. Sobh and Perry (2006) posit that the paradigm
employed by a researcher is antecedent to the choice of research methodology and the
types of questions to be asked. Guba and Lincoln (1994) identified three elements of a
paradigm; ontology, epistemology and methodology. Essentially, ontology is “reality”,
epistemology is the relationship between the reality and the researcher and methodology
is the technique used by the researcher to discover that reality. The key ontological
feature under the positivist paradigm is that the researcher and reality are separate. The
term epistemology comes from the Greek word episteme meaning knowledge.
Researchers are overly concerned with the choice between a quantitative and a qualitative
methodology. Essentially, quantitative researchers use numbers and large samples to test
theories, while qualitative researchers use words and meanings in smaller samples to
build theories (Easterby-Smith et al., 1991). Consistent with the positivist approach, this
study adopted quantitative research in examining the variable and in testing the
relationship between service quality, corporate image and customer satisfaction. Despite
the numerous merits of positivist philosophy, Guba and Lincoln (1994) report that
positivism has been critiqued for its exclusion of the discovery dimensions in inquiry and
the under-determination of theory.
34
The current study adopted a positivist paradigm with an epistemological element because
this approach allowed for reporting of findings as observed, explanation of the new
knowledge discovered and assured of independence of the researcher from the study.
Positivism emerged as a philosophical paradigm in the 19th century with Auguste
Comte’s rejection of metaphysics and his assertion that only scientific knowledge can
reveal the truth about reality (Descartes, 1998).
According to the positivist epistemology, science is seen as the way to get at truth, to
understand the world well enough so that it might be predicted and controlled. The world
and the universe are deterministic; they operate by laws of cause and effect that are
discernible if the unique approach of scientific method is applied. Thus, science is largely
a mechanistic or mechanical affair in positivism. In line with deductive reasoning, the
study focused on facts looked for causality and fundamental laws supporting the causality
formulated research hypotheses and tested the hypotheses for their validation and
subsequent generalization.
3.3 Research Design
The study employed a descriptive cross sectional survey. This survey methodology
conforms to the research works of Kabagambe, Ogutu, and Munyoki (2012), Nyaribo,
Prakash and Owino (2012) and Awino (2011). According to Sultan and Wong (2010), a
descriptive survey design allows for quantitative description of the antecedents of service
quality in a higher education context. Awino (2011) contends that this approach places
high priority on identifying linkages between and amongst variables. This research design
allowed for generalization of the sample survey findings to the population of university
students in Kenya. Kang and James (2004) cite empirical literature as evidence that attest
to the use of quantitative survey methods in examining functional quality of services.
Aldridge and Rowley (1998) applied the survey methodology in measuring customer
satisfaction in higher education and exemplified the method for producing consistent
results on a longitudinal basis.
35
Cross sectional design was used to examine the association between service quality,
corporate image and customer satisfaction. The appropriateness of this design also
anchored on its versatility, admissibility of questionnaires and its leverage in collection of
data from a large number of respondents in a relatively short period. In view of the
aforementioned research problem and the selected research philosophy, a descriptive
survey was considered the most suitable for achieving the research objectives.
3.4 Target Population
The population of interest comprised students in public and private universities in Kenya.
According to CUE (2013), Kenya has 20 public universities and 29 private universities as
shown in Appendix 4. The unit of analysis in this study was registered degree students in
the public and private universities. The degree students were preferred because they are
the universities immediate customers who experience the service provided by the
institution and are therefore best placed to answer questions on their perceived service
experience at the university, a position also supported by Navarro et al. (2005). The target
population comprised of undergraduate students in three public universities and three
private universities, who according to CHE (2011), were 56,977.
The study was undertaken in the following public universities, University of Nairobi,
Kenyatta University and Jomo Kenyatta University of Agriculture and Technology
(JKUAT). The private universities considered in the study were; Strathmore University,
United States International University (USIU) and Kenya College of Accountancy (now
KCA University). These universities were selected from the list in Appendix 4 on the
premise that they had the most visible image (see ranking in Appendix 4a) and had the
largest number of students in the 2009/2010 academic year (Appendix 4c). These
universities were therefore more likely to address the variables of interest to the study in
terms of service quality, university corporate image and customer satisfaction.
3.5 Sample and Sampling Procedure
Determining the optimal sample size for a study assures an adequate power to detect
statistical significance. The study adopted a stratified random sampling procedure. From
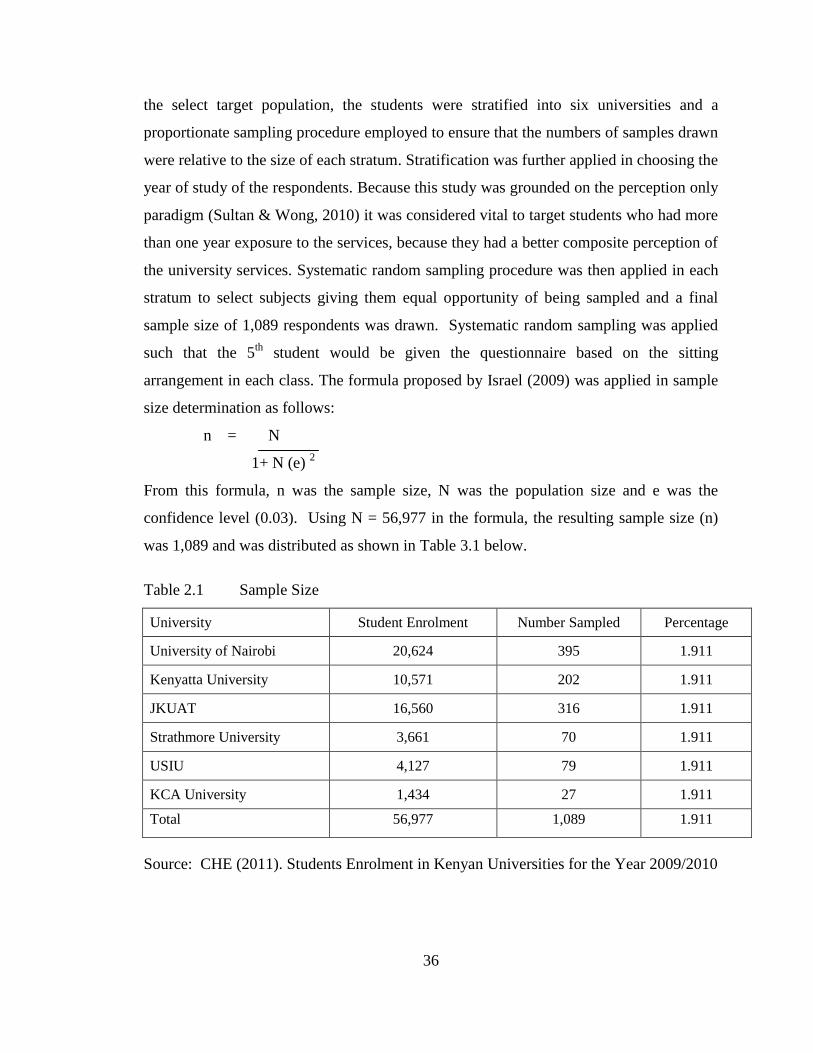
36
the select target population, the students were stratified into six universities and a
proportionate sampling procedure employed to ensure that the numbers of samples drawn
were relative to the size of each stratum. Stratification was further applied in choosing the
year of study of the respondents. Because this study was grounded on the perception only
paradigm (Sultan & Wong, 2010) it was considered vital to target students who had more
than one year exposure to the services, because they had a better composite perception of
the university services. Systematic random sampling procedure was then applied in each
stratum to select subjects giving them equal opportunity of being sampled and a final
sample size of 1,089 respondents was drawn. Systematic random sampling was applied
such that the 5th
student would be given the questionnaire based on the sitting
arrangement in each class. The formula proposed by Israel (2009) was applied in sample
size determination as follows:
n = N
1+ N (e) 2
From this formula, n was the sample size, N was the population size and e was the
confidence level (0.03). Using N = 56,977 in the formula, the resulting sample size (n)
was 1,089 and was distributed as shown in Table 3.1 below.
Table 2.1 Sample Size
University Student Enrolment Number Sampled Percentage
University of Nairobi 20,624 395 1.911
Kenyatta University 10,571 202 1.911
JKUAT 16,560 316 1.911
Strathmore University 3,661 70 1.911
USIU 4,127 79 1.911
KCA University 1,434 27 1.911
Total 56,977 1,089 1.911
Source: CHE (2011). Students Enrolment in Kenyan Universities for the Year 2009/2010

37
3.6 Data Collection
The study collected both primary and secondary data. A survey questionnaire (Appendix
3) was used to collect primary data. The questionnaire had four sections; the first section
profiled the respondents to generate background information, the second section collected
data on university service quality dimensions, the third section sought data on university
corporate image and the fourth section sought data on customer satisfaction with the
university service. The questionnaire had multiple choice questions and Likert scale
questions. The structured questions were preferred because they minimized response
variation, took less time to code and transcribe and they led to increased response rate.
The questionnaire in Appendix 3, unlike instruments used in past studies had three
additional items; core service, service process, and corporate image. Most item wordings
were modified to suit the study context as propounded by Carman (1990).
The variables in the instrument fell on the ordinal and interval measurement scale. The
ordinal scale ensured the variables were mutually exclusive and collectively exhaustive
of each category of response as well as that they exhibited the property of order. Because
ordinal scales only allowed for interpretation of gross order and not the relative positional
distances, an interval scale was then used to ensure order, equidistant points between
each of the scale elements and mutual exclusivity of each category (Malhotra, 2010). The
rating scale used was a 5 point Likert type scale, where 1 was set for not at all and 5 set
for very large extent (Appendix 3).
The questionnaires were self-administered to selected students in different classes per
university. Year one students were 45, year two students were 285, year three students
were 326 and year four students were 94 as detailed in Table 4.4. The students were
requested to take twenty minutes to answer questions after which the questionnaires were
collected and tallied to ensure that all the questionnaires were returned. This method of
data collection increased response rate, provided confidentiality, allowed for clarification
of difficult questions, and enhanced the control of data collection process by the
researcher. Prior to data collection, approval was sought from the university authorities
(Appendix 2).
38
Secondary data from published sources on service quality, corporate image and customer
satisfaction were obtained from peer reviewed academic journals. Information was also
obtained from Special Government reports including; Sessional papers on higher
education, Economic surveys, Vision 2030 and the Constitution of Kenya 2010.
Additional information was sought from CUE, the Ministry of Education, Science and
Technology and the National Treasury.
3.7 Reliability and Validity of the Study
The questionnaire was subjected to a validity and reliability test. Reliability and validity
are tools of an essentially positivist epistemology (Watling, as cited in Winter, 2000). The
relevant literature indicates divergence in the definitions of reliability and validity on the
grounds that reliability tests show whether the result is replicable while validity tests
show how accurate the means of measurement is and whether they are actually measuring
what they are intended to measure. A validity test shows the extent to which a measure or
a set of measures correctly represents the concept of the study (Buttle, 1995). Golafshani
(2003) points out that validity determines whether the research truly measures that which
it was intended to measure or how truthful the research results are. In other words, does
the research Instrument allow you to hit "the bull’s eye" of your research object?
The data collected was subjected to a reliability test. Field (2005) interprets a Cronbach’s
α greater than or equal to 0.7 as implying the instrument provides a relatively good
measurement tool hence reliable. The 77 items in the study instrument and the resulting
data collected from the 750 cases (respondents) were subjected to Cronbach’s alpha test.
The resulting reliability statistics reflected α value = 0.972, which meant the instrument
on service quality, corporate image and customer satisfaction used in this study was very
reliable. As a measure of criterion related validity or instrumental validity, the reliability
of this instrument was compared to related studies. Sultan and Wong (2010) used an
instrument with alpha (α) = 0.8462 and considered it reliable. While Ling and Lih (2005)
interpreted an overall Cronbach’s α = 0.8339 as reliable in examining the relationship
between service quality and customer preferences. The instrument in Appendix 3

39
therefore met the requirements of criterion related validity that requires that, the
instrument to be used in a study demonstrates accuracy of a measure or procedure by
being comparable with another measure or procedure which has been demonstrated to be
valid.
Two validity tests were assessed; face validity test and internal construct validity. A pilot
survey was conducted to test the face validity of the study instrument. The questionnaire
was administered to 10 university students and they were asked to make any comments
on questions or terms which were unclear or ambiguous. The questionnaire was adjusted
and administered to 6 experts (university scholars, researchers and industry experts in
marketing). Their feedback was used to remove vague questions, double barreled
questions and to improve the research instrument that was then adopted in the survey.
The study tested for internal validity as detailed in chapter four. Internal construct
validity was indicated if the same items that reflect a factor in one study load on the same
factor on replication.
3.8 Operationalization of Study Variables
The variables were measured using performance based attitudinal items. The use of
performance based attitudinal items has been validated by Cronin and Taylor (1992),
Abdullah (2006) and Sultan and Wong (2010) in originating the PHEd model. In this
study there was one independent variable, service quality, defined by human elements,
non-human elements, service blueprint and core service. Corporate image was a
mediating variable and the study had one dependent variable (customer satisfaction).
Appendix 6 presents comprehensive operationalization of the study variables.
3.9 Data Analysis
Data analysis proceeded in three steps; data preparation, data analysis and reporting.
Computer statistical packages were employed in undertaking four types of statistical
analysis; descriptive analysis, factor analysis, hierarchical regression and one way
ANOVA. The background information in the questionnaire was subjected to descriptive
statistical analysis to provide a profile of the respondents. Using cross tabulation,
40
correlation analysis and Chi square test of independence of association, the study sought
to establish the existence of significant association between respondent profile, service
quality variables and customer satisfaction. A one way between groups ANOVA test was
performed to test if there were significant difference in factors that define service quality
and subsequently influence customer satisfaction between private and public universities
(H9). The Levine’s homogeneity of variance test with a p-value less than or equal to
0.000 was interpreted to mean the ANOVA test results were significant and the study
would reject H9.
Exploratory Factor Analysis (EFA) was used to identify the main factors that defined
service quality and variance explained by the identified factors. The aim of EFA was to
explain the matrix of correlations with as few factors as possible (Cheruiyot, Jagongo &
Owino, 2012). The output of the descriptive statistics, communalities, correlation matrix,
Kaiser-Meyer-Olkin (KMO) measure of sampling adequacy and Bartlett’s Test of
sphericity were adopted as pretest condition to EFA. Factor analysis was undertaken in
two stages namely Principal Component Analysis (PCA) and varimax with Kaiser
Normalization method.
Hierarchical regression analysis was then used to examine the relationship between the
resulting factors and the dependent variables in both private and public universities. The
study assumed a linear relationship between the predictors and dependent variables and
adopted the Ordinary Least Squares (OLS) method of estimation in examining the
relationship between the predictor, mediating and dependent variables. To test for the
mediating effect (H8) of corporate image on the relationship between service quality and
customer satisfaction, three regression equations were estimated using OLS as suggested
by Baron and Kelly (1986) and Shaver (2005). The mediating role was examined by
undertaking a first and second order test of the proposed equation. Where customer
satisfaction was the dependent variable of interest, while service quality was the
independent variable of interest.

41
3.10 Summary
A confirmation of existence of a significant relationship between service quality, image
and customer satisfaction by the study bridged the knowledge gap left by authors who
overtime study these variables in isolation or in pairs. Triangulation of theoretical
perspective, empirical studies and the outcome of the study on the three constructs
rejuvenates service manager’s appreciation of customer’s assessment of a services offer.
Introduction of corporate image inculcates branding in customer satisfaction analysis.

42
CHAPTER FOUR
DATA ANALYSIS AND DISCUSSION OF THE RESULTS
4.1 Introduction
This chapter presents an analysis of the data collected and the study findings. Data
analysis was undertaken in three steps; data preparation, data analysis and reporting as
recommended by Malhotra (2010). After field work, the data was prepared by checking
the questionnaires, editing, coding, transcribing and cleaning the data. The data was
analyzed using Statistical Package for Social Sciences (SPSS). The transcribed data was
subjected to data cleaning using descriptive statistics as evidenced in Appendix 8. No
outliers and errors were apparent from the data, and the data set was considered clean for
analysis.
The study undertook four statistical tests, descriptive statistical analysis, factor analysis,
one way ANOVA test and regression analysis. Descriptive statistics was used to describe
the study variables particularly the sample profile. Factor analysis was used to
decompose the large number of variables into a set of core underlying factors. The
ANOVA test was used to examine the existence of significant differences in service
quality dimensions between public and private university students. Regression analysis
was used to test the research hypotheses, determine the existence of a significant
relationship between the variables under study and to ascertain the predictive power of
service quality on customer satisfaction.
4.2 Response Rate
A total of 1089 questionnaires were administered in six universities (three public and
three private) out of which 763 were returned resulting in a 70.06 percent response rate
which was considered adequate. Following the data editing process, 750 questionnaires
were found usable. The final sample size adopted in this study was therefore 750
respondents. In similar studies of institutions of higher learning, Abdullah (2006)
administered 560 questionnaires and found 381 usable, Sultan and Wong (2010)
considered a sample size of 365 adequate and Shekarchizadeh et al. (2011) used 522
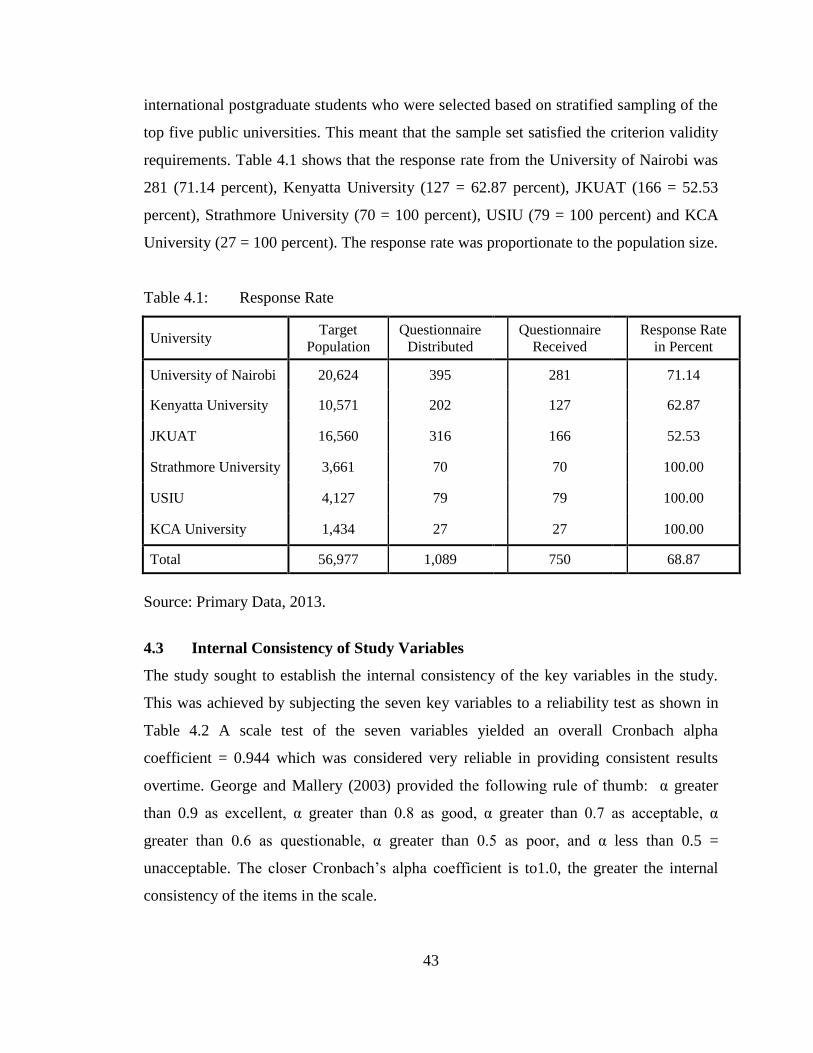
43
international postgraduate students who were selected based on stratified sampling of the
top five public universities. This meant that the sample set satisfied the criterion validity
requirements. Table 4.1 shows that the response rate from the University of Nairobi was
281 (71.14 percent), Kenyatta University (127 = 62.87 percent), JKUAT (166 = 52.53
percent), Strathmore University (70 = 100 percent), USIU (79 = 100 percent) and KCA
University (27 = 100 percent). The response rate was proportionate to the population size.
Table 4.1: Response Rate
University Target
Population
Questionnaire
Distributed
Questionnaire
Received
Response Rate
in Percent
University of Nairobi 20,624 395
281
71.14
Kenyatta University 10,571 202
127
62.87
JKUAT 16,560 316
166
52.53
Strathmore University 3,661 70
70
100.00
USIU 4,127 79
79
100.00
KCA University 1,434 27
27
100.00
Total 56,977 1,089
750
68.87
Source: Primary Data, 2013.
4.3 Internal Consistency of Study Variables
The study sought to establish the internal consistency of the key variables in the study.
This was achieved by subjecting the seven key variables to a reliability test as shown in
Table 4.2 A scale test of the seven variables yielded an overall Cronbach alpha
coefficient = 0.944 which was considered very reliable in providing consistent results
overtime. George and Mallery (2003) provided the following rule of thumb: α greater
than 0.9 as excellent, α greater than 0.8 as good, α greater than 0.7 as acceptable, α
greater than 0.6 as questionable, α greater than 0.5 as poor, and α less than 0.5 =
unacceptable. The closer Cronbach’s alpha coefficient is to1.0, the greater the internal
consistency of the items in the scale.

44
The inter-item correlation matrix in Table 4.2 shows no negative value, implying all the
items are measuring the same underlying characteristics. The presence of negative
variables would have indicated that in the process of questionnaire design, some of the
questions were reversed, but were not correctly reverse scored in the transcription stage
(George & Mallery, 2003).
Table 4.2: Inter-Item Correlation Matrix
Variable Human
Elements
Non-
Human
Elements
Service
Blue
Core
Service
Service
Quality
Corporate
Image
Customer
Satisfaction
Human
Elements 1.000
Non-Human
Elements .774 1.000
Service Blue
Print .626 .643 1.000
Core Service .750 .696 .684 1.000
Service
Quality .938 .911 .767 .832 1.000
Corporate
Image .666 .686 .662 .633 .759 1.000
Customer
Satisfaction .698 .624 .652 .679 .748 .715 1.000
Source: Primary Data, 2013.
Table 4.3 shows what the Cronbach's alpha value would be if a particular item was
deleted from the scale. It shows that the removal of any one item would result in alpha
value greater than 0.9, but the removal of the items service quality would reduce the
Cronbach's alpha to its lowest (α = 0.924). Given that Cronbach's Alpha if item deleted
for all the seven items was greater than 0.7, none of the items was deleted from analysis
and the seven items in the study were inferred to have excellent internal consistency and
could therefore be successfully replicated using a similar methodology.
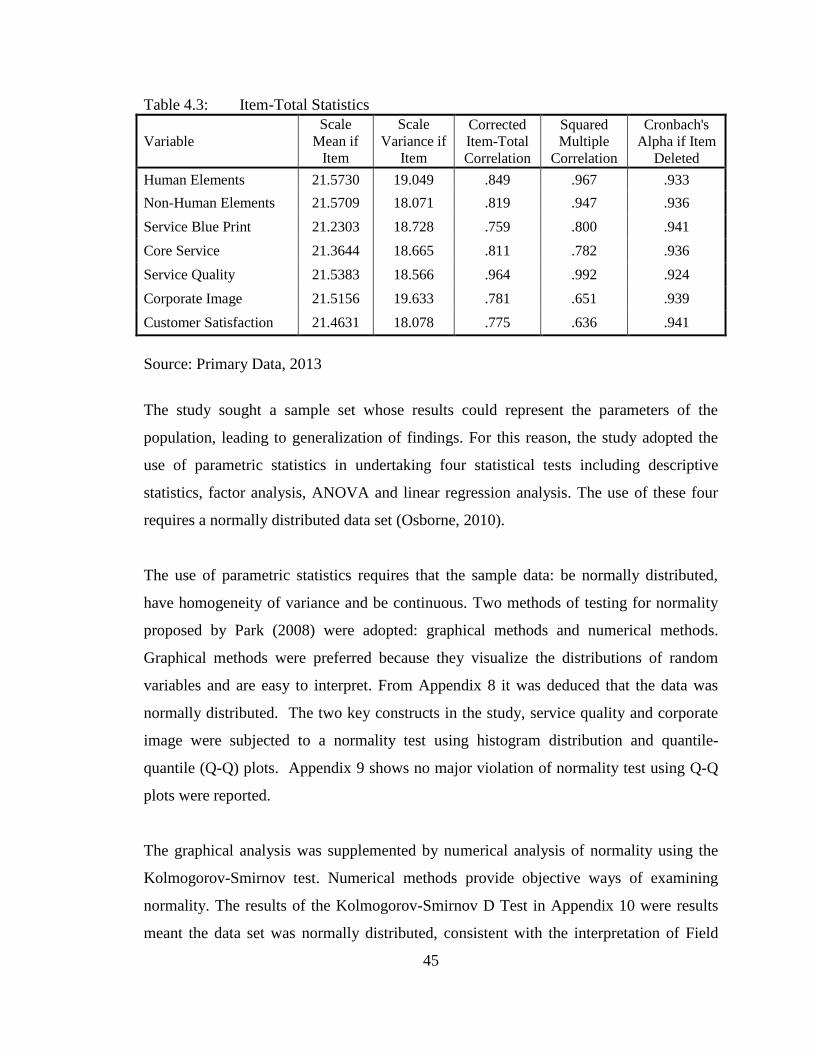
45
Table 4.3: Item-Total Statistics
Variable
Scale
Mean if
Item
Deleted
Scale
Variance if
Item
Deleted
Corrected
Item-Total
Correlation
Squared
Multiple
Correlation
Cronbach's
Alpha if Item
Deleted
Human Elements 21.5730 19.049 .849 .967 .933
Non-Human Elements 21.5709 18.071 .819 .947 .936
Service Blue Print 21.2303 18.728 .759 .800 .941
Core Service 21.3644 18.665 .811 .782 .936
Service Quality 21.5383 18.566 .964 .992 .924
Corporate Image 21.5156 19.633 .781 .651 .939
Customer Satisfaction 21.4631 18.078 .775 .636 .941
Source: Primary Data, 2013
The study sought a sample set whose results could represent the parameters of the
population, leading to generalization of findings. For this reason, the study adopted the
use of parametric statistics in undertaking four statistical tests including descriptive
statistics, factor analysis, ANOVA and linear regression analysis. The use of these four
requires a normally distributed data set (Osborne, 2010).
The use of parametric statistics requires that the sample data: be normally distributed,
have homogeneity of variance and be continuous. Two methods of testing for normality
proposed by Park (2008) were adopted: graphical methods and numerical methods.
Graphical methods were preferred because they visualize the distributions of random
variables and are easy to interpret. From Appendix 8 it was deduced that the data was
normally distributed. The two key constructs in the study, service quality and corporate
image were subjected to a normality test using histogram distribution and quantile-
quantile (Q-Q) plots. Appendix 9 shows no major violation of normality test using Q-Q
plots were reported.
The graphical analysis was supplemented by numerical analysis of normality using the
Kolmogorov-Smirnov test. Numerical methods provide objective ways of examining
normality. The results of the Kolmogorov-Smirnov D Test in Appendix 10 were results
meant the data set was normally distributed, consistent with the interpretation of Field
46
(2009). Because the test did not reject normality, the study proceeded to adopt parametric
procedures that assume normality.
4.4 Demographic Profile of University Students
The demographic profile of the respondents in Table 4.4 shows a majority of the
respondents were in public universities (75.9 percent) with the private universities
representing 24.1 percent of the sample. This meant that despite privatization of higher
education, public universities, which are partly sponsored by the government, still
dominate the industry.
It was observed that amongst the respondents, 54.4 percent were males and 45.6 percent
were females, indicating that there were more male students accessing university
education as compared to their female counterparts, a clear evidence of gender disparity
in universities in Kenya. Most of the respondents (43.5 percent) were in their third year
of study, followed by 38.0percent who were in their second year of study according to
Table 4.4. This sample set was most appropriate for the study, because the second and
third year students had repeated exposure to university education. Having adopted the
performance only paradigm (Cronin & Taylor, 1992), a measure of service quality based
on performance only, it was necessary to get respondents who had repeatedly been
exposed to the service performance and who had over the years formed a composite
service quality perception of the service provider.
In Table 4.4, most of the students surveyed (48.9 percent) were SSS, with 42.5 percent of
the respondents indicating that they were sponsored by the government. The SSS paid
for their tuition fees, catered for their meals and accommodation amongst other needs.
These groups of students were either working or getting support from parents, siblings or
guidance. Navarro (2005) posits that the new brand of students seeking university
education largely comprise of professionals who are returning to universities in order to
update their knowledge or acquire more technical skills for job related functions. This
market segment has specific needs, is more willing to pay if service offered meet their
needs or result in satisfaction.
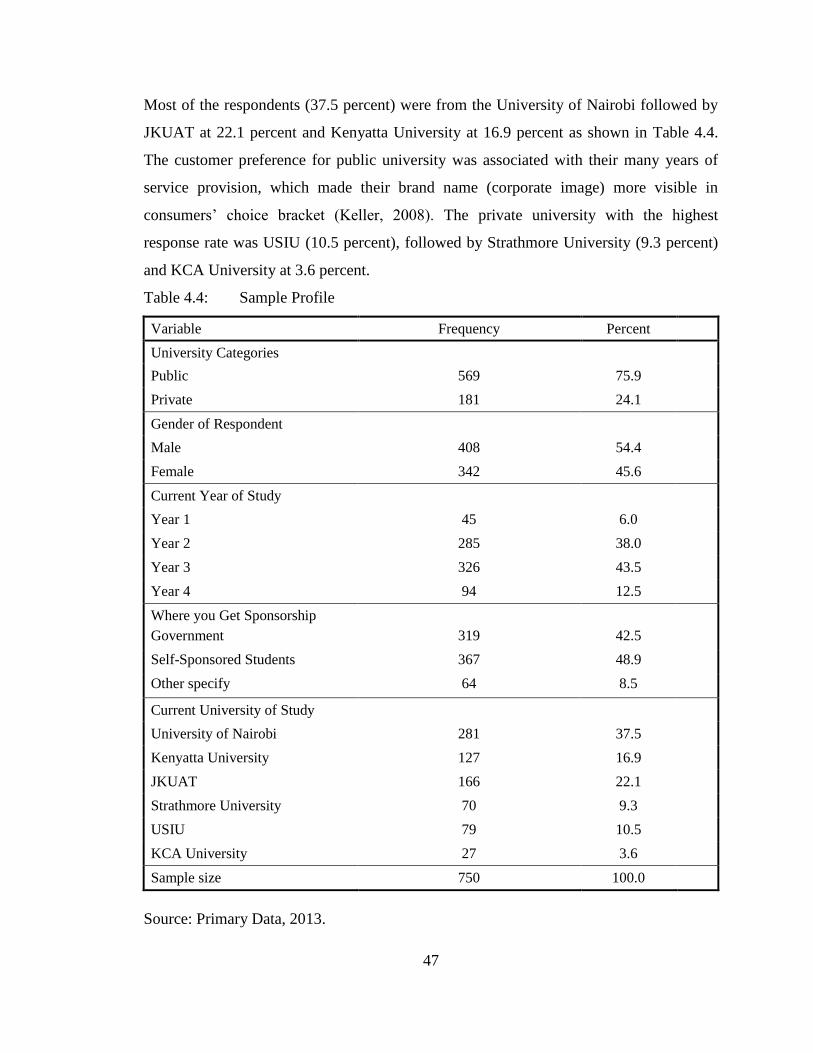
47
Most of the respondents (37.5 percent) were from the University of Nairobi followed by
JKUAT at 22.1 percent and Kenyatta University at 16.9 percent as shown in Table 4.4.
The customer preference for public university was associated with their many years of
service provision, which made their brand name (corporate image) more visible in
consumers’ choice bracket (Keller, 2008). The private university with the highest
response rate was USIU (10.5 percent), followed by Strathmore University (9.3 percent)
and KCA University at 3.6 percent.
Table 4.4: Sample Profile
Variable Frequency Percent
University Categories
Public 569 75.9
Private 181 24.1
Gender of Respondent
Male 408 54.4
Female 342 45.6
Current Year of Study
Year 1 45 6.0
Year 2 285 38.0
Year 3 326 43.5
Year 4 94 12.5
Where you Get Sponsorship
Government 319 42.5
Self-Sponsored Students 367 48.9
Other specify 64 8.5
Current University of Study
University of Nairobi 281 37.5
Kenyatta University 127 16.9
JKUAT 166 22.1
Strathmore University 70 9.3
USIU 79 10.5
KCA University 27 3.6
Sample size 750 100.0
Source: Primary Data, 2013.

48
The study sought to establish an understanding of the existence of a significant
relationship between demographic data and the dependent variable (customer
satisfaction). To achieve this, three statistical tests were done: correlation analysis, cross
tabulation and Chi-Square test for independence. The correlation results are presented in
Table 4.5 and Pearson correlation coefficient (r) used to determine the level of
significance of the bivariate relationships (demography and customer satisfaction).
Coopers and Schindler (2003) posit that when the correlation coefficient (r) = ±1.00,
there is a perfect positive or negative correlation between the variables. When r = 0.01 it
shows a very weak relationship and r = 0.9 indicates a very strong correlation between
the variables. When r = 0 it shows that there is no relationship between the variables.
A correlation was considered significant when the probability value was equal to or
below 0.05 (p-value less than or equal to 0.05). Uwalomwa, and Olamide, (2012)
interpreted r = 0.4 as a weak positive relationship. Table 4.5 displays several significant
relationships between the demographic variables and customer satisfaction. First,
university category had a significant positive relationship (p = 0.000, r = 0.245) with
customer satisfaction at the 0.01 level in a 2-tailed test.
Second, university category had a significant positive relationship (p = 0.000, r = 0.099)
with current university of study at the 0.01 level in a two tailed test. The relationship
between university category and where student get sponsorship was significant (p =
0.006, r = 0.245) at the 0.01 level in a two tailed test. University category had a
significant positive relationship (p = 0.003, r = 0.109) with gender of respondent at the
0.01 level in a 2-tailed test.
The relationship between gender of respondent and where student get sponsorship was
significant (p = 0.013, r = 0.091) at the 0.05 level in a two tailed test. Gender also had a
significant correlation (p = 0.024, r = 0.083) with current university of study at the 0.05
level in a two tailed test. The source of sponsorship had a significant positive relationship
(p = 0.001, r = 0.116) with customer satisfaction at the 0.01 level in a two tailed test.

49
This findings show that the dependent variable was significantly related to two
demographic factors, university category and where you get your sponsorship. This
meant that the level of student satisfaction in Kenyan university was positively correlated
to the university category and availability of sponsorship. The current university of study
had significant relationship with university category, gender of respondents and where
student gets sponsorship.
Table 4.5: Correlation of Demographic Profile and Customer Satisfaction
Source: Primary Data, 2013.
To examine the strength of associations between the bivariate categorical variables, cross
tabulation and a Chi-Square test for independence was done. Table 4.6 shows a Chi-
Variable Pearson Statistics
University
Category
Gender of
Respondent
Current
Year of
Study
Where you
Get
Sponsorship
Current
University
of Study
Customer
Satisfaction
University
Category
Pearson Correlation 1
Significance(2-tailed)
Sample Size 750
Gender of
Respondent
Pearson Correlation .109**
1
Significance(2-tailed) 0.003
Sample Size 750 750
Current Year
of Study
Pearson Correlation 0.099**
0.038 1
Significance(2-tailed) 0.006 0.294
Sample Size 750 750 750
Where do
you Get
Sponsorship
Pearson Correlation 0.379**
0.091* 0.029 1
Significance(2-tailed) 0 0.013 0.435
Sample Size 750 750 750 750
Current
University of
Study
Pearson Correlation 0.810**
0.083* 0.113
** 0.355
** 1
Significance(2-tailed) 0 0.024 0.002 0
Sample Size 750 750 750 750 750
Customer
Satisfaction
Pearson Correlation .245**
-0.016 0.066 0.116**
0.06 1
Significance(2-tailed) 0 0.667 0.071 0.001 0.101
Sample Size 744 744 744 744 744 744
**. Correlation is significant at the 0.01 level (2-tailed).
*. Correlation is significant at the 0.05 level (2-tailed).
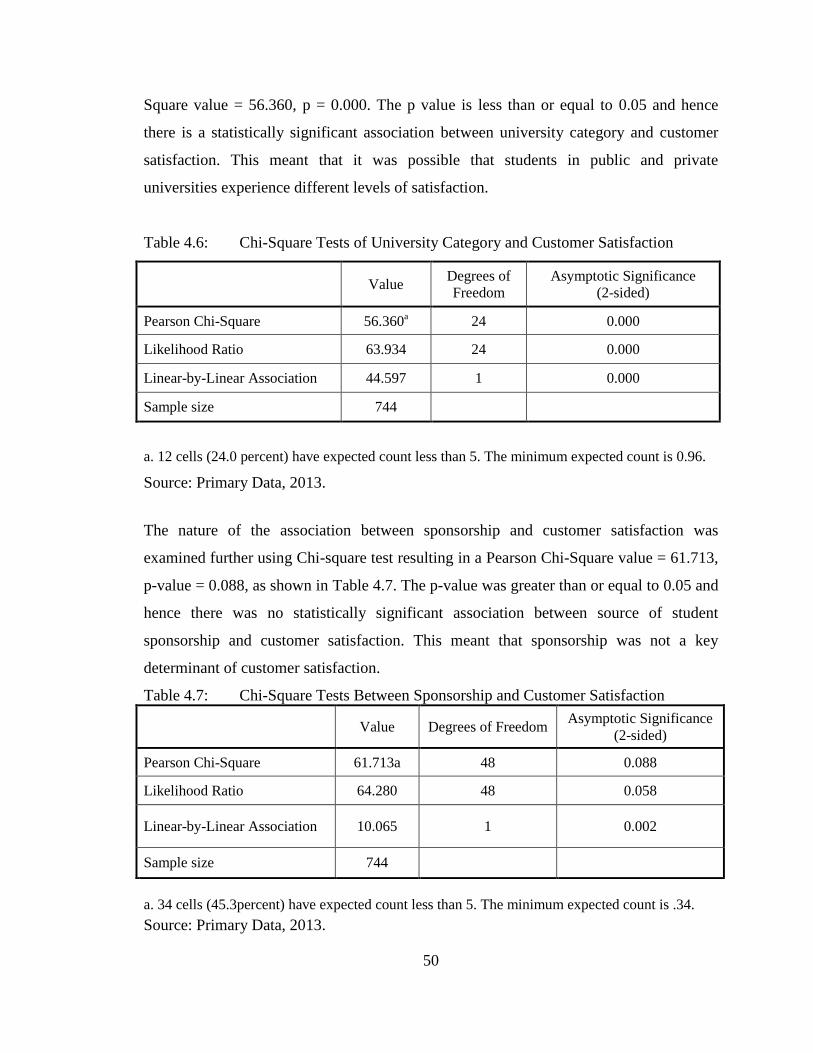
50
Square value = 56.360, p = 0.000. The p value is less than or equal to 0.05 and hence
there is a statistically significant association between university category and customer
satisfaction. This meant that it was possible that students in public and private
universities experience different levels of satisfaction.
Table 4.6: Chi-Square Tests of University Category and Customer Satisfaction
Value
Degrees of
Freedom
Asymptotic Significance
(2-sided)
Pearson Chi-Square 56.360a 24 0.000
Likelihood Ratio 63.934 24 0.000
Linear-by-Linear Association 44.597 1 0.000
Sample size 744
a. 12 cells (24.0 percent) have expected count less than 5. The minimum expected count is 0.96.
Source: Primary Data, 2013.
The nature of the association between sponsorship and customer satisfaction was
examined further using Chi-square test resulting in a Pearson Chi-Square value = 61.713,
p-value = 0.088, as shown in Table 4.7. The p-value was greater than or equal to 0.05 and
hence there was no statistically significant association between source of student
sponsorship and customer satisfaction. This meant that sponsorship was not a key
determinant of customer satisfaction.
Table 4.7: Chi-Square Tests Between Sponsorship and Customer Satisfaction
Value Degrees of Freedom
Asymptotic Significance
(2-sided)
Pearson Chi-Square 61.713a 48 0.088
Likelihood Ratio 64.280 48 0.058
Linear-by-Linear Association 10.065 1 0.002
Sample size 744
a. 34 cells (45.3percent) have expected count less than 5. The minimum expected count is .34.
Source: Primary Data, 2013.
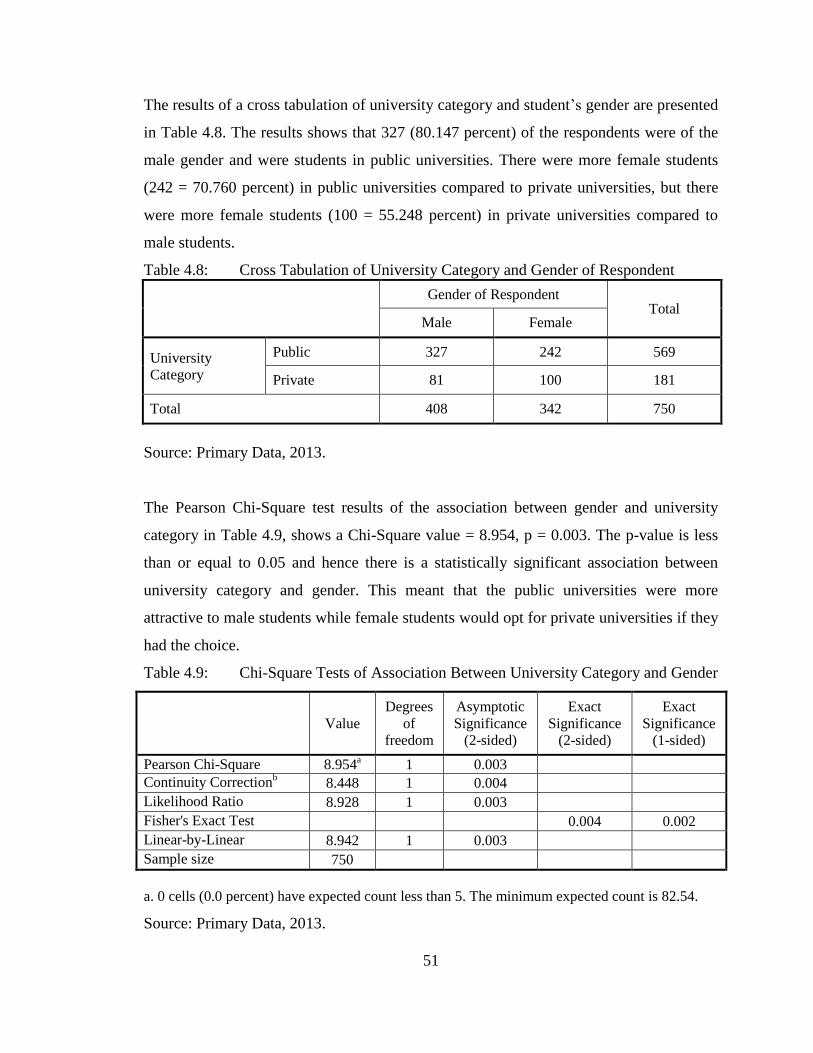
51
The results of a cross tabulation of university category and student’s gender are presented
in Table 4.8. The results shows that 327 (80.147 percent) of the respondents were of the
male gender and were students in public universities. There were more female students
(242 = 70.760 percent) in public universities compared to private universities, but there
were more female students (100 = 55.248 percent) in private universities compared to
male students.
Table 4.8: Cross Tabulation of University Category and Gender of Respondent
Gender of Respondent
Total Male Female
University
Category
Public 327 242 569
Private 81 100 181
Total 408 342 750
Source: Primary Data, 2013.
The Pearson Chi-Square test results of the association between gender and university
category in Table 4.9, shows a Chi-Square value = 8.954, p = 0.003. The p-value is less
than or equal to 0.05 and hence there is a statistically significant association between
university category and gender. This meant that the public universities were more
attractive to male students while female students would opt for private universities if they
had the choice.
Table 4.9: Chi-Square Tests of Association Between University Category and Gender
Value
Degrees
of
freedom
Asymptotic
Significance
(2-sided)
Exact
Significance
(2-sided)
Exact
Significance
(1-sided)
Pearson Chi-Square 8.954a 1 0.003
Continuity Correctionb 8.448 1 0.004
Likelihood Ratio 8.928 1 0.003
Fisher's Exact Test 0.004 0.002
Linear-by-Linear
Association 8.942 1 0.003
Sample size 750
a. 0 cells (0.0 percent) have expected count less than 5. The minimum expected count is 82.54.
Source: Primary Data, 2013.
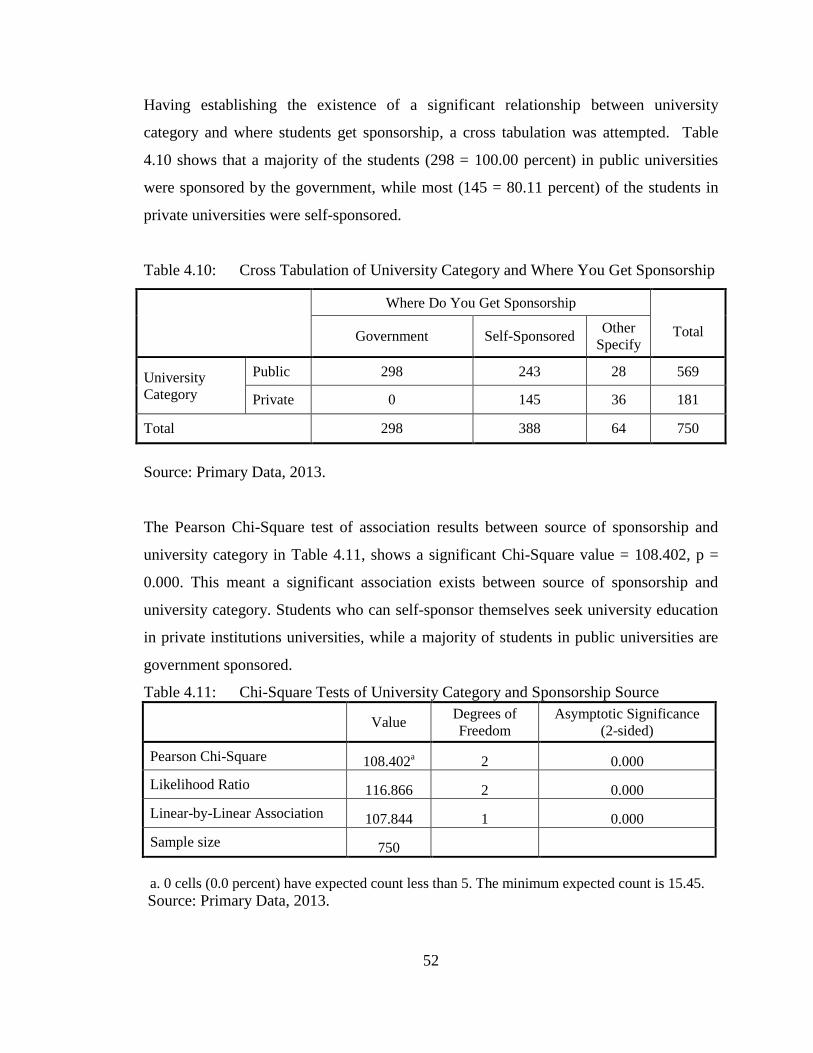
52
Having establishing the existence of a significant relationship between university
category and where students get sponsorship, a cross tabulation was attempted. Table
4.10 shows that a majority of the students (298 = 100.00 percent) in public universities
were sponsored by the government, while most (145 = 80.11 percent) of the students in
private universities were self-sponsored.
Table 4.10: Cross Tabulation of University Category and Where You Get Sponsorship
Where Do You Get Sponsorship
Total Government Self-Sponsored Other
Specify
University
Category
Public 298 243 28 569
Private 0 145 36 181
Total 298 388 64 750
Source: Primary Data, 2013.
The Pearson Chi-Square test of association results between source of sponsorship and
university category in Table 4.11, shows a significant Chi-Square value = 108.402, p =
0.000. This meant a significant association exists between source of sponsorship and
university category. Students who can self-sponsor themselves seek university education
in private institutions universities, while a majority of students in public universities are
government sponsored.
Table 4.11: Chi-Square Tests of University Category and Sponsorship Source
Value Degrees of
Freedom
Asymptotic Significance
(2-sided)
Pearson Chi-Square 108.402a 2 0.000
Likelihood Ratio 116.866 2 0.000
Linear-by-Linear Association 107.844 1 0.000
Sample size 750
a. 0 cells (0.0 percent) have expected count less than 5. The minimum expected count is 15.45.
Source: Primary Data, 2013.
53
4.5 Factors Influencing Customer Satisfaction in Universities in Kenya
The study employed factor analysis, a multivariate technique used to reduce a large
number of variables or objects to a set of core underlying factors. The 77 items in the
instrument were decomposed into a few factors with related factor scores that explained
the variations in the observed variables. Factor analysis was used to determine the
number of dimensions required to represent service quality. The EFA method was used to
determine service quality dimensions in universities in Kenya. The EFA was undertaken
in five key steps; preliminary analysis, assessment of suitability of data for factor analysis
(pretest), factor extraction, factor rotation and factor interpretation. Preliminary EFA led
to the generation of the following statistical outputs: descriptive statistics, correlation
matrix, communalities, KMO measure of sampling adequacy and Bartlets Test of
sphericity, total variance explained, scree plot and component matrix.
The descriptive statistics in Appendix 15 shows the mean, standard deviation and the
number of respondents (n) in the combined data. The mean column shows that, “I am
likely to complete my course in time” had the highest mean = 4.12, followed by “I
believe the university gives quality education” with a mean = 4.09, “I feel safe in this
learning environment” with a mean = 4.04, “the university conserves the environment”
with a mean = 4.03 and “I choose this university because it has good reputation” with a
mean = 4.03. From the descriptive statistics these were the variables with the greatest
influence on service quality perception of students because they had the highest mean
scores.
A correlation matrix was used to examine correlation coefficients between a single
variable and every other variable in the data set. Since one of the goals of factor analysis
is to obtain factors that explain these correlations, the variables must be related to each
other for the factor model to be appropriate. The Pearson correlation showed p-values
=0.000 but less than 0.05 and r values greater than 0.1 but less than 0.9. Pallant (2010)
recommends r value greater than or equal to 0.3 but less than 0.9. This meant the data set
did not have singularity problem and therefore no variable was eliminated from analysis.

54
The communalities associated with the combined university data set are displayed in
Appendix 17 and shows that the least communality value was 0.403 associated with the
variable, “I selected this university because it has a strong brand name” and the variable
with the highest communality was, “the university staff have the customer’s best interest
at heart” (0.743). This indicated that the variables fitted well with each other.
The data was initially subjected to two pretest requirements of factor analysis, KMO
measure of sampling adequacy and Bartlett’s test of sphericity. The KMO test statistics of
0.965 was established as shown in Appendix 20. Kaiser (1974) recommends accepting
KMO values greater than 0.5 as acceptable. But Hutcheson and Sofroniu (1999) as
referenced in Field (2010) posit that KMO values between 0.5 and 0.7 are mediocre,
values between 0.7 and 0.8 are good, values between 0.8 and 0.9 are great and values
above 0.9 are superb, hence the value 0.965 was adequate in this study. Bartlett's test was
used to test the strength of the relationship among variables. The study tested the null
hypothesis that the variables were uncorrelated using the Bartlett's Test of Sphericity. The
p-value = 0.000 was significant and less than the threshold of 0.05 (Tabachnick and
Fidell, 2007) and therefore the null hypothesis was rejected meaning the variables in the
population correlation matrix were uncorrelated.
The initial solution was determined using PCA method. This was a two stage method
comprising unrotated solution and a rotated solution. The PCA was preferred because it
allowed for reduction of the data set to a more manageable size while retaining as much
of the original information. The unrotated solution in Table 4.12 shows a total of 66
components out of which 11 components explained 60.555 percent of the variations
leaving 39.445 percent of the variations to be explained by the other 55 components.
Using Kaiser’s criterion, the study sought variables with eigenvalues greater than or
equal to 1. The first eleven components had eigenvalues greater than or equal to 1 and
accounted for 60.555 percent of the variations, with component 1 accounting for 23.543
percent of the variations, component 2 explained 3.279 percent of the variations and
component 3 explained 2.533 percent of the variations. Therefore based on the total
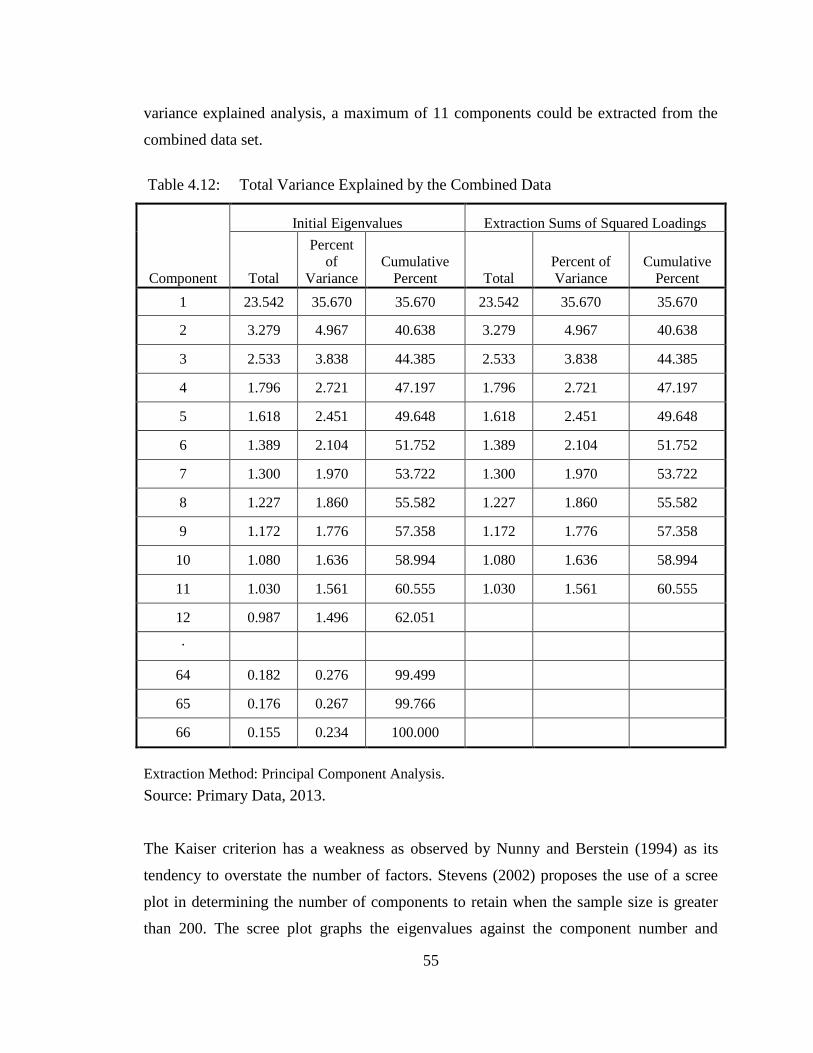
55
variance explained analysis, a maximum of 11 components could be extracted from the
combined data set.
Table 4.12: Total Variance Explained by the Combined Data
Component
Initial Eigenvalues Extraction Sums of Squared Loadings
Total
Percent
of
Variance
Cumulative
Percent Total
Percent of
Variance
Cumulative
Percent
1 23.542 35.670 35.670 23.542 35.670 35.670
2 3.279 4.967 40.638 3.279 4.967 40.638
3 2.533 3.838 44.385 2.533 3.838 44.385
4 1.796 2.721 47.197 1.796 2.721 47.197
5 1.618 2.451 49.648 1.618 2.451 49.648
6 1.389 2.104 51.752 1.389 2.104 51.752
7 1.300 1.970 53.722 1.300 1.970 53.722
8 1.227 1.860 55.582 1.227 1.860 55.582
9 1.172 1.776 57.358 1.172 1.776 57.358
10 1.080 1.636 58.994 1.080 1.636 58.994
11 1.030 1.561 60.555 1.030 1.561 60.555
12 0.987 1.496 62.051
.
.
.
64 0.182 0.276 99.499
65 0.176 0.267 99.766
66 0.155 0.234 100.000
Extraction Method: Principal Component Analysis.
Source: Primary Data, 2013.
The Kaiser criterion has a weakness as observed by Nunny and Berstein (1994) as its
tendency to overstate the number of factors. Stevens (2002) proposes the use of a scree
plot in determining the number of components to retain when the sample size is greater
than 200. The scree plot graphs the eigenvalues against the component number and
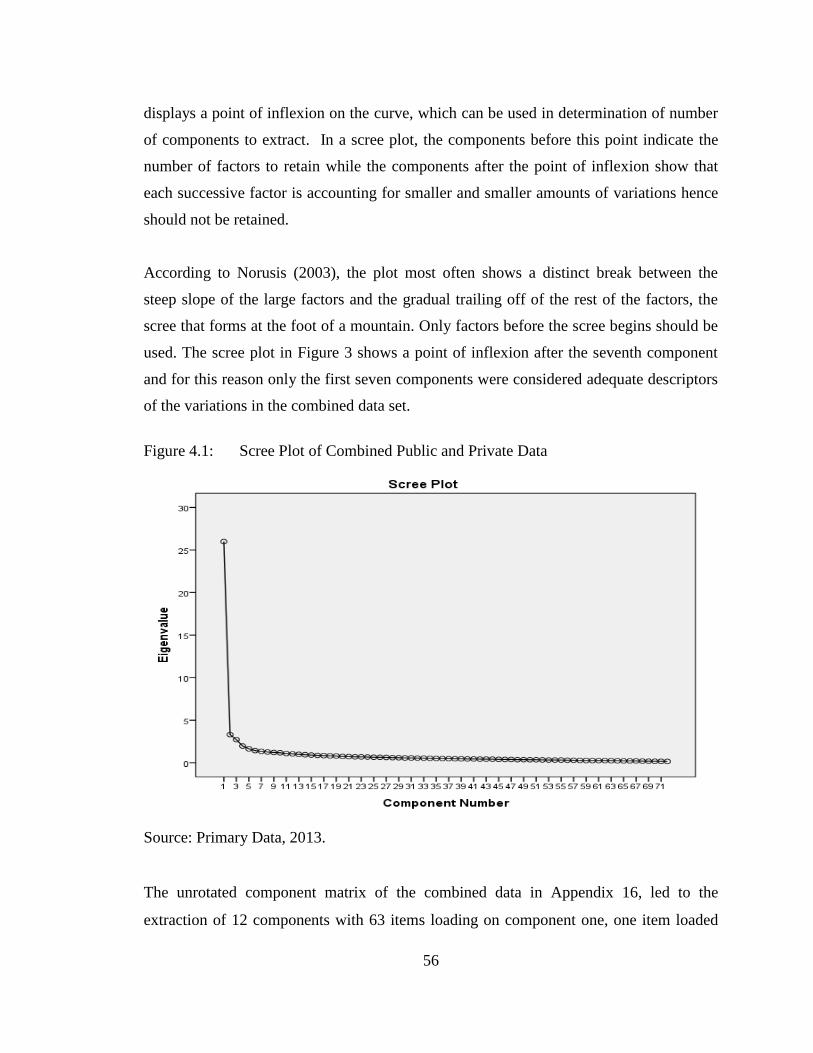
56
displays a point of inflexion on the curve, which can be used in determination of number
of components to extract. In a scree plot, the components before this point indicate the
number of factors to retain while the components after the point of inflexion show that
each successive factor is accounting for smaller and smaller amounts of variations hence
should not be retained.
According to Norusis (2003), the plot most often shows a distinct break between the
steep slope of the large factors and the gradual trailing off of the rest of the factors, the
scree that forms at the foot of a mountain. Only factors before the scree begins should be
used. The scree plot in Figure 3 shows a point of inflexion after the seventh component
and for this reason only the first seven components were considered adequate descriptors
of the variations in the combined data set.
Figure 4.1: Scree Plot of Combined Public and Private Data
Source: Primary Data, 2013.
The unrotated component matrix of the combined data in Appendix 16, led to the
extraction of 12 components with 63 items loading on component one, one item loaded
57
on components two, seven and eight each. No items loaded on components three, five,
six, seven, 10 and 11 which meant they remained unexplained. This necessitated factor
rotation to explain the components which had not been explained by the initial extraction.
Scholars including Matsunaga (2010), Camrey and Lee (1992) and Gorsuch (1983)
acknowledge the lack of consensus in literature on the cutoff point for factor loading but
they propose using a cut off of 0.4.
A varimax with Kaiser normalization rotation method revealed a seven component
structure as shown in Table 4.13. The original 77 items in the instrument had been
reduced to 61 items that loaded on the seven components. Most of the items loaded on
the first two components, meaning they explained the variations to a great extent.
Component one had 14 items loading on it with the item, “my lecturers display
competence in teaching” reflecting the highest factor loading of 0.726, followed by “the
conduct of my lectures instill confidence in me” (0.705), “my lecturers are approachable
and willing to help me” (0.701), “my lecturers have experience in academic research”
(0.651) and “I believe the university gives quality education” (0.626). Table 4.13 details
other variables that loaded on component one. The 14 items converged on the factor
human elements. Given the multidimensionality of human elements, the factor was
interpreted as the reliability dimension of human elements.
A set of 14 items loaded on component two. The item that explained the greatest
variations in component two were, “the university staff are quick at responding to my
queries” (0.708), “the university staff are always willing to help me” (0.668) “the
university staff are always courteous” (0.644), “university is dependable in handling my
service problems” (0.586) and “the university staff have the customers best interest at
heart” (0.570) as shown in Table 4.13. The 14 items that loaded on component two were
interpreted as the factor human elements responsiveness dimension.
A total of nine items loaded on component three. The greatest variations in component
three was explained by the items “the university has attractive and conducive lecture
halls” (0.753), followed by “the university has a neat and well stocked library facility”
58
(0.744), “the university has sufficient computers” (0.688), “the lecturers use modern
equipment’s in class like LCD and video” (0.618) and “the academic environments is
conducive for learning” (0.606). A close examination of the 9 items led to their
interpretation as the factor non-human elements or physical evidence.
Out of the15 items in the instrument, 11 loaded on component four, as shown in Table
4.13. “I choose this university because it has good reputation”, had the highest factor
loading at 0.671, followed by “this university makes a lot of contribution to the society”
(0.609), “I selected this university because it has qualified lecturers” (0.577), “this
university is preferred by my peers, friends and relatives” (0.576) and “employers have a
positive perception towards this university” (0.533). The 11 items were interpreted as the
factor university corporate image.
Component five had eight items loading on it. The item with the highest factor loading
was, “I am well informed of the examination procedures” (0.679) followed by “the
process followed to register as a student is adequate” (0.618), “I am well informed of the
university rules and regulation” (0.595), “the process followed to get admission to the
university is clear” (0.554), “the new student orientation process is informative” (0.547),
“the process of making payment to the university is convenient” (0.514), “the
registration materials are visually appealing” (0.508), and “the examination materials are
visually appealing” (0.455). The five items were interpreted as the factor service blue
print.
Four items loaded on component six as shown in Table 4.13. “I was introduced to the
university by an alumni” explained the greatest variation (0.628), followed by “the
university has conducive accommodation facilities” (0.538), “the university has
conducive facilities for extra curriculum” (0.491), “a relative referred me to the
university” (0.419). The four items were interpreted as the factor university corporate
image referrals. Two items loaded on component seven, with the item “our examination
results are published at the right time” (0.610) followed by the item “our examinations
start at the right time” 0.608. The two items were interpreted as the factor human
59
elements assurance of assessment. The study established seven constructs under EFA that
are precursors to customer satisfaction in Kenyan universities as shown in Table 4.13.
The seven were human elements reliability dimension, human elements responsiveness
dimension, non-human elements (physical evidence), corporate image, service blue print,
corporate image (referrals) and human elements responsiveness assurance of assessment.
No items loaded on the dimension core service, instead the variables that had been
conceptualized as the concept core service loaded on reliability dimension of human
elements and hence core service was dropped from further analysis.
In order to establish the reliability of the seven constructs extracted following the EFA
process, the items that loaded on each construct were transformed into seven new
variables and labeled human elements reliability dimension, human elements
responsiveness dimension, non-human elements (physical evidence), corporate image,
service blue print, corporate image (referrals) and human elements responsiveness
assurance of assessment. Following the transformation process, the constructs were
subjected to a scale test using the Cronbach’s alpha method, resulting in an overall scale
of α = 0.912 for the 7 items as shown in Table 4.13.
The reliability test results showed that human elements reliability had α = 0.931, human
elements responsiveness had α = 0.909, non-human elements (physical evidence) had α =
0.896, service blueprint had α = 0.869 and corporate image had α = 0.856, human
element assurance of assessment had α = 0.682 and corporate image referrals had α =
0.611. Human element assurance of assessment and corporate image referrals both had α
less than 0.7 and were hence inferred as not reliable in explaining variations in customer
satisfaction. Five factors that influence customer satisfaction in Kenyan universities were
identified as human elements reliability, human elements responsiveness, non-human
elements (physical evidence), service blueprint had and corporate image. On testing the
reliability of the five factors it was established that the five constructs had alpha value
greater than 0.7. This meant the five displayed internal consistency and met the criteria of
reliability as outlined by Pallant (2010). The five were hence considered the main
dimensions of service quality in the context of Kenyan universities.
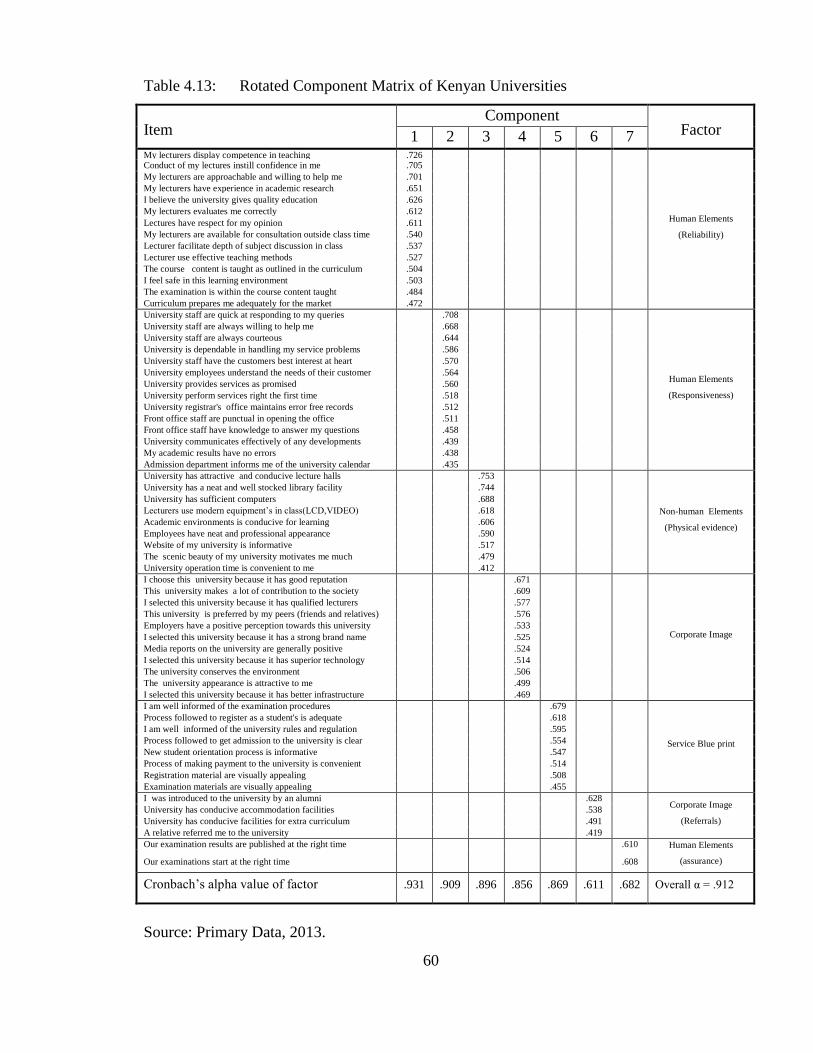
60
Table 4.13: Rotated Component Matrix of Kenyan Universities
Item Component
Factor 1 2 3 4 5 6 7 My lecturers display competence in teaching .726
Human Elements
(Reliability)
Conduct of my lectures instill confidence in me .705
My lecturers are approachable and willing to help me .701
My lecturers have experience in academic research .651
I believe the university gives quality education .626
My lecturers evaluates me correctly .612
Lectures have respect for my opinion .611
My lecturers are available for consultation outside class time .540
Lecturer facilitate depth of subject discussion in class .537
Lecturer use effective teaching methods .527
The course content is taught as outlined in the curriculum .504
I feel safe in this learning environment .503
The examination is within the course content taught .484
Curriculum prepares me adequately for the market .472
University staff are quick at responding to my queries .708
Human Elements
(Responsiveness)
University staff are always willing to help me .668
University staff are always courteous .644
University is dependable in handling my service problems .586
University staff have the customers best interest at heart .570
University employees understand the needs of their customer .564
University provides services as promised .560
University perform services right the first time .518
University registrar's office maintains error free records .512
Front office staff are punctual in opening the office .511
Front office staff have knowledge to answer my questions .458
University communicates effectively of any developments .439
My academic results have no errors .438
Admission department informs me of the university calendar .435
University has attractive and conducive lecture halls .753
Non-human Elements
(Physical evidence)
University has a neat and well stocked library facility .744
University has sufficient computers .688
Lecturers use modern equipment’s in class(LCD,VIDEO) .618
Academic environments is conducive for learning .606
Employees have neat and professional appearance .590
Website of my university is informative .517
The scenic beauty of my university motivates me much .479
University operation time is convenient to me .412
I choose this university because it has good reputation .671
Corporate Image
This university makes a lot of contribution to the society .609
I selected this university because it has qualified lecturers .577
This university is preferred by my peers (friends and relatives) .576
Employers have a positive perception towards this university .533
I selected this university because it has a strong brand name .525
Media reports on the university are generally positive .524
I selected this university because it has superior technology
.514
The university conserves the environment
.506
The university appearance is attractive to me
.499
I selected this university because it has better infrastructure
.469
I am well informed of the examination procedures .679
Service Blue print
Process followed to register as a student's is adequate .618
I am well informed of the university rules and regulation .595
Process followed to get admission to the university is clear .554
New student orientation process is informative .547
Process of making payment to the university is convenient .514
Registration material are visually appealing .508
Examination materials are visually appealing .455
I was introduced to the university by an alumni .628 Corporate Image
(Referrals)
University has conducive accommodation facilities .538
University has conducive facilities for extra curriculum
.491
A relative referred me to the university
.419
Our examination results are published at the right time .610 Human Elements
(assurance) Our examinations start at the right time .608
Cronbach’s alpha value of factor .931 .909 .896 .856 .869 .611 .682 Overall α = .912
Source: Primary Data, 2013.
61
4.6 Factors Influencing Customer Satisfaction in Private Universities in Kenya
The combined data set was split into two, private and public universities. Subsequent
analysis was performed based on the separated data set. The private universities data was
analyzed using factor analysis to determine the factors that attract and satisfy student in
private universities in Kenya. The public universities data was analyzed using factor
analysis to determine the factors that attract and satisfy student in public universities in
Kenya.
This private universities data was subjected to KMO Test and Bartlett’s Test. The KMO
Test of private university data resulted in KMO statistics = 0.882, as shown in Appendix
20 which was considered adequate for the study to use factor analysis. The Bartlett’s Test
of sphericity produced significant results with the p-value = 0.000. This meant the
variables in the private university data set were correlated and could hence be used in
factor analysis.
Factor extraction from the private university data was performed in two steps: Unrotated
solution (PCA method) and rotated solution analysis (varimax with Kaiser Normalization
rotation method). Preceding the extraction, the results of the total variance explained was
examined based on the presentation in Table 4.14 and a total of 16 components were
extracted. The 16 components explained 69.972 percent of the variations, leaving 30.028
percent of the variations to be explained by the remaining 50 components. The greatest
variations were explained by component one representing 30.933 percent of the
cumulative variations. The eigenvalues greater than or equal to 1 were 16 in total, further
confirming that the first 16 components were the most important in explaining the
variations.
The results of the unrotated component matrix of the private university data are presented
in Appendix 13. It shows that using PCA, 16 components were extracted with 60 items
loading on component one, two items loaded on component two, five and four. Only one
item loaded on components three, six, seven and eight, while no item loaded on
components four, nine, 10, 11,12,13,14 and 15 and hence they remained unexplained, this
necessitated rotation of the component matrix.
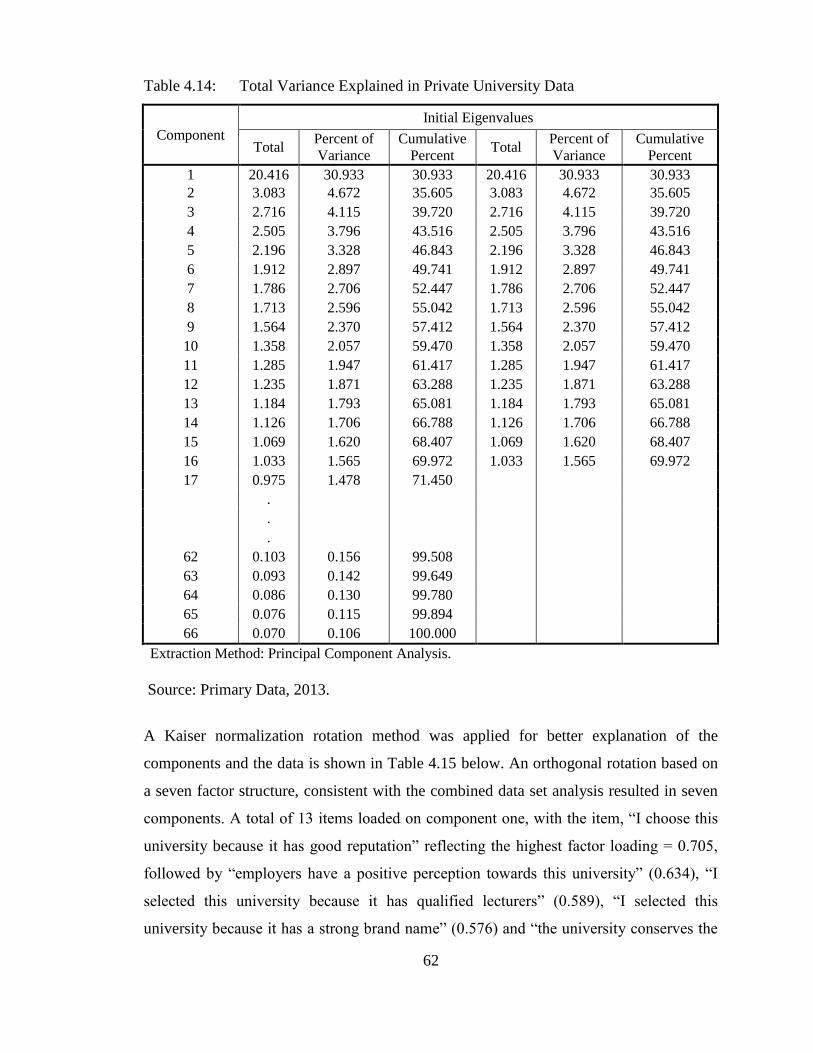
62
Table 4.14: Total Variance Explained in Private University Data
Component
Initial Eigenvalues
Total Percent of
Variance
Cumulative
Percent Total
Percent of
Variance
Cumulative
Percent
1 20.416 30.933 30.933 20.416 30.933 30.933
2 3.083 4.672 35.605 3.083 4.672 35.605
3 2.716 4.115 39.720 2.716 4.115 39.720
4 2.505 3.796 43.516 2.505 3.796 43.516
5 2.196 3.328 46.843 2.196 3.328 46.843
6 1.912 2.897 49.741 1.912 2.897 49.741
7 1.786 2.706 52.447 1.786 2.706 52.447
8 1.713 2.596 55.042 1.713 2.596 55.042
9 1.564 2.370 57.412 1.564 2.370 57.412
10 1.358 2.057 59.470 1.358 2.057 59.470
11 1.285 1.947 61.417 1.285 1.947 61.417
12 1.235 1.871 63.288 1.235 1.871 63.288
13 1.184 1.793 65.081 1.184 1.793 65.081
14 1.126 1.706 66.788 1.126 1.706 66.788
15 1.069 1.620 68.407 1.069 1.620 68.407
16 1.033 1.565 69.972 1.033 1.565 69.972
17 0.975 1.478 71.450
.
.
.
62 0.103 0.156 99.508
63 0.093 0.142 99.649
64 0.086 0.130 99.780
65 0.076 0.115 99.894
66 0.070 0.106 100.000
Extraction Method: Principal Component Analysis.
Source: Primary Data, 2013.
A Kaiser normalization rotation method was applied for better explanation of the
components and the data is shown in Table 4.15 below. An orthogonal rotation based on
a seven factor structure, consistent with the combined data set analysis resulted in seven
components. A total of 13 items loaded on component one, with the item, “I choose this
university because it has good reputation” reflecting the highest factor loading = 0.705,
followed by “employers have a positive perception towards this university” (0.634), “I
selected this university because it has qualified lecturers” (0.589), “I selected this
university because it has a strong brand name” (0.576) and “the university conserves the
63
environment” (0.570). Table 4.15 displays the other items that loaded on component one.
The 13 items were interpreted as the factor university corporate image.
The 12 items that loaded on component two in order of their factor loading were: “My
lecturers display competence in teaching” (0.754), “my lecturers are approachable and
willing to help me” (0.653), “the conduct of my lectures instill confidence in me” (0.614),
“my lecturers evaluates me correctly” (0.560), “I believe the university gives quality
education” (0.555), “curriculum prepares me adequately for the market (0.536)”,
examination is within the course content ( 0.523)”, “my lecturers have experience in
academic research (0.522)”, “lecturers facilitate depth of subject discussion in class
(0.469)”, lecturers have respect for my opinion (0.447), I feel safe in this leaning
environment (0.436)” and “my lecturers are available for consultation outside class time
(0.428)”. These items were interpreted as the factor human elements reliability
dimension.
Variations in component three were explained to a great extent by 11 items. The item,
“the university staff are quick at responding to my queries” had the highest factor loading
= 0.737, followed by “the university communicates effectively of any developments”
(0.614), “the university staff are always courteous” (0.593), “the university staff are
always willing to help me” (0.584), “the university registrar's office maintains error free
records” (0.556), “university is dependable in handling my service problems” (0.528),
“university perform services right the first time’ (0.522), “the admission department
informs me of the university calendar” (0.519), “the front office staff have knowledge to
answer my questions” (0.495), “the university staff have the customers best interest at
heart” (0.448) and “the university employees understand the needs of their customer”
(0.445). The 11 items were interpreted as the factor human elements responsiveness.
Eight items converged on component four. The item, “the university has conducive
accommodation facilities” had the highest factor loading = 0.741, followed by “the
registration material are visually appealing” (0.647), “the university has conducive
facilities for extra curriculum” (0.615), “the scenic beauty of my university motivates me
much” (0.580), “the examination materials are visually appealing” (0.543), “the

64
university fee is equal to the quality of service I receive” (0.496), “I was introduced to
the university by an alumni” (0.478) and “the university location is conducive to me”
(0.416). The eight were interpreted as the factor non-human elements (physical
evidence).
Component five had six items loading on it. The item with the highest factor loading was,
“the university has a neat and well stocked library facility” (0.775), followed by “the
university has attractive and conducive lecture halls” (0.691), “the employees have neat
and professional appearance” (0.689), “the academic environments is conducive for
learning” (0.610), “the university has sufficient computers” (0.597) and “the website of
my university is informative” (0.567). These items were descriptive of the university
resources and were interpreted as the factor non-human elements (resources).
A set of eight items loaded on component six, with the item, “the course content is
taught as outlined in the curriculum” reflecting a factor loading of 0.560, followed by
“the lecturers use effective teaching methods” (0.536), “I am well informed of the
examination procedures” (0.514), “the university operation time is convenient to me”
(0.500), “university provides services as promised” (0.474). The eight items all described
the process of service delivery and were interpreted as the factor service blue print.
Variations in component seven were explained to a great extent by four items as shown in
Table 4.15. The item with the highest factor loading on component seven was “my
academic results have no errors” (0.655), followed by “our examinations start at the right
time” (0.493), “my lecturers come to class at the promised time” (0.489) and “our
examination results are published at the right time” (0.471). The four items were
interpreted as the factor human elements assurance.
The EFA process described above, led to the extraction of seven factors from the private
university data. The study therefore deduced that there are seven factors that influence
customer satisfaction in private universities including corporate image, human elements
reliability dimension, human elements responsiveness dimension, non-human elements
(physical evidence), non-human elements (resources), service blueprint and human

65
Table 4.15: Rotated Component Matrix of Private Universities Data
Item Component
Factor
Cronbach’s
Alpha
1 2 3 4 5 6 7
I choose this university because it has good reputation .705
Corporate Image .892
Employers have a positive perception towards this university .634
I selected this university because it has qualified lecturers .589
I selected this university because it has a strong brand name .576
University conserves the environment .570
I selected this university because it has superior technology .558
Media reports on the university are generally positive .557
I selected this university because it has better infrastructure .550
Process followed to register as a student's is adequate .500
Process followed to get admission to the university is clear .499
University appearance is attractive to me .489
University makes a lot of contribution to the society .485
This university is preferred by my peers (friends and relatives) .431
My lecturers display competence in teaching .754
Human Elements
(Reliability) .902
My lecturers are approachable and willing to help me .653
The conduct of my lectures instill confidence in me .614
My lecturers evaluates me correctly .560
I believe the university gives quality education .555
Curriculum prepares me adequately for the market .536
Examination is within the course content taught .523
My lecturers have experience in academic research .522 .445
Lecturer facilitate depth of subject discussion in class .469
Lecturers have respect for my opinion .447
I feel safe in this learning environment .436
My lecturers are available for consultation outside class time .428
University staff are quick at responding to my queries .737
Human Elements
(Responsiveness) .883
University communicates effectively of any developments .614
University staff are always courteous .593
University staff are always willing to help me
.584
University registrar's office maintains error free records
.556
University is dependable in handling my service problems
.528
University perform services right the first time
.522
Admission department informs me of the university calendar
.519
Front office staff have knowledge to answer my questions
.495
University staff have the customers best interest at heart
.448
University employees understand the needs of their customer
.445
University has conducive accommodation facilities .741
Non-human
Elements
(Physical evidence)
Registration material are visually appealing .647
University has conducive facilities for extra curriculum .615
The scenic beauty of my university motivates me much .580 .828
Examination materials are visually appealing .543
University fee is equal to the quality of service i receive
.496
I was introduced to the university by an alumni .478
The university location is conducive to me .416
University has a neat and well stocked library facility .775
Non-human
Elements
(Resources)
.828
University has attractive and conducive lecture halls .691
Employees have neat and professional appearance .689
Academic environments is conducive for learning .610
University has sufficient computers .597
Website of my university is informative .567
Course content is taught as outlined in the curriculum .560
Service Blue Print .820
Lecturers use effective teaching methods
.536
I am well informed of the examination procedures .514
University operation time is convenient to me .500
University provides services as promised .474
New student orientation process is informative .443
Lecturers use modern equipment’s in class(LCD,VIDEO)
.424
Process of making payment to the university is convenient .402
My academic results have no errors .655
Human Elements
(assurance) .883
Our examinations start at the right time .493
My lecturers come to class at the promised time .489
Our examination results are published at the right time .471
Overall Cronbach’s alpha value of the factors
.907
Extraction Method: Principal Component Analysis. Rotation Method: varimax with Kaiser Normalization.
a. Rotation converged in 16 iterations.
Source: Primary Data, 2013.

66
elements assurance. No items loaded on the dimension core service, and it was dropped
from further analysis. The seven factors extracted from the private university data set
using EFA were subjected to a reliability test resulting in an overall Cronbach’s α = 0.907
as shown in Table 4.15. This meant the seven factors were very reliable in explaining
variations in customer satisfaction in private universities. The resulting reliability values
based on Cronbach’s alpha were corporate image, α = 0.892, human elements reliability α
= 0.902, human elements responsiveness α = 0.883, non-human elements (resources),
non-human elements (physical evidence) α = 0.828, α = 0.858, service blueprint had α =
0.820 and human elements (assurance) α = 0.635. The factor human element (assurance)
was not reliable and the remaining six factors all had α value greater than 0.7 hence were
reliable and internally consistent. A repeat EFA focusing on non human elements showed
that this construct was unidimentional and not multidimentional, hence non-human
elements (resources) and non-human elements (physical evidence) were merged into one
construct non-human elements (physical evidence and resources).
4.7 Factors Influencing Customer Satisfaction in Public Universities in Kenya
Factor analysis of the public universities revealed KMO statistics = 0.956. Appendix 20
shows that the Bartlett’s Test of sphericity resulted in p-value = 0.000, which was
significant and meant the variables in the public university data were correlated and good
for factor analysis. Analysis of the data set using the correlation matrix revealed that the
data did not have singularity problems and that the variables were related to each other
and hence suitable for factor analysis. The communalities results also showed that the
variables fitted well with each other. Using EFA, factors were extracted from the public
university data set in two steps, unrotated solution and rotated solution analysis. The
initial output of the EFA process was the total variance explained results in Table 4.16.
Using PCA method, 12 components were extracted and they explained 61.004 percent of
the cumulative variations. The remaining 38.996 percent of the variations were explained
by the remaining 54 components. Component one explained 33.387 percent of the
variations, component two explained 5.348 percent of the variations and component three
explained 2.771 percent of the variations. The total initial eigenvalues column shows that
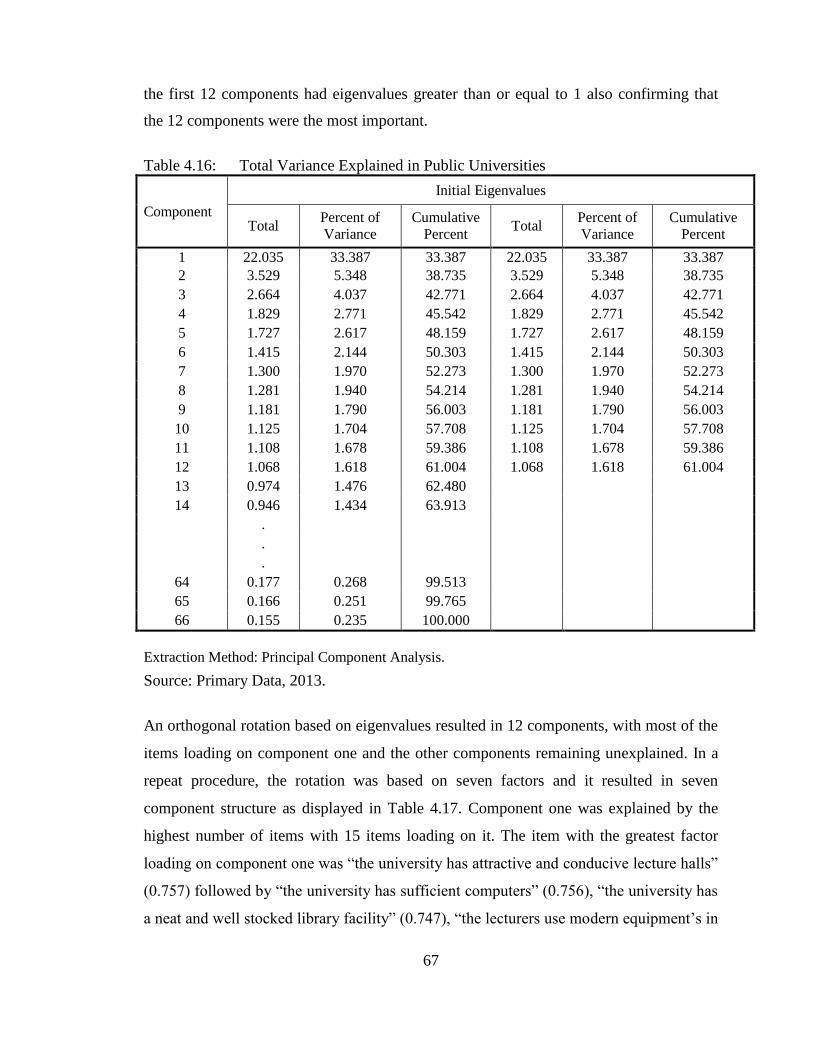
67
the first 12 components had eigenvalues greater than or equal to 1 also confirming that
the 12 components were the most important.
Table 4.16: Total Variance Explained in Public Universities
Component
Initial Eigenvalues
Total Percent of
Variance
Cumulative
Percent Total
Percent of
Variance
Cumulative
Percent
1 22.035 33.387 33.387 22.035 33.387 33.387
2 3.529 5.348 38.735 3.529 5.348 38.735
3 2.664 4.037 42.771 2.664 4.037 42.771
4 1.829 2.771 45.542 1.829 2.771 45.542
5 1.727 2.617 48.159 1.727 2.617 48.159
6 1.415 2.144 50.303 1.415 2.144 50.303
7 1.300 1.970 52.273 1.300 1.970 52.273
8 1.281 1.940 54.214 1.281 1.940 54.214
9 1.181 1.790 56.003 1.181 1.790 56.003
10 1.125 1.704 57.708 1.125 1.704 57.708
11 1.108 1.678 59.386 1.108 1.678 59.386
12 1.068 1.618 61.004 1.068 1.618 61.004
13 0.974 1.476 62.480
14 0.946 1.434 63.913
.
.
.
64 0.177 0.268 99.513
65 0.166 0.251 99.765
66 0.155 0.235 100.000
Extraction Method: Principal Component Analysis.
Source: Primary Data, 2013.
An orthogonal rotation based on eigenvalues resulted in 12 components, with most of the
items loading on component one and the other components remaining unexplained. In a
repeat procedure, the rotation was based on seven factors and it resulted in seven
component structure as displayed in Table 4.17. Component one was explained by the
highest number of items with 15 items loading on it. The item with the greatest factor
loading on component one was “the university has attractive and conducive lecture halls”
(0.757) followed by “the university has sufficient computers” (0.756), “the university has
a neat and well stocked library facility” (0.747), “the lecturers use modern equipment’s in

68
class like Liquid Crystal Display (LCD) and video technology” (0.619) and “the
employees have neat and professional appearance” (0.581). Table 4.17 displays the rest
of the items that loaded on component one. The 15 items that explained variations in
component one, exhibited convergent validity for the factor non-human elements
(physical evidence and resources).
A total of 14 items loaded on component two. The items and respective factor loadings
were as follows: “my lecturers display competence in teaching” (0.690), “the conduct of
my lectures instills confidence in me” (0.666), “my lecturers are approachable and
willing to help me” (0.649), “my lecturers have experience in academic research” (0.629)
and “I believe the university gives quality education” (0.603). The 14 items in Table 4.17
were interpreted as the factor human elements reliability dimension. A total of 11 items
loaded on component three as displayed in Table 4.17. The item with the highest factor
loading on component three was, “the university staff are always willing to help me”
(0.751), “the university staff are quick at responding to my queries” (0.719), “the
university staff are always courteous” (0.712), “the university staff have the customers
best interest at heart” (0.599) and “the university employees understand the needs of their
customer” (0.588). These items were interpreted as the factor human elements
responsiveness dimensions.
The fourth component had a total of 10 items loading on it. The item that explained the
greatest variation on component four was, “I choose this university because it has good
reputation” (0.671), “followed by this university makes a lot of contribution to the
society” (0.640), “this university is preferred by my peers by my friends and relatives”
(0.589), “I selected this university because it has qualified lecturers” (0.555) and “media
reports on the university are generally positive” (0.528). These items were interpreted as
the factor university corporate image. Six items loaded on component five. The item with
the highest factor loading was, “I am well informed of the examination procedures”
(0.680), “the process followed to register as a student is adequate” (0.640), “I am well
informed of the university rules and regulation” (0.616), “the process followed to get
admission to the university is clear” (0.571), “the new student orientation process is
informative” (0.550) and “the process of making payment to the university is convenient”
69
(0.526). The six items all referred to the service process flow and were interpreted as the
factor service blue print.
According to Table 4.17, three items loaded on component 6. The item with the highest
factor loading was, “our examination results are published at the right time” (0.686), “our
examinations start at the right time” (0.657), “the university communicates effectively of
any developments” (0.425). The three were interpreted as the factor human elements
assurance on assessment dimension. Component seven had three items loading on it with
the item with the highest factor loading being, “I was introduced to the university by an
alumni” (0.707), “a relative referred me to the university” (0.694) and “the university fee
is equal to the quality of service I receive” (0.407). The 3 items were interpreted as the
factor university corporate image referrals.
The preceding analysis of public universities based on EFA, led to the derivation of seven
components. It was inferred from the analysis that there were seven factors that exert the
greatest influence on student satisfaction in public universities including, non-human
elements (physical evidence and resources), human elements reliability, human elements
responsiveness, corporate image, service blue print, human elements assurance and
corporate image referrals. No items loaded on the dimension core service, and it was
dropped from further analysis.
The seven were tested for their reliability resulting in an overall Cronbach’s α = 0.899.
This meant the seven factors were very reliable in explaining variations in customer
satisfaction in public universities. The reliability results of the respective factors showed
that non-human elements had α value = 0.922, human elements reliability dimension had
α value = 0.924, human elements responsiveness dimension had α value = 0.898, service
blueprint had α value = 0.833, corporate image had α value = 0.823, human elements
assurance had α value = 0.679 and corporate image referrals had α value = 0.592. It was
observed that human elements assurance and corporate image referrals failed to meet the
threshold of reliability and were considered non reliable. The remaining five factors non-
human elements (physical evidence and resources), human elements reliability, human
elements responsiveness, corporate image and service blue print, had Cronbach's alpha
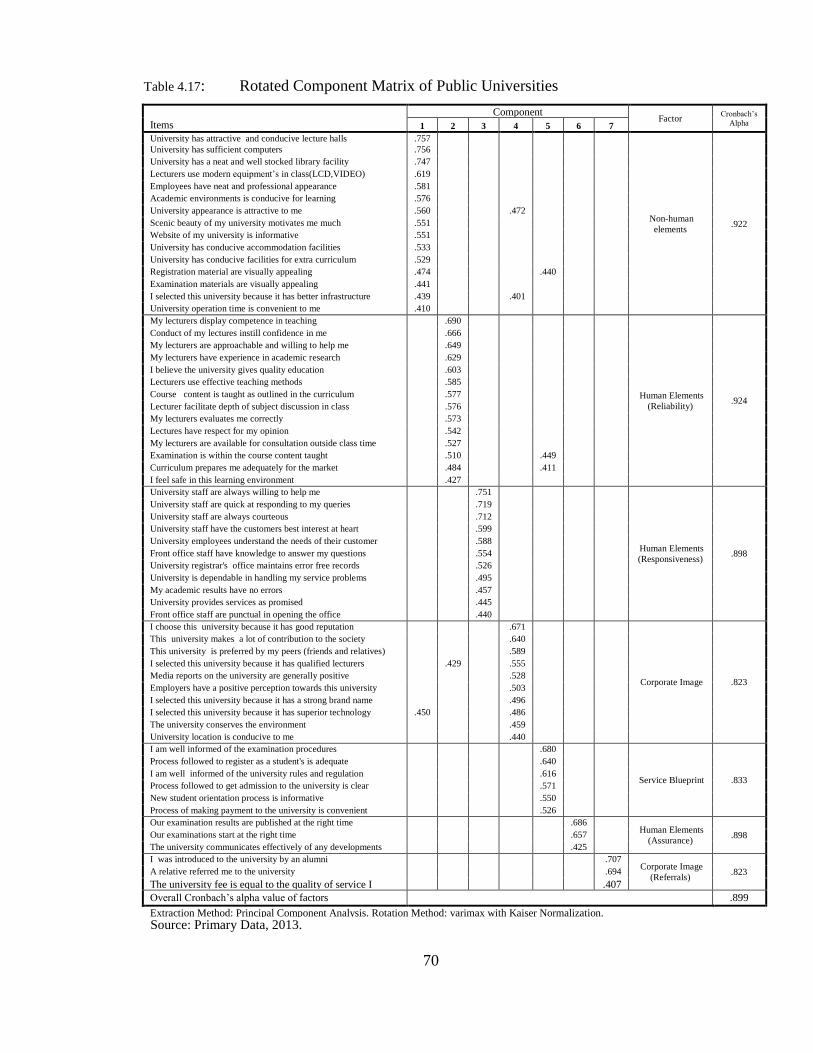
70
Table 4.17: Rotated Component Matrix of Public Universities
Items
Component Factor
Cronbach’s
Alpha 1 2 3 4 5 6 7
University has attractive and conducive lecture halls .757
Non-human
elements .922
University has sufficient computers .756
University has a neat and well stocked library facility .747
Lecturers use modern equipment’s in class(LCD,VIDEO) .619
Employees have neat and professional appearance .581
Academic environments is conducive for learning .576
University appearance is attractive to me .560 .472
Scenic beauty of my university motivates me much .551
Website of my university is informative .551
University has conducive accommodation facilities .533
University has conducive facilities for extra curriculum .529
Registration material are visually appealing .474 .440
Examination materials are visually appealing .441
I selected this university because it has better infrastructure .439 .401
University operation time is convenient to me .410
My lecturers display competence in teaching .690
Human Elements
(Reliability) .924
Conduct of my lectures instill confidence in me .666
My lecturers are approachable and willing to help me .649
My lecturers have experience in academic research .629
I believe the university gives quality education .603
Lecturers use effective teaching methods .585
Course content is taught as outlined in the curriculum .577
Lecturer facilitate depth of subject discussion in class .576
My lecturers evaluates me correctly .573
Lectures have respect for my opinion .542
My lecturers are available for consultation outside class time .527
Examination is within the course content taught .510 .449
Curriculum prepares me adequately for the market .484 .411
I feel safe in this learning environment .427
University staff are always willing to help me .751
Human Elements
(Responsiveness) .898
University staff are quick at responding to my queries .719
University staff are always courteous .712
University staff have the customers best interest at heart .599
University employees understand the needs of their customer .588
Front office staff have knowledge to answer my questions .554
University registrar's office maintains error free records .526
University is dependable in handling my service problems .495
My academic results have no errors .457
University provides services as promised .445
Front office staff are punctual in opening the office .440
I choose this university because it has good reputation .671
Corporate Image .823
This university makes a lot of contribution to the society .640
This university is preferred by my peers (friends and relatives) .589
I selected this university because it has qualified lecturers .429 .555
Media reports on the university are generally positive .528
Employers have a positive perception towards this university .503
I selected this university because it has a strong brand name .496
I selected this university because it has superior technology .450 .486
The university conserves the environment .459
University location is conducive to me .440
I am well informed of the examination procedures .680
Service Blueprint .833
Process followed to register as a student's is adequate .640
I am well informed of the university rules and regulation .616
Process followed to get admission to the university is clear .571
New student orientation process is informative .550
Process of making payment to the university is convenient .526
Our examination results are published at the right time .686 Human Elements
(Assurance) .898 Our examinations start at the right time .657
The university communicates effectively of any developments .425
I was introduced to the university by an alumni .707 Corporate Image
(Referrals) .823 A relative referred me to the university .694
The university fee is equal to the quality of service I receive
.407
Overall Cronbach’s alpha value of factors
.899
Extraction Method: Principal Component Analysis. Rotation Method: varimax with Kaiser Normalization.
Source: Primary Data, 2013.
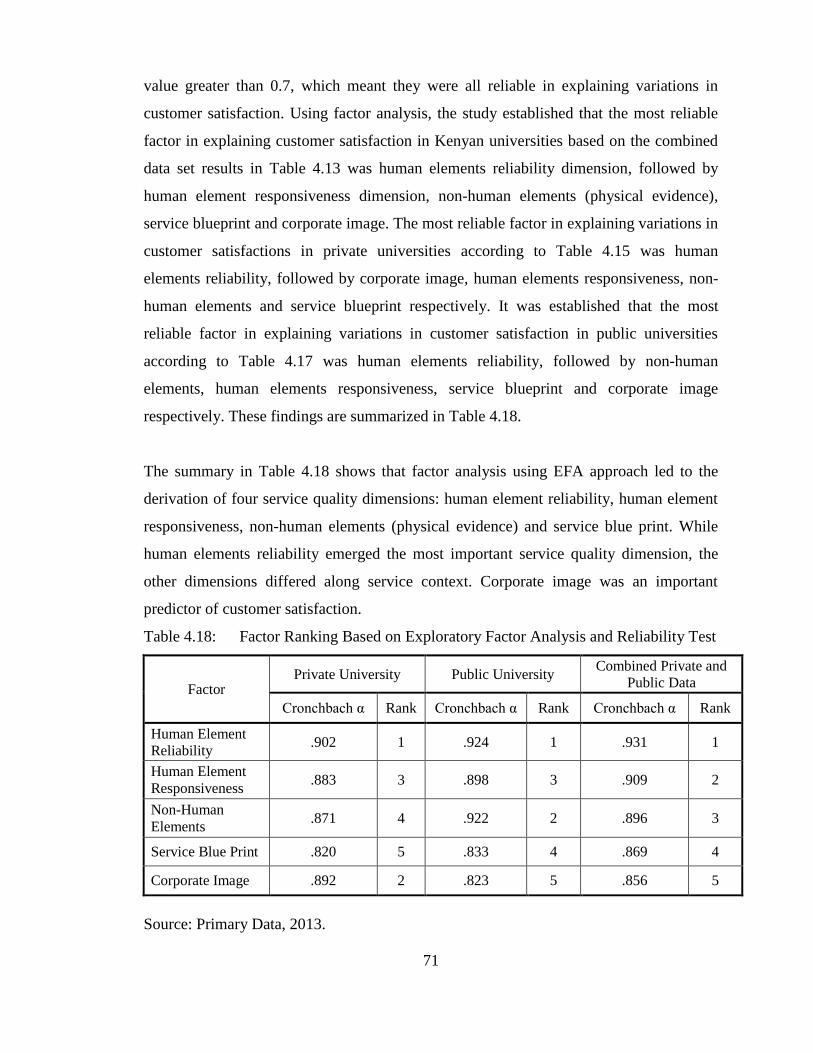
71
value greater than 0.7, which meant they were all reliable in explaining variations in
customer satisfaction. Using factor analysis, the study established that the most reliable
factor in explaining customer satisfaction in Kenyan universities based on the combined
data set results in Table 4.13 was human elements reliability dimension, followed by
human element responsiveness dimension, non-human elements (physical evidence),
service blueprint and corporate image. The most reliable factor in explaining variations in
customer satisfactions in private universities according to Table 4.15 was human
elements reliability, followed by corporate image, human elements responsiveness, non-
human elements and service blueprint respectively. It was established that the most
reliable factor in explaining variations in customer satisfaction in public universities
according to Table 4.17 was human elements reliability, followed by non-human
elements, human elements responsiveness, service blueprint and corporate image
respectively. These findings are summarized in Table 4.18.
The summary in Table 4.18 shows that factor analysis using EFA approach led to the
derivation of four service quality dimensions: human element reliability, human element
responsiveness, non-human elements (physical evidence) and service blue print. While
human elements reliability emerged the most important service quality dimension, the
other dimensions differed along service context. Corporate image was an important
predictor of customer satisfaction.
Table 4.18: Factor Ranking Based on Exploratory Factor Analysis and Reliability Test
Factor Private University Public University
Combined Private and
Public Data
Cronchbach α Rank Cronchbach α Rank Cronchbach α Rank
Human Element
Reliability .902 1 .924 1 .931 1
Human Element
Responsiveness .883 3 .898 3 .909 2
Non-Human
Elements .871 4 .922 2 .896 3
Service Blue Print .820 5 .833 4 .869 4
Corporate Image .892 2 .823 5 .856 5
Source: Primary Data, 2013.
72
4.8 Comparative Analysis of Service Quality in Private and Public Universities
The preceding factor analysis output in Table 4.18 showed that the factors that satisfied
students in public universities were different from those that satisfied students in private
universities. With this observation, the study sought to examine whether the factors that
satisfied students in public universities were significantly different from those that
satisfied students in private universities. To achieve this, a one way ANOVA test was
performed to determine whether there were any significant differences between the
means of service quality dimensions that influenced customer satisfaction in private and
public universities. This involved the testing of hypothesis nine (H9) which stated that:
H9: The relationship between service quality and customer satisfaction in private
universities is not significantly different from that of public universities
The items that loaded on the five factors under EFA were transformed into new
constructs and labeled human elements reliability dimension, human elements
responsiveness dimension, non-human elements, service blueprint and corporate image.
In performing the one way ANOVA test, the five were considered as dependent variables
and university category (private or public) was considered as the factor.
The combined data set was subjected to five assumptions of ANOVA including assessing
the level of measurement, independence, non-significant outliers, normality, and
homogeneity of variance. The first assumption of ANOVA analysis like other parametric
test is that the dependent variables must be measured on an interval or ratio scale (Long,
1997). The instrument in Appendix 3 provides evidence that the variables under
investigation were measured using an interval scale, hence were suitable for ANOVA
analysis.
The second assumption of ANOVA is the independence of observations, which means
that there is no relationship between the observations in each group or between the
groups themselves. This study reports two independent groups, students in private
universities (n = 181) and students in public universities (n = 569). The assumption of
independence of observation was therefore not violated. The third assumption was that
there were no significant outliers in the data set. At the data cleaning stage, descriptive
73
analysis was used to check for existence of any outliers and none was reported hence the
dependent variables were good for ANOVA analysis. Test of normality using Q-Q plots
showed no violation of this assumption and the study therefore proceeded with ANOVA
analysis.
The fifth assumption was that of homogeneity of variance. The test of homogeneity
showed no violation of this assumption and given the large sample size (n = 750), the
distribution tend toward normal. Sultan and Wong (2010) observed that the homogeneity
test is sensitive to sample size and tends to be significant in large samples, while Stevens
(1996) notes that ANOVA is reasonably robust to violations of this assumption provided
the sample sizes are reasonably similar.
According to Table 4.19, students satisfaction differed significantly between the public
and private universities along the service quality dimension of human elements reliability
with F (1, 748) = 89.061, p-value = 0.000. Student satisfaction also differed significantly
between the public and private universities along the service quality dimension of human
elements responsiveness with F (1, 747) = 191.971 and p-value = 0.000. Student
satisfaction also differed significantly between public and private universities attributable
to the service quality dimension of non-human elements or physical evidence with F (1,
747) = 102.277 and p-value = 0.000.
The level of student satisfaction differed significantly between the public universities and
private universities on the service quality dimension of service blueprint with the results
in Table 4.19 showing F (1, 747) = 26.905 and p-value = 0.000. It was observed that
satisfaction differed significantly between the public and private universities on the factor
corporate image with F (1, 747) = 20.757and p-value = 0.000. From the outcome of the
analysis in Table 4.19, hypotheses H9 was rejected at a 5 percent level of significance,
meaning the dimensions of service quality that influenced customer satisfaction were
significantly different between private and public university students.
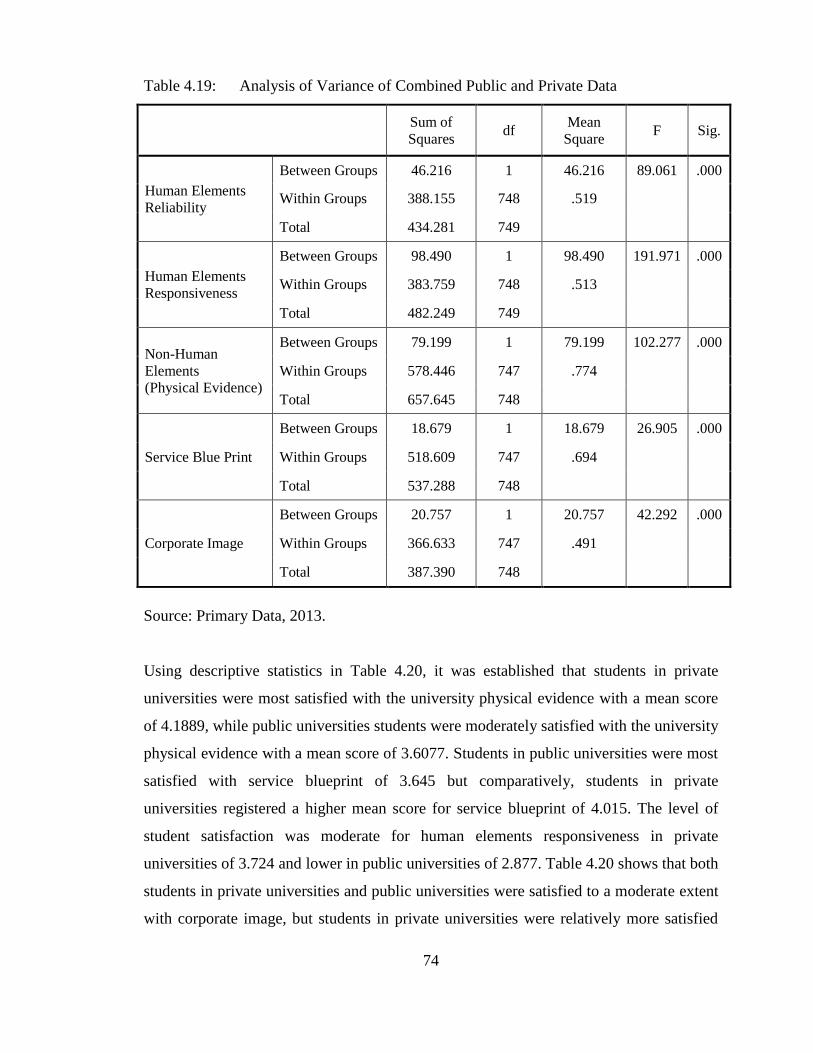
74
Table 4.19: Analysis of Variance of Combined Public and Private Data
Sum of
Squares df
Mean
Square F Sig.
Human Elements
Reliability
Between Groups 46.216 1 46.216 89.061 .000
Within Groups 388.155 748 .519
Total 434.281 749
Human Elements
Responsiveness
Between Groups 98.490 1 98.490 191.971 .000
Within Groups 383.759 748 .513
Total 482.249 749
Non-Human
Elements
(Physical Evidence)
Between Groups 79.199 1 79.199 102.277 .000
Within Groups 578.446 747 .774
Total 657.645 748
Service Blue Print
Between Groups 18.679 1 18.679 26.905 .000
Within Groups 518.609 747 .694
Total 537.288 748
Corporate Image
Between Groups 20.757 1 20.757 42.292 .000
Within Groups 366.633 747 .491
Total 387.390 748
Source: Primary Data, 2013.
Using descriptive statistics in Table 4.20, it was established that students in private
universities were most satisfied with the university physical evidence with a mean score
of 4.1889, while public universities students were moderately satisfied with the university
physical evidence with a mean score of 3.6077. Students in public universities were most
satisfied with service blueprint of 3.645 but comparatively, students in private
universities registered a higher mean score for service blueprint of 4.015. The level of
student satisfaction was moderate for human elements responsiveness in private
universities of 3.724 and lower in public universities of 2.877. Table 4.20 shows that both
students in private universities and public universities were satisfied to a moderate extent
with corporate image, but students in private universities were relatively more satisfied
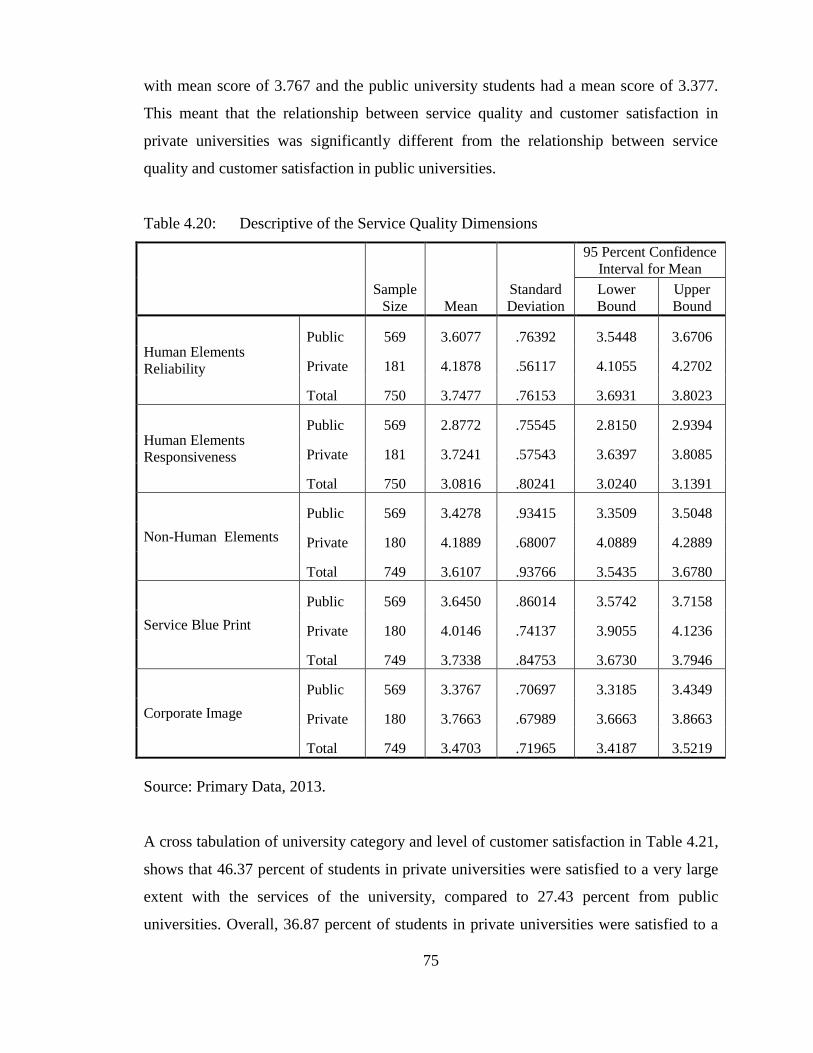
75
with mean score of 3.767 and the public university students had a mean score of 3.377.
This meant that the relationship between service quality and customer satisfaction in
private universities was significantly different from the relationship between service
quality and customer satisfaction in public universities.
Table 4.20: Descriptive of the Service Quality Dimensions
Sample
Size Mean
Standard
Deviation
95 Percent Confidence
Interval for Mean
Lower
Bound
Upper
Bound
Human Elements
Reliability
Public 569 3.6077 .76392 3.5448 3.6706
Private 181 4.1878 .56117 4.1055 4.2702
Total 750 3.7477 .76153 3.6931 3.8023
Human Elements
Responsiveness
Public 569 2.8772 .75545 2.8150 2.9394
Private 181 3.7241 .57543 3.6397 3.8085
Total 750 3.0816 .80241 3.0240 3.1391
Non-Human Elements
Public 569 3.4278 .93415 3.3509 3.5048
Private 180 4.1889 .68007 4.0889 4.2889
Total 749 3.6107 .93766 3.5435 3.6780
Service Blue Print
Public 569 3.6450 .86014 3.5742 3.7158
Private 180 4.0146 .74137 3.9055 4.1236
Total 749 3.7338 .84753 3.6730 3.7946
Corporate Image
Public 569 3.3767 .70697 3.3185 3.4349
Private 180 3.7663 .67989 3.6663 3.8663
Total 749 3.4703 .71965 3.4187 3.5219
Source: Primary Data, 2013.
A cross tabulation of university category and level of customer satisfaction in Table 4.21,
shows that 46.37 percent of students in private universities were satisfied to a very large
extent with the services of the university, compared to 27.43 percent from public
universities. Overall, 36.87 percent of students in private universities were satisfied to a
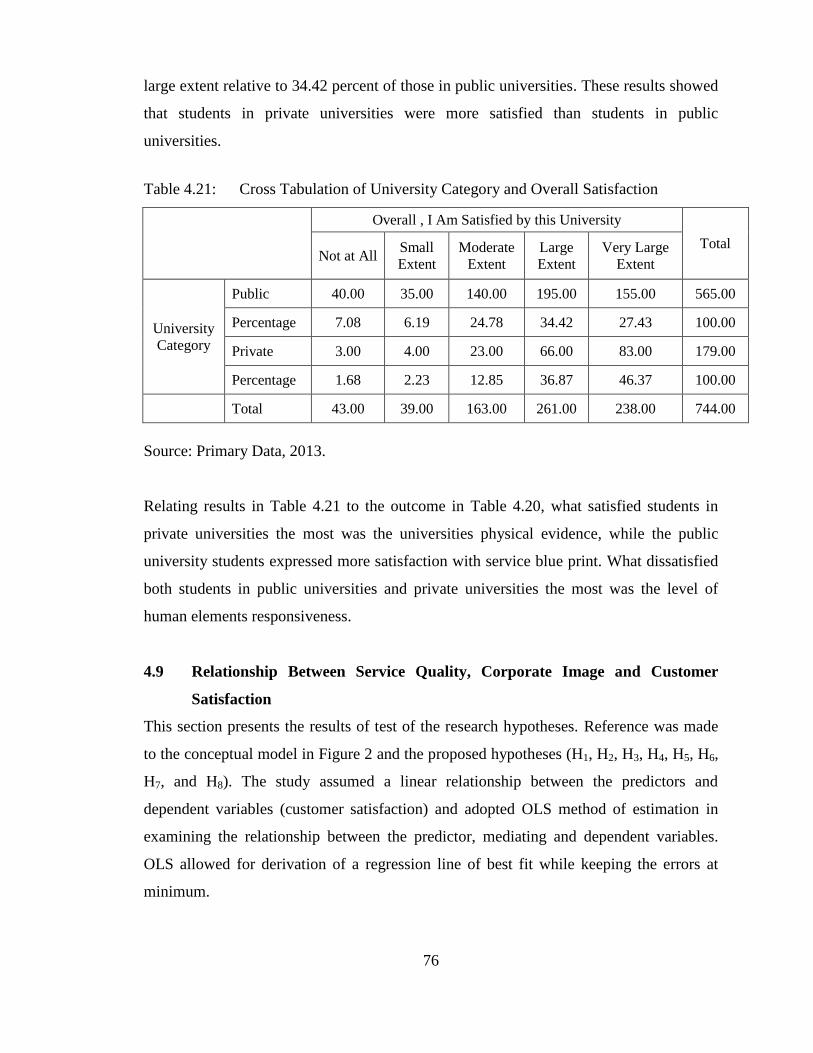
76
large extent relative to 34.42 percent of those in public universities. These results showed
that students in private universities were more satisfied than students in public
universities.
Table 4.21: Cross Tabulation of University Category and Overall Satisfaction
Overall , I Am Satisfied by this University
Total Not at All
Small
Extent
Moderate
Extent
Large
Extent
Very Large
Extent
University
Category
Public 40.00 35.00 140.00 195.00 155.00 565.00
Percentage 7.08 6.19 24.78 34.42 27.43 100.00
Private 3.00 4.00 23.00 66.00 83.00 179.00
Percentage 1.68 2.23 12.85 36.87 46.37 100.00
Total 43.00 39.00 163.00 261.00 238.00 744.00
Source: Primary Data, 2013.
Relating results in Table 4.21 to the outcome in Table 4.20, what satisfied students in
private universities the most was the universities physical evidence, while the public
university students expressed more satisfaction with service blue print. What dissatisfied
both students in public universities and private universities the most was the level of
human elements responsiveness.
4.9 Relationship Between Service Quality, Corporate Image and Customer
Satisfaction
This section presents the results of test of the research hypotheses. Reference was made
to the conceptual model in Figure 2 and the proposed hypotheses (H1, H2, H3, H4, H5, H6,
H7, and H8). The study assumed a linear relationship between the predictors and
dependent variables (customer satisfaction) and adopted OLS method of estimation in
examining the relationship between the predictor, mediating and dependent variables.
OLS allowed for derivation of a regression line of best fit while keeping the errors at
minimum.
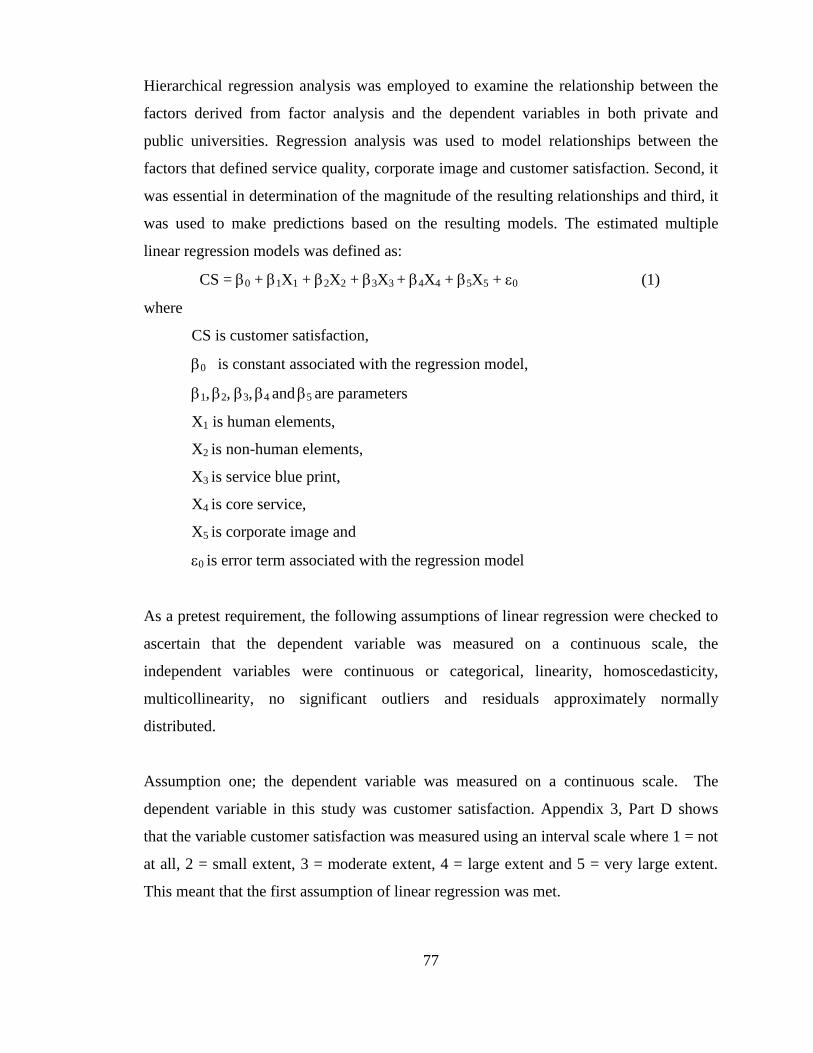
77
Hierarchical regression analysis was employed to examine the relationship between the
factors derived from factor analysis and the dependent variables in both private and
public universities. Regression analysis was used to model relationships between the
factors that defined service quality, corporate image and customer satisfaction. Second, it
was essential in determination of the magnitude of the resulting relationships and third, it
was used to make predictions based on the resulting models. The estimated multiple
linear regression models was defined as:
CS = 0 + 1X1 + 2X2 + 3X3 + 4X4 + 5X5 + 0 (1)
where
CS is customer satisfaction,
0 is constant associated with the regression model,
1, 2, 3, 4 and 5 are parameters
X1 is human elements,
X2 is non-human elements,
X3 is service blue print,
X4 is core service,
X5 is corporate image and
0 is error term associated with the regression model
As a pretest requirement, the following assumptions of linear regression were checked to
ascertain that the dependent variable was measured on a continuous scale, the
independent variables were continuous or categorical, linearity, homoscedasticity,
multicollinearity, no significant outliers and residuals approximately normally
distributed.
Assumption one; the dependent variable was measured on a continuous scale. The
dependent variable in this study was customer satisfaction. Appendix 3, Part D shows
that the variable customer satisfaction was measured using an interval scale where 1 = not
at all, 2 = small extent, 3 = moderate extent, 4 = large extent and 5 = very large extent.
This meant that the first assumption of linear regression was met.
78
Assumption two; the two or more independent variables are continuous or categorical.
The independent variable in this study was service quality (with four dimensions: human
elements responsiveness, human elements reliability, service blueprint and non-human
elements) and the mediator variable was corporate image as shown in Figure 2. The
study instrument in Appendix 3, evidence the fact the independent variable made up of
functional service quality and technical service quality, together with the moderator
variable were all measured on a five point Likert scale, where 1 stood for not at all, 2 =
small extent, 3 = moderate extent, 4 = large extent and 5 = very large extent. The second
assumption of linear regression was not violated.
Assumption three; linearity was tested between the dependent variable (customer
satisfaction) and the independent variable collectively (service quality). A scatter plot
was used in examining these relationships and the results as shown in Appendix 21. The
study established that the data set did not violate the assumption of linearity.
Assumption four; the error term (i) are normally and identically independently
distributed with mean zero and constant variance (homoscedasticity). Homoscedasticity
refers to the assumption that the dependent variable exhibits similar amounts of variance
across the range of values for an independent variable. The study tested the hypothesis
that variance in customer satisfaction is homogeneous along the service quality
dimensions, using a graphical methods as displayed in Appendix 22. The concentration of
the variance of the error term along the line of best fit meant that the error variance in
customer satisfaction was constant along the service quality dimensions. Hence the data
did not violate heteroscedasticity and instead was homoscedastic.
Assumption five; test of multicollinearity, multicollinearity occurs when any single
independent variable is highly correlated (r greater than or equal to 0.7) with a set of
other independent variables. This leads to problems with understanding which
independent variable contributes to the variance explained in the dependent variable, as
well as technical issues in calculating a multiple regression model. In this study,
tolerance, the Variance Inflation Factor (VIF) and Pearson correlation coefficient (r) were
adopted as two collinearity diagnostic factors that could help identify multicollinearity.
79
Tolerance is a measure of collinearity reported as 1-R2. A small tolerance value indicates
that the variable under consideration is almost a perfect linear combination of the
independent variables already in the equation and that it should not be added to the
regression equation. If the tolerance value is very small (less than 0.10) it indicates that
the multiple correlations with other variables is high, suggesting the possibility of
multicollinearity (Tabachnick & Fidell, 2007). None of the tolerance values in Appendix
23 was less than 0.1 and hence the data set did not violate multicollinearity based on
tolerance.
The VIF provides a measure of how much the variance for a given regression coefficient
is increased compared to if all predictors were uncorrelated (Denis, 2011). This meant
that the extent to which the given predictor is highly correlated with the remaining
predictors is the extent to which VIF will be large. Denis (2011), suggest that VIF of 3
shows no multicollinearity, while VIF greater than 10 shows multicollinearity exist. A
regression analysis of the independent variables, human elements reliability, human
elements responsiveness and non-human elements on service blueprint shown in
Appendix 24, resulted in VIF values less than three and all the tolerance values were
greater than or equal to 0.1, meaning the independent variables were not highly correlated
to service blueprint and hence the data set have a problem of multicollinearity.
To test the correlation between bivariate factors, Pearson correlation coefficient (r) was
used to determine the level of significance of the relationships. Appendix 24 shows that
the non-human elements had a significant positive relationship (p = 0.000, r = 0.674) with
human elements reliability at the 5 percent level of significance in a 1-tailed test. Non-
human elements had a significant positive relationship (p = 0.000, r = 0.701) with human
elements responsiveness at the 5 percent level of significance a 1-tailed test. Non-human
elements had a significant positive relationship (p = 0.000, r = 0.671) with service
blueprint at the 5 percent level of significance a 1-tailed test. It was established that none
of the independent variables were highly correlated, because in all the bivariate
relationships there was no r greater than or equal to 0.9. Hence based on correlation
analysis results in Appendix 24, the assumption of multicollinearity was not violated.
80
Assumption six; no significant outliers, unusual cases or highly influential points.
Outliers, leverage and influential points are different terms used to represent observations
in a data set that are in some way unusual when performing a multiple regression
analysis. The study adopted the use of descriptive statistics in examining the existence of
outliers. A descriptive analysis of the five factors that influence customer satisfaction
was performed with specific interest on z-scores.
The resulting z-scores were subjected to another descriptive analysis, with specific focus
on minimum and maximum z-scores as displayed in Appendix 25 which shows that
human elements responsiveness had the highest z-score was 2.170, followed by corporate
image with a z-score of 2.125 and human elements reliability had a z-score of 1.644. The
factor with the least z score was service blueprint with a z-score of - 3.078. The threshold
was a z-score of 3.29, any z-score greater than 3.29 would have meant that the factor was
3.29 standard deviations away from the mean and this would have been considered as an
indicator of existence of an outlier on the said factor. It was therefore inferred that the
data did not violate the assumption of non-significant outliers. To check whether there
were outliers that had undue influence on the results for the regression model, Cook’s
distance in the residuals statistics in Appendix 25 was interpreted. According to
Tabachnick and Fidell (2007), cases with values larger than one are potential problem.
The maximum value for Cook’s distance was 0.103, suggesting no major problem; hence
there were no outliers likely to influence the regression model.
Assumption eight; normal distribution of the residuals. The study used a histogram with a
superimposed normal curve to test the data set for normality as shown in Appendix 26.
The standardized residuals showed a normal distribution curve, with a concentration of
the variables at the centre of the histogram. The concentration of the data set around zero
shows the data was normally distributed and hence adequate for regression analysis.
4.10 Relationship Between Human Elements and Customer Satisfaction
The first research objective was to assess the extent to which service quality affect
customer satisfaction. Service quality had four dimensions according to the conceptual
framework in Figure 2, which were human elements, non-human elements, service
blueprint and core service. The individual influence of these dimensions was sought
81
followed by an examination of the overall influence of service quality on customer
satisfaction.
The human element dimension was defined by four variables responsiveness, reliable,
assurance and empathy. Factor analysis showed that human element was
multidimensional, with two reliable dimensions revealed as human elements reliability
and human elements responsiveness. The predicted model relating human elements
reliability and human elements responsiveness and customer satisfaction was presented
using the linear regression model as:
CS = β0 +6HERI +7HERE + 0 (2)
where;
CS was customer satisfaction
HERI was human elements reliability
HERE was human elements responsiveness
β0 was a constant associated with the regression model
0 was error term associated with the regression model
The relationship between human elements and customer satisfaction was examined using
OLS method of estimation by testing the first research hypothesis (H1) which stated that:
H1: There is no relationship between human elements and customer satisfaction
Hierarchical multiple regression was used to assess the ability of human elements to
predict levels of customer satisfaction. Hierarchical regression was preferred because it
allowed for assessment of what one independent variable or a block of independent
variables added to the prediction of the dependent variable while controlling for the
previous variables. Once all the independent variables were entered, the overall model
was evaluated in terms of its ability to predict customer satisfaction.
The model summary of human elements and customer satisfaction in Table 4.22, shows
the coefficient of determination (R2) under model one was 0.494, which meant the human
elements (reliability and responsiveness) explained 49.4 percent of the variations in
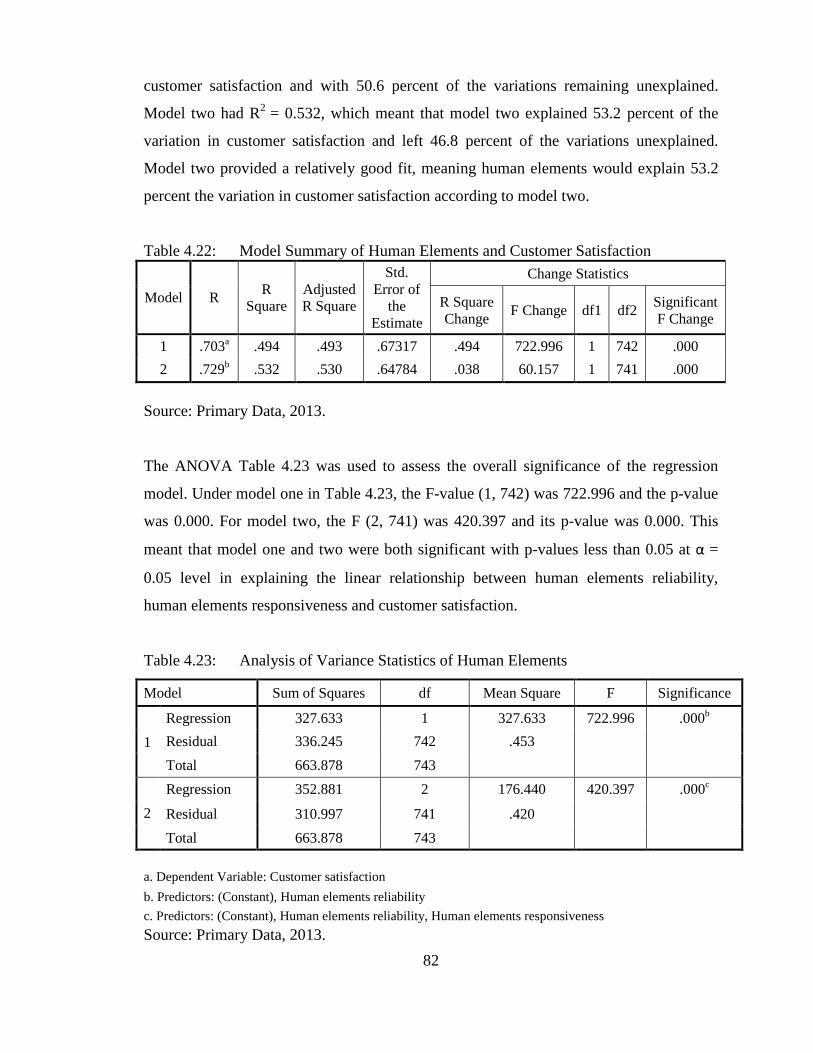
82
customer satisfaction and with 50.6 percent of the variations remaining unexplained.
Model two had R2
= 0.532, which meant that model two explained 53.2 percent of the
variation in customer satisfaction and left 46.8 percent of the variations unexplained.
Model two provided a relatively good fit, meaning human elements would explain 53.2
percent the variation in customer satisfaction according to model two.
Table 4.22: Model Summary of Human Elements and Customer Satisfaction
Model R R
Square
Adjusted
R Square
Std.
Error of
the
Estimate
Change Statistics
R Square
Change F Change df1 df2
Significant
F Change
1 .703a .494 .493 .67317 .494 722.996 1 742 .000
2 .729b .532 .530 .64784 .038 60.157 1 741 .000
Source: Primary Data, 2013.
The ANOVA Table 4.23 was used to assess the overall significance of the regression
model. Under model one in Table 4.23, the F-value (1, 742) was 722.996 and the p-value
was 0.000. For model two, the F (2, 741) was 420.397 and its p-value was 0.000. This
meant that model one and two were both significant with p-values less than 0.05 at α =
0.05 level in explaining the linear relationship between human elements reliability,
human elements responsiveness and customer satisfaction.
Table 4.23: Analysis of Variance Statistics of Human Elements
Model Sum of Squares df Mean Square F Significance
1
Regression 327.633 1 327.633 722.996 .000b
Residual 336.245 742 .453
Total 663.878 743
2
Regression 352.881 2 176.440 420.397 .000c
Residual 310.997 741 .420
Total 663.878 743
a. Dependent Variable: Customer satisfaction
b. Predictors: (Constant), Human elements reliability
c. Predictors: (Constant), Human elements reliability, Human elements responsiveness
Source: Primary Data, 2013.
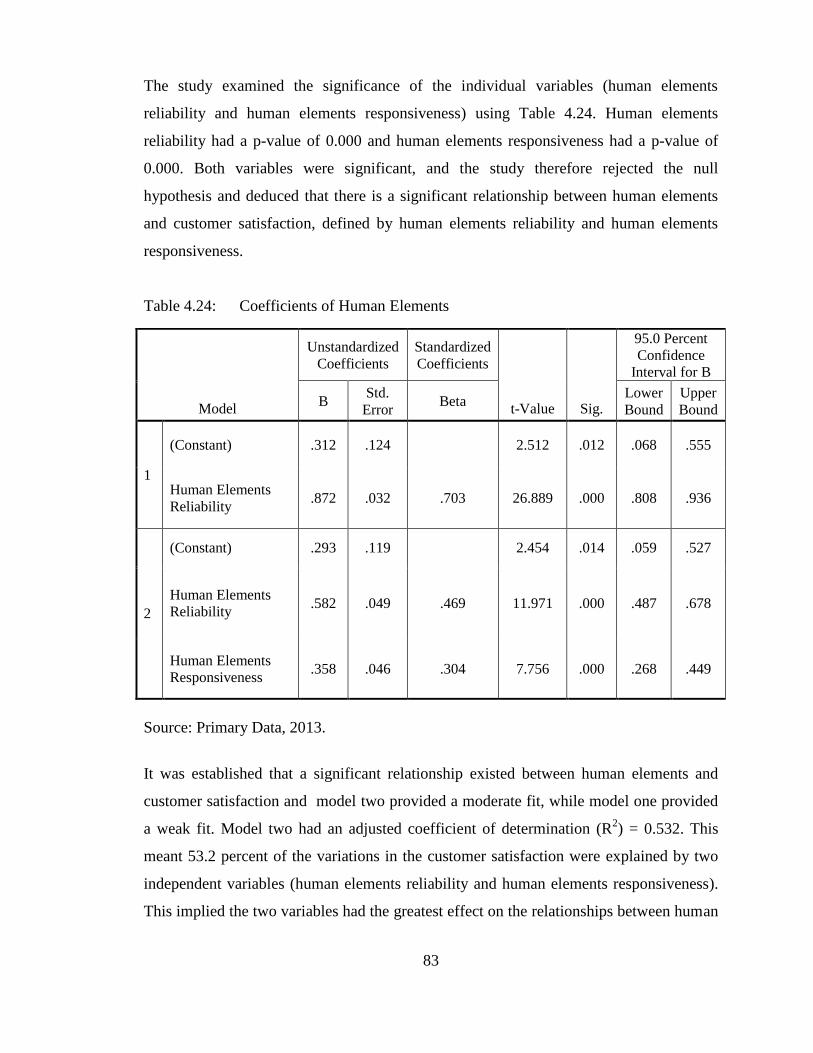
83
The study examined the significance of the individual variables (human elements
reliability and human elements responsiveness) using Table 4.24. Human elements
reliability had a p-value of 0.000 and human elements responsiveness had a p-value of
0.000. Both variables were significant, and the study therefore rejected the null
hypothesis and deduced that there is a significant relationship between human elements
and customer satisfaction, defined by human elements reliability and human elements
responsiveness.
Table 4.24: Coefficients of Human Elements
Source: Primary Data, 2013.
It was established that a significant relationship existed between human elements and
customer satisfaction and model two provided a moderate fit, while model one provided
a weak fit. Model two had an adjusted coefficient of determination (R2) = 0.532. This
meant 53.2 percent of the variations in the customer satisfaction were explained by two
independent variables (human elements reliability and human elements responsiveness).
This implied the two variables had the greatest effect on the relationships between human
Model
Unstandardized
Coefficients
Standardized
Coefficients
t-Value
Sig.
95.0 Percent
Confidence
Interval for B
B Std.
Error Beta
Lower
Bound
Upper
Bound
1
(Constant) .312 .124 2.512 .012 .068 .555
Human Elements
Reliability .872 .032 .703 26.889 .000 .808 .936
2
(Constant) .293 .119 2.454 .014 .059 .527
Human Elements
Reliability .582 .049 .469 11.971 .000 .487 .678
Human Elements
Responsiveness .358 .046 .304 7.756 .000 .268 .449
84
elements dimension of service quality and customer satisfaction in a two factor model.
This relationship was presented by the fitted model as:
CS = 0.293 + 0.582 HERI + 0.358 HERE
(0.014) (0.000) (0.000)
R2 = 0.532
Human elements reliability had the highest beta value, β6 = 0.582 as shown above. A unit
increase in human elements reliability would therefore result in a 58.2 percent increase in
customer satisfaction in a linear relationship with only two independent variables. Human
elements responsiveness had a beta value (β7) of 0.358, which meant a unit increase in
human elements responsiveness would result in a 35.8 percent increase in customer
satisfaction. The fitted regression model above shows a positive relationship between
human elements reliability, human elements responsiveness and customer satisfaction.
Overall, this meant that the higher the levels of human elements dimension of service
quality, the higher the levels of student satisfaction in Kenyan universities
4.11 Relationship Between Non-Human Elements and Customer Satisfaction
The relationship between non-human elements and customer satisfaction was examined
by using linear regression analysis. The predicted model relating non-human elements
and customer satisfaction was presented as:
CS = 0 + 8 NHE + 0 (3)
In this equation, 0 was the estimate of the intercept and ε0 was the associated regression
error term. 8 was the beta value associated with Non-Human Elements (NHE) and CS
stood for customer satisfaction. The relationship between non-human elements and
customer satisfaction was examined by testing the second research hypothesis (H2) which
stated that:
H2: There is no relationship between non-human elements and customer satisfaction
Using OLS method of estimation under linear regression analysis, the study proceeded to
determine the effect of non-human elements on customer satisfaction. The model
summary in Table 4.25 shows that under model one, the value of R2
was 0.315. This
meant that non-human elements explained only 31.55 of the variations in customer
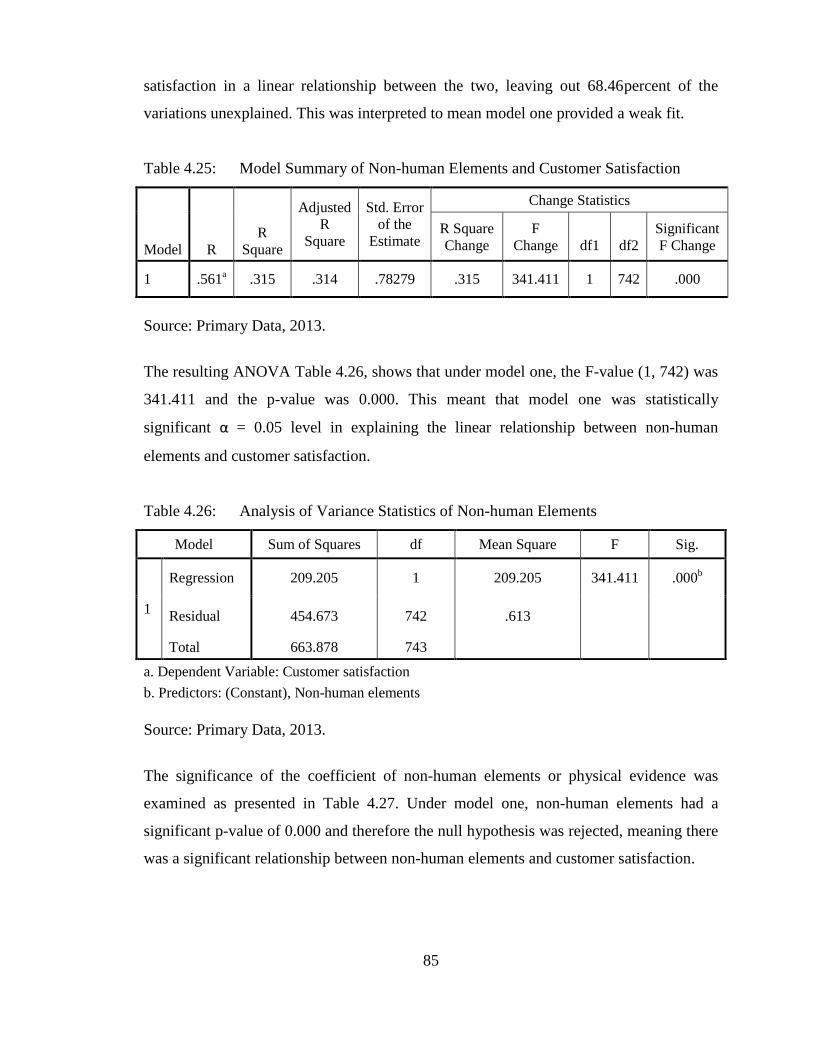
85
satisfaction in a linear relationship between the two, leaving out 68.46percent of the
variations unexplained. This was interpreted to mean model one provided a weak fit.
Table 4.25: Model Summary of Non-human Elements and Customer Satisfaction
Model
R
R
Square
Adjusted
R
Square
Std. Error
of the
Estimate
Change Statistics
R Square
Change
F
Change
df1
df2
Significant
F Change
1 .561a .315 .314 .78279 .315 341.411 1 742 .000
Source: Primary Data, 2013.
The resulting ANOVA Table 4.26, shows that under model one, the F-value (1, 742) was
341.411 and the p-value was 0.000. This meant that model one was statistically
significant α = 0.05 level in explaining the linear relationship between non-human
elements and customer satisfaction.
Table 4.26: Analysis of Variance Statistics of Non-human Elements
Model Sum of Squares df Mean Square F Sig.
1
Regression 209.205 1 209.205 341.411 .000b
Residual 454.673 742 .613
Total 663.878 743
a. Dependent Variable: Customer satisfaction
b. Predictors: (Constant), Non-human elements
Source: Primary Data, 2013.
The significance of the coefficient of non-human elements or physical evidence was
examined as presented in Table 4.27. Under model one, non-human elements had a
significant p-value of 0.000 and therefore the null hypothesis was rejected, meaning there
was a significant relationship between non-human elements and customer satisfaction.
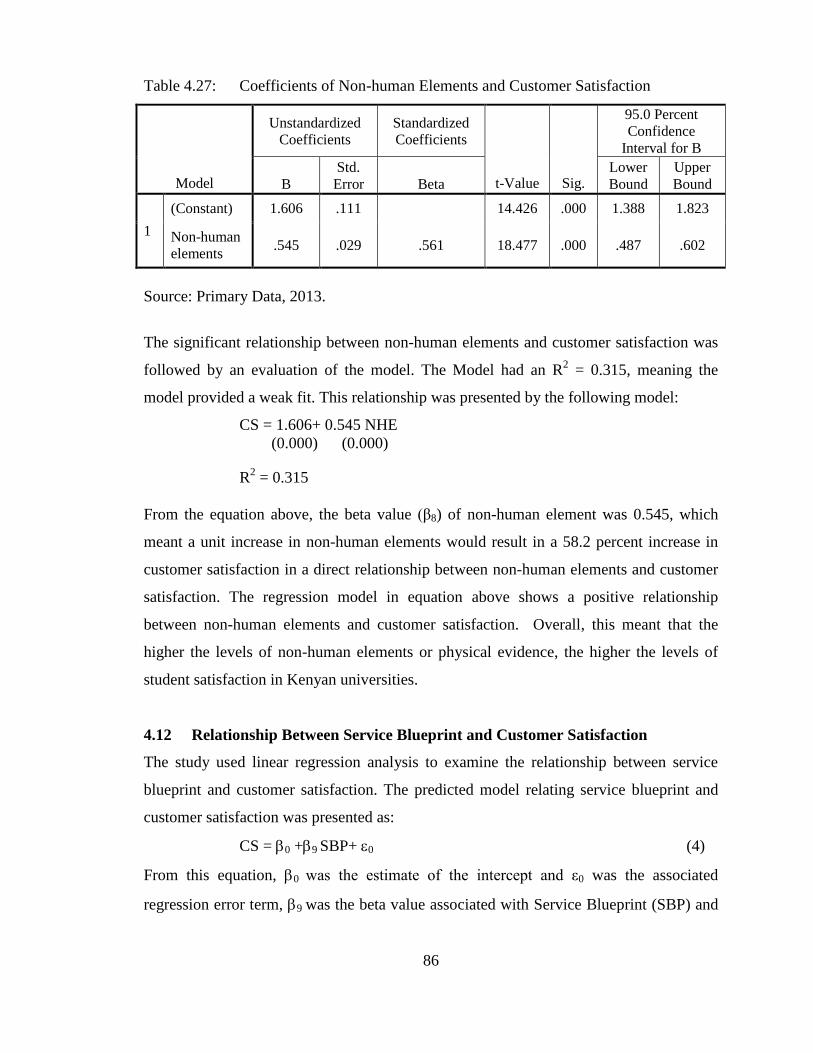
86
Table 4.27: Coefficients of Non-human Elements and Customer Satisfaction
Model
Unstandardized
Coefficients
Standardized
Coefficients
t-Value
Sig.
95.0 Percent
Confidence
Interval for B
B
Std.
Error
Beta
Lower
Bound
Upper
Bound
1
(Constant) 1.606 .111 14.426 .000 1.388 1.823
Non-human
elements .545 .029 .561 18.477 .000 .487 .602
Source: Primary Data, 2013.
The significant relationship between non-human elements and customer satisfaction was
followed by an evaluation of the model. The Model had an R2 = 0.315, meaning the
model provided a weak fit. This relationship was presented by the following model:
CS = 1.606+ 0.545 NHE
(0.000) (0.000)
R2 = 0.315
From the equation above, the beta value (β8) of non-human element was 0.545, which
meant a unit increase in non-human elements would result in a 58.2 percent increase in
customer satisfaction in a direct relationship between non-human elements and customer
satisfaction. The regression model in equation above shows a positive relationship
between non-human elements and customer satisfaction. Overall, this meant that the
higher the levels of non-human elements or physical evidence, the higher the levels of
student satisfaction in Kenyan universities.
4.12 Relationship Between Service Blueprint and Customer Satisfaction
The study used linear regression analysis to examine the relationship between service
blueprint and customer satisfaction. The predicted model relating service blueprint and
customer satisfaction was presented as:
CS = 0 +9 SBP+ 0 (4)
From this equation, 0 was the estimate of the intercept and ε0 was the associated
regression error term, 9 was the beta value associated with Service Blueprint (SBP) and
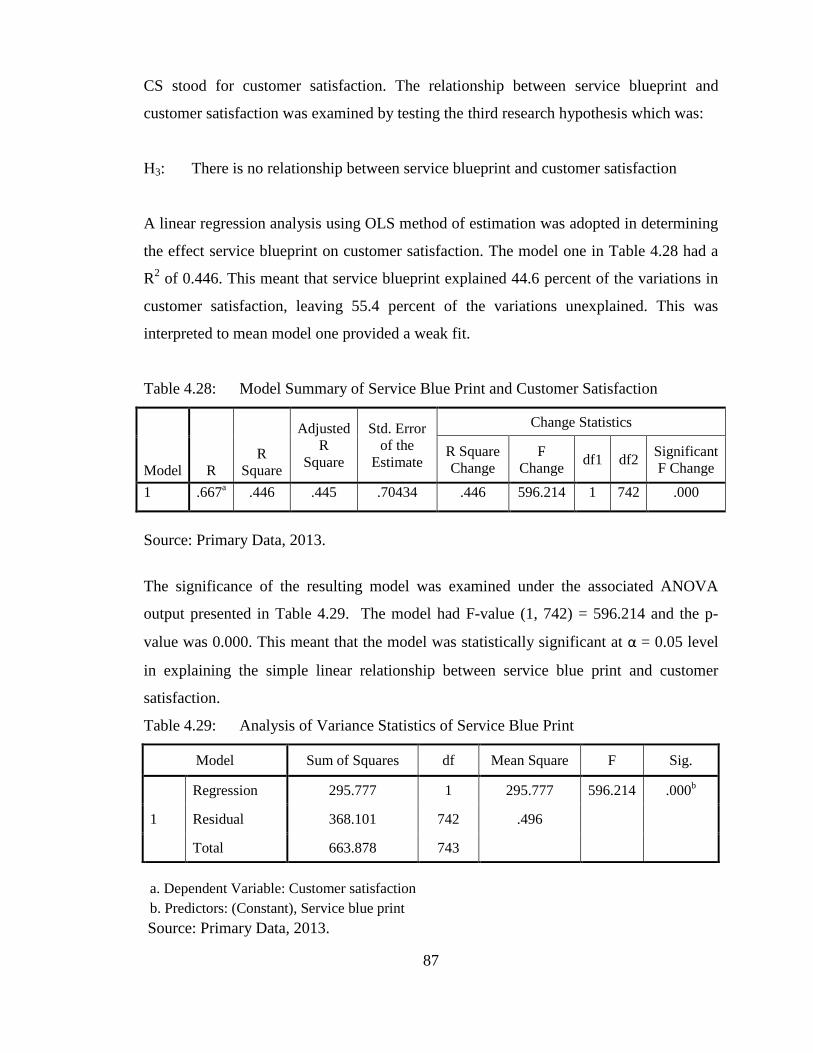
87
CS stood for customer satisfaction. The relationship between service blueprint and
customer satisfaction was examined by testing the third research hypothesis which was:
H3: There is no relationship between service blueprint and customer satisfaction
A linear regression analysis using OLS method of estimation was adopted in determining
the effect service blueprint on customer satisfaction. The model one in Table 4.28 had a
R2 of 0.446. This meant that service blueprint explained 44.6 percent of the variations in
customer satisfaction, leaving 55.4 percent of the variations unexplained. This was
interpreted to mean model one provided a weak fit.
Table 4.28: Model Summary of Service Blue Print and Customer Satisfaction
Model
R
R
Square
Adjusted
R
Square
Std. Error
of the
Estimate
Change Statistics
R Square
Change
F
Change df1 df2
Significant
F Change
1 .667a .446 .445 .70434 .446 596.214 1 742 .000
Source: Primary Data, 2013.
The significance of the resulting model was examined under the associated ANOVA
output presented in Table 4.29. The model had F-value (1, 742) = 596.214 and the p-
value was 0.000. This meant that the model was statistically significant at α = 0.05 level
in explaining the simple linear relationship between service blue print and customer
satisfaction.
Table 4.29: Analysis of Variance Statistics of Service Blue Print
Model Sum of Squares df Mean Square F Sig.
1
Regression 295.777 1 295.777 596.214 .000b
Residual 368.101 742 .496
Total 663.878 743
a. Dependent Variable: Customer satisfaction
b. Predictors: (Constant), Service blue print
Source: Primary Data, 2013.
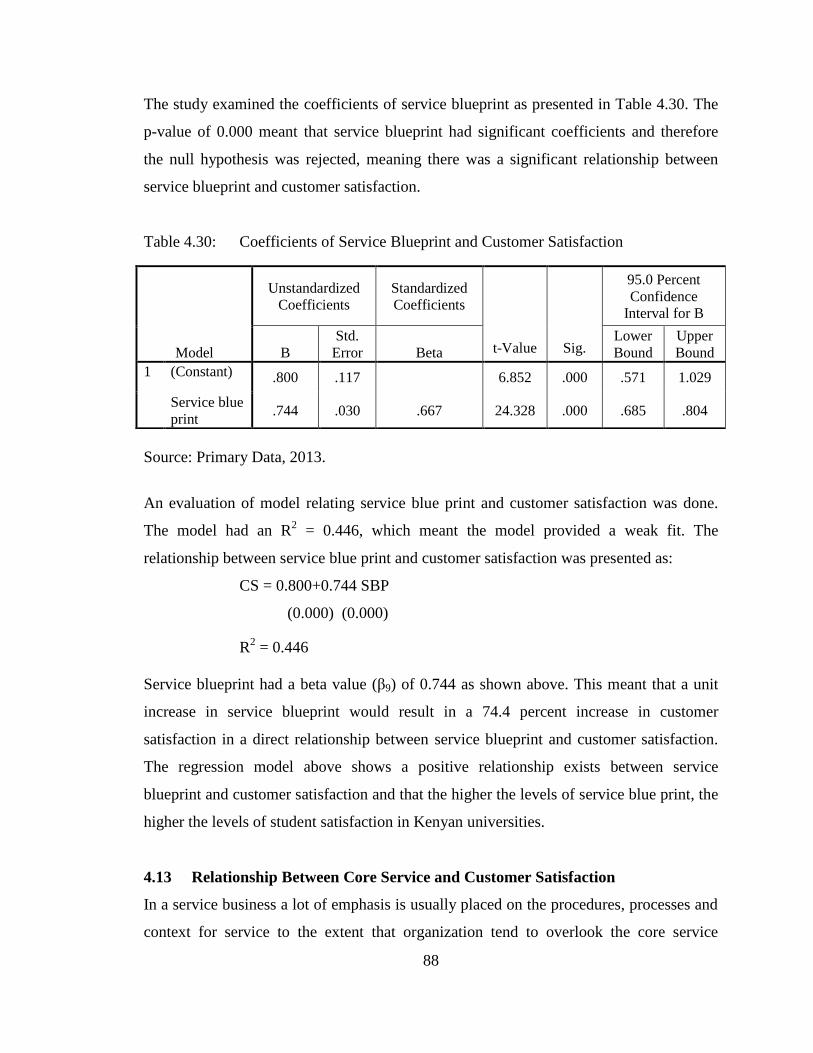
88
The study examined the coefficients of service blueprint as presented in Table 4.30. The
p-value of 0.000 meant that service blueprint had significant coefficients and therefore
the null hypothesis was rejected, meaning there was a significant relationship between
service blueprint and customer satisfaction.
Table 4.30: Coefficients of Service Blueprint and Customer Satisfaction
Source: Primary Data, 2013.
An evaluation of model relating service blue print and customer satisfaction was done.
The model had an R2 = 0.446, which meant the model provided a weak fit. The
relationship between service blue print and customer satisfaction was presented as:
CS = 0.800+0.744 SBP
(0.000) (0.000)
R2 = 0.446
Service blueprint had a beta value (β9) of 0.744 as shown above. This meant that a unit
increase in service blueprint would result in a 74.4 percent increase in customer
satisfaction in a direct relationship between service blueprint and customer satisfaction.
The regression model above shows a positive relationship exists between service
blueprint and customer satisfaction and that the higher the levels of service blue print, the
higher the levels of student satisfaction in Kenyan universities.
4.13 Relationship Between Core Service and Customer Satisfaction
In a service business a lot of emphasis is usually placed on the procedures, processes and
context for service to the extent that organization tend to overlook the core service
Model
Unstandardized
Coefficients
Standardized
Coefficients
t-Value
Sig.
95.0 Percent
Confidence
Interval for B
B
Std.
Error
Beta
Lower
Bound
Upper
Bound
1 (Constant) .800 .117 6.852 .000 .571 1.029
Service blue
print .744 .030 .667 24.328 .000 .685 .804
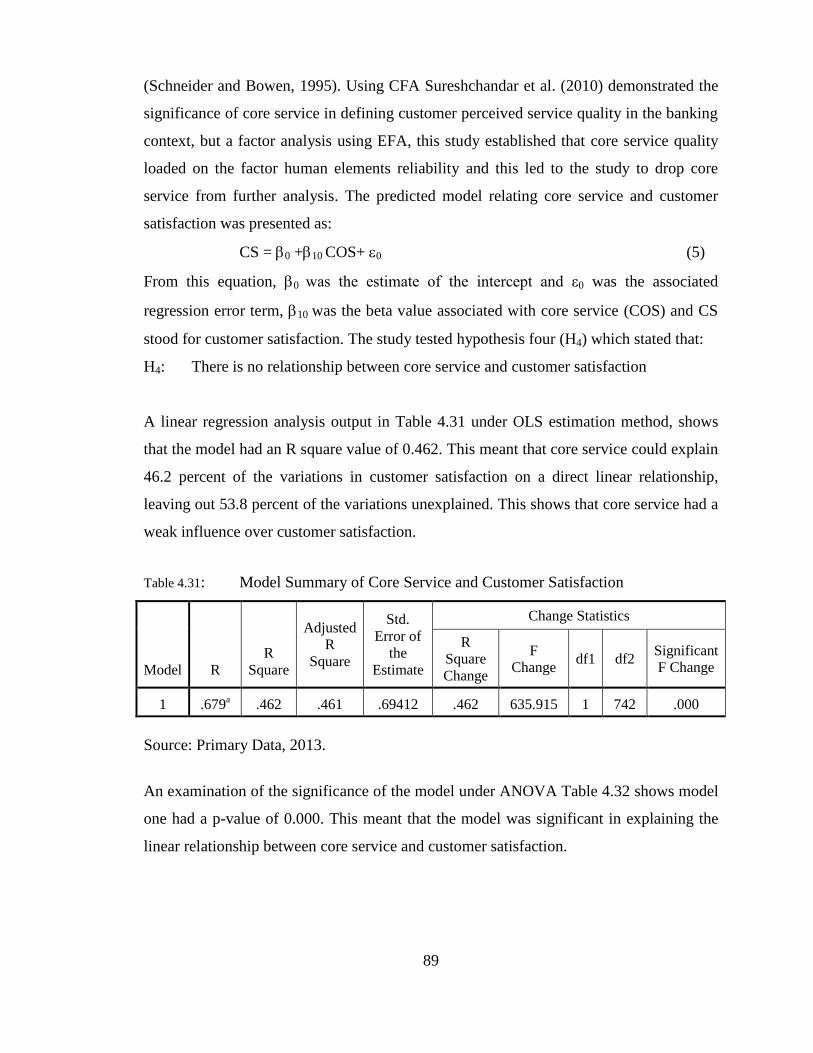
89
(Schneider and Bowen, 1995). Using CFA Sureshchandar et al. (2010) demonstrated the
significance of core service in defining customer perceived service quality in the banking
context, but a factor analysis using EFA, this study established that core service quality
loaded on the factor human elements reliability and this led to the study to drop core
service from further analysis. The predicted model relating core service and customer
satisfaction was presented as:
CS = 0 +10 COS+ 0 (5)
From this equation, 0 was the estimate of the intercept and ε0 was the associated
regression error term, 10 was the beta value associated with core service (COS) and CS
stood for customer satisfaction. The study tested hypothesis four (H4) which stated that:
H4: There is no relationship between core service and customer satisfaction
A linear regression analysis output in Table 4.31 under OLS estimation method, shows
that the model had an R square value of 0.462. This meant that core service could explain
46.2 percent of the variations in customer satisfaction on a direct linear relationship,
leaving out 53.8 percent of the variations unexplained. This shows that core service had a
weak influence over customer satisfaction.
Table 4.31: Model Summary of Core Service and Customer Satisfaction
Model
R
R
Square
Adjusted
R
Square
Std.
Error of
the
Estimate
Change Statistics
R
Square
Change
F
Change df1 df2
Significant
F Change
1 .679a .462 .461 .69412 .462 635.915 1 742 .000
Source: Primary Data, 2013.
An examination of the significance of the model under ANOVA Table 4.32 shows model
one had a p-value of 0.000. This meant that the model was significant in explaining the
linear relationship between core service and customer satisfaction.
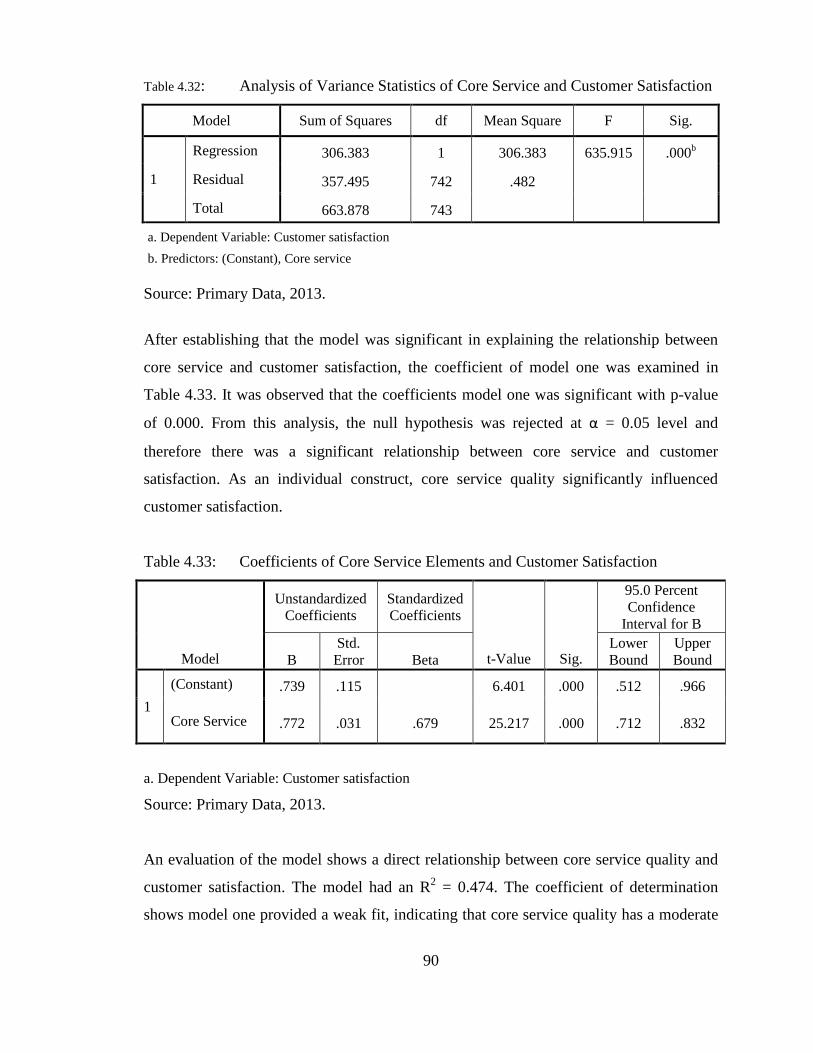
90
Table 4.32: Analysis of Variance Statistics of Core Service and Customer Satisfaction
Model Sum of Squares df Mean Square F Sig.
1
Regression 306.383 1 306.383 635.915 .000b
Residual 357.495 742 .482
Total 663.878 743
a. Dependent Variable: Customer satisfaction
b. Predictors: (Constant), Core service
Source: Primary Data, 2013.
After establishing that the model was significant in explaining the relationship between
core service and customer satisfaction, the coefficient of model one was examined in
Table 4.33. It was observed that the coefficients model one was significant with p-value
of 0.000. From this analysis, the null hypothesis was rejected at α = 0.05 level and
therefore there was a significant relationship between core service and customer
satisfaction. As an individual construct, core service quality significantly influenced
customer satisfaction.
Table 4.33: Coefficients of Core Service Elements and Customer Satisfaction
Model
Unstandardized
Coefficients
Standardized
Coefficients
t-Value
Sig.
95.0 Percent
Confidence
Interval for B
B
Std.
Error
Beta
Lower
Bound
Upper
Bound
1
(Constant) .739 .115 6.401 .000 .512 .966
Core Service .772 .031 .679 25.217 .000 .712 .832
a. Dependent Variable: Customer satisfaction
Source: Primary Data, 2013.
An evaluation of the model shows a direct relationship between core service quality and
customer satisfaction. The model had an R2 = 0.474. The coefficient of determination
shows model one provided a weak fit, indicating that core service quality has a moderate
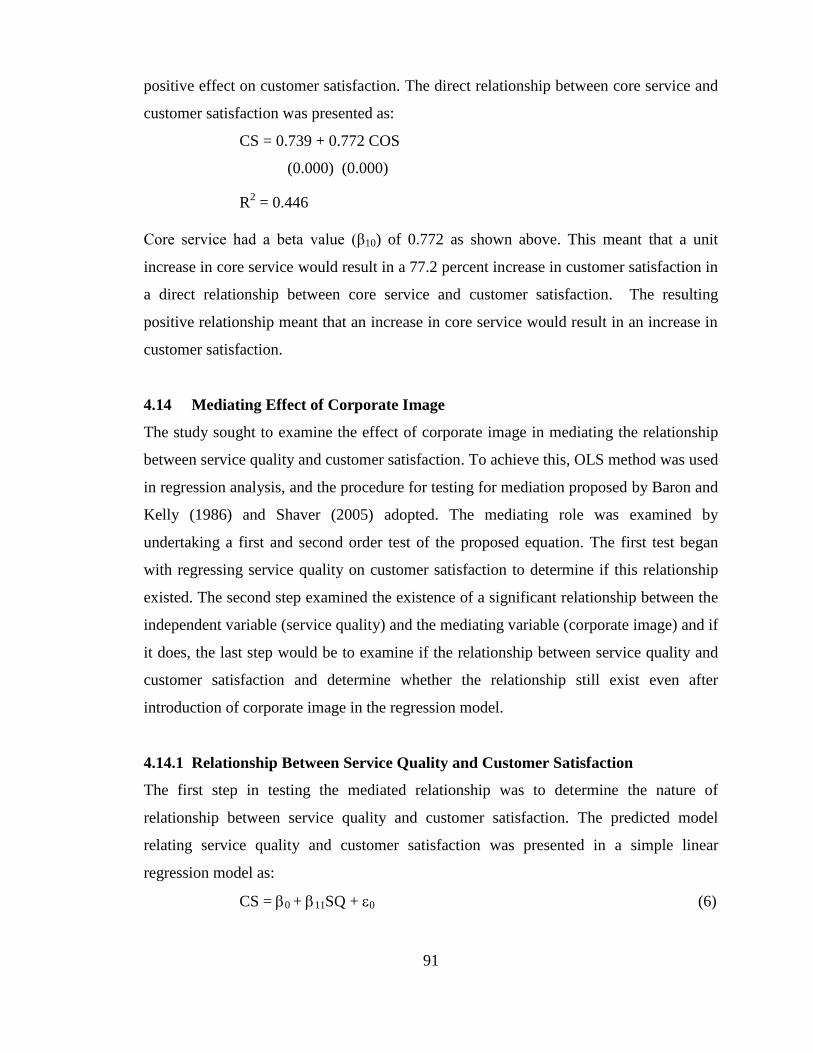
91
positive effect on customer satisfaction. The direct relationship between core service and
customer satisfaction was presented as:
CS = 0.739 + 0.772 COS
(0.000) (0.000)
R2 = 0.446
Core service had a beta value (β10) of 0.772 as shown above. This meant that a unit
increase in core service would result in a 77.2 percent increase in customer satisfaction in
a direct relationship between core service and customer satisfaction. The resulting
positive relationship meant that an increase in core service would result in an increase in
customer satisfaction.
4.14 Mediating Effect of Corporate Image
The study sought to examine the effect of corporate image in mediating the relationship
between service quality and customer satisfaction. To achieve this, OLS method was used
in regression analysis, and the procedure for testing for mediation proposed by Baron and
Kelly (1986) and Shaver (2005) adopted. The mediating role was examined by
undertaking a first and second order test of the proposed equation. The first test began
with regressing service quality on customer satisfaction to determine if this relationship
existed. The second step examined the existence of a significant relationship between the
independent variable (service quality) and the mediating variable (corporate image) and if
it does, the last step would be to examine if the relationship between service quality and
customer satisfaction and determine whether the relationship still exist even after
introduction of corporate image in the regression model.
4.14.1 Relationship Between Service Quality and Customer Satisfaction
The first step in testing the mediated relationship was to determine the nature of
relationship between service quality and customer satisfaction. The predicted model
relating service quality and customer satisfaction was presented in a simple linear
regression model as:
CS = 0 + 11SQ + 0 (6)
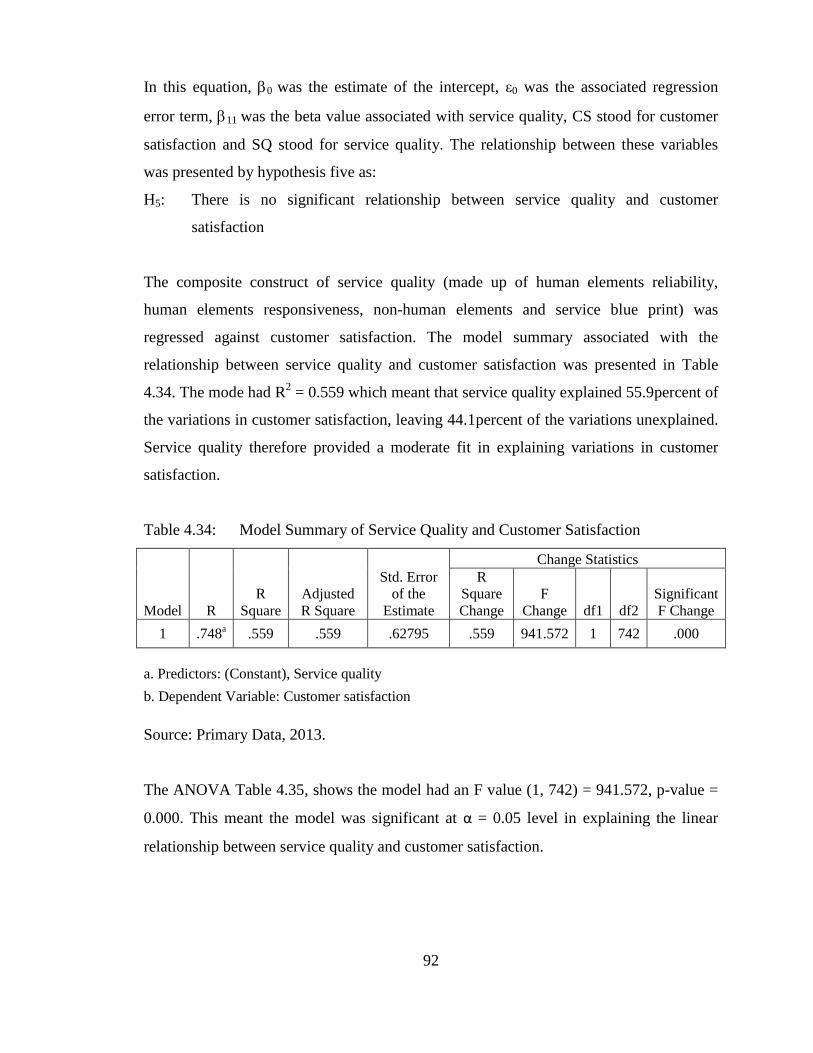
92
In this equation, 0 was the estimate of the intercept, ε0 was the associated regression
error term, 11 was the beta value associated with service quality, CS stood for customer
satisfaction and SQ stood for service quality. The relationship between these variables
was presented by hypothesis five as:
H5: There is no significant relationship between service quality and customer
satisfaction
The composite construct of service quality (made up of human elements reliability,
human elements responsiveness, non-human elements and service blue print) was
regressed against customer satisfaction. The model summary associated with the
relationship between service quality and customer satisfaction was presented in Table
4.34. The mode had R2 = 0.559 which meant that service quality explained 55.9percent of
the variations in customer satisfaction, leaving 44.1percent of the variations unexplained.
Service quality therefore provided a moderate fit in explaining variations in customer
satisfaction.
Table 4.34: Model Summary of Service Quality and Customer Satisfaction
Model R
R
Square
Adjusted
R Square
Std. Error
of the
Estimate
Change Statistics
R
Square
Change
F
Change df1 df2
Significant
F Change
1 .748a .559 .559 .62795 .559 941.572 1 742 .000
a. Predictors: (Constant), Service quality
b. Dependent Variable: Customer satisfaction
Source: Primary Data, 2013.
The ANOVA Table 4.35, shows the model had an F value (1, 742) = 941.572, p-value =
0.000. This meant the model was significant at α = 0.05 level in explaining the linear
relationship between service quality and customer satisfaction.
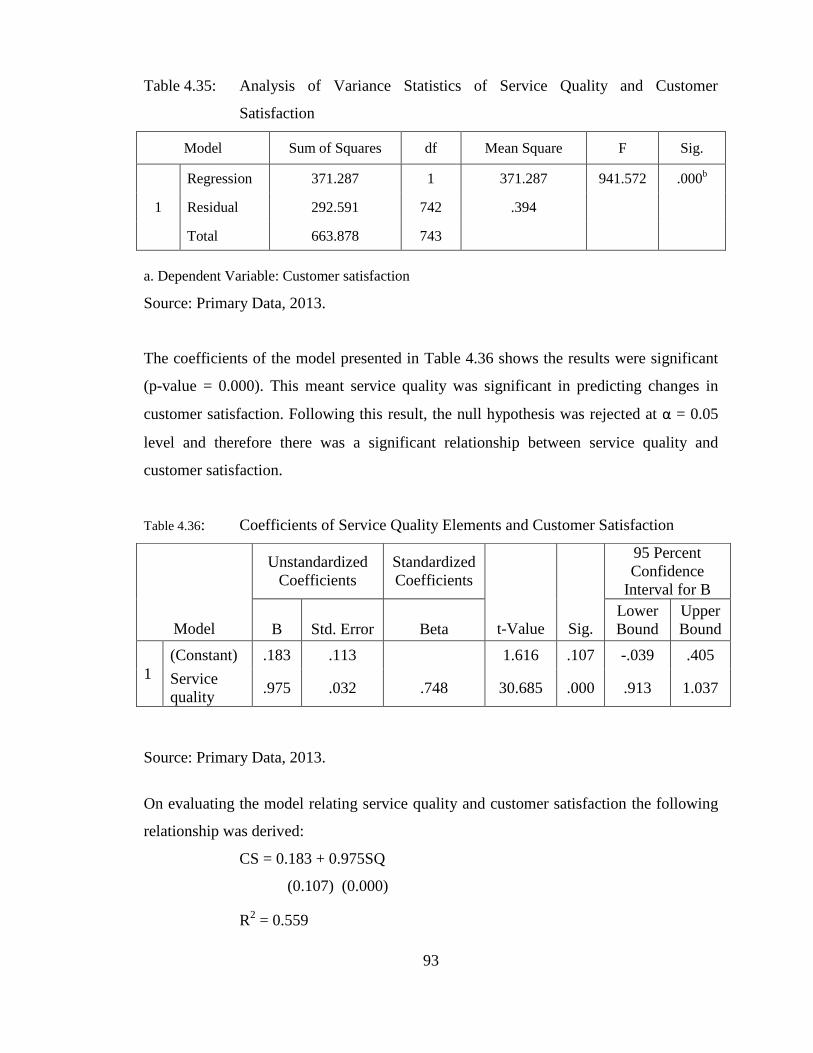
93
Table 4.35: Analysis of Variance Statistics of Service Quality and Customer
Satisfaction
Model Sum of Squares df Mean Square F Sig.
1
Regression 371.287 1 371.287 941.572 .000b
Residual 292.591 742 .394
Total 663.878 743
a. Dependent Variable: Customer satisfaction
Source: Primary Data, 2013.
The coefficients of the model presented in Table 4.36 shows the results were significant
(p-value = 0.000). This meant service quality was significant in predicting changes in
customer satisfaction. Following this result, the null hypothesis was rejected at α = 0.05
level and therefore there was a significant relationship between service quality and
customer satisfaction.
Table 4.36: Coefficients of Service Quality Elements and Customer Satisfaction
Source: Primary Data, 2013.
On evaluating the model relating service quality and customer satisfaction the following
relationship was derived:
CS = 0.183 + 0.975SQ
(0.107) (0.000)
R2 = 0.559
Model
Unstandardized
Coefficients
Standardized
Coefficients
t-Value
Sig.
95 Percent
Confidence
Interval for B
B
Std. Error
Beta
Lower
Bound
Upper
Bound
1
(Constant) .183 .113 1.616 .107 -.039 .405
Service
quality .975 .032 .748 30.685 .000 .913 1.037
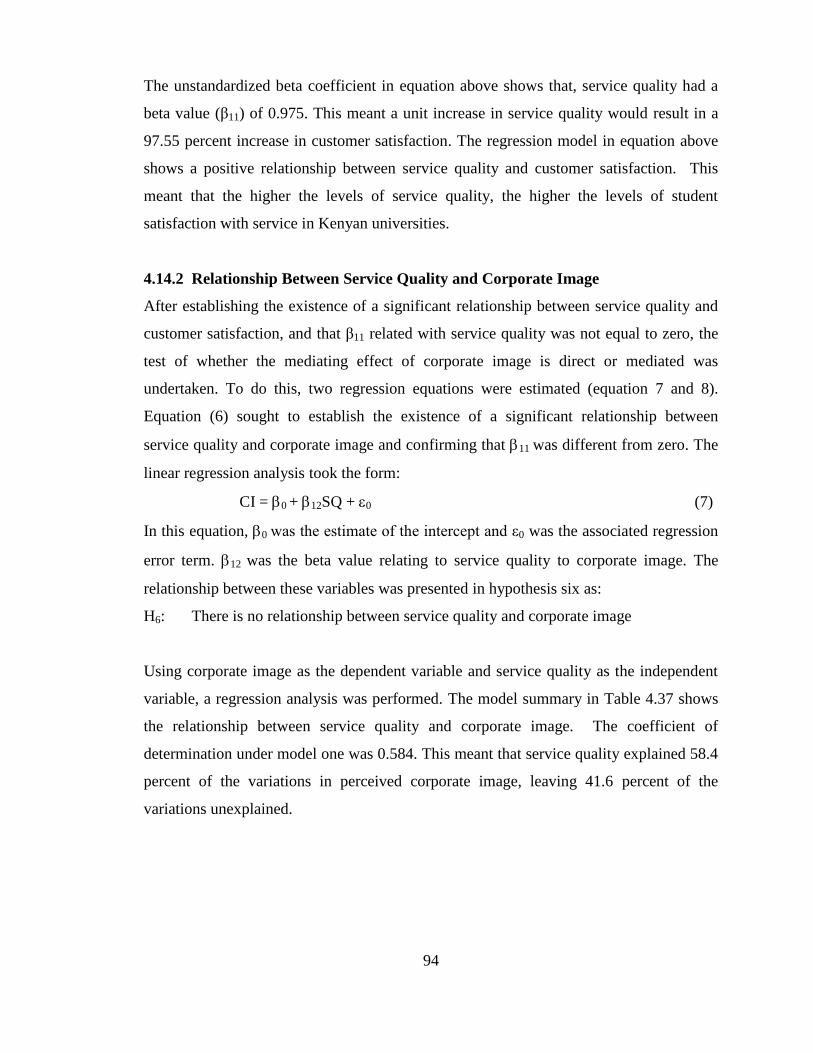
94
The unstandardized beta coefficient in equation above shows that, service quality had a
beta value (β11) of 0.975. This meant a unit increase in service quality would result in a
97.55 percent increase in customer satisfaction. The regression model in equation above
shows a positive relationship between service quality and customer satisfaction. This
meant that the higher the levels of service quality, the higher the levels of student
satisfaction with service in Kenyan universities.
4.14.2 Relationship Between Service Quality and Corporate Image
After establishing the existence of a significant relationship between service quality and
customer satisfaction, and that β11 related with service quality was not equal to zero, the
test of whether the mediating effect of corporate image is direct or mediated was
undertaken. To do this, two regression equations were estimated (equation 7 and 8).
Equation (6) sought to establish the existence of a significant relationship between
service quality and corporate image and confirming that 11 was different from zero. The
linear regression analysis took the form:
CI = 0 + 12SQ + 0 (7)
In this equation, 0 was the estimate of the intercept and ε0 was the associated regression
error term. 12 was the beta value relating to service quality to corporate image. The
relationship between these variables was presented in hypothesis six as:
H6: There is no relationship between service quality and corporate image
Using corporate image as the dependent variable and service quality as the independent
variable, a regression analysis was performed. The model summary in Table 4.37 shows
the relationship between service quality and corporate image. The coefficient of
determination under model one was 0.584. This meant that service quality explained 58.4
percent of the variations in perceived corporate image, leaving 41.6 percent of the
variations unexplained.
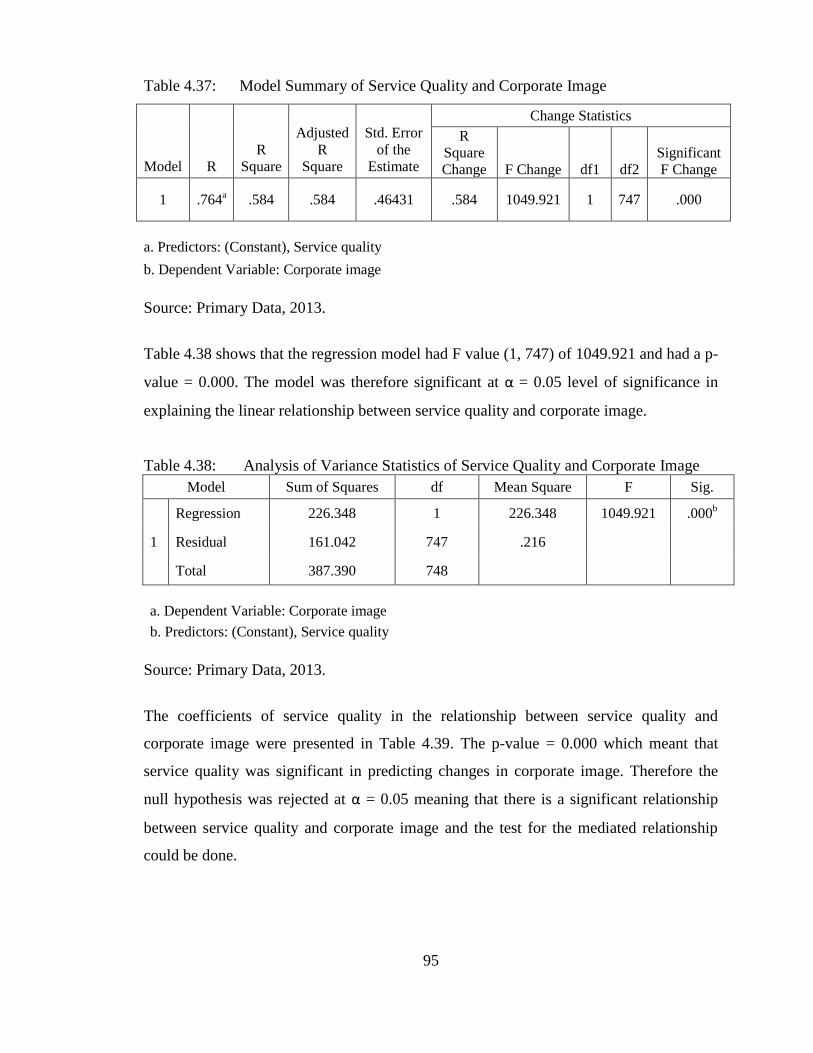
95
Table 4.37: Model Summary of Service Quality and Corporate Image
Model
R
R
Square
Adjusted
R
Square
Std. Error
of the
Estimate
Change Statistics
R
Square
Change
F Change
df1
df2
Significant
F Change
1 .764a .584 .584 .46431 .584 1049.921 1 747 .000
a. Predictors: (Constant), Service quality
b. Dependent Variable: Corporate image
Source: Primary Data, 2013.
Table 4.38 shows that the regression model had F value (1, 747) of 1049.921 and had a p-
value = 0.000. The model was therefore significant at α = 0.05 level of significance in
explaining the linear relationship between service quality and corporate image.
Table 4.38: Analysis of Variance Statistics of Service Quality and Corporate Image
Model Sum of Squares df Mean Square F Sig.
1
Regression 226.348 1 226.348 1049.921 .000b
Residual 161.042 747 .216
Total 387.390 748
a. Dependent Variable: Corporate image
b. Predictors: (Constant), Service quality
Source: Primary Data, 2013.
The coefficients of service quality in the relationship between service quality and
corporate image were presented in Table 4.39. The p-value = 0.000 which meant that
service quality was significant in predicting changes in corporate image. Therefore the
null hypothesis was rejected at α = 0.05 meaning that there is a significant relationship
between service quality and corporate image and the test for the mediated relationship
could be done.
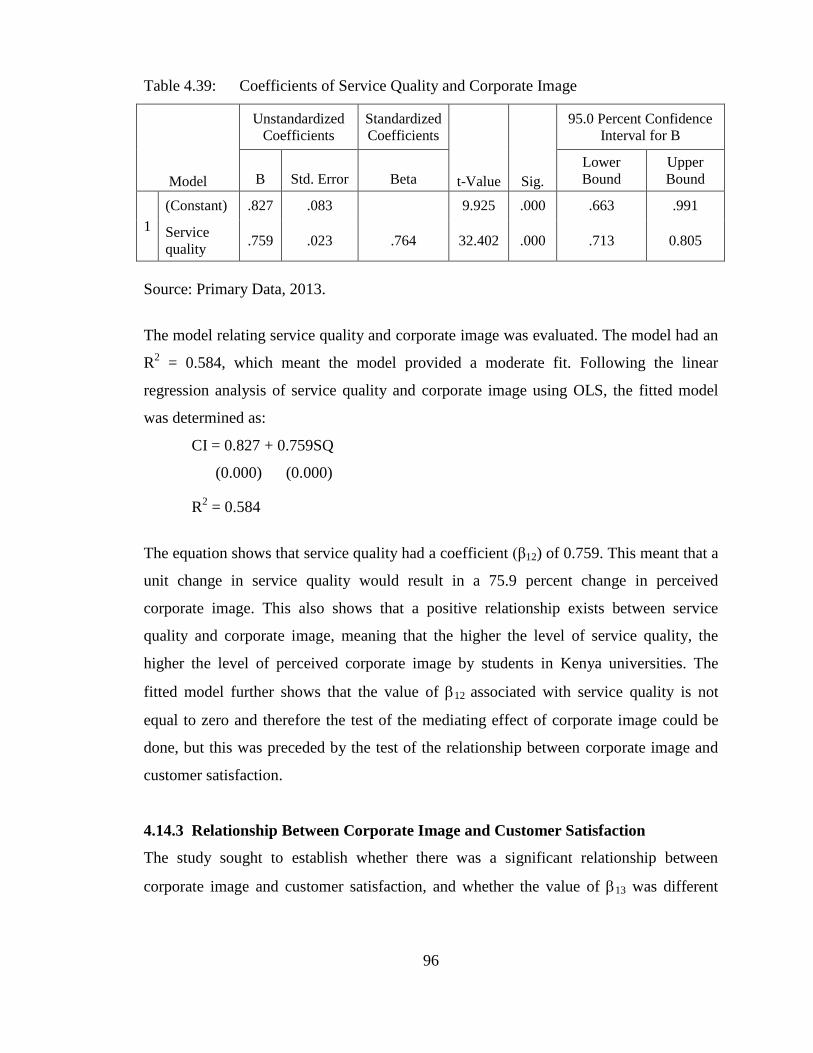
96
Table 4.39: Coefficients of Service Quality and Corporate Image
Model
Unstandardized
Coefficients
Standardized
Coefficients
t-Value
Sig.
95.0 Percent Confidence
Interval for B
B
Std. Error
Beta
Lower
Bound
Upper
Bound
1
(Constant) .827 .083 9.925 .000 .663 .991
Service
quality .759 .023 .764 32.402 .000 .713 0.805
Source: Primary Data, 2013.
The model relating service quality and corporate image was evaluated. The model had an
R2 = 0.584, which meant the model provided a moderate fit. Following the linear
regression analysis of service quality and corporate image using OLS, the fitted model
was determined as:
CI = 0.827 + 0.759SQ
(0.000) (0.000)
R2 = 0.584
The equation shows that service quality had a coefficient (β12) of 0.759. This meant that a
unit change in service quality would result in a 75.9 percent change in perceived
corporate image. This also shows that a positive relationship exists between service
quality and corporate image, meaning that the higher the level of service quality, the
higher the level of perceived corporate image by students in Kenya universities. The
fitted model further shows that the value of 12 associated with service quality is not
equal to zero and therefore the test of the mediating effect of corporate image could be
done, but this was preceded by the test of the relationship between corporate image and
customer satisfaction.
4.14.3 Relationship Between Corporate Image and Customer Satisfaction
The study sought to establish whether there was a significant relationship between
corporate image and customer satisfaction, and whether the value of 13 was different
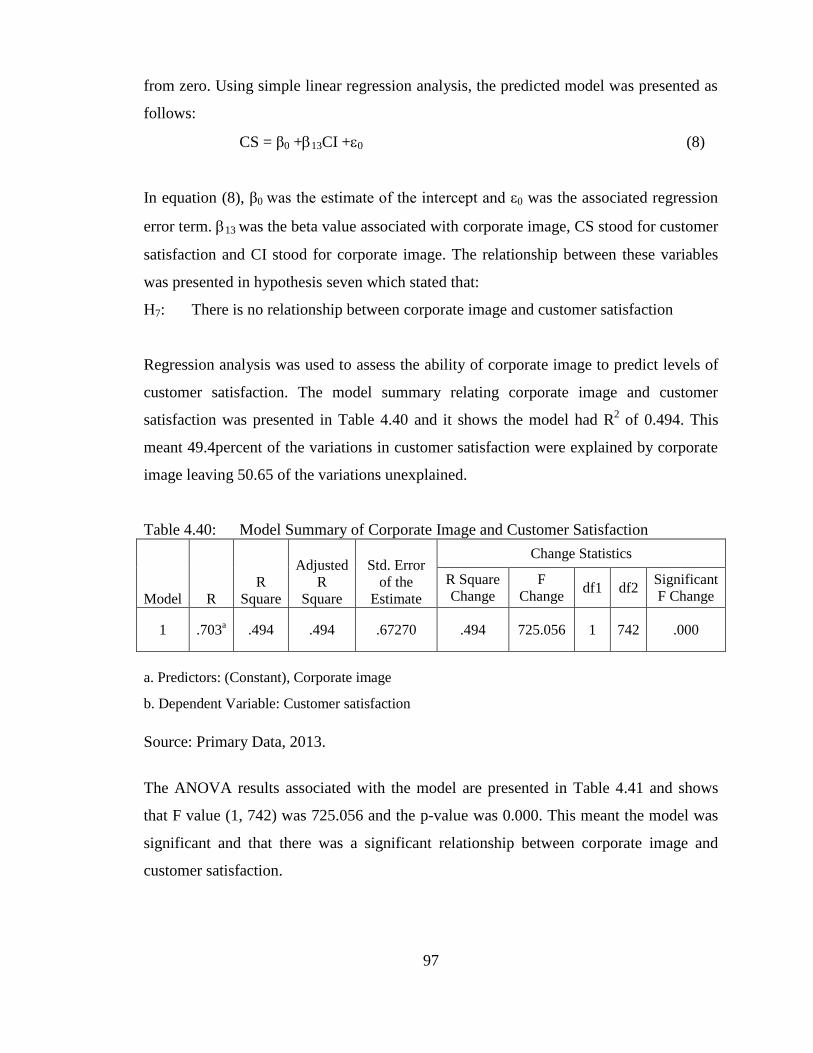
97
from zero. Using simple linear regression analysis, the predicted model was presented as
follows:
CS = β0 +13CI +0 (8)
In equation (8), β0 was the estimate of the intercept and ε0 was the associated regression
error term. 13 was the beta value associated with corporate image, CS stood for customer
satisfaction and CI stood for corporate image. The relationship between these variables
was presented in hypothesis seven which stated that:
H7: There is no relationship between corporate image and customer satisfaction
Regression analysis was used to assess the ability of corporate image to predict levels of
customer satisfaction. The model summary relating corporate image and customer
satisfaction was presented in Table 4.40 and it shows the model had R2 of 0.494. This
meant 49.4percent of the variations in customer satisfaction were explained by corporate
image leaving 50.65 of the variations unexplained.
Table 4.40: Model Summary of Corporate Image and Customer Satisfaction
Model
R
R
Square
Adjusted
R
Square
Std. Error
of the
Estimate
Change Statistics
R Square
Change
F
Change df1 df2
Significant
F Change
1 .703a .494 .494 .67270 .494 725.056 1 742 .000
a. Predictors: (Constant), Corporate image
b. Dependent Variable: Customer satisfaction
Source: Primary Data, 2013.
The ANOVA results associated with the model are presented in Table 4.41 and shows
that F value (1, 742) was 725.056 and the p-value was 0.000. This meant the model was
significant and that there was a significant relationship between corporate image and
customer satisfaction.
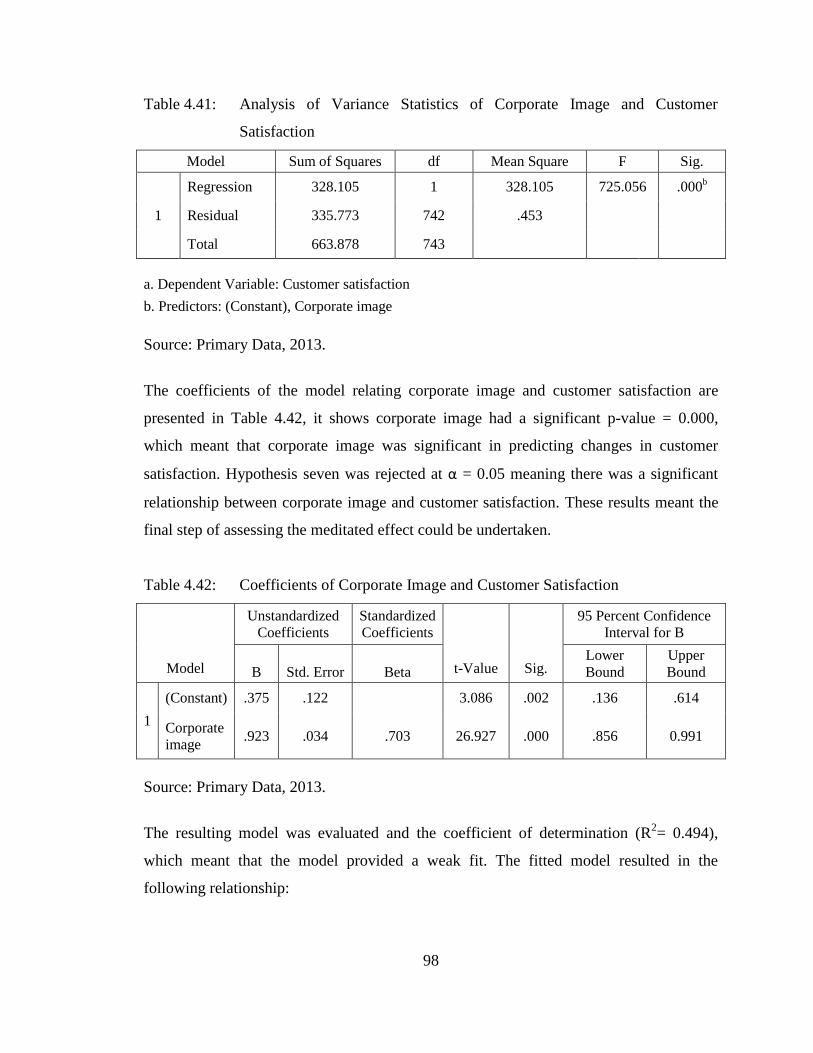
98
Table 4.41: Analysis of Variance Statistics of Corporate Image and Customer
Satisfaction
Model Sum of Squares df Mean Square F Sig.
1
Regression 328.105 1 328.105 725.056 .000b
Residual 335.773 742 .453
Total 663.878 743
a. Dependent Variable: Customer satisfaction
b. Predictors: (Constant), Corporate image
Source: Primary Data, 2013.
The coefficients of the model relating corporate image and customer satisfaction are
presented in Table 4.42, it shows corporate image had a significant p-value = 0.000,
which meant that corporate image was significant in predicting changes in customer
satisfaction. Hypothesis seven was rejected at α = 0.05 meaning there was a significant
relationship between corporate image and customer satisfaction. These results meant the
final step of assessing the meditated effect could be undertaken.
Table 4.42: Coefficients of Corporate Image and Customer Satisfaction
Model
Unstandardized
Coefficients
Standardized
Coefficients
t-Value
Sig.
95 Percent Confidence
Interval for B
B
Std. Error
Beta
Lower
Bound
Upper
Bound
1
(Constant) .375 .122 3.086 .002 .136 .614
Corporate
image .923 .034 .703 26.927 .000 .856 0.991
Source: Primary Data, 2013.
The resulting model was evaluated and the coefficient of determination (R2= 0.494),
which meant that the model provided a weak fit. The fitted model resulted in the
following relationship:
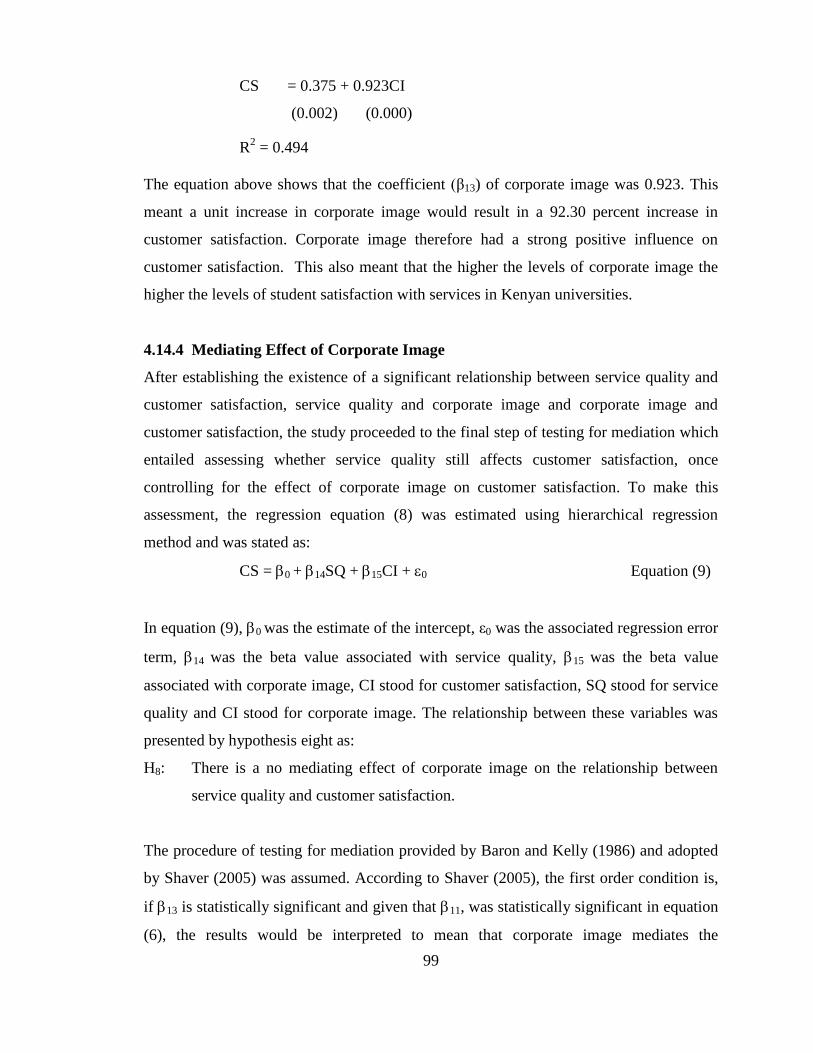
99
CS = 0.375 + 0.923CI
(0.002) (0.000)
R2 = 0.494
The equation above shows that the coefficient (β13) of corporate image was 0.923. This
meant a unit increase in corporate image would result in a 92.30 percent increase in
customer satisfaction. Corporate image therefore had a strong positive influence on
customer satisfaction. This also meant that the higher the levels of corporate image the
higher the levels of student satisfaction with services in Kenyan universities.
4.14.4 Mediating Effect of Corporate Image
After establishing the existence of a significant relationship between service quality and
customer satisfaction, service quality and corporate image and corporate image and
customer satisfaction, the study proceeded to the final step of testing for mediation which
entailed assessing whether service quality still affects customer satisfaction, once
controlling for the effect of corporate image on customer satisfaction. To make this
assessment, the regression equation (8) was estimated using hierarchical regression
method and was stated as:
CS = 0 + 14SQ + 15CI + 0 Equation (9)
In equation (9), 0 was the estimate of the intercept, ε0 was the associated regression error
term, 14 was the beta value associated with service quality, 15 was the beta value
associated with corporate image, CI stood for customer satisfaction, SQ stood for service
quality and CI stood for corporate image. The relationship between these variables was
presented by hypothesis eight as:
H8: There is a no mediating effect of corporate image on the relationship between
service quality and customer satisfaction.
The procedure of testing for mediation provided by Baron and Kelly (1986) and adopted
by Shaver (2005) was assumed. According to Shaver (2005), the first order condition is,
if 13 is statistically significant and given that 11, was statistically significant in equation
(6), the results would be interpreted to mean that corporate image mediates the
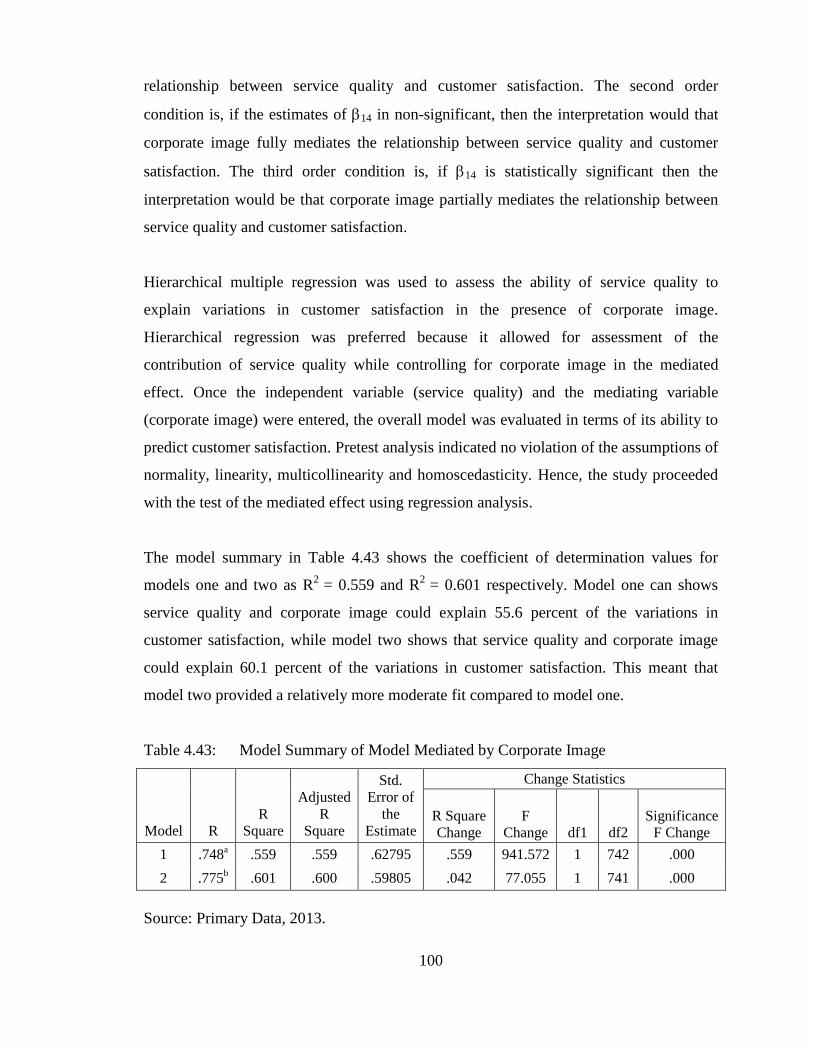
100
relationship between service quality and customer satisfaction. The second order
condition is, if the estimates of 14 in non-significant, then the interpretation would that
corporate image fully mediates the relationship between service quality and customer
satisfaction. The third order condition is, if 14 is statistically significant then the
interpretation would be that corporate image partially mediates the relationship between
service quality and customer satisfaction.
Hierarchical multiple regression was used to assess the ability of service quality to
explain variations in customer satisfaction in the presence of corporate image.
Hierarchical regression was preferred because it allowed for assessment of the
contribution of service quality while controlling for corporate image in the mediated
effect. Once the independent variable (service quality) and the mediating variable
(corporate image) were entered, the overall model was evaluated in terms of its ability to
predict customer satisfaction. Pretest analysis indicated no violation of the assumptions of
normality, linearity, multicollinearity and homoscedasticity. Hence, the study proceeded
with the test of the mediated effect using regression analysis.
The model summary in Table 4.43 shows the coefficient of determination values for
models one and two as R2
= 0.559 and R2
= 0.601 respectively. Model one can shows
service quality and corporate image could explain 55.6 percent of the variations in
customer satisfaction, while model two shows that service quality and corporate image
could explain 60.1 percent of the variations in customer satisfaction. This meant that
model two provided a relatively more moderate fit compared to model one.
Table 4.43: Model Summary of Model Mediated by Corporate Image
Model
R
R
Square
Adjusted
R
Square
Std.
Error of
the
Estimate
Change Statistics
R Square
Change
F
Change
df1
df2
Significance
F Change
1 .748a .559 .559 .62795 .559 941.572 1 742 .000
2 .775b .601 .600 .59805 .042 77.055 1 741 .000
Source: Primary Data, 2013.
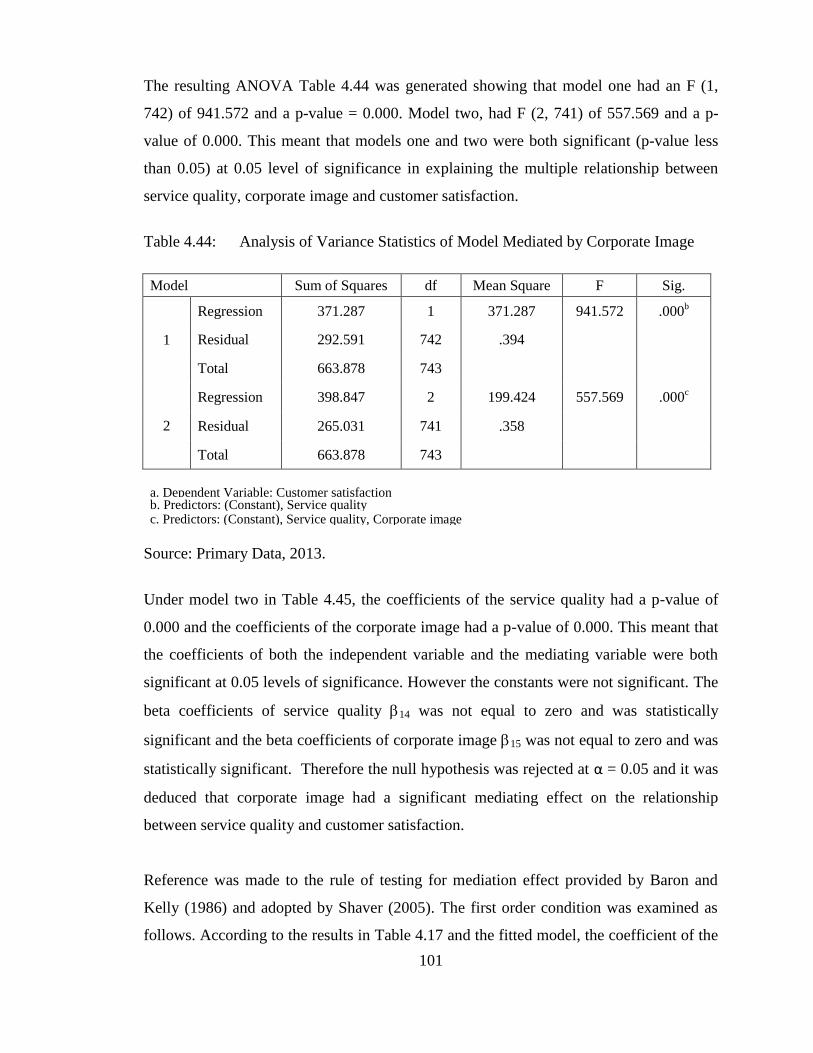
101
The resulting ANOVA Table 4.44 was generated showing that model one had an F (1,
742) of 941.572 and a p-value = 0.000. Model two, had F (2, 741) of 557.569 and a p-
value of 0.000. This meant that models one and two were both significant (p-value less
than 0.05) at 0.05 level of significance in explaining the multiple relationship between
service quality, corporate image and customer satisfaction.
Table 4.44: Analysis of Variance Statistics of Model Mediated by Corporate Image
Model Sum of Squares df Mean Square F Sig.
1
Regression 371.287 1 371.287 941.572 .000b
Residual 292.591 742 .394
Total 663.878 743
2
Regression 398.847 2 199.424 557.569 .000c
Residual 265.031 741 .358
Total 663.878 743
a. Dependent Variable: Customer satisfaction b. Predictors: (Constant), Service quality c. Predictors: (Constant), Service quality, Corporate image
Source: Primary Data, 2013.
Under model two in Table 4.45, the coefficients of the service quality had a p-value of
0.000 and the coefficients of the corporate image had a p-value of 0.000. This meant that
the coefficients of both the independent variable and the mediating variable were both
significant at 0.05 levels of significance. However the constants were not significant. The
beta coefficients of service quality 14 was not equal to zero and was statistically
significant and the beta coefficients of corporate image 15 was not equal to zero and was
statistically significant. Therefore the null hypothesis was rejected at α = 0.05 and it was
deduced that corporate image had a significant mediating effect on the relationship
between service quality and customer satisfaction.
Reference was made to the rule of testing for mediation effect provided by Baron and
Kelly (1986) and adopted by Shaver (2005). The first order condition was examined as
follows. According to the results in Table 4.17 and the fitted model, the coefficient of the
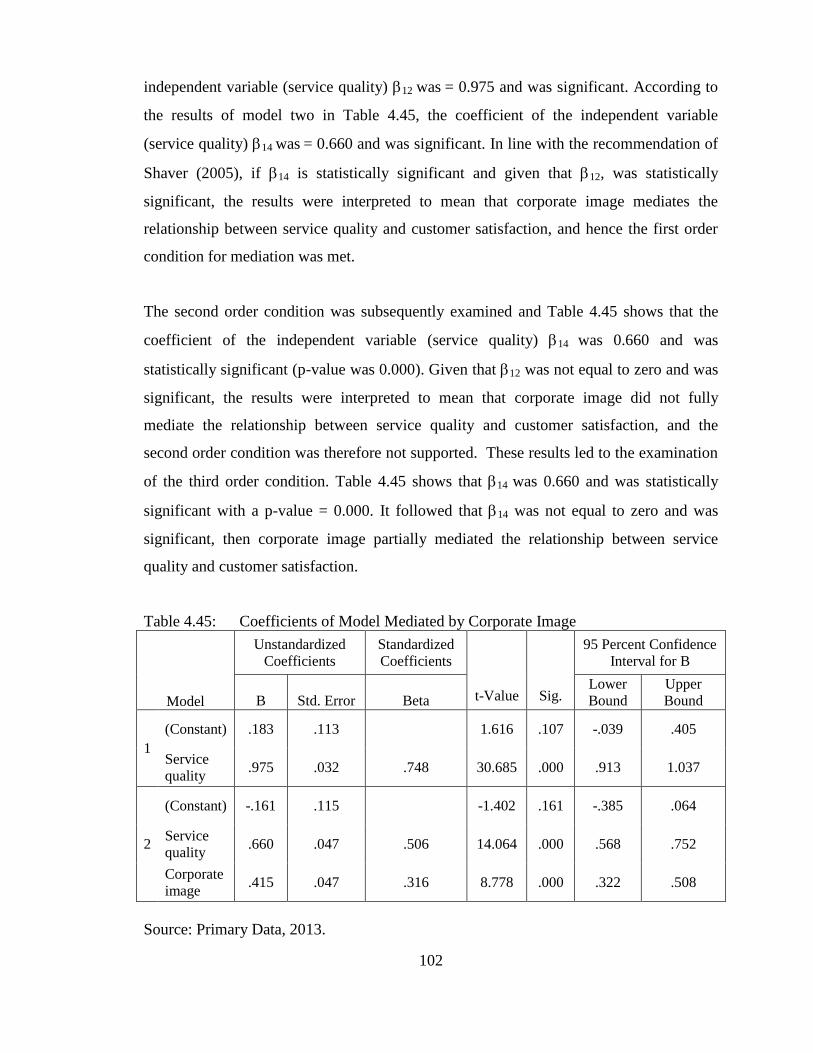
102
independent variable (service quality) 12 was = 0.975 and was significant. According to
the results of model two in Table 4.45, the coefficient of the independent variable
(service quality) 14 was = 0.660 and was significant. In line with the recommendation of
Shaver (2005), if 14 is statistically significant and given that 12, was statistically
significant, the results were interpreted to mean that corporate image mediates the
relationship between service quality and customer satisfaction, and hence the first order
condition for mediation was met.
The second order condition was subsequently examined and Table 4.45 shows that the
coefficient of the independent variable (service quality) 14 was 0.660 and was
statistically significant (p-value was 0.000). Given that 12 was not equal to zero and was
significant, the results were interpreted to mean that corporate image did not fully
mediate the relationship between service quality and customer satisfaction, and the
second order condition was therefore not supported. These results led to the examination
of the third order condition. Table 4.45 shows that 14 was 0.660 and was statistically
significant with a p-value = 0.000. It followed that 14 was not equal to zero and was
significant, then corporate image partially mediated the relationship between service
quality and customer satisfaction.
Table 4.45: Coefficients of Model Mediated by Corporate Image
Model
Unstandardized
Coefficients
Standardized
Coefficients
t-Value
Sig.
95 Percent Confidence
Interval for B
B
Std. Error
Beta
Lower
Bound
Upper
Bound
1
(Constant) .183 .113
1.616 .107 -.039 .405
Service
quality .975 .032 .748 30.685 .000 .913 1.037
2
(Constant) -.161 .115
-1.402 .161 -.385 .064
Service
quality .660 .047 .506 14.064 .000 .568 .752
Corporate
image .415 .047 .316 8.778 .000 .322 .508
Source: Primary Data, 2013.
103
The coefficient of the mediated model in Table 4.45 shows a significant relationship exist
between service quality, corporate image and customer satisfaction under model two,
with resulting R2 = 0.601, F change (1, 741) = 77.055, p-value = 0.000. This meant that
the model provided a moderately good fit. In the mediated model in Table 47, two control
variables were statistically significant; service quality and corporate image. Using the
resulting coefficients, the fitted model was:
CS = - 0.161 + 0.660SQ + 0.415CI
(-1.402) (0.000) (0.000)
R2 = 0.601
According to the equation above service quality had a coefficient (β14) of 0.660. This
meant that a unit change in service quality would result in a 66.0 percent increase in
customer satisfaction if corporate image was to remain unchanged. From the equation
above, the coefficient (β15) of corporate image was 0.415. This meant that a unit change
in corporate image would result in a 41.5 percent increase in customer satisfaction if
service were to remain the same. This results show that the two variables (service quality
and corporate image) have a significant positive effect on customer satisfaction.
Increased levels of customer satisfaction in universities could be achieved by giving
increased service quality however this relationship partly hinged on the corporate image
of the university.
4.15 Influence of Service Quality and Corporate Image on Customer Satisfaction
This study sought answers to the research question, ‘what is the nature of relationship
between service quality dimensions, corporate image and customer satisfaction amongst
university students in Kenya’. These variables were modeled into a multiple linear
regression model as indicated in equation (1).
Service quality had been conceptualized as a multiple dimensions construct, with four
dimensions as shown in equation (1). Following the process of factor analysis using EFA,
one dimension (core service) loaded on the factor human elements reliability. The
construct service quality was subsequently defined by three dimensions, human elements,
non-human elements, and service blue print. The multidimensionality of human elements
104
led to the splitting of the variable human elements into two; human element reliability
and human elements responsiveness. The independent construct (service quality) was
finally defined by four variables human element reliability, human elements
responsiveness, non-human elements, and service blue print. The dimensions of service
quality resulting from EFA were regressed against customer satisfaction, in the presence
of corporate image as the mediating variable. Preliminary analyses indicated no violation
of the assumptions of normality, linearity, multicollinearity and homoscedasticity.
The model summary in Table 4.46 shows five models were generated using hierarchical
regression analysis. Model one had R2 value of 0.494, which meant that 49.4 percent of
the variation in customer satisfaction was explained by human elements reliability,
leaving 50.6 percent of the variations unexplained. Model two had R2 value of 0.532,
which meant that 53.2 percent of the variation in customer satisfaction was explained by
human elements reliability and human elements responsiveness, leaving 46.8 percent of
the variations unexplained. Model three had R2 value of 0.538, which meant that 53.8
percent of the variations in customer satisfaction were explained by human elements
reliability, human elements responsiveness and non-human elements (physical evidence),
leaving 46.2 percent of the variations unexplained.
In Table 4.46 model four had R2 value of 0.582, which meant that 58.2 percent of the
variations in customer satisfaction were explained by human elements reliability, human
elements responsiveness, non-human elements (physical evidence) and service blue print,
leaving 41.8 percent of the variations unexplained. Model five had R2 value of 0.624,
which meant that 62.4 percent of the variations in customer satisfaction were explained
by human elements reliability, human elements responsiveness, non-human elements
(physical evidence), service blue print and corporate image. Model five in Table 4.46
with a R2 value of 0.624 provided a moderately good fit, but relative to the other four
models, it provided the best fit.
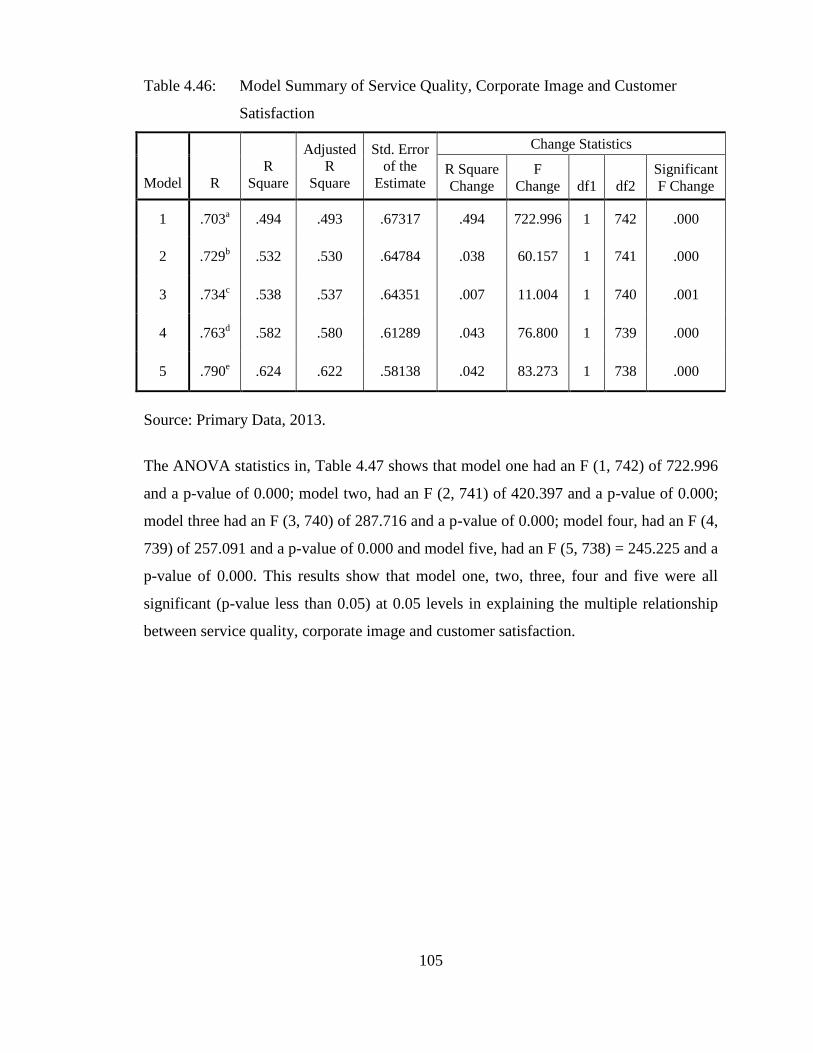
105
Table 4.46: Model Summary of Service Quality, Corporate Image and Customer
Satisfaction
Model
R
R
Square
Adjusted
R
Square
Std. Error
of the
Estimate
Change Statistics
R Square
Change
F
Change
df1
df2
Significant
F Change
1 .703a .494 .493 .67317 .494 722.996 1 742 .000
2 .729b .532 .530 .64784 .038 60.157 1 741 .000
3 .734c .538 .537 .64351 .007 11.004 1 740 .001
4 .763d .582 .580 .61289 .043 76.800 1 739 .000
5 .790e .624 .622 .58138 .042 83.273 1 738 .000
Source: Primary Data, 2013.
The ANOVA statistics in, Table 4.47 shows that model one had an F (1, 742) of 722.996
and a p-value of 0.000; model two, had an F (2, 741) of 420.397 and a p-value of 0.000;
model three had an F (3, 740) of 287.716 and a p-value of 0.000; model four, had an F (4,
739) of 257.091 and a p-value of 0.000 and model five, had an F (5, 738) = 245.225 and a
p-value of 0.000. This results show that model one, two, three, four and five were all
significant (p-value less than 0.05) at 0.05 levels in explaining the multiple relationship
between service quality, corporate image and customer satisfaction.

106
Table 4. 47: Analysis of Variance Statistics of Service Quality, Corporate Image and
Customer Satisfaction
Model Sum of Squares df Mean Square F Sig.
1
Regression 327.633 1 327.633 722.996 .000b
Residual 336.245 742 .453
Total 663.878 743
2
Regression 352.881 2 176.440 420.397 .000c
Residual 310.997 741 .420
Total 663.878 743
3
Regression 357.438 3 119.146 287.716 .000d
Residual 306.441 740 .414
Total 663.878 743
4
Regression 386.286 4 96.571 257.091 .000e
Residual 277.592 739 .376
Total 663.878 743
5
Regression 414.343 5 82.887 245.225 .000f
Residual 249.446 738 .338
Total 663.878 743
a. Dependent Variable: Customer satisfaction
b. Predictors: (Constant), Human elements reliability
c. Predictors: (Constant), Human elements reliability, Human elements responsiveness
d. Predictors: (Constant), Human elements reliability, Human elements responsiveness, Non-human elements
e. Predictors: (Constant), Human elements reliability, Human elements responsiveness, Non-human elements , Service blue print
f. Predictors: (Constant), Human elements reliability, Human elements responsiveness, Non-human elements , Service blue print,
Corporate image
Source: Primary Data, 2013.
In reference to model five in the coefficients Table 4.48, the five independent variables
and their significance values were: human elements reliability (p-value = 0.000), human
elements responsiveness (p-value = 0.000), non-human elements (p-value = 0.022),
service blueprint (p-value = 0.000) and corporate image (p-value = 0.000). This output
shows all the five variables; human elements reliability, human elements responsiveness,
non-human elements (physical evidence), service blue print and corporate image were
significant at α = 0.05 level of significance in explaining variations in customer
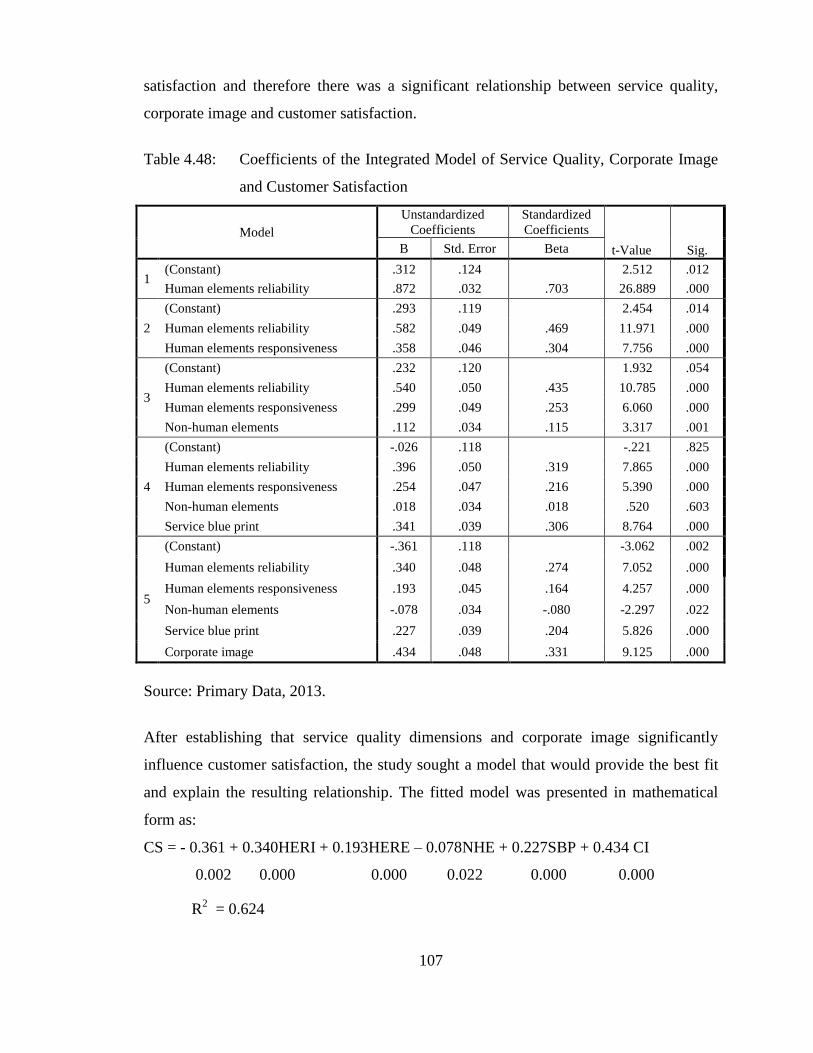
107
satisfaction and therefore there was a significant relationship between service quality,
corporate image and customer satisfaction.
Table 4.48: Coefficients of the Integrated Model of Service Quality, Corporate Image
and Customer Satisfaction
Model
Unstandardized
Coefficients
Standardized
Coefficients
t-Value Sig. B Std. Error Beta
1 (Constant) .312 .124 2.512 .012
Human elements reliability .872 .032 .703 26.889 .000
2
(Constant) .293 .119 2.454 .014
Human elements reliability .582 .049 .469 11.971 .000
Human elements responsiveness .358 .046 .304 7.756 .000
3
(Constant) .232 .120 1.932 .054
Human elements reliability .540 .050 .435 10.785 .000
Human elements responsiveness .299 .049 .253 6.060 .000
Non-human elements .112 .034 .115 3.317 .001
4
(Constant) -.026 .118 -.221 .825
Human elements reliability .396 .050 .319 7.865 .000
Human elements responsiveness .254 .047 .216 5.390 .000
Non-human elements .018 .034 .018 .520 .603
Service blue print .341 .039 .306 8.764 .000
5
(Constant) -.361 .118 -3.062 .002
Human elements reliability .340 .048 .274 7.052 .000
Human elements responsiveness .193 .045 .164 4.257 .000
Non-human elements -.078 .034 -.080 -2.297 .022
Service blue print .227 .039 .204 5.826 .000
Corporate image .434 .048 .331 9.125 .000
Source: Primary Data, 2013.
After establishing that service quality dimensions and corporate image significantly
influence customer satisfaction, the study sought a model that would provide the best fit
and explain the resulting relationship. The fitted model was presented in mathematical
form as:
CS = - 0.361 + 0.340HERI + 0.193HERE – 0.078NHE + 0.227SBP + 0.434 CI
0.002 0.000 0.000 0.022 0.000 0.000
R2 = 0.624
108
The integrated model in equation above shows that model five had an R2 = 0.624. This
was interpreted to mean model five provided a good fit; implying service quality and
corporate image have a significant positive effect on customer satisfaction. The R2 =
0.624, further meant that 62.4 percent of the variations in the customer satisfaction was
explained by five variables: human elements reliability, human elements responsiveness,
non-human elements, service blueprint and corporate image. Human elements reliability
had a beta value (β1 = 0.340). This meant that on an integrated scale, a unit change in
human elements reliability would result in a 34 percent change in customer satisfaction.
A unit change in service blue print (β3 = 0.227) would result in a 22.7 percent change in
customer satisfaction. A unit change in human elements responsiveness would result in
19.3 percent increase in customer satisfaction levels. A unit decrease in non-human
elements (β2 = 0.078) led to a 7.8 percent change in customer satisfaction. This also
meant that lack of a unit of non-human elements considered by students as vital results in
a 7.8 percent drop in customer satisfaction. A unit change in corporate image (β3 = 0.434)
resulted in a 43.4 percent change in customer satisfaction, further affirming that corporate
image played a significant mediating role on the relationship between service quality and
customer satisfaction. This analysis demonstrated that increased levels of service quality
will result in increased levels of customer satisfaction in private and public universities in
Kenya, and that the relationship between service quality and customer satisfaction can be
enhanced in the universities improve on their corporate image.
Resulting from the analysis, the empirical model in Figure 4.2 was derived. The model
shows that there is a strong positive relationship between service quality and customer
satisfaction as evidenced by the path marked H5: CS = 0.183 + 0.975SQ, R2 = 0.559, p-
value = 0.000; sig., where the β11 = 0.975. The other service quality dimensions also have
a significant positive relationship with customer satisfaction as shown by the paths
marked (H1, H2, H3 and H4). The resulting mediated relationship between service quality
and customer satisfaction is displayed by the path marked H8: CS = - 0.161 + 0.660SQ +
0.415CI where the β14 = 0.660. The empirical model therefor shows that corporate image
mediates the relationship between service quality and customer satisfaction as shown by
the dotted path and that the relationship is positive and strong (β14 = 0.660).
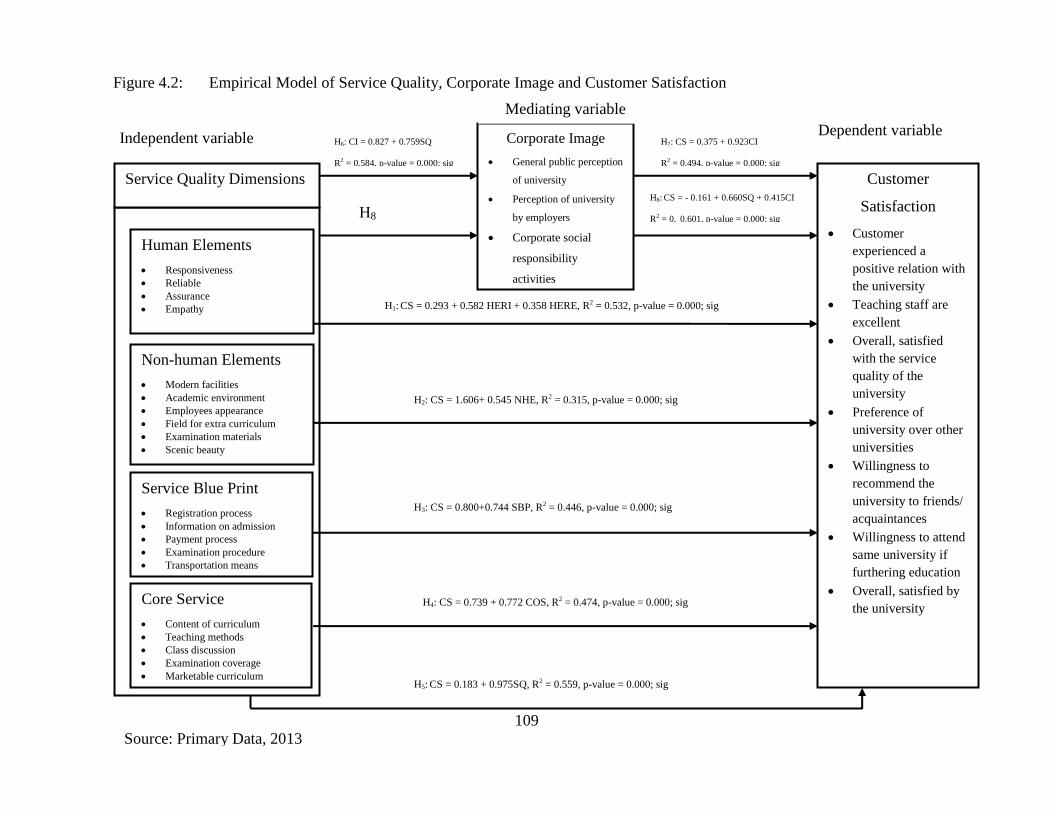
109
Non-human Elements
Modern facilities
Academic environment
Employees appearance
Field for extra curriculum
Examination materials
Scenic beauty
Human Elements
Responsiveness
Reliable
Assurance
Empathy
Service Blue Print
Registration process
Information on admission
Payment process
Examination procedure
Transportation means
Core Service
Content of curriculum
Teaching methods
Class discussion
Examination coverage
Marketable curriculum
Corporate Image
General public perception
of university
Perception of university
by employers
Corporate social
responsibility
activities
Media reports of the
university
Customer
Satisfaction
Customer
experienced a
positive relation with
the university
Teaching staff are
excellent
Overall, satisfied
with the service
quality of the
university
Preference of
university over other
universities
Willingness to
recommend the
university to friends/
acquaintances
Willingness to attend
same university if
furthering education
Overall, satisfied by
the university
Service Quality Dimensions
H1: CS = 0.293 + 0.582 HERI + 0.358 HERE, R2 = 0.532, p-value = 0.000; sig
Source: Primary Data, 2013
H8
Figure 4.2: Empirical Model of Service Quality, Corporate Image and Customer Satisfaction
Conceptual Framework
Independent variable
Mediating variable
Dependent variable
H2: CS = 1.606+ 0.545 NHE, R2 = 0.315, p-value = 0.000; sig
H3: CS = 0.800+0.744 SBP, R2 = 0.446, p-value = 0.000; sig
H4: CS = 0.739 + 0.772 COS, R2 = 0.474, p-value = 0.000; sig
H5: CS = 0.183 + 0.975SQ, R2 = 0.559, p-value = 0.000; sig
H6: CI = 0.827 + 0.759SQ
R2 = 0.584, p-value = 0.000; sig
H8: CS = - 0.161 + 0.660SQ + 0.415CI
R2 = 0. 0.601, p-value = 0.000; sig
H7: CS = 0.375 + 0.923CI
R2 = 0.494, p-value = 0.000; sig
110
Table 4.49 gives a summary of the results of the hypotheses tested, shows the coefficient
of determination associated with each analytical model the p-values and the decision
made. The results show that all the nine research hypotheses were rejected and hence
there was a significant relationship between the study variables. Service quality had a
significant influence on customer satisfaction, but this influence was significantly
mediated by corporate image.
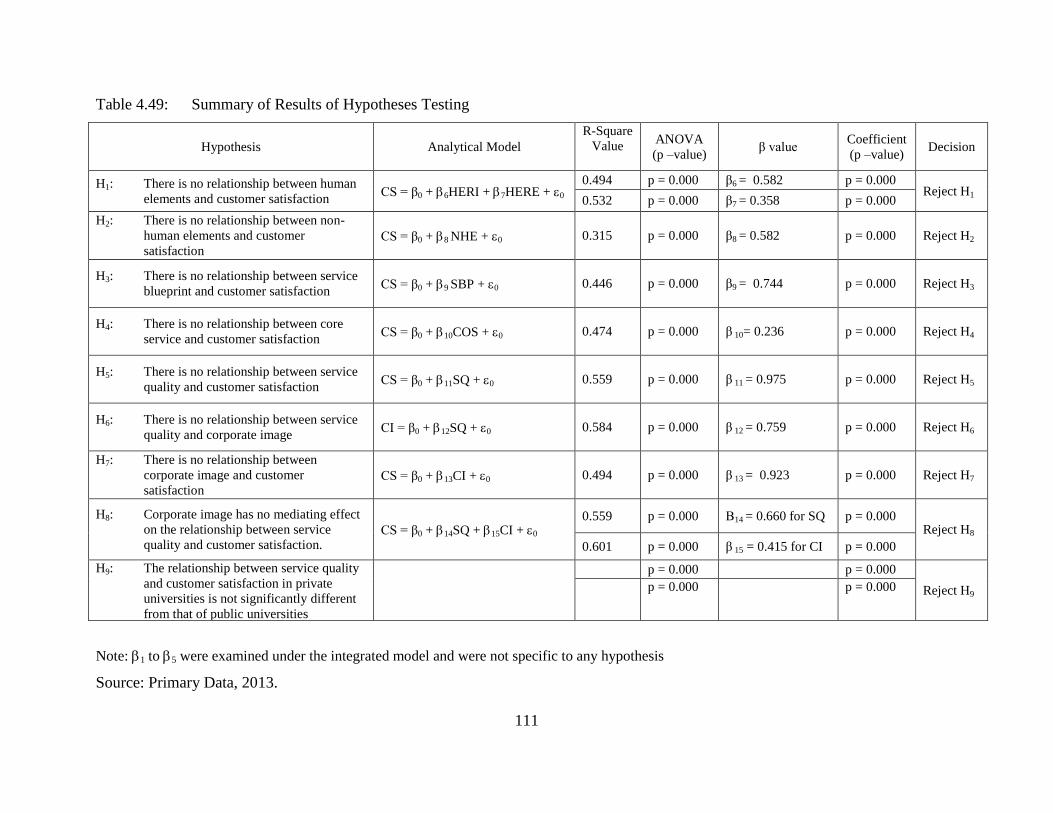
111
Table 4.49: Summary of Results of Hypotheses Testing
Hypothesis Analytical Model
R-Square
Value ANOVA
(p –value) β value
Coefficient
(p –value) Decision
H1: There is no relationship between human
elements and customer satisfaction CS = β0 + 6HERI + 7HERE + 0
0.494 p = 0.000 β6 = 0.582 p = 0.000 Reject H1
0.532 p = 0.000 β7 = 0.358 p = 0.000
H2: There is no relationship between non-
human elements and customer
satisfaction CS = β0 + 8 NHE + 0 0.315 p = 0.000 β8 = 0.582 p = 0.000 Reject H2
H3: There is no relationship between service
blueprint and customer satisfaction CS = β0 + 9 SBP + 0 0.446 p = 0.000 β9 = 0.744 p = 0.000 Reject H3
H4: There is no relationship between core
service and customer satisfaction CS = β0 + 10COS + 0 0.474 p = 0.000 β 10= 0.236 p = 0.000 Reject H4
H5: There is no relationship between service
quality and customer satisfaction CS = β0 + 11SQ + 0 0.559 p = 0.000 β 11 = 0.975 p = 0.000 Reject H5
H6: There is no relationship between service
quality and corporate image CI = β0 + 12SQ + 0 0.584 p = 0.000 β 12 = 0.759 p = 0.000 Reject H6
H7: There is no relationship between
corporate image and customer
satisfaction CS = β0 + 13CI + 0 0.494 p = 0.000 β 13 = 0.923 p = 0.000 Reject H7
H8: Corporate image has no mediating effect
on the relationship between service
quality and customer satisfaction. CS = β0 + 14SQ + 15CI + 0
0.559 p = 0.000 Β14 = 0.660 for SQ p = 0.000 Reject H8
0.601 p = 0.000 β 15 = 0.415 for CI p = 0.000
H9: The relationship between service quality
and customer satisfaction in private
universities is not significantly different
from that of public universities
p = 0.000 p = 0.000
Reject H9
p = 0.000
p = 0.000
Note: 1 to 5 were examined under the integrated model and were not specific to any hypothesis
Source: Primary Data, 2013.
112
4.16 Discussion of the Results
The resulting output of the data analysis was discussed and compared with findings of
other scholars across the globe. Most of the results corroborate existing knowledge and
some of the findings add on to existing knowledge. The findings are consistent with
industry practice, while parts of the findings suggest areas of improvement to service
stakeholders as presented in the following section.
4.16.1 Dimensions of Service Quality that Influence Customer Satisfaction
The first research objective was to determine the dimensions of service quality that
influenced customer satisfaction. The study established that there were four dimensions
of service quality that influence customer satisfaction amongst Kenyan University
students. Table 4.18 provides a summary of these dimensions in their order of magnitude
as encompassing: human elements reliability, human elements responsiveness, non-
human elements and service blue print.
These results confirmed the shortfall of SERVQUAL scale in terms of dimensionality as
observed by Carman (1990) and Buttle (1996). In their conceptualization of
SERVQUAL, Parasuraman et al. 1988 suggested five dimensions of service quality
Reliability, Assurance, Tangibility, Empathy and Responsiveness also acronymed
RATER by Buttle (1996). The findings of this study corroborate two dimensions from the
RATER scale; reliability and responsiveness. The factors assurance and empathy are
subsumed in human elements reliability and human elements responsiveness. To enhance
the content validity and inclusivity of the tangibles dimension, this study proposed the
name non-human elements, which Sureshchandar et al. (2002) endorses as more
encompassing of the physical evidence in the servicescape.
Unlike SERVQUAL, the findings of this study suggest an additional dimension of
service quality, in the form of service blue print. It is also evident that these findings
compare closely to the works of Sureshchandar et al. (2002) who had identified five
dimensions of service quality as including: human elements, non-human elements, core
service, social responsibility and servicescape. One point of disparity is that in this study,

113
the construct human element was further split into two; human elements reliability and
human elements responsiveness. In the Kenyan universities context, core service loaded
on human elements reliability, while social responsibility was a subcomponent of
corporate image and servicescape was defined as non-human elements resulting in a four
factor model. These findings also compare to the work of Che and Ting (2002) who
identified twelve dimensions of service quality in the following order: communication,
security, understanding the customer, competency, reliability, courtesy, accessibility,
tangibles, responsiveness and credibility. They posit that there exist a positive
relationship between service quality and customer satisfaction and that reliability is the
dimension of service quality with the greatest influence on customer satisfaction.
The findings of this study exhibit convergent validity with the findings of Abdullah
(2005) save for the difference in the service quality dimension terminologies used.
Abdullah (2005) put forward a five-factor model that was named HEdPERF and
suggested that it is the most appropriate scale for the higher education sector. The
HEdPERF is defined by the factors nonacademic aspects, academic aspects, and
reputation, access, and programme issues. In this study, nonacademic aspects were
referred to as non-human elements, academic aspects were referred to as human
elements, reputation was defined as corporate image, access was referred to as
responsiveness and programme issue were referred to as the service process. The results
of this study match those of Navarro et al. (2005) who established that reliability of
teaching staff was the most important service quality dimension. This study demonstrates
that there are four dimensions of service quality that influence customer satisfaction
amongst Kenyan university students, but the service quality dimension with the highest
predictive power of customer satisfaction was human elements reliability.
The study results are also consistent with the findings of Sultan and Wong (2010) who
derived the PHEd model reflective of eight important service quality dimensions in
universities including dependability, effectiveness, capability, efficiency, competencies,
assurance, unusual situation management, and semester and syllabus. But unlike the
PHEd model, this study established a four dimension model. On replication in this study
114
the factors dependability, effectiveness, capability, efficiency, competencies under PHEd
loaded on one factor (human elements reliability), while assurance and unusual situation
management loaded on the factor human elements responsiveness in this study. Semester
and syllabus comprised the dimension core service in this study. The study results also
compare to the works of Shekarchizadeh et al. (2011), who identified a five factors
structure in the form of professionalism, reliability, hospitality, tangibles, and
commitment as the most important amongst Malaysian university students.
4.16.2 Comparative Analysis of Dimensions of Service Quality in Universities
The second research objective sought to establish whether there exists a significant
difference in service quality dimensions amongst universities students. A one way
ANOVA test led the study to establish that student satisfaction differed significantly
between the public and private universities along the service quality dimension of human
elements reliability, human elements responsiveness, non-human elements and service
blueprint as evidenced in Table 4.19. Limited literature exist on comparative analysis of
service quality and customer satisfaction, however Smith et al. (2007) concluded that the
application of SERVQUAL in the public sector can produce different service quality
dimensions from those found in private sector services and that reliability was the most
important dimension for all customers and the greatest improvement in service quality
and would be achieved through improved service reliability.
The results of factor analysis in Table 4.18 gives a summary showing the service quality
dimension that satisfies or dissatisfies students the most. The most reliable service quality
dimension in explaining variations in customer satisfactions in private universities was
captured in the rotated component matrix in Table 4.15 as including service blueprint
followed by human elements reliability, human elements responsiveness and non-human
elements. This shows that students in private universities were more satisfied with the
service process flow in the institutions, particularly with the variable ‘the course content
is taught as outlined in the curriculum’ but were least satisfied with non-human elements
particularly the variable ‘the university location is conducive for me’. The study
established that the most reliable service quality dimension in explaining variations in
115
customer satisfaction in public universities according to the rotated component matrix in
Table 4.17 was non-human elements, followed by human elements reliability, human
elements responsiveness and service blueprint respectively. For the combined data set,
the most important service quality dimension was human elements reliability.
4.16.3 Influence of Service Quality on Customer Satisfaction
The third research objective was to examine the relationship between service quality and
customer satisfaction. Given the multidimensionality of service quality, this objective
resulted in formulation of four research hypotheses (H1, H2, H3 and H4). The four
dimensions of service quality resulting from the factor analysis were: human elements,
non-human elements, service blueprint and core service. The first research hypothesis
(H1) sought to examine the relationship between human elements and customer
satisfaction. Using linear regression analysis results in Tables 4.23 and 4.24, the study
observed that human element significantly influence customer satisfaction. Two
significant dimensions of human elements were found to be human elements reliability
and human elements responsiveness. The regression model shows a positive relationship
between human elements reliability, human elements responsiveness and customer
satisfaction. Human elements reliability had a greater influence on customer satisfaction
as compared to human elements responsiveness. Human elements reliability was defined
in Table 4.13 to a great extent by the variables lecturer’s ability to display competence in
teaching, lecturer’s ability to instill confidence in the learners, lecturers who are
approachable and willing to help the students, lecturers experience in academic research
and the belief that the university gives quality education. This meant that students get
more satisfied with a university with lecturers who are able and willing to offer excellent
teaching services. Human elements responsiveness was defined in Table 4.13 to a great
extent by the variables: the university staff is quick at responding to my queries, the
university staff are always willing to help me, the university staff are always courteous,
university is dependable in handling my service problems and the university staff have
customer’s best interest at heart. While human element reliability centers on the lecturers,
human elements responsiveness shows university students are most satisfied by
116
administrative and boundary spanners who show concern in the process of service
delivery.
The relationship between non-human elements and customer satisfaction was examined
by testing the second research hypothesis (H2). The results of the linear regression
analysis in Tables 4.26 and 4.27 shows a significant relationship exist between non-
human elements and customer satisfaction. The regression model shows a positive
relationship between human elements reliability, human elements responsiveness and
customer satisfaction. Human elements reliability had a greater influence on customer
satisfaction as compared to human elements responsiveness. Table 4.13 identified the
non-human variables that influence customer satisfaction in universities to a great extent
as including attractive and conducive lecture halls, neat and well stocked library, a
university with sufficient computers, a university with modern equipment’s in classrooms
like LCD projectors and video facilities and a university with conducive ambient
conditions for learning. These non-human elements are also referred to by Zeithaml et al.
(2006) as the servicescape. This meant that an increase in the value of the servicescape
would result in an increase in customer satisfaction.
The study also sought to determine the relationship between service blueprint and
customer satisfaction. This was achieved by testing the third research hypothesis (H3). A
linear regression analysis using OLS method of estimation led to the output in Tables 31
and 32 both of which confirm that there exists a significant relationship between service
blueprint and customer satisfaction. The resulting regression equation shows a positive
relationship exists between service blueprint and customer satisfaction. Service blueprint
also refers to the process flow in service provision and Table 4.13 identifies the following
variables as defining service blueprint that influence customer satisfaction in universities
to a great extent as including: the student is well informed of the examination procedures,
adequacy of process followed to register as a student, student is informed of the
university rules and regulation, clarity of the process followed to get admission in the
university and informativeness of the student orientation process. This meant that the
more clear the service blue print, the higher the levels of student satisfaction in Kenya
117
universities. Table 4.20 confirms that students in public universities were least satisfied
with the service blue print, indicating that the service process flow in some of the public
universities were not explicit and hence dissatisfy customers.
An examination of the relationship between core service and customer satisfaction was
performed by testing the fourth research hypothesis (H4). Upon regressing core service on
customer satisfaction in a simple regression analysis using OLS estimation method, a
significant relationship was established. This meant that holding other variables constant,
core service had a significant influence on customer satisfaction. The coefficient shown
in Table 4.15 indicates that core service had a significant positive effect on customer
satisfaction. An increase in the value of core service would result in an increase in the
levels of customer satisfaction. While core service loaded on human element reliability
under EFA (Table 4.13), simple linear regression shows it can play a significant role in
predicting levels of customer satisfaction on a direct relationship with customer
satisfaction.
The four dimensions of service quality were transformed into one construct, service
quality. The fifth research hypothesis (H5) was tested and the results in Tables 4.35 and
4.36 confirmed that there was a significant relationship between service quality and
customer satisfaction. The resulting regression equation shows a strong positive
relationship between service quality and customer satisfaction, meaning that higher levels
of service quality could result in higher levels of student satisfaction in Kenyan
universities. Similar results were found by Levesque and McDougall (1996) who
demonstrated that positive relationship exists between service quality and customer
satisfaction. According to their study, the key explanatory variables in the service quality
domain were service relational factors, core service and service features. In this study
human elements represented the service relational factors, core service represented core
service and non-human elements represent service features.
This findings support the position taken by Navarro (2005), who posits that there are
three components of service quality that exercise a positive and statistically significant
118
effect (99 percent) on the satisfaction level reached by the students. Of the three
components that act as explanatory variables, the variable that groups together the aspects
related to course content and teaching methods (teaching staff), is the one that exercises
the greatest influence on the overall satisfaction level of the students. Second is the
aspects related to organization and finally the aspects related to enrolment. The current
study findings refer to the teaching staff as human elements, organizational aspects are
referred to as non-human elements and enrollment is encapsulated as the factor service
blue print. Related findings were reported by Jayasundara, Ngulube, Majanja (2010) who
posit that customers’ expectations and perceptions, as well as performances of services,
are formed by service quality determinants that are specific to each service organization.
These dimensions have conceptual and of empirical relevance to the construct customer
satisfaction in university libraries. They deduce that service quality in particular has
positive influence over customer satisfaction.
The findings that service quality and customer satisfaction are positively related is
supported by Hanif, Hafeez, and Riaz (2010) who demonstrated the existence of a
significant positive relationship between customer service and customer satisfaction.
Kelsey and Bond (2001) identified seven service quality factors that positively influence
customer satisfaction in academic centers as including customers positive experience
with scientist at the academic centre, centre scientist commitment to customer projects,
availability of centre scientist to answer student questions, centre scientist
recommendation of alternative process to customers, centre scientist giving customers
alternative sources of information, approachability of centre director and customers being
able to start a business as a result of assistance from centre scientist.
4.16.4 The Relationship Between Service Quality and Corporate Image
The fourth research objective was to determine the relationship between service quality
and corporate image. This was achieved by testing hypothesis six. Assuming corporate
image as the dependent variable and service quality as the independent variable, the study
used simple regression analysis, leading to the output in Tables 39 and 40, which shows a
significant relationship exist between service quality and corporate image. The resulting
119
regression equation confirms the existence of a strong positive relationship between
service quality and corporate image. Table 4.13 identified the variables that define
corporate image to a great extent as including: I choose this university because it has a
good reputation, this university makes a lot of contribution to the society, I selected this
university because it has qualified lecturers, this university is preferred by my peers
(friends and relatives), employers have a positive perception of this university and I
choose this university because it has a strong brand name. This meant that a university
that provides excellent service was more likely to have a positive corporate image.
This finding was in line with the work of Yan, Yurchisin, and Watchravesringkan, (2007)
who established that service quality expectations have a significant positive impact on
consumers’ store image perceptions. The results are also consistent but converse to the
observation made by Bloemer, Ruyter and Peeters (1998) that image has a clear positive
influence on the quality perception.
4.16.5 Influence of Corporate Image on Customer Satisfaction
The fifth research objective was to establish the relationship between corporate image
and customer satisfaction. Hypothesis seven was tested and the resulting output in Table
4.41 and Table 4.42 showed that corporate image had significant positive influence over
customer satisfaction. This meant that increased efforts of a university to build a strong
corporate name results in enhanced customer satisfaction. While image of the service
provider was ignored previously, this study results indicate that corporate image has a
significant mediating influence on customer’s evaluation of service quality. These
findings are consistent with Kang and James (2002) results that noted that image played
an important moderating role in influencing an individual’s perception of overall service
quality. Walsh, Dinnie and Wiedmann, (2006) demonstrate that corporate reputation has
a strong positive relationship with customer satisfaction and that corporate image and
customer satisfaction have a significant negative influence on customer defection. A
similar finding by Davies et al. (2002, p. 151) who notes that “reputation and customer
satisfaction have been seen as interlinked”. These findings are equally supported by
120
Kandampully and Hu (2007), who observe that customer satisfaction and corporate image
have a statistically significant positive relationship.
4.16.6 Mediating Effect of Corporate Image on the Relationship Between Service
Quality and Customer Satisfaction
The sixth research objective was to assess the extent to which corporate image meditates
the relationship between service quality and customer satisfaction. Tables 4.44 and 4.45
show that service quality had a significant influence over customer satisfaction on a
direct relationship (β14 = 0.660) and that corporate image also has a significant
relationship with customer satisfaction on a simple linear relationship (β15 = 0.415).
Using hierarchical regression analysis, the study established as evidenced by Table 4.47
and Table 4.48 that corporate image significantly mediated the relationship between
service quality and customer satisfaction. The study results confirmed corporate image
significantly mediates the relationship between service quality and customer satisfaction.
This meant that improving service quality and corporate image can result in enhanced
customer satisfaction. This finding was in tandem with the works of Alvens and Raposo
(2010) and Nguyen and LeBlanc (1998), who attested that image is the construct with the
greatest influence on customer satisfaction. University students would therefore be most
satisfied with a university with a relatively strong corporate image and service staff who
are reliable in core service delivery.
4.17 Summary
Following factor analysis, it was established that the most reliable factor in explaining
customer satisfaction in Kenyan universities based on the combined data set was human
elements reliability dimension, followed by human element responsiveness dimension,
non-human elements, service blueprint and corporate image respectively. The most
reliable factor in explaining variations in customer satisfactions in private universities
was human elements reliability, followed by corporate image, human elements
responsiveness non-human elements and service blue print. It was established that the
most reliable factor in explaining variations in customer satisfaction in public universities

121
was human elements reliability, followed by non-human elements, human elements
responsiveness, service blueprint and corporate image, respectively.
Using regression analysis, the study established that service quality significantly
influences customer satisfaction, but this relationship is partially mediated by corporate
image. The introduction of corporate image strengthens the relationship between service
quality and customer satisfaction. The service quality dimensions with the greatest
influence on customer satisfaction were human elements reliability, service blue print,
human elements responsiveness and non-human elements respectively.
122
CHAPTER FIVE
SUMMARY, CONCLUSION AND RECOMMENDATIONS
5.1 Introduction
This chapter presents a summary, conclusion and recommendations of the study findings
as stipulated in the research objectives. The chapter draws managerial implications and
identifies policy recommendations reminiscent of the study findings, research limitations
are elucidated and areas of further studies identified.
5.2 Summary
The general objective of this study was to investigate the relationship between service
quality, corporate image and customer satisfaction among university students in Kenya.
The study determined that there exist a significant relationship between service quality
and customer satisfaction, mediated by corporate image. The first objective of the study
was to determine the dimensions of service quality that influence customer satisfaction.
Four dimensions, human elements reliability, human elements responsiveness, non-
human elements and service blue print were identified as more reliable dimensions in the
university set up. The second research objective was to establish the differences in
service quality perception amongst universities students. The study observed that the
student perception of service quality differs significantly between private university
students and public university students. The third research objective was to examine the
relationship between service quality and customer satisfaction. The study determined the
existence of a significant positive relationship between service quality and customer
satisfaction. The fourth research objective was to determine the relationship between
service quality and corporate image. The study noted that a significant relationship exist
between service quality and corporate image paving way for an examination of the
mediated relationship. The fifth objective which also marked the initial step of testing for
mediation sought to establish the relationship between corporate image and customer
satisfaction. It was observed that corporate image significantly influenced customer
satisfaction. The last objective was to assess the extent to which corporate image
meditates the relationship between service quality and customer satisfaction. It was
123
established that corporate image partially mediates the relationship between service
quality and customer satisfaction.
5.3 Conclusion
The study concluded that service quality has a significant influence on customer
satisfaction in universities in Kenya. Four service quality dimensions have the greatest
predictive power on customer satisfaction and these are human elements reliability,
human elements responsiveness, service blue print and non-human elements. An increase
in service quality results in an increase in the levels of customer satisfaction. Corporate
image has a significant partial mediating effect on the relationship between service
quality and customer satisfaction. An increase in the value of corporate image
strengthens the relationship between service quality and customer satisfaction. The nine
null research hypotheses were all rejected, indicating that service quality and corporate
image had a significant influence on customer satisfaction, based on a linear
relationships, however, factor analysis shows that core service is not significant in
explaining changes in customer satisfaction. As a result core service was dropped from
analysis of the integrated model and instead its variables were subsumed in the dimension
human elements. On an integrated scale, corporate image can have strong mediating
influence on the relationship between service quality and customer satisfaction. It was
further established that the dimension of service quality with the highest influence on
customer satisfaction was human elements reliability, followed by service blue print,
human elements responsiveness and non-human elements.
The position deduced from this study was consistent with the findings of Smith et al.
(2007) who identified reliability as the most important dimension of service quality, a
position also taken by Senthilkumar and Arulraj (2010) who established three service
quality dimensions in Indian universities as defined by reliability of faculty, excellent
physical resources and having a wide range of disciplines. A similar position was taken
by Kandampully and Hu (2007) who reported the existence of a significant relationship
between service quality and customer satisfaction, moderated by corporate image.
124
5.4 Implications
The preceding data analysis and discussion on the study findings pointed at theoretical
and managerial implications. These implications focus on scholarly contribution and
contributions to managers and other industry players.
5.4. 1 Theoretical Implications
This study hypothesized the existence of a significant relationship between service
quality and customer satisfaction, mediated by corporate image in the Kenyan university
context. The results confirm the existences of a statistically significant relationship
between the three and by so doing, the study adds to existing literature by uncovering the
mediating effect of corporate image on the relationship between service quality and
customer satisfaction amongst university students. The results indicate that the
relationship between service quality and customer satisfaction is significant and positive
but that this relationship can be enhanced by building a strong corporate image. These
findings contribute to the general body of knowledge on service quality by providing
basis for linkage of three isolated constructs, corporate brand image, service quality and
customer satisfaction, and presents a meaningful association between the three.
Second, the study provides a scale for measuring the levels of customer satisfaction in
universities in Kenya. Using empirical evidence, this study questions the completeness of
the SERVQUAL scale on the basis of paradigmatic objections, process orientation,
dimensionality and item composition. This position is supported by Buttle (1996),
Abdullah (2005) and Sultan and Wong (2010). The findings prove that a performance
only paradigm can produce significant results and act as a parsimonious tool of
measuring customer satisfaction in the place of the complex disconfirmation process.
Third, the findings of this study show that service quality dimensions are incomplete and
that service quality theorist can uncover more dimensions in different service context.
The study unveils four dimensions in the university service quality context and goes
ahead to rate their predictive power in the following order: human elements reliability,
service blue print, human element responsiveness and non-human elements. The study
125
acknowledges that service blue print in particular has been ignored in service quality
theory before, but this study demonstrates that an appreciation of service process flow has
significant positive influence on customer satisfaction and its role in service quality
theory cannot be ignored.
Fourth, the findings show that in designing an instrument for measuring customer
satisfaction, the item composition might vary depending on the service context and hence
instead of prescribing a universal instrument to all service situations, the study proposes
adoption of universal service quality instrument for similar or related services and use of
contingent instruments in service sectors that are unrelated or heterogeneous. This further
means that an instrument that produces excellent results in a university context might not
fit a banking service context exactly and instead might require modification. Hence
adoption of industry based models like Balanced Score Card, TQM, Business Process Re-
engineering and SERVQUAL, can be invalid and unreliable in a university setting. This
position was observed by Becket and Brookes (2008) and supported by Magutu et al.
(2010). On the same subject, Abdullah (2005) observes that many institutions of higher
learning appear to rely heavily on industrial quality models, either adopted directly or
adapted for use within and that the benefits gained have been predominantly in
administrative functions rather than in actual service functions of the institutions of
higher learning.
5.4. 2 Managerial Implications
The study established a strong positive correlation between service quality and customer
satisfaction. To managers of higher learning institutions, the overall service quality of the
institutions is a strong antecedent to customer satisfaction. Universities perceived by
customers as offering better services tend to attract more students as the satisfied ones
spread positive word of mouth about the institutions. The findings of this study can
therefore be used by managers in universities who seek to pursue customer satisfaction as
a winning strategy in an increasingly competitive industry. The study suggest to
managers to adopt excellent service provision for longevity of customer satisfaction.
126
The study identifies two important human elements as reliability and responsiveness.
Reliability of the lecturing staff and the administrative staff influence customer
satisfaction. This means managers of universities should recruit lecturers based on: their
ability to demonstrate competence in teaching, ability to enhance student performance,
contribution to academic research, ability to instill confidence in learners and ability to
exercise academic integrity and honesty in teaching and learner evaluation. The
university management must orient its employees on service culture earmarked for
reliability and efficiency. The service staffs are deemed reliable if they offer services as
promised, perform services dependably and accurately, attend to customers in a timely
way and keep student records correctly.
It would be prudent for non-teaching staff to be oriented on a supportive service culture
and for them to be trained on excellent customer service. Managers in universities must
priorities training of the front office staff on responsiveness as follows: be quick at
responding to customer queries, to communicate effectively to customers of any new
development affecting them, to be courteous, be ready to help customers, perform service
right the first time and maintain student’s records in an organized way.
To sustain customer satisfaction through staff, managers in universities must adopt a
regular staff evaluation programme based on the instrument in Appendix 3 with an
objective of ascertain their customer satisfaction index. This also means managers in
universities should stop relaying on industry quality models and adopt the instrument in
Appendix 3 as a standard tool for evaluating customer satisfaction. A customer
satisfaction index indicating student dissatisfaction would be a pointer to the manager of
service failure and need for prompt service recovery to remain competitive. On a similar
view point, Osseo-Asare Jr and Longbottom (2002) questions the ability of current level
of management and leadership skills in institution of higher learning to effectively apply
industrial quality models.
Managers in universities must recognize service blue print as an important determinant of
customer satisfaction. Service blue print in the universities is more satisfying to students
127
if it is short and clear. Some of the critical service process points that managers should
pay attention to in a university setting include: making students aware of examination
procedures, the process of registering as a student must be clear, student must aware of
university rules and regulations, the process of new student admission must be explicit,
the student orientation process must be informative and the process of making payment to
the university must be convenient.
The study findings indicate that a university can be more competitive if its management
inculcates student’s perception of corporate image in assessing student’s satisfaction with
the service providers. Students use beliefs, mental perceptions, form feelings and develop
attitude towards the university resulting in image building. Synonymous to findings of
Abd-El-Salam (2013) corporate image can help a management of a firm to maximize
their market share, profits, attracting new customers, retaining existing ones, neutralizing
the competitors’ actions and above all their success and survival in the market. A positive
image communicates strong brand equity and makes prospective students more receptive
to word of mouth messages about the institution. Development of a strong alumni
association can also serve to strengthen the university linkage to the industry and
enhances its corporate image.
Last, the study results provide empirical backing that decision makers must pay attention
to the servicescape or non-human elements. The non-human elements likely to influence
level of student satisfaction to a great extent include: having attractive and conducive
lecture halls and lecturing facilities, having a neat and well stocked library facility, a
computer lab with sufficient facilities, use of modern equipment’s in teaching like
projectors, video, e-learning platform amongst others. This means managers of higher
learning institutions must leverage on technology to encourage learner centered approach
to teaching as opposed to the old tradition of teacher centered approach to learning.
The study results evidence that corporate image has a strong influence over customer
satisfaction. While corporate brand building has so far been highly practiced by business
entities, universities are yet to embrace it. This study suggest that managers in
128
universities must now pay attention to brand building strategies as it is reminiscent of
their customer satisfaction and overall firm performance. Firms must come up with
strong brand building blocks if they are to harness the power of brand equity and remain
competitive.
5.6 Policy Recommendations
Anchoring on the study findings, the researcher finds it imperative to make few policy
recommendations and recommend areas for further research on the subject matter of
service quality, corporate image and customer satisfaction.
Arising from the results of the study, it has been established that students in private
universities experience different services from their counterparts in public universities
and that students in private universities are more satisfied compared to their counterparts
in public universities. The study recommends that the regulatory authority CUE must
strive towards standardization of the learning environment to assure all students of equal
value irrespective of where they experience the service. Standardization in this context
means while CUE has standard policy guideline, enforcement of these policies must be
operationalized. Standardization policies should set out minimum qualification
requirement for teaching staff, minimum conditions for a lecture hall, student teacher
ratio, minimum requirement for non-teaching staff who can work in a university set up,
universities must have a well-stocked library facility, computer laboratory and
universities must have adequate field space for extra curriculum activities.
Second, efforts by the government of Kenya to regulate higher education learning can be
applauded but still fall short of expectation. The privatization of higher learning in
Kenya, led to the emergence of private universities in the country. While some private
universities uphold service quality and give learners value for their money, some other
universities operate with little regards to the quality of teaching that goes on in their
institutions. This study recommends that government should move quickly to stamp out
institutions of higher learning that offer service that do not meet the minimum policy
requirements as established in this study and observed by Ngure (2012) in Appendix 17.
129
In order for universities in Kenya to satisfy customers, the regulatory authority (CUE)
must ensure that the quality of service offered by universities is in tandem with the policy
guidelines of CUE.
Third, the study unveils service blue print or process flow as a vital dimension of service
quality. Universities in Kenya are in competition for students, and for this and other
reasons, some institutions relax the minimum admission criteria to maximize on
admission. This study recommends that CUE should not allow this trend to continue as it
results in non-qualified graduates, whose ability to perform in the work place remain
questionable. The study recommends that CUE should schedule regular scrutiny of the
admission registers of universities to assure that quality of graduates channeled from
these institutions meet the job market requirements.
Last, this study has designed an instrument that addresses service quality and customer
satisfaction in universities. The instrument has been tasted, validated and proven to be
superb. The policy makers in universities can infuse the instrument in Appendix 3 in their
internal quality assurance mechanism to enhance the student experience and satisfaction.
The industry regulator CUE, can design policy framework that will allow for adoption of
the instrument in Appendix 3 as a standard index of measuring student satisfaction in
universities in Kenya.
5.7 Recommended Areas for further Research
This study was a cross sectional survey. It is hoped that a longitudinal survey will provide
a basis for more informed interpretations in future studies. Future research should further
investigate the impacts of service quality, corporate image and customer satisfaction on
organizational performance. This study was a cross sectional survey. It is hoped that a
longitudinal survey will provide a basis for more informed interpretations in future
studies. Future research should further investigate the impacts of service quality,
corporate image and customer satisfaction on organizational performance.
130
5.8 Limitation of the Study
The study results seem to exemplify the four service quality dimensions: human elements
reliability, human element responsiveness, and service blue print and non-human
elements as the key contributors to customer satisfaction in universities. Future attention
should be aimed at unearthing more determinants of customer satisfaction. Another
underlying assumption of the study is that service quality dimensions during a service
lead to a feeling of satisfaction or dissatisfaction. It is possible that the sources of
satisfaction and dissatisfaction are indeed things other than the service quality
dimensions.
Considering this study was conducted in Kenya, some of the findings might be more
appropriate in the Kenyan context. The Kenyan university cultural context may have a
significant influence on service quality and customer satisfaction. It might not be
appropriate for this study to make the claim that the findings are applicable to all service
industries. However, it is hoped that the study can be replicated in Kenyan universities
with significant consistency. The study reported here was skewed toward undergraduate
students, but with the increase in demand for graduate programmes in Kenya, future
studies should be focused at prospects and graduate school students. The study was
limited to six universities in Kenya; a replication can be undertaken with a more
universities being included in the study.
131
REFERENCES
Abagi, O., Nzomo, J. & Otieno, W. (Eds.). (2010). Private Higher Education in Kenya.
Paris: International Institute of Education Planning, UNESCO.
Abdullah, F. (2006). Measuring Service Quality in Higher Education: HEdPERF Versus
SERVPERF. Marketing Intelligence and Planning, 24 (1), 31-47.
Ajayi, T. (2006). Private High Education in Kenya: New Trends in Education: Growth
and Expansion of Private Higher Education in Africa. Paris: International
Institute for Educational Planning.
Aldridge, S. & Rowley, J. (1998). Measuring Customer Satisfaction in High Education.
Quality Assurance in Education, 6 (4), 197–204.
Alves, H. & Raposo, M. (2010). The Influence of University Image on Student
Behaviour. International Journal of Educational Management, 24 (1), 73-85.
Arpan, L., Raney, A. and Zivnuska, S. (2003). A Cognitive Approach to Understanding
University Image. Corporate Communications. 8(2).97-113.
Awino, B. Z. (2011). Strategic Management: An Empirical Investigation of Selected
Strategy Variables on Firms Performance: A Study of Supply Chain
Management in Large Private Manufacturing Firms in Kenya. Prime Journals
Business Administration Management (BAM), 1 (2), 26-31.
Bagozzi, R. P. (1994). Structural Equation Models in Marketing Research: Basic
Principles. Cambridge, MA: Basil Blackwell.
Baron, R. M., & Kenny, D. A. (1986). The Moderator - Mediator Variable Distinction in
Social Psychological Research: Conceptual, Strategic and Statistical
Considerations. Journal of Personality and Social Psychology, 51: 1173-1182.
Battisti, F., Nicolini, G. & Salini, S. (2010). The RASCH Model to Measure Service
Quality: The ICFAI. Journal of Services Marketing, 3 (3), 58-80.
Becket, N. & Brookes, M. (2008). Quality Management Practice in Higher Education –
What Quality Are We Actually Enhancing?. Journal of Hospitality, Leisure,
Sport and Tourism Education, 7 (1), 40 – 54.
Bitner, M. J. (1990). Evaluating Service Encounters: The Effects of Physical
Surroundings and Employee Responses. Journal of Marketing, 54 (1), 69-82.
Brown, R. H. & Clignet, R. (2000). Democracy and Capitalism in the Academy:
Commercialization of American High Education. New York: Teacher College
Press.
132
Buttle, F. (1996). SERVQUAL: Review, Critique and Research Agenda. European
Journal of Marketing, 30 (1), 8-31.
Carman, J. M. (1990). Consumer Perceptions of Service Quality: An Assessment of the
SERVQUAL Dimensions. Journal of Retailing, 66 (1), 33-55.
Che, C. N. & Ting, S. C. (2002). A Study Using the Grey System Theory to Evaluate the
Importance of Various Service Quality Factors. International Journal of Quality
and Reliability Management, 19 (7), 838-861.
CHE (2011). A Report by Commission for Higher Education 2011. Nairobi: CHE.
Retrieved on 20th
July 2011 from http://www.che.or.ke.
Cheruiyot, C. K., Jagongo A., & Owino, E. (2012). Institutionalization of Knowledge
Management in Manufacturing Enterprises in Kenya: A Case of Selected
Enterprises. International Journal of Business and Social Science, 3(10), 127-
138.
Coopers, D. R., & Schindler, P. S. (2003). Business Research Methods. New Delhi:
McGraw-Hill.
Cronin, J. J. Jr & Taylor, S. A. (1992). Measuring Service Quality: A Re-Examination
and Extension. Journal of Marketing, 56 (3), 55-68.
CUE (2013). Status of Universities. Retrieved on 17th
June 2013 from
http://www.cue.or.ke/.
Davies, G., Chun, R., Da Silva, R.V. & Roper, S. (2002). Corporate Reputation and
Competitiveness. London: Routledge.
Deloitte & Touche (1994). Private University Study: Final Report, I and II. Nairobi:
Deloitte and Touche.
Deming, W. E. (1986). Out of the Crisis. Boston: MIT Centre for Advanced Engineering
Study.
Denis, D. J. (2011). Multiple Linear Regression Using SPSS Part II. Montana: University
of Montana. Retrieved on 22nd
August 2013 from
http://psychweb.psy.umt.edu/denis/datadecision/front/stat_II_2011/psyx_521_m
ultiple_regression_part_II.pdf.
Descartes, R. (1998). Discourse on Method and Meditations on First Philosophy (4th
ed.). (D. A. Cress, Trans.). Indianapolis, IN: Hackett.
133
Elliott, K. M. & Healy, M. A. (2001). Key Factors Influencing Student Satisfaction
Related to Recruitment and Retention. Journal of Marketing for Higher
Education, 10 (4), 1 – 11.
Elliott, K. M. & Shin, D. (2002). Student Satisfaction: An Alternative Approach to
Assessing This Important Concept. Journal of Higher Education Policy and
Management, 24(2), 197 – 209 .
EUROSTAT. (2007). Europe in Figures. EuroStat Yearbook 2006-07. Luxembourg.
Retrieved on 30th
June 2012 from http://ec.europa.eu/eurostat.
Fairchild, J. A. (2002). Instrument Reliability and Validity: Introductory Concepts and
Measures: James Madison University.
Fram, E. (1982). Maintaining and Enhancing A College or A University, paper presented
at Twenty-Second Annual Forum of the Association for Institutional Research,
ERI Reports, ED 220 044, 16-19 May, Denver, CO.
Field, A. P. (2005). Discovering Statistics Using SPSS (2nd ed.). London: Sage.
Fornell, C. (1992). A National Satisfaction Barometer: The Swedish Experience. Journal
of Marketing, 56, 6–21.
George, D., & Mallery, P. (2003). SPSS for Windows Step by Step: A Simple Guide and
Reference (4th ed.)Boston: Alleyn and Bacon
Giese, J. L. & Cote, J. A. (2000). Defining Consumer Satisfaction, Academy of Marketing
Science Review, 2000(1) 1-20.
Golafshani, N. (2003). Understanding Reliability and Validity in Qualitative Research.
The Qualitative Report, 8(4), 597-607.
Government of Kenya (1988). Education and Manpower Training for the Next Decade
and Beyond: Report of the Presidential Working Part (Kamunge Report).
Nairobi: Government Printer.
Government of Kenya (2005). Statistical Abstract. Nairobi: Government Printer.
Government of Kenya (2007). Vision 2030. Nairobi: Government Printer.
Granbois, D. (1981). An Integrated View of the Store Choice/Patronage Process.
Advances in Consumer Research, 8, 693-5.
Gronroos, C. (1982). Strategic Management and Marketing in Service Sector.
Cambridge, MA: Marketing Science Institute.
134
Guba, E. G. & Lincoln, Y. S. (1994). Competing Paradigms in Qualitative Research, In
N. K. Denzin and Y. S. Lincoln (Eds), Handbook of Qualitative Research (105-
117). Thousand Oaks,CA:Sage.
Hair, J. R., Jr., Black, W. C., Babin, B. J., Anderson, R. E., & Tatham, R. L. (2006).
Multivariate Analysis. Upper Saddle River, NJ: Pearson Prentice Hall.
Halstead D., Hartman, D. & Schmidt, S. L. (1994). Multisource Effects on the
Satisfaction Formation Process. Journal of the Academy of Marketing Science
22 (1),114-129.
Hanif, M., Hafeez, S. & Riaz, A. (2010). Factors Affecting Customer Satisfaction.
International Research Journal of Finance and Economics, 60.
Hatch, M. J., Schultz, M., & Williamson, J. (2003). Bringing the Corporation Into
Corporate Branding. European Journal of Marketing, 37(7/8), 1041-64.
ISO Central Secretariat. (2006). The ISO Survey 2005. Retrieved from
http://www.iso.org/iso/en/iso9000-14000/pdf/survey2005.pdf.
Israel, G. D. (2009). Determining Sample Size, Institute of Food and Agricultural
Sciences. Florida: University of Florida.
Jayasundara, C., Ngulube, P. & Majanja, M. K. (2010). Using Focus Groups to
Investigate Service Quality Determinants for Customer Satisfaction in Selected
University Libraries in Sri Lanka. South African Journal of Libraries and
Information Science, 76(2), 118-127.
Johnston, R. (1995). The Determinants of Service Quality: Satisfiers and Dissatisfies.
International Journal of Service Industry Management, 6(5) 53-71.
Johnston, R. (1997). Identifying the Critical Determinants of Service Quality in Retail
Banking: Importance and Effect. International Journal of Banking, 15(4), 111-
116.
Jones, T. O. & Sasser, W. E. (1995). Why Satisfied Customers Defect. Harvard Business
Review, 73(6), 88-99.
Joseph, M. & Joseph, B. (1997). Service Quality in Education: A Student Perspective.
Quality in Assurance in Education, 5(1), 15-21.
Juran, J. M. (1991). World War II and the Quality Movement. The Journal of Quality
Progress, 24(12) 19-24.
Kabagambe, L. B., Ogutu, M. & Munyoki, J. M. (2012). Firm Competencies and Export
Performance: A Study of Small and Medium Manufacturing Exporters in
Uganda. European Scientific Journal, 8(12), 48-67.
135
Kandampully, J. & Hu, H. H. (2007). Do Hoteliers Need to Manage Image to Retain
Loyal Customers? International Journal of Contemporary Hospitality
Management, 19 (6), 435-443.
Kang, G. D. & James, J. (2004). Service Quality Dimension an Examination of
Gronroos’s Service Quality Model. Managing Service Quality, 14 (4), 266-277.
Kay, C. & Pawitra, T. A. (2001). Integrating SERVQUAL and Kano’s Model Into QFD
for Service Excellence Development. Managing Service Quality, 11(6), 418-
430.
Keller, K. L. (2008). Strategic Brand Management: Building, Measuring and Managing
Brand Equity. (3rd ed.). Upper Saddle River, NJ: Pearson/Prentice Hall.
Kenya National Bureau of Statistics. (2012). Economic Survey. Nairobi: Government
Printer.
Kibera, F. N. (Ed.). (1996). Introduction to Business: A Kenyan Perspective. Nairobi:
Kenya Literature Bureau.
Kimonye, M. (1998). The Key to Customer Satisfaction, Marketing Review. A Journal of
Marketing Students Association, 10.
Korgaonkar, P. K., Lund, D. & Price, B. (1985). A Structural Equations Approach
Toward Examination of Store Attitude and Store Patronage Behavior. Journal
of Retailing, 61 (Summer), 39-60.
Kotler, P. (1965). Behavioural Models for Analyzing Buyers. Journal of Marketing, 29,
37-45.
Kotler, P & Keller, K. L., (2006). Marketing Management (12th ed.). Upper Saddle
River, NJ: Pearson Prentice Hall.
Lehtinen, J. R. & Lehtinen, U. (1982). Service Quality: A Study of Quality Dimensions,
Unpublished Working Paper. Helsinki: Service Management Institute.
Levesque, T. & McDougall, H. G. (1996). Determinants of Customer Satisfaction in
Retail Banking. International Journal of Bank Marketing, 14(7), 12–20.
Long, J. S. (1997). Regression Models for Categorical and Limited Dependent Variables.
Thousand Oaks, CA: Sage.
Magutu, P. O., Mbeche, I. M., Nyaoga, R. B., Ongeri, R. N. & Ombati, T. O. (2010).
Quality Management Practices in Kenyan Educational Institutions: The Case of
the University of Nairobi. African Journal of Business and Management, 1, 14-
28.
136
Makori, A. (2005). The Kenya’s Educational Policy: Exploring Some of the Major
Impediments to Redesigning Pedagogy. Proceedings of the International
Conference. Singapore, Nanyang Technological University.
Malhotra, N. K. (2010). Marketing Research: An Applied Orientation (6th
ed.). London:
Pearson Education.
Matsunaga, M. (2010). How to Factor Analyze Your Data: Do’s and Donts’s and How
To’s. International Journal of Psychology Research, 3(1), 97-110.
Mutula, S. M. (2002). University Education in Kenya: Current Developments and Future
Outlook. International Journal of Education Management, 16 (3) 109-119.
Navarro, M. M., Iglesias, M. P. & Torres, M. P. R. (2005). Measuring Customer
Satisfaction in Summer Courses. Quality Assurance in Education, 13(1), 53-65.
Nguyen, N. & LeBlanc, G. (2001). Image and Reputation of Higher Education
Institutions in Students’ Retention Decisions. The International Journal of
Educational Management, 15(6/7), 303-311.
Nguyen, N. (2006). The Collective Impact of Service Workers and Servicescape on the
Corporate Image Formation. International Journal of Hospitality Management,
25(2), 227-44.
Ngware, M. S., Onsomu, E. N., & Manda, D. K. (2005). Private Sector Investment in
Education and Training: A Case of Tertiary Education in Kenya, Special Report
No. 7. Nairobi: Kenya Institute for Public Policy Research and Analysis.
Norusis, M. J. (2003). SPSS 12.0 Statistical Procedures Companion. Upper Saddle, NJ:
Prentice Hall.
Nyaribo, W., Prakash, D., Owino, E. (2012). Motivators of Choosing a Management
Course: A Comparative Study of Kenya and India. The International Journal of
Management Education, 10(2012), 201-214.
Oanda, I. O. (2008). Privatization and Private High Education in Kenya: Implications for
Access, Equity and Knowledge Production. CODESRIA Dakar: Imprimerie
Saint Paul.
Oliver, R. L. (1980). A Cognitive Model of the Antecedents and Consequences of
Satisfaction Decisions. Journal of Marketing Research 17 (4): 460-469.
Osborne, J. W. (2010). Improving Your Data Transformations: Applying the Box-Cox
Transformation, Practical Assessment, Research and Evaluation, 15(12).
Pallant, J. (2010). Statistical Package for Social Sciences Survival Manual (4th ed.).
England: McGraw Hill.
137
Parasuraman, A., Berry, L. L. & Zeithaml, V. A. (1985). A Conceptual Model of Service
Quality and Implications for Future Research. Journal of Marketing, 49, 41-50.
Parasuraman, A., Berry, L. L. & Zeithaml, V. A. (1988). A Multiple Item Scale for
Measuring Consumer Perceptions of Service Quality. Journal of Retailing,
64(1), 12-40.
Park, H. M. (2008). Univariate Analysis and Normality Test Using SAS, Stata, and SPSS.
Working Paper. The University Information Technology Services (UITS)
Center for Statistical and Mathematical Computing, Indiana University.
Reference. 11.0 Update (4th ed.). Boston: Allyn & Bacon.
Robledo, M. A. (2001). Measuring and Managing Service Quality: Integrating Customer
Expectations. Journal of Managing Service Quality, 11 (1), 22-31.
Rust, R. T. & Oliver, R. L. (1994). Service Quality: Insights and Managerial
Implications from the Frontier. In R.L. Oliver and R.T. Rust (Eds), (1-20)
Service Quality: New Directions in Theory and Practice. Thousand Oaks, CA:
Sage.
Senthilkumar, N. & Arulraj, A. (2010). Service Quality M-HEI – Determination of
Service Quality Measurement of Higher Education in India. Journal of
Modeling in Management, 6 (1), 60-78.
Shaver, J. M. (2005). Testing for Mediating Variable in Management Research:
Concerns, Implications and Alternative Strategies. Journal of Management,
31(3), 330-353.
Shekarchizadeh, A. R. & Hon-Tat, H. (2011). SERVQUAL in Malaysian Universities:
Perspectives of International Students. Business Process Management Journal,
17(1), 67-81.
Shieh, C. J, (2006). The Relationship Between Service Quality and Customer
Satisfaction: The Example of CJCU Library, 27 (1) 193-209.
Smith, G., Smith, A. & Clarke, A. (2007). Evaluating Service Quality in Universities: A
Service Department Perspective. Quality Assurance in Education, 15(3), 334-
351.
Sobh, R. & Perry, C. (2006). Research Design and Data Analysis in Realism Research.
European Journal of Marketing, 40(11/12), 1194-1209.
Stevens, J. P. (2002). Applied Multivariate Statistics for Social Sciences (4th
ed.).
Hillsdale, NJ: Erlbaum.
138
Sultan, P. & Wong, H. (2010). Performance Based Service Quality Model: An Empirical
Study of Japanese Universities. Quality Assurance in Education, 18(2), 126-
143.
Sureshchandar, G. S., Rajendran, C., & Anatharaman, R. N. (2002). Determinants of
Customer Perceived Service Quality: A Confirmatory Factor Analysis
Approach. Journal of Service Marketing, 16(1), 9-34.
Tabachnick, B. G., & Fidell, L. S. (2007). Using Multivariate Statistics (5th ed.). Boston:
Allyn and Bacon.
Uwalomwa, U. & Olamide, O. (2012). An Empirical Examination of the Relationship
Between Ownership Structure and the Performance of Firms in Nigeria.
International Business Research, 5(1).
Verbeek, M. (2004). A Guide to Modern Econometrics (2nd ed.). Chichester: John Wiley
& Sons.
Walsh, G., Dinnie, K. & Wiedmann, K. P. (2006). How Do Corporate Reputation and
Customer Satisfaction Impact Customer Defection? A Study of Private Energy
Customers in Germany. Journal of Service Marketing, 20(6), 412–420.
Winter, G. (2000). A Comparative Discussion of the Notion of Validity in Qualitative
and Quantitative Research. The Qualitative Report, 4(3&4). Retrieved February
25, 1998, from http://www.nova.edu/ssss/QR/QR4-3/winter.html/.
Yan, R. N., Yurchisin, J. & Watchravesringkan, K. (2007). Does Formality Matter?
Effects of Employee Clothing Formality on Consumers’ Service Quality
Expectations and Store Image Perceptions. International Journal of Retail &
Distribution Management, 39(5), 346-362.
Zaim, S., Turkyilmaz, A., Tarim, M., Ucar, B., & Akkas, O. (2010). Measuring Customer
Satisfaction in Turk Telekom Company Using Structural Equation Modeling
Technique. Journal of Global Strategic Management, 7, (June), 89-99.
Zaltanman, G., Pinson C. R. A. & Angelmar R. (1969). Metatheory and Consumer
Research. Holt: Rinehart and Winston Inc.
Zar, J. H. (1999). Biostatistical Analysis (4th ed.). Upper Saddle River, NJ: Prentice-Hall.
Zeithaml, V. A, Bitner, M. J., & Gremler, D. D. (2006). Service Marketing: Integrating
Customer Focus Across the Firm (4th ed.). New York: McGraw-Hill
International.
Zimmer, M. R. & Golden, L. L. (1988). Impression of Retailing Stores: A Content
Analysis of Consumer Images. Journal of Retailing, 64(3), 265-293.
139
APPENDICES
Appendix 1: Introduction Letter
UNIVERSITY OF NAIROBI
P.O. Box 30197 – 00100
NAIROBI
To Whom It May Concern
Dear Sir/Madam,
RE: Request to Collect Data on a Research Topic Entitled ‘Influence Of Service
Quality and Corporate Image on Customer Satisfaction’
I am a Doctor of Philosophy (PhD) candidate at the University of Nairobi, in the School
of Business, Department of Business Administration. As part of the requirements for the
award of the degree, I am expected to undertake a research study which involves data
collcetionand report writing. The purpose of this study is “to investigate the
relationship between service quality, corporate image and customer satisfaction
among university students in Kenya.”
I hereby request for your participationin by taking about 10 minutes to complete the
attached questionnaire. The research results will be used for academic purposes only.
Only summary results will be made public. No one will have access to this records except
the University and the researcher. The information obtained will be treated confidentially
and for research purposes only. Your support and cooperation in filling the questionnaire
will be highly appreciated.
Yours faithfully,
Edward Otieno Owino
PhD Candidate
email: [email protected]
Telephone: +254 254 867
140
Appendix 2: Cover Letter: Institutional
Edward O. Owino
University of Nairobi
P.O.BOX 30197,
00100
Nairobi.
Tel. 0722-254867
The DVC Academic Affaires
… University name…,
P.O.BOX 30197, 00100
Town /City, Kenya.
Dear Sir/Madam,
RE: REQUEST FOR PERMISSION TO COLLECT ACADEMIC RESEARCH
DATA
I am writing to kindly request for permission to obtain data from your organization for
the above mentioned purpose. I am a doctoral candidate at the University of Nairobi,
School of Business and as part of the requirements of the award of the degree; I am
conducting a research on “Influence of Service Quality and Corporate Image on
Customer Satisfaction among University Students in Kenya”
I included your University in my study after observing that it was amongst the top 10
ranked universities in Kenya, based on the University web ranking. Given the research
topic, it was considered that student in your university will be more potential in providing
the required data. I therefore request that you allow me to collect data that is pertinent for
the research. My mode of data collection is through self-administered questionnaire. I am
targeting at least _________ respondents from your organization.
I assure that the information collected will be used purely for this academic research and
I guarantee utmost confidentiality. I have attached a letter from the university certifying
my candidature and a copy of the questionnaire. Copy of the findings will be availed to
you upon request. Thank you
Yours faithfully,
Edward Owino
PhD. Candidate
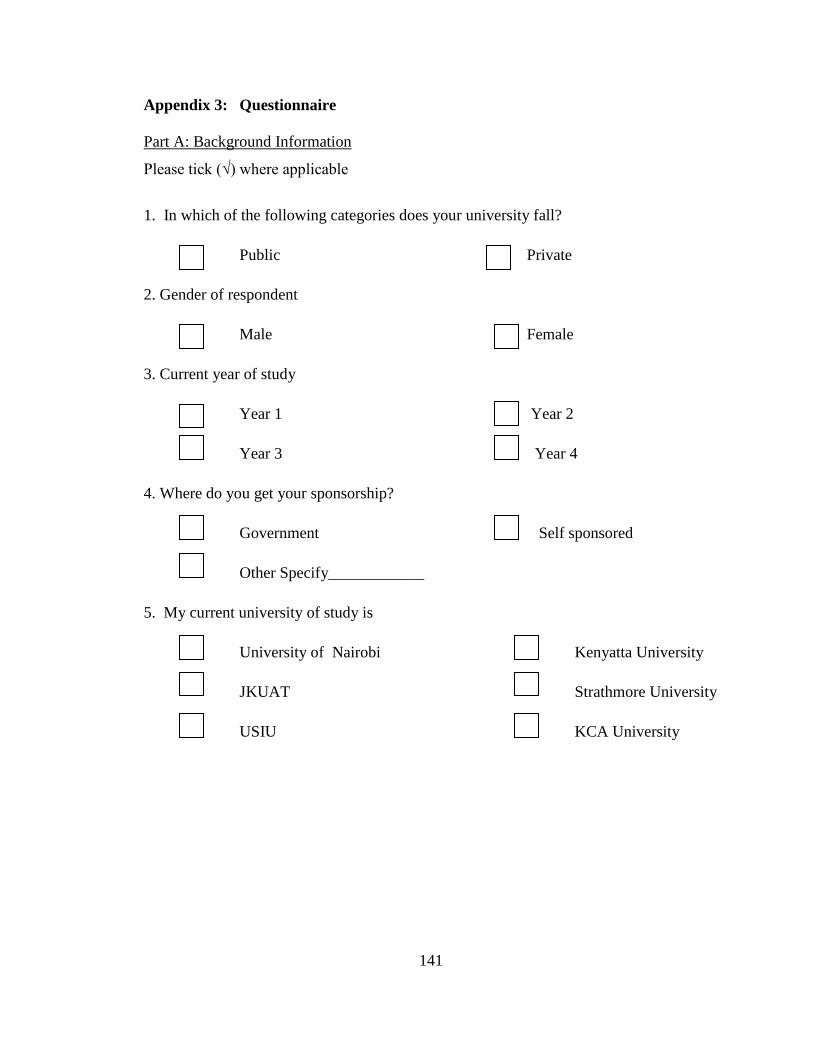
141
Appendix 3: Questionnaire
Part A: Background Information
Please tick (√) where applicable
1. In which of the following categories does your university fall?
Public Private
2. Gender of respondent
Male Female
3. Current year of study
Year 1 Year 2
Year 3 Year 4
4. Where do you get your sponsorship?
Government Self sponsored
Other Specify____________
5. My current university of study is
University of Nairobi Kenyatta University
JKUAT Strathmore University
USIU KCA University
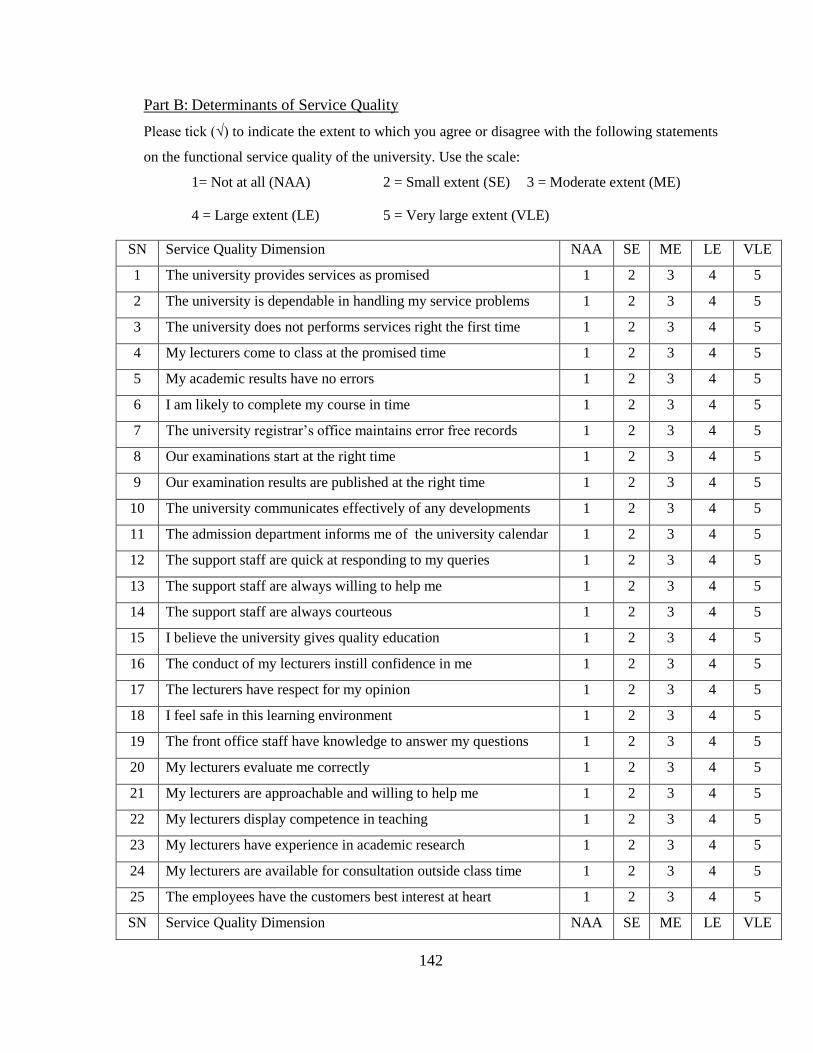
142
Part B: Determinants of Service Quality
Please tick (√) to indicate the extent to which you agree or disagree with the following statements
on the functional service quality of the university. Use the scale:
1= Not at all (NAA) 2 = Small extent (SE) 3 = Moderate extent (ME)
4 = Large extent (LE) 5 = Very large extent (VLE)
SN Service Quality Dimension NAA SE ME LE VLE
1 The university provides services as promised 1 2 3 4 5
2 The university is dependable in handling my service problems 1 2 3 4 5
3 The university does not performs services right the first time 1 2 3 4 5
4 My lecturers come to class at the promised time 1 2 3 4 5
5 My academic results have no errors 1 2 3 4 5
6 I am likely to complete my course in time 1 2 3 4 5
7 The university registrar’s office maintains error free records 1 2 3 4 5
8 Our examinations start at the right time 1 2 3 4 5
9 Our examination results are published at the right time 1 2 3 4 5
10 The university communicates effectively of any developments 1 2 3 4 5
11 The admission department informs me of the university calendar 1 2 3 4 5
12 The support staff are quick at responding to my queries 1 2 3 4 5
13 The support staff are always willing to help me 1 2 3 4 5
14 The support staff are always courteous 1 2 3 4 5
15 I believe the university gives quality education 1 2 3 4 5
16 The conduct of my lecturers instill confidence in me 1 2 3 4 5
17 The lecturers have respect for my opinion 1 2 3 4 5
18 I feel safe in this learning environment 1 2 3 4 5
19 The front office staff have knowledge to answer my questions 1 2 3 4 5
20 My lecturers evaluate me correctly 1 2 3 4 5
21 My lecturers are approachable and willing to help me 1 2 3 4 5
22 My lecturers display competence in teaching 1 2 3 4 5
23 My lecturers have experience in academic research 1 2 3 4 5
24 My lecturers are available for consultation outside class time 1 2 3 4 5
25 The employees have the customers best interest at heart 1 2 3 4 5
SN Service Quality Dimension NAA SE ME LE VLE
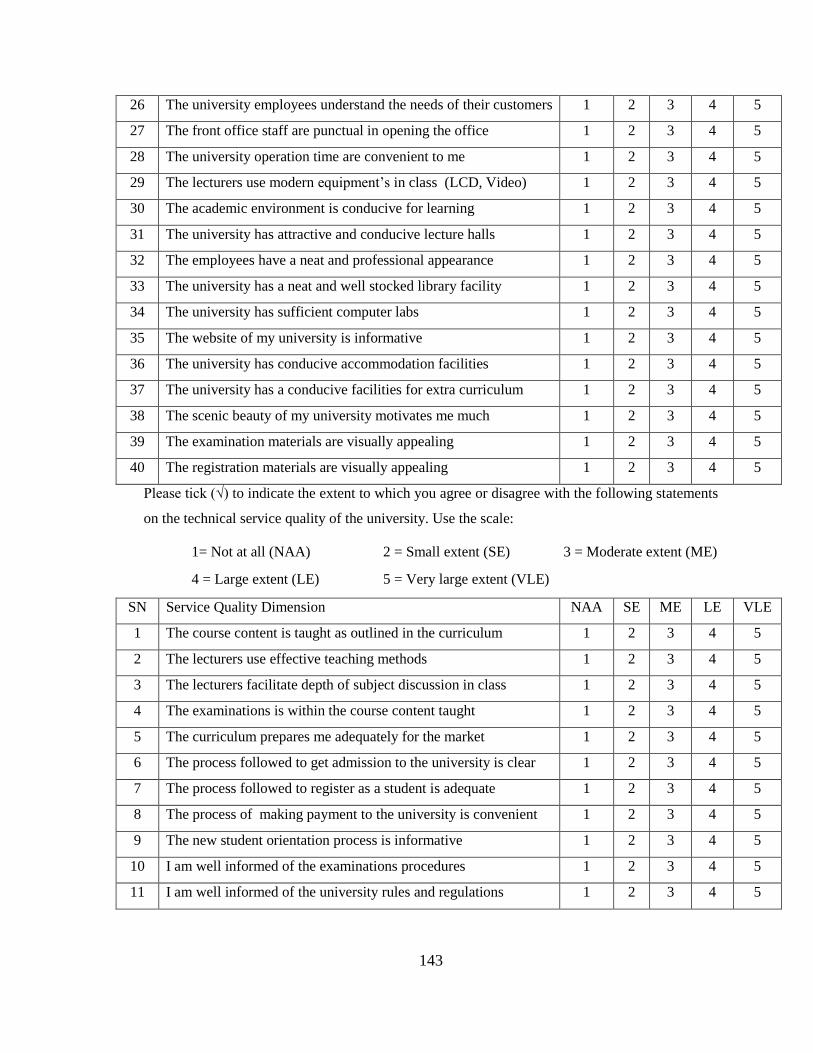
143
26 The university employees understand the needs of their customers 1 2 3 4 5
27 The front office staff are punctual in opening the office 1 2 3 4 5
28 The university operation time are convenient to me 1 2 3 4 5
29 The lecturers use modern equipment’s in class (LCD, Video) 1 2 3 4 5
30 The academic environment is conducive for learning 1 2 3 4 5
31 The university has attractive and conducive lecture halls 1 2 3 4 5
32 The employees have a neat and professional appearance 1 2 3 4 5
33 The university has a neat and well stocked library facility 1 2 3 4 5
34 The university has sufficient computer labs 1 2 3 4 5
35 The website of my university is informative 1 2 3 4 5
36 The university has conducive accommodation facilities 1 2 3 4 5
37 The university has a conducive facilities for extra curriculum 1 2 3 4 5
38 The scenic beauty of my university motivates me much 1 2 3 4 5
39 The examination materials are visually appealing 1 2 3 4 5
40 The registration materials are visually appealing 1 2 3 4 5
Please tick (√) to indicate the extent to which you agree or disagree with the following statements
on the technical service quality of the university. Use the scale:
1= Not at all (NAA) 2 = Small extent (SE) 3 = Moderate extent (ME)
4 = Large extent (LE) 5 = Very large extent (VLE)
SN Service Quality Dimension NAA SE ME LE VLE
1 The course content is taught as outlined in the curriculum 1 2 3 4 5
2 The lecturers use effective teaching methods 1 2 3 4 5
3 The lecturers facilitate depth of subject discussion in class 1 2 3 4 5
4 The examinations is within the course content taught 1 2 3 4 5
5 The curriculum prepares me adequately for the market 1 2 3 4 5
6 The process followed to get admission to the university is clear 1 2 3 4 5
7 The process followed to register as a student is adequate 1 2 3 4 5
8 The process of making payment to the university is convenient 1 2 3 4 5
9 The new student orientation process is informative 1 2 3 4 5
10 I am well informed of the examinations procedures 1 2 3 4 5
11 I am well informed of the university rules and regulations 1 2 3 4 5
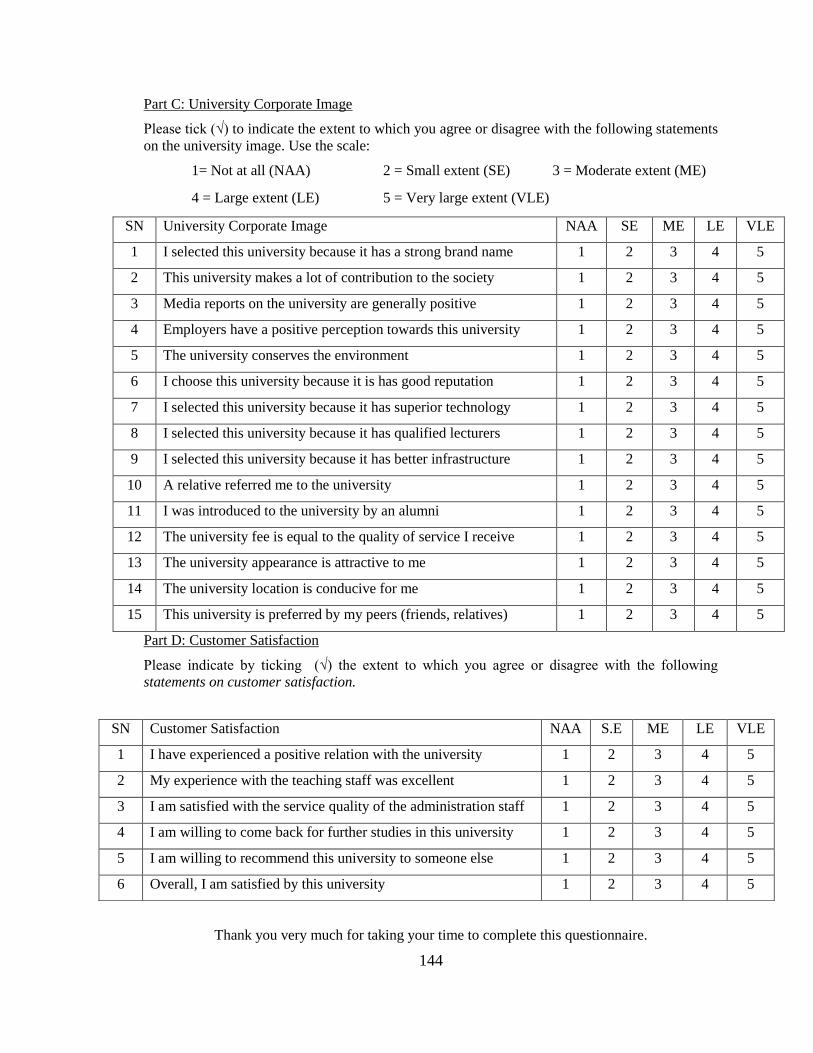
144
Part C: University Corporate Image
Please tick (√) to indicate the extent to which you agree or disagree with the following statements
on the university image. Use the scale:
1= Not at all (NAA) 2 = Small extent (SE) 3 = Moderate extent (ME)
4 = Large extent (LE) 5 = Very large extent (VLE)
SN University Corporate Image NAA SE ME LE VLE
1 I selected this university because it has a strong brand name 1 2 3 4 5
2 This university makes a lot of contribution to the society 1 2 3 4 5
3 Media reports on the university are generally positive 1 2 3 4 5
4 Employers have a positive perception towards this university 1 2 3 4 5
5 The university conserves the environment 1 2 3 4 5
6 I choose this university because it is has good reputation 1 2 3 4 5
7 I selected this university because it has superior technology 1 2 3 4 5
8 I selected this university because it has qualified lecturers 1 2 3 4 5
9 I selected this university because it has better infrastructure 1 2 3 4 5
10 A relative referred me to the university 1 2 3 4 5
11 I was introduced to the university by an alumni 1 2 3 4 5
12 The university fee is equal to the quality of service I receive 1 2 3 4 5
13 The university appearance is attractive to me 1 2 3 4 5
14 The university location is conducive for me 1 2 3 4 5
15 This university is preferred by my peers (friends, relatives) 1 2 3 4 5
Part D: Customer Satisfaction
Please indicate by ticking (√) the extent to which you agree or disagree with the following
statements on customer satisfaction.
Thank you very much for taking your time to complete this questionnaire.
SN Customer Satisfaction NAA S.E ME LE VLE
1 I have experienced a positive relation with the university 1 2 3 4 5
2 My experience with the teaching staff was excellent 1 2 3 4 5
3 I am satisfied with the service quality of the administration staff 1 2 3 4 5
4 I am willing to come back for further studies in this university 1 2 3 4 5
5 I am willing to recommend this university to someone else 1 2 3 4 5
6 Overall, I am satisfied by this university 1 2 3 4 5
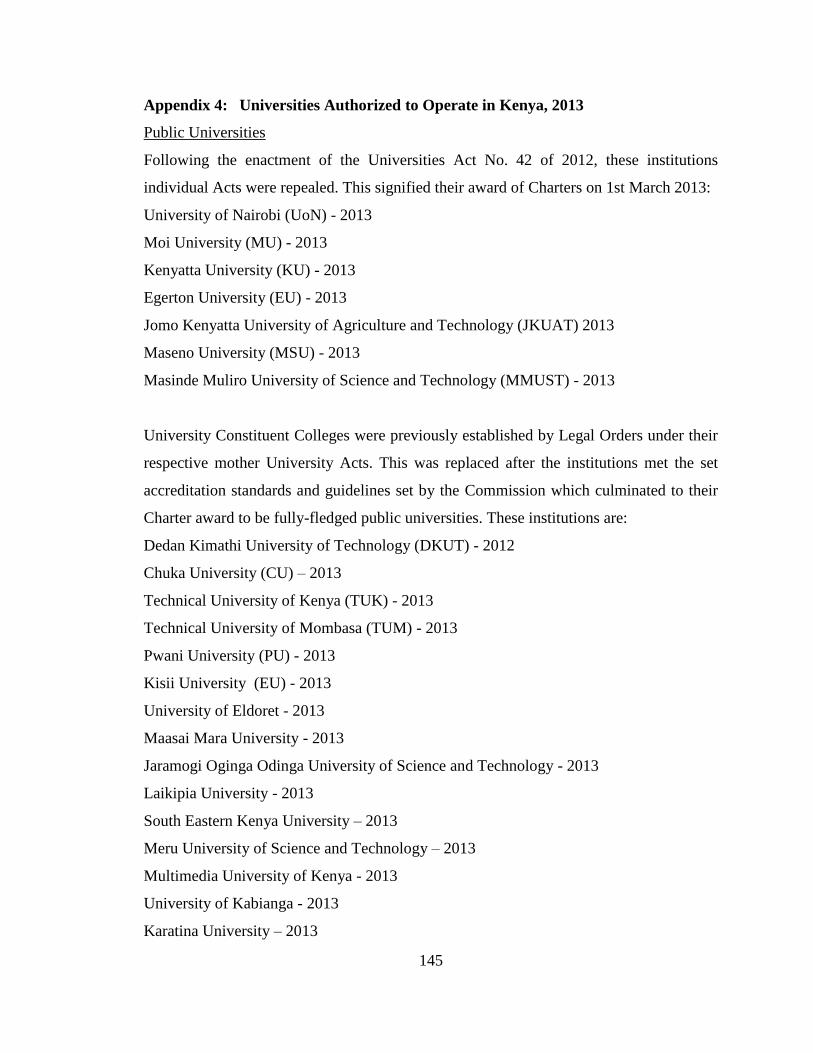
145
Appendix 4: Universities Authorized to Operate in Kenya, 2013
Public Universities
Following the enactment of the Universities Act No. 42 of 2012, these institutions
individual Acts were repealed. This signified their award of Charters on 1st March 2013:
University of Nairobi (UoN) - 2013
Moi University (MU) - 2013
Kenyatta University (KU) - 2013
Egerton University (EU) - 2013
Jomo Kenyatta University of Agriculture and Technology (JKUAT) 2013
Maseno University (MSU) - 2013
Masinde Muliro University of Science and Technology (MMUST) - 2013
University Constituent Colleges were previously established by Legal Orders under their
respective mother University Acts. This was replaced after the institutions met the set
accreditation standards and guidelines set by the Commission which culminated to their
Charter award to be fully-fledged public universities. These institutions are:
Dedan Kimathi University of Technology (DKUT) - 2012
Chuka University (CU) – 2013
Technical University of Kenya (TUK) - 2013
Technical University of Mombasa (TUM) - 2013
Pwani University (PU) - 2013
Kisii University (EU) - 2013
University of Eldoret - 2013
Maasai Mara University - 2013
Jaramogi Oginga Odinga University of Science and Technology - 2013
Laikipia University - 2013
South Eastern Kenya University – 2013
Meru University of Science and Technology – 2013
Multimedia University of Kenya - 2013
University of Kabianga - 2013
Karatina University – 2013
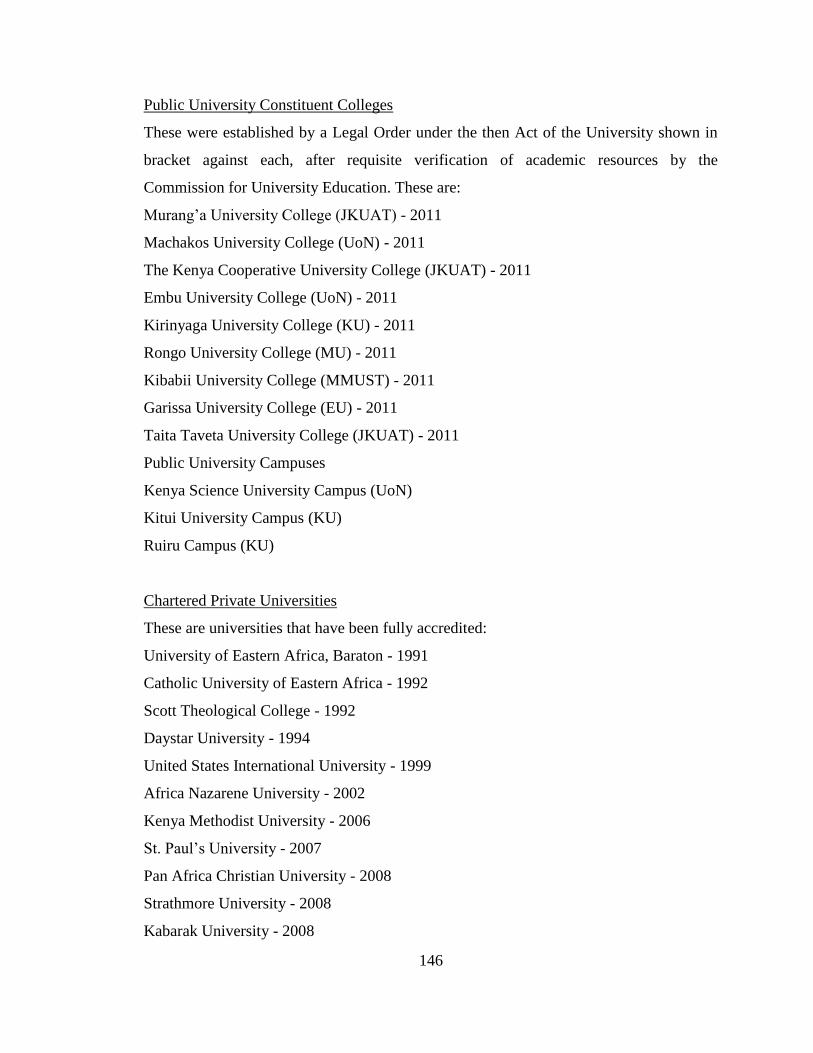
146
Public University Constituent Colleges
These were established by a Legal Order under the then Act of the University shown in
bracket against each, after requisite verification of academic resources by the
Commission for University Education. These are:
Murang’a University College (JKUAT) - 2011
Machakos University College (UoN) - 2011
The Kenya Cooperative University College (JKUAT) - 2011
Embu University College (UoN) - 2011
Kirinyaga University College (KU) - 2011
Rongo University College (MU) - 2011
Kibabii University College (MMUST) - 2011
Garissa University College (EU) - 2011
Taita Taveta University College (JKUAT) - 2011
Public University Campuses
Kenya Science University Campus (UoN)
Kitui University Campus (KU)
Ruiru Campus (KU)
Chartered Private Universities
These are universities that have been fully accredited:
University of Eastern Africa, Baraton - 1991
Catholic University of Eastern Africa - 1992
Scott Theological College - 1992
Daystar University - 1994
United States International University - 1999
Africa Nazarene University - 2002
Kenya Methodist University - 2006
St. Paul’s University - 2007
Pan Africa Christian University - 2008
Strathmore University - 2008
Kabarak University - 2008
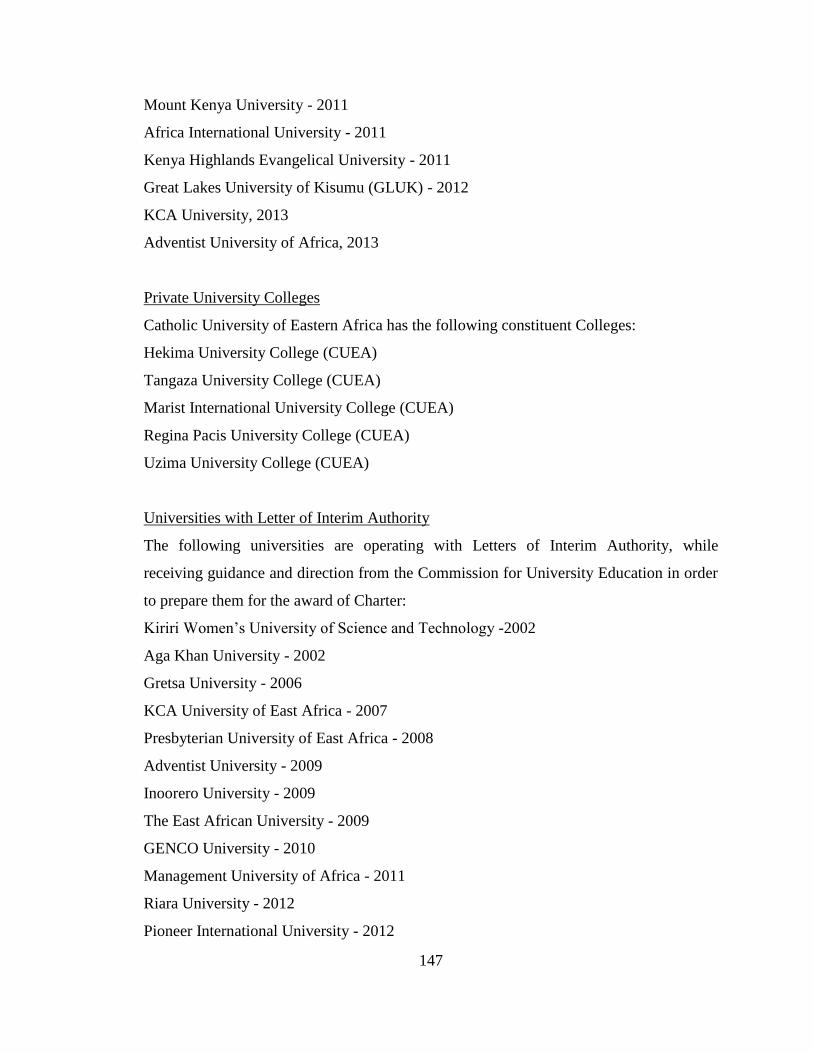
147
Mount Kenya University - 2011
Africa International University - 2011
Kenya Highlands Evangelical University - 2011
Great Lakes University of Kisumu (GLUK) - 2012
KCA University, 2013
Adventist University of Africa, 2013
Private University Colleges
Catholic University of Eastern Africa has the following constituent Colleges:
Hekima University College (CUEA)
Tangaza University College (CUEA)
Marist International University College (CUEA)
Regina Pacis University College (CUEA)
Uzima University College (CUEA)
Universities with Letter of Interim Authority
The following universities are operating with Letters of Interim Authority, while
receiving guidance and direction from the Commission for University Education in order
to prepare them for the award of Charter:
Kiriri Women’s University of Science and Technology -2002
Aga Khan University - 2002
Gretsa University - 2006
KCA University of East Africa - 2007
Presbyterian University of East Africa - 2008
Adventist University - 2009
Inoorero University - 2009
The East African University - 2009
GENCO University - 2010
Management University of Africa - 2011
Riara University - 2012
Pioneer International University - 2012

148
Registered Private Universities
These came into existence before the establishment of the Commission for University
Education in 1985. They are at various stages of preparedness for the award of Charter:
Nairobi International School of Theology
East Africa School of Theology
Source: CUE (2013). Status of Universities, retrieved on 24th May 2013.
http://www.cue.or.ke/
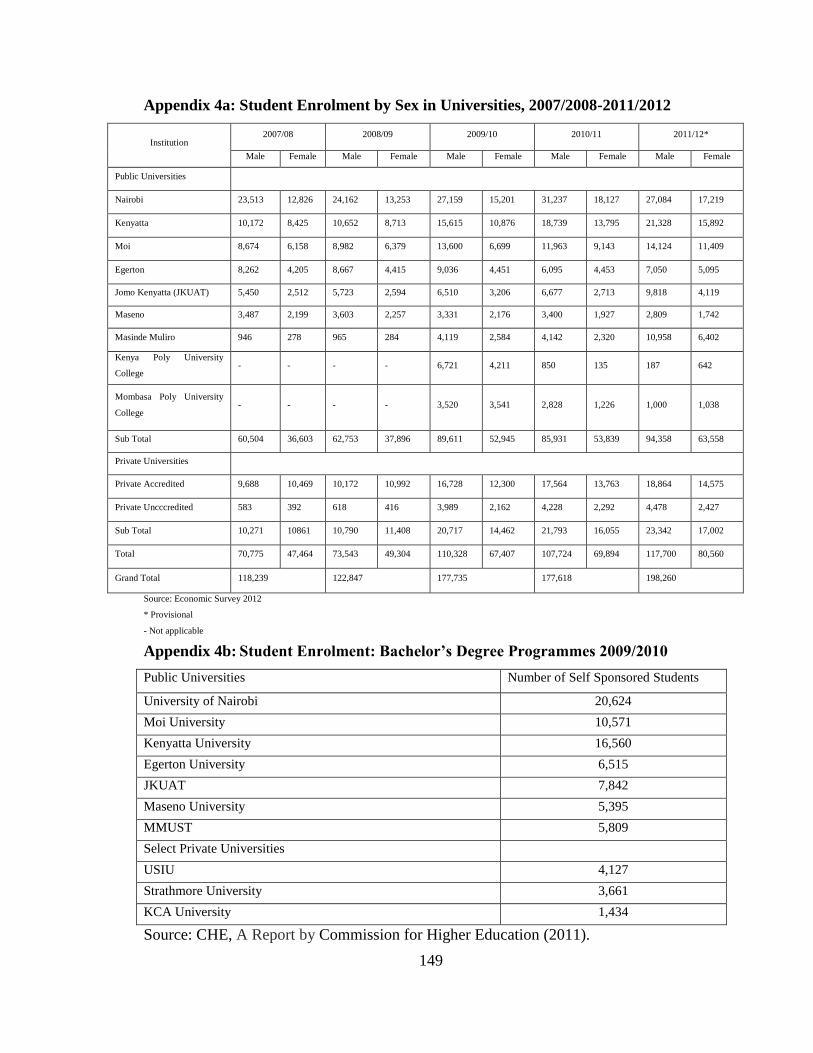
149
Appendix 4a: Student Enrolment by Sex in Universities, 2007/2008-2011/2012
Institution 2007/08 2008/09 2009/10 2010/11 2011/12*
Male Female Male Female Male Female Male Female Male Female
Public Universities
Nairobi 23,513 12,826 24,162 13,253 27,159 15,201 31,237 18,127 27,084 17,219
Kenyatta 10,172 8,425 10,652 8,713 15,615 10,876 18,739 13,795 21,328 15,892
Moi 8,674 6,158 8,982 6,379 13,600 6,699 11,963 9,143 14,124 11,409
Egerton 8,262 4,205 8,667 4,415 9,036 4,451 6,095 4,453 7,050 5,095
Jomo Kenyatta (JKUAT) 5,450 2,512 5,723 2,594 6,510 3,206 6,677 2,713 9,818 4,119
Maseno 3,487 2,199 3,603 2,257 3,331 2,176 3,400 1,927 2,809 1,742
Masinde Muliro 946 278 965 284 4,119 2,584 4,142 2,320 10,958 6,402
Kenya Poly University
College - - - - 6,721 4,211 850 135 187 642
Mombasa Poly University
College - - - - 3,520 3,541 2,828 1,226 1,000 1,038
Sub Total 60,504 36,603 62,753 37,896 89,611 52,945 85,931 53,839 94,358 63,558
Private Universities
Private Accredited 9,688 10,469 10,172 10,992 16,728 12,300 17,564 13,763 18,864 14,575
Private Uncccredited 583 392 618 416 3,989 2,162 4,228 2,292 4,478 2,427
Sub Total 10,271 10861 10,790 11,408 20,717 14,462 21,793 16,055 23,342 17,002
Total 70,775 47,464 73,543 49,304 110,328 67,407 107,724 69,894 117,700 80,560
Grand Total 118,239 122,847 177,735 177,618 198,260
Source: Economic Survey 2012
* Provisional
- Not applicable
Appendix 4b: Student Enrolment: Bachelor’s Degree Programmes 2009/2010
Public Universities Number of Self Sponsored Students
University of Nairobi 20,624
Moi University 10,571
Kenyatta University 16,560
Egerton University 6,515
JKUAT 7,842
Maseno University 5,395
MMUST 5,809
Select Private Universities
USIU 4,127
Strathmore University 3,661
KCA University 1,434
Source: CHE, A Report by Commission for Higher Education (2011).
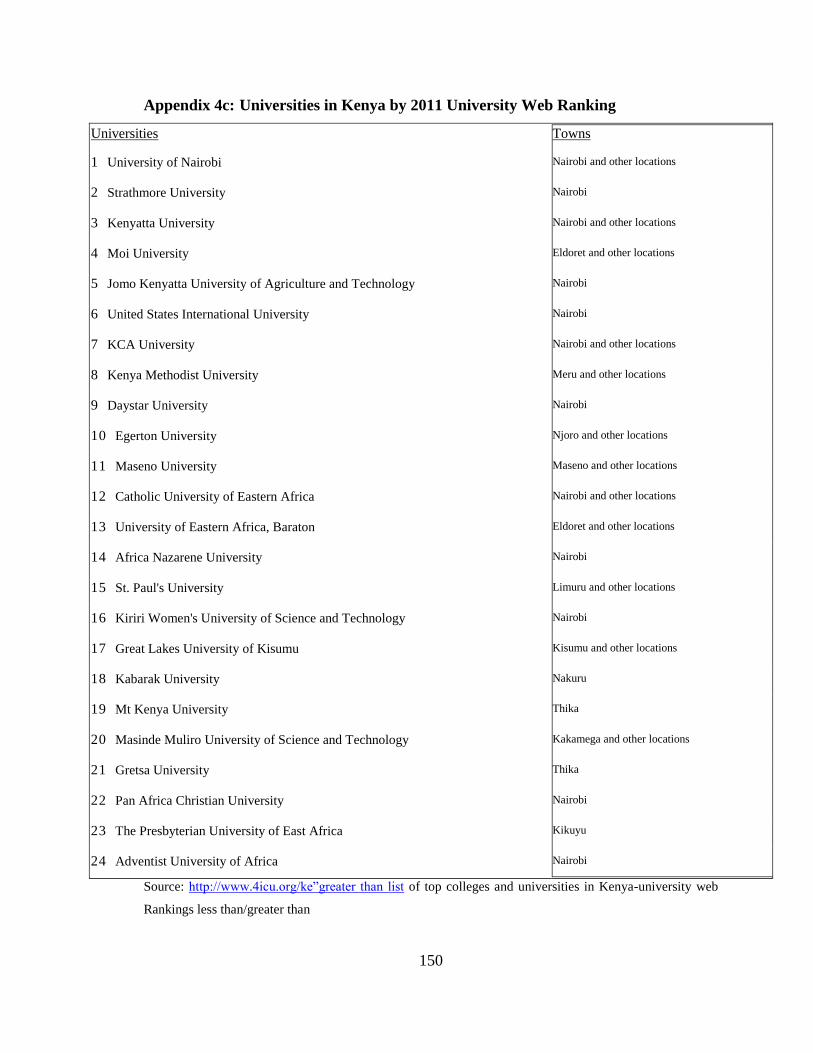
150
Appendix 4c: Universities in Kenya by 2011 University Web Ranking
Universities Towns
1 University of Nairobi Nairobi and other locations
2 Strathmore University Nairobi
3 Kenyatta University Nairobi and other locations
4 Moi University Eldoret and other locations
5 Jomo Kenyatta University of Agriculture and Technology Nairobi
6 United States International University Nairobi
7 KCA University Nairobi and other locations
8 Kenya Methodist University Meru and other locations
9 Daystar University Nairobi
10 Egerton University Njoro and other locations
11 Maseno University Maseno and other locations
12 Catholic University of Eastern Africa Nairobi and other locations
13 University of Eastern Africa, Baraton Eldoret and other locations
14 Africa Nazarene University Nairobi
15 St. Paul's University Limuru and other locations
16 Kiriri Women's University of Science and Technology Nairobi
17 Great Lakes University of Kisumu Kisumu and other locations
18 Kabarak University Nakuru
19 Mt Kenya University Thika
20 Masinde Muliro University of Science and Technology Kakamega and other locations
21 Gretsa University Thika
22 Pan Africa Christian University Nairobi
23 The Presbyterian University of East Africa Kikuyu
24 Adventist University of Africa Nairobi
Source: http://www.4icu.org/ke”greater than list of top colleges and universities in Kenya-university web
Rankings less than/greater than

151
Appendix 5: Service Quality Battery
Reliability
1. Providing services as promised.
2. Dependability in handling customers' service problems.
3. Performing services right the first time.
4. Providing services at the promised time.
5. Maintaining error-free records.
Responsiveness
6. Keeping customers informed about when services will be performed.
7. Prompt service to customers.
8. Willingness to help customers.
9. Readiness to respond to customers' requests.
Assurance
10. Employees who instill confidence in customers.
11. Making customers feel safe in their transactions.
12. Employees who are consistently courteous.
13. Employees who have the knowledge to answer customer questions.
Empathy
14. Giving customers individual attention.
15. Employees who deal with customers in a caring fashion.
16. Having the customer's best interest at heart.
17. Employees who understand the needs of their customers.
18. Convenient business hours.
Tangibles
19. Modern equipment.
20. Visually appealing facilities.
21. Employees who have a neat, professional appearance.
22. Visually appealing materials associated with the service.
Source: Parasuraman et al. (1988)

152
Appendix 6: Study Variables and Their Operationalization
Variable Operationalization (Indicators) Specific Measure Question Number
1. Human Elements (Independent Variable)
Reliability
Delivery of service by the university as promised Actual service same as expected service
Appendix 3
Question number
1,2,3,4,5,6, and 7
Dependability of the university in handling customer service problems University solves problems once
Ability of university staff to perform services right the first time Services offered free of error
Timeliness of lecturers in coming to class as promised Class start up time
Correct filling of student academic performance records Accessibility of academic records
Completing course in time Course completed as timed
Correct filling of student administrative records Accuracy of administrative records
Responsiveness
Timeliness of university examinations Exam start time and stop time
Appendix 3
Question number
8,9,10,11,12 and
13
Timeliness in publishing examination results Time taken to publish results
Communication from university on developments Customers are informed in good time
Admissions informs customers of university calendar Customer is aware of university calendar
Promptness of front office staff in responding to customer queries Reaction time to customer queries
Willingness of staff to help customers whenever they make an inquiry Attitude towards customer queries
The staff treat customers with courtesy The staff are courteous

153
Assurance
Trust by customers that the university gives quality education Customer confidence in education quality Appendix 3
Question number
14,15,16,17,18,19,
20,21,22 and 23
Confidence of customers with lecturers interaction Customer trust in service provider
Belief by customers that the lecturers respect their opinion Customer perception of their opinion
Safety of the learning environment Customers evaluation of safety of environment
Knowledge of front office staff in answering customer questions Front office staff are well informed
Belief by customers that the lecturers are fair in their evaluations Customer perception of evaluation
Belief by customers that lecturers are approachable and willing to help Availability of lecturers to help customer
Trust by customers that the lecturers display competence in teaching Lecturers know what they teach
Trust by customers that the lecturers have competence in research Lecturers engage in research
Empathy
Availability of lecturers for consultation outside class time Availability of lecturers for consultation Appendix 3
Question number
24,25,26,27, and
28
The university employees have the customers best interest at heart Employees give customers priority
The university employees understand the needs of their customers Employees know what customers want
The offices are opened in time Office open during business hours
University operating time convenient for customers Customers happy with business hours
2. Non-human elements (Independent Variable)
Lecturers utilize modern teaching equipment’s (LCD, CD, Video) LCD, CD, Video, used in actual teaching
The university academic environment is conducive for learning University environment is serene
The university has attractive and conducive lecture halls Lecture halls clean, quiet and organized
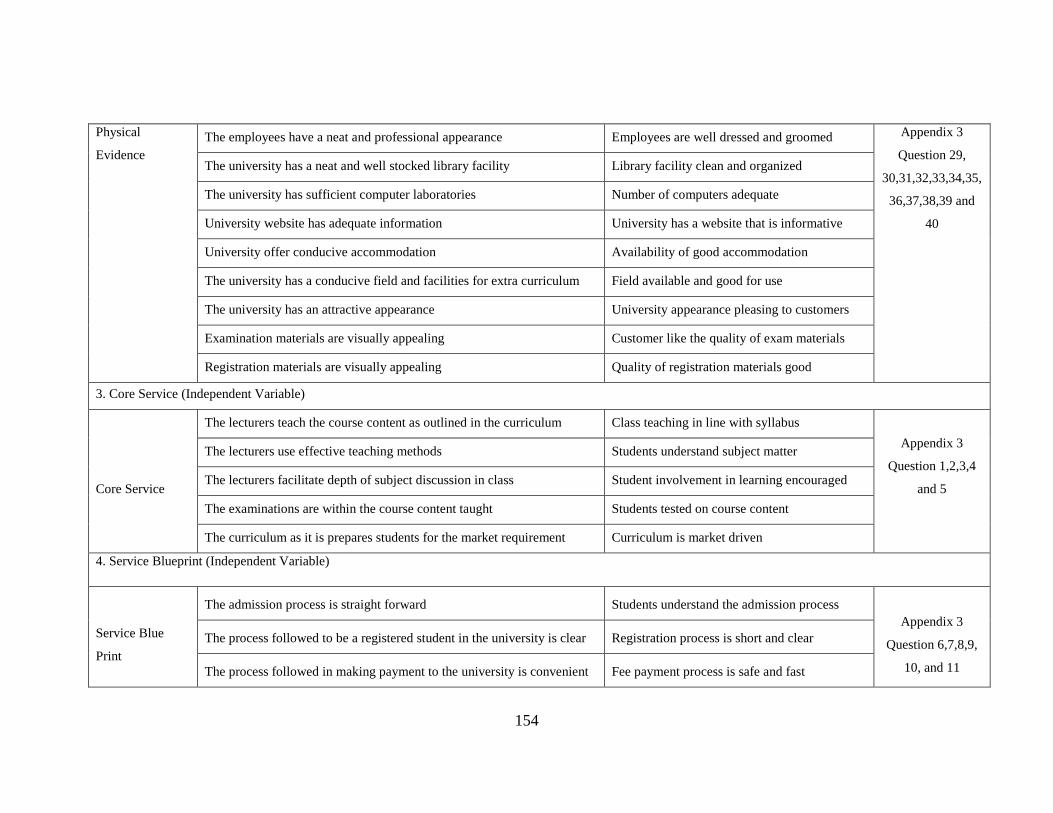
154
Physical
Evidence
The employees have a neat and professional appearance Employees are well dressed and groomed Appendix 3
Question 29,
30,31,32,33,34,35,
36,37,38,39 and
40
The university has a neat and well stocked library facility Library facility clean and organized
The university has sufficient computer laboratories Number of computers adequate
University website has adequate information University has a website that is informative
University offer conducive accommodation Availability of good accommodation
The university has a conducive field and facilities for extra curriculum Field available and good for use
The university has an attractive appearance University appearance pleasing to customers
Examination materials are visually appealing Customer like the quality of exam materials
Registration materials are visually appealing Quality of registration materials good
3. Core Service (Independent Variable)
Core Service
The lecturers teach the course content as outlined in the curriculum Class teaching in line with syllabus
Appendix 3
Question 1,2,3,4
and 5
The lecturers use effective teaching methods Students understand subject matter
The lecturers facilitate depth of subject discussion in class Student involvement in learning encouraged
The examinations are within the course content taught Students tested on course content
The curriculum as it is prepares students for the market requirement Curriculum is market driven
4. Service Blueprint (Independent Variable)
Service Blue
The admission process is straight forward Students understand the admission process
Appendix 3
Question 6,7,8,9,
10, and 11
The process followed to be a registered student in the university is clear Registration process is short and clear
The process followed in making payment to the university is convenient Fee payment process is safe and fast
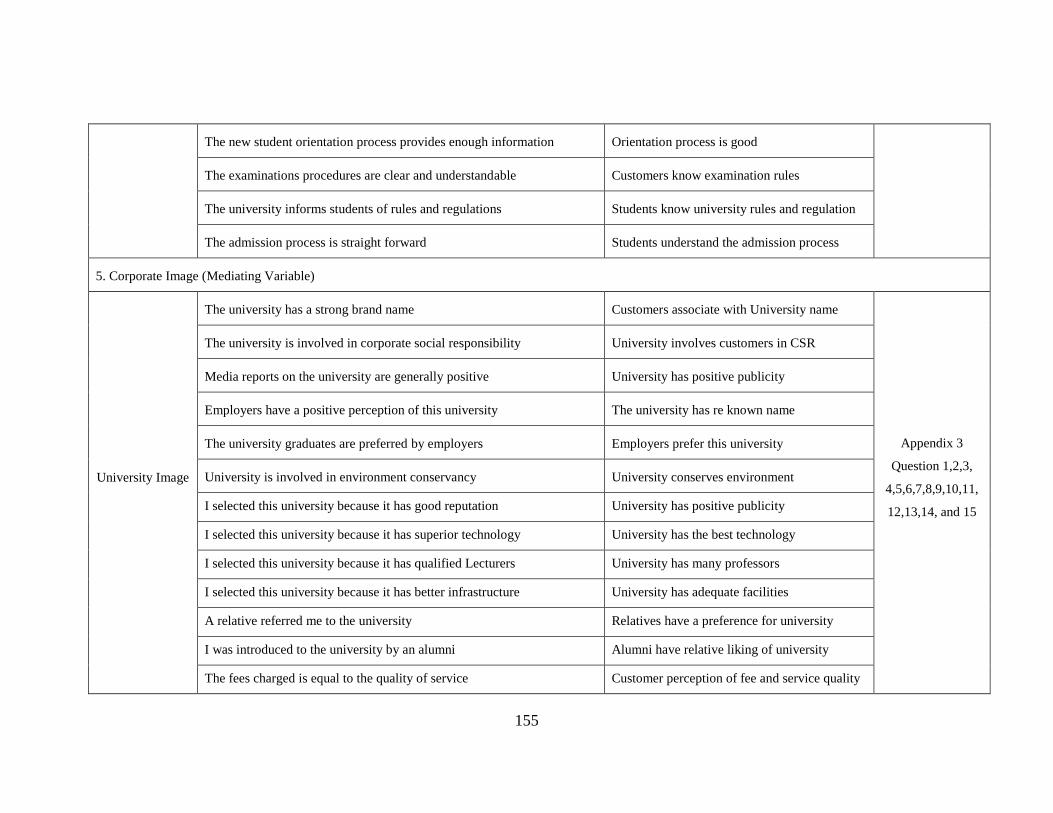
155
The new student orientation process provides enough information Orientation process is good
The examinations procedures are clear and understandable Customers know examination rules
The university informs students of rules and regulations Students know university rules and regulation
The admission process is straight forward Students understand the admission process
5. Corporate Image (Mediating Variable)
University Image
The university has a strong brand name Customers associate with University name
Appendix 3
Question 1,2,3,
4,5,6,7,8,9,10,11,
12,13,14, and 15
The university is involved in corporate social responsibility University involves customers in CSR
Media reports on the university are generally positive University has positive publicity
Employers have a positive perception of this university The university has re known name
The university graduates are preferred by employers Employers prefer this university
University is involved in environment conservancy University conserves environment
I selected this university because it has good reputation University has positive publicity
I selected this university because it has superior technology University has the best technology
I selected this university because it has qualified Lecturers University has many professors
I selected this university because it has better infrastructure University has adequate facilities
A relative referred me to the university Relatives have a preference for university
I was introduced to the university by an alumni Alumni have relative liking of university
The fees charged is equal to the quality of service Customer perception of fee and service quality
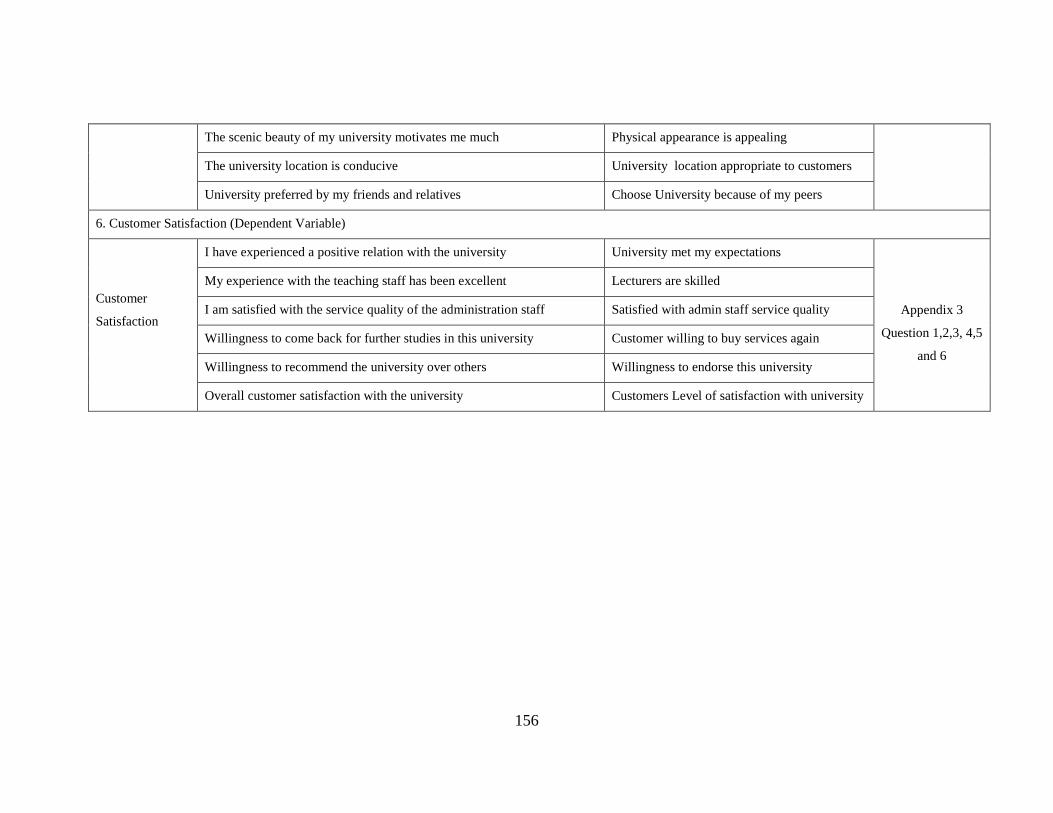
156
The scenic beauty of my university motivates me much Physical appearance is appealing
The university location is conducive University location appropriate to customers
University preferred by my friends and relatives Choose University because of my peers
6. Customer Satisfaction (Dependent Variable)
Customer
Satisfaction
I have experienced a positive relation with the university University met my expectations
Appendix 3
Question 1,2,3, 4,5
and 6
My experience with the teaching staff has been excellent Lecturers are skilled
I am satisfied with the service quality of the administration staff Satisfied with admin staff service quality
Willingness to come back for further studies in this university Customer willing to buy services again
Willingness to recommend the university over others Willingness to endorse this university
Overall customer satisfaction with the university Customers Level of satisfaction with university

157
Appendix 7: Summary of Research Objectives, Hypotheses, Analytical Methods and Interpretation of Results
Objectives Hypotheses Statistical Test Analytical Methods Interpretation
1. Determine the
dimensions of
service quality
that influence
customer
satisfaction.
Factor analysis
KMO Statistics
Bartlett test of
sphericity
Exploratory factor
analysis (EFA)
Reliability test
KMO Statistics
p value
Extraction method:
Principle Component Analysis
(PCA) method
Rotation method:
varimax with Kaiser
Normalization
Cronbach’s alpha (α)
KMO greater than 0.7, sample set adequate for
factor analysis
Value is significant if pless than or equal to
0.05 and the variables in the population
correlation matrix are correlated hence proceed
with factor analysis
Only eigenvalues greater than or equal to 1 to
be used, component with eigenvalues less than
1 should not be used because it accounts for
less than the variations explained by a single
variable. Eigenvalues = 0 implies perfect linear
dependency, that is, an exact collinearity exists
among the explanatory variables
Only components with factor loadings greater
than or equal to 0.4 will be considered to
explain the greatest variations
Factor reliable if α greater than or equal to 0.7
2. Establish the
difference in
service quality
perception in
private
H9: The relationship
between service
quality and
customer
satisfaction in
ANOVA test
Levene’s test of homogeneity
of variances
ANOVA test
Tests whether the variance in scores is the same
for each of the two groups. If the significance
value (Sig.) greater than 0.5, then the
assumption of homogeneity of variance has not
been violated.
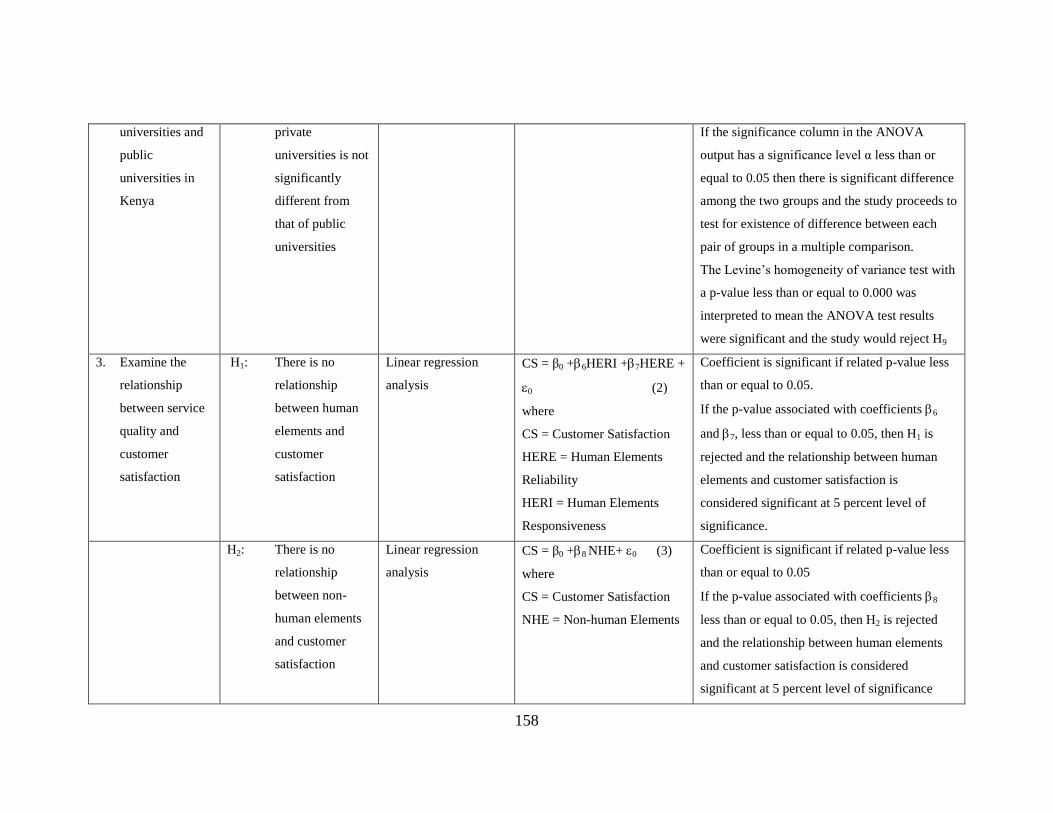
158
universities and
public
universities in
Kenya
private
universities is not
significantly
different from
that of public
universities
If the significance column in the ANOVA
output has a significance level α less than or
equal to 0.05 then there is significant difference
among the two groups and the study proceeds to
test for existence of difference between each
pair of groups in a multiple comparison.
The Levine’s homogeneity of variance test with
a p-value less than or equal to 0.000 was
interpreted to mean the ANOVA test results
were significant and the study would reject H9
3. Examine the
relationship
between service
quality and
customer
satisfaction
H1: There is no
relationship
between human
elements and
customer
satisfaction
Linear regression
analysis
CS = β0 +6HERI +7HERE +
0 (2)
where
CS = Customer Satisfaction
HERE = Human Elements
Reliability
HERI = Human Elements
Responsiveness
Coefficient is significant if related p-value less
than or equal to 0.05.
If the p-value associated with coefficients 6
and 7, less than or equal to 0.05, then H1 is
rejected and the relationship between human
elements and customer satisfaction is
considered significant at 5 percent level of
significance.
H2: There is no
relationship
between non-
human elements
and customer
satisfaction
Linear regression
analysis
CS = β0 +8 NHE+ 0 (3)
where
CS = Customer Satisfaction
NHE = Non-human Elements
Coefficient is significant if related p-value less
than or equal to 0.05
If the p-value associated with coefficients 8
less than or equal to 0.05, then H2 is rejected
and the relationship between human elements
and customer satisfaction is considered
significant at 5 percent level of significance
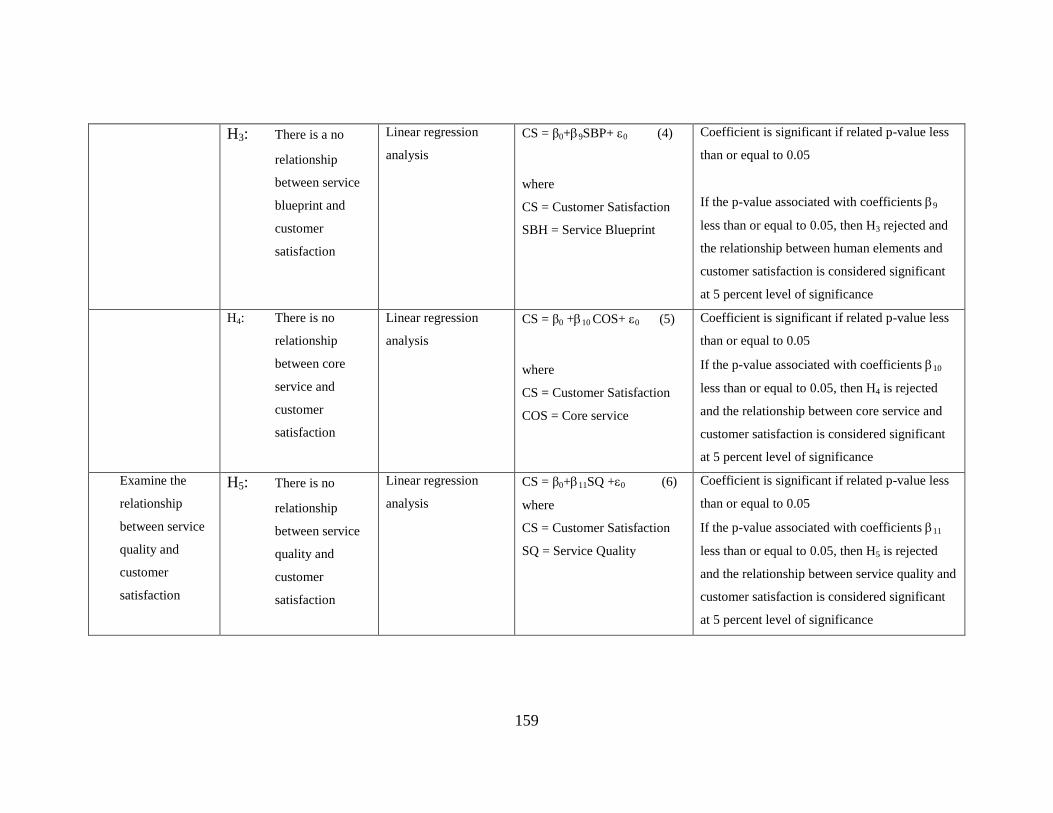
159
H3: There is a no
relationship
between service
blueprint and
customer
satisfaction
Linear regression
analysis
CS = β0+9SBP+ 0 (4)
where
CS = Customer Satisfaction
SBH = Service Blueprint
Coefficient is significant if related p-value less
than or equal to 0.05
If the p-value associated with coefficients 9
less than or equal to 0.05, then H3 rejected and
the relationship between human elements and
customer satisfaction is considered significant
at 5 percent level of significance
H4: There is no
relationship
between core
service and
customer
satisfaction
Linear regression
analysis
CS = β0 +10 COS+ 0 (5)
where
CS = Customer Satisfaction
COS = Core service
Coefficient is significant if related p-value less
than or equal to 0.05
If the p-value associated with coefficients 10
less than or equal to 0.05, then H4 is rejected
and the relationship between core service and
customer satisfaction is considered significant
at 5 percent level of significance
Examine the
relationship
between service
quality and
customer
satisfaction
H5: There is no
relationship
between service
quality and
customer
satisfaction
Linear regression
analysis
CS = β0+11SQ +0 (6)
where
CS = Customer Satisfaction
SQ = Service Quality
Coefficient is significant if related p-value less
than or equal to 0.05
If the p-value associated with coefficients 11
less than or equal to 0.05, then H5 is rejected
and the relationship between service quality and
customer satisfaction is considered significant
at 5 percent level of significance
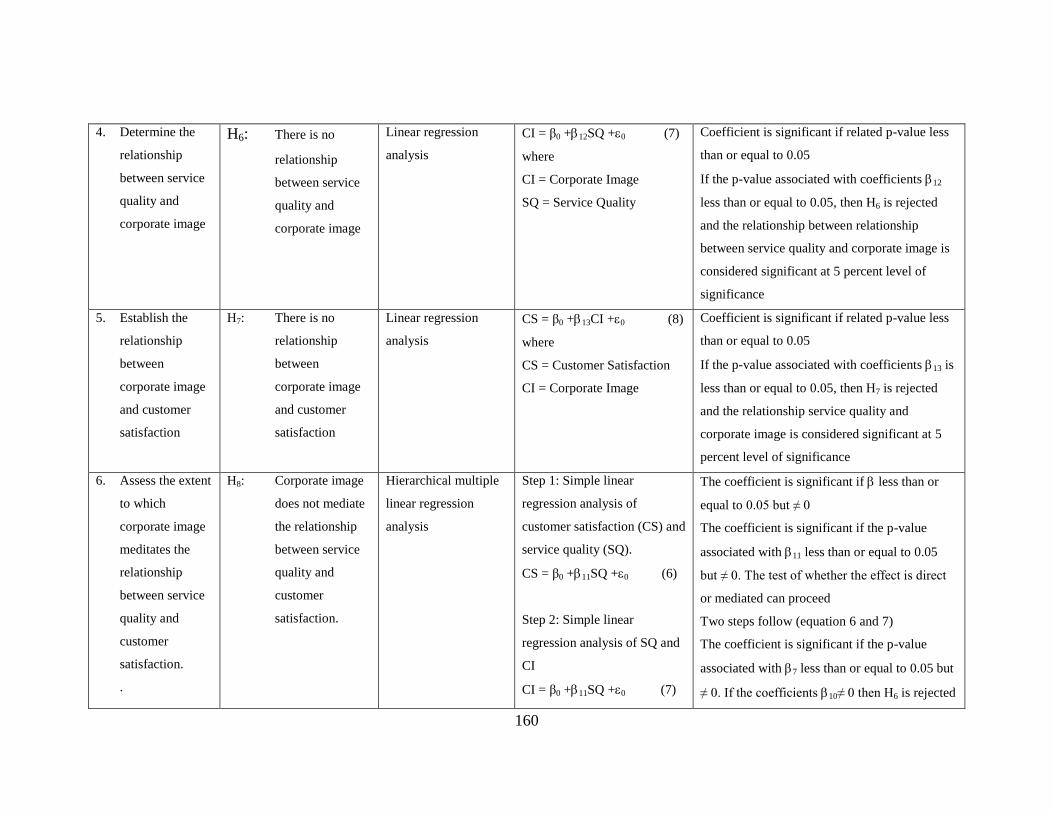
160
4. Determine the
relationship
between service
quality and
corporate image
H6: There is no
relationship
between service
quality and
corporate image
Linear regression
analysis
CI = β0 +12SQ +0 (7)
where
CI = Corporate Image
SQ = Service Quality
Coefficient is significant if related p-value less
than or equal to 0.05
If the p-value associated with coefficients 12
less than or equal to 0.05, then H6 is rejected
and the relationship between relationship
between service quality and corporate image is
considered significant at 5 percent level of
significance
5. Establish the
relationship
between
corporate image
and customer
satisfaction
H7: There is no
relationship
between
corporate image
and customer
satisfaction
Linear regression
analysis
CS = β0 +13CI +0 (8)
where
CS = Customer Satisfaction
CI = Corporate Image
Coefficient is significant if related p-value less
than or equal to 0.05
If the p-value associated with coefficients 13 is
less than or equal to 0.05, then H7 is rejected
and the relationship service quality and
corporate image is considered significant at 5
percent level of significance
6. Assess the extent
to which
corporate image
meditates the
relationship
between service
quality and
customer
satisfaction.
.
H8: Corporate image
does not mediate
the relationship
between service
quality and
customer
satisfaction.
Hierarchical multiple
linear regression
analysis
Step 1: Simple linear
regression analysis of
customer satisfaction (CS) and
service quality (SQ).
CS = β0 +11SQ +0 (6)
Step 2: Simple linear
regression analysis of SQ and
CI
CI = β0 +11SQ +0 (7)
The coefficient is significant if less than or
equal to 0.05 but ≠ 0
The coefficient is significant if the p-value
associated with 11 less than or equal to 0.05
but ≠ 0. The test of whether the effect is direct
or mediated can proceed
Two steps follow (equation 6 and 7)
The coefficient is significant if the p-value
associated with 7 less than or equal to 0.05 but
≠ 0. If the coefficients 10≠ 0 then H6 is rejected
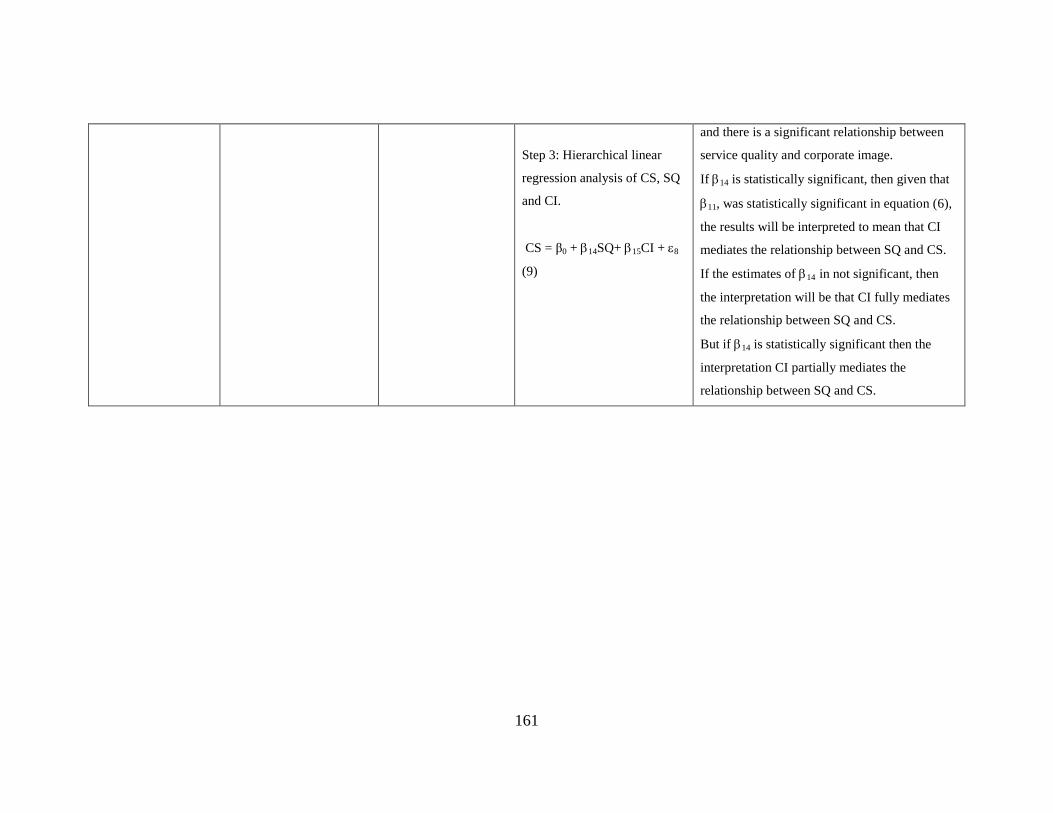
161
Step 3: Hierarchical linear
regression analysis of CS, SQ
and CI.
CS = β0 + 14SQ+ 15CI + 8
(9)
and there is a significant relationship between
service quality and corporate image.
If 14 is statistically significant, then given that
11, was statistically significant in equation (6),
the results will be interpreted to mean that CI
mediates the relationship between SQ and CS.
If the estimates of 14 in not significant, then
the interpretation will be that CI fully mediates
the relationship between SQ and CS.
But if 14 is statistically significant then the
interpretation CI partially mediates the
relationship between SQ and CS.
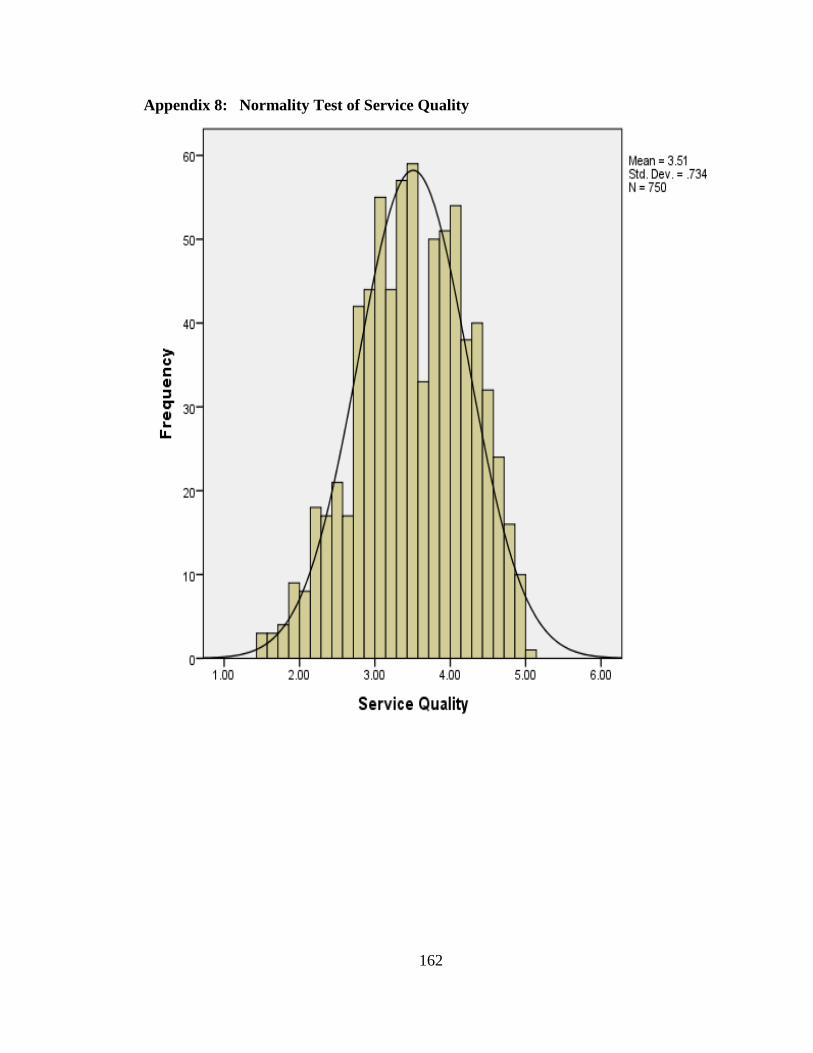
162
Appendix 8: Normality Test of Service Quality
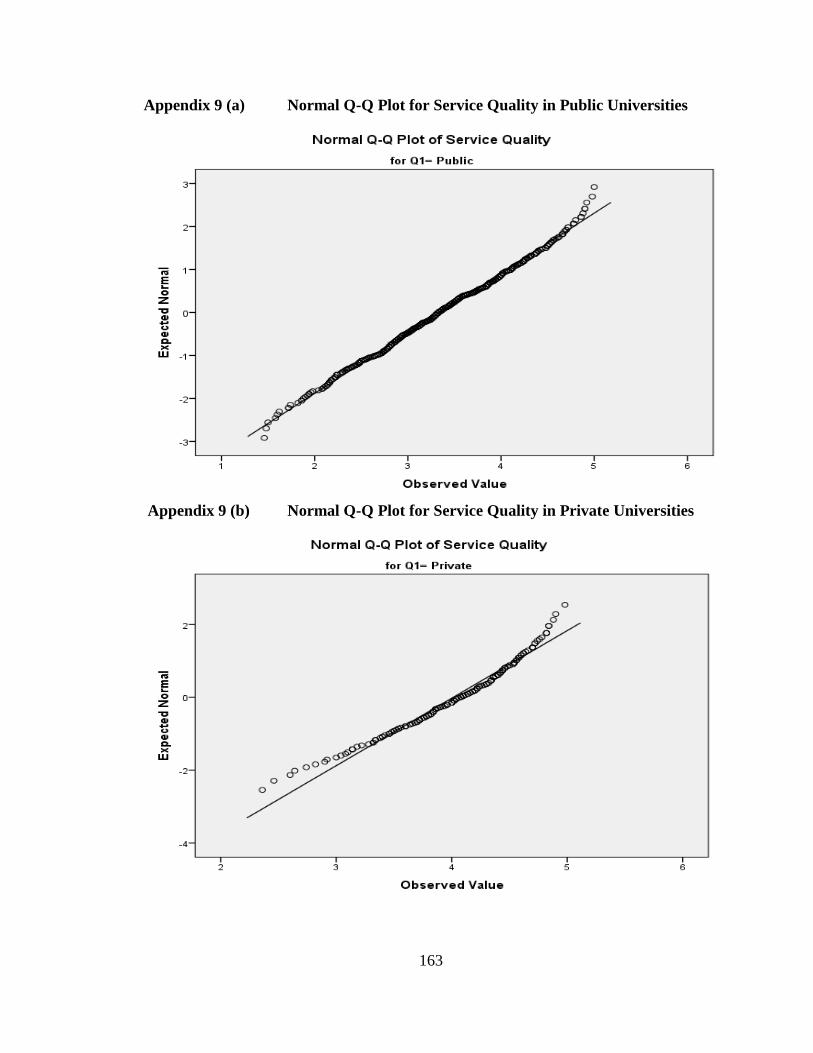
163
Appendix 9 (a) Normal Q-Q Plot for Service Quality in Public Universities
Appendix 9 (b) Normal Q-Q Plot for Service Quality in Private Universities
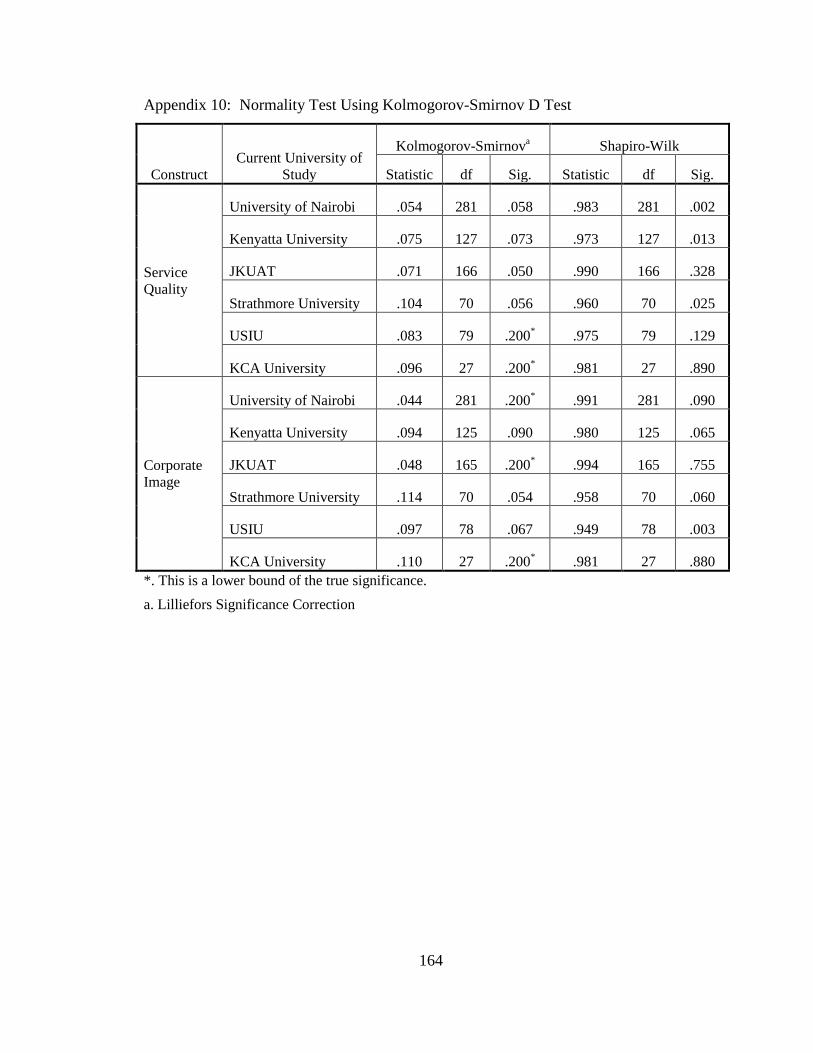
164
Appendix 10: Normality Test Using Kolmogorov-Smirnov D Test
Construct
Current University of
Study
Kolmogorov-Smirnova Shapiro-Wilk
Statistic df Sig. Statistic df Sig.
Service
Quality
University of Nairobi .054 281 .058 .983 281 .002
Kenyatta University .075 127 .073 .973 127 .013
JKUAT .071 166 .050 .990 166 .328
Strathmore University .104 70 .056 .960 70 .025
USIU .083 79 .200* .975 79 .129
KCA University .096 27 .200* .981 27 .890
Corporate
Image
University of Nairobi .044 281 .200* .991 281 .090
Kenyatta University .094 125 .090 .980 125 .065
JKUAT .048 165 .200* .994 165 .755
Strathmore University .114 70 .054 .958 70 .060
USIU .097 78 .067 .949 78 .003
KCA University .110 27 .200* .981 27 .880
*. This is a lower bound of the true significance.
a. Lilliefors Significance Correction

165
Appendix 11: Descriptive Statistics of Entire Data Set
No. Study Variables N Minimum Maximum Mean Std. Deviation
1 University Category 750 1 2 1.24 .428
2 Gender of respondent 750 1 2 1.46 .498
3 Current year of study 750 1 4 2.63 .778
4 Where you get sponsorship 750 1 3 1.66 .629
5 Current university of study 750 1 5 2.49 1.501
6 University provides services as promised 750 1 5 3.34 1.061
7 University is dependable in handling my service problems 750 1 5 3.06 1.099
8 University perform services right the first time 750 1 5 3.01 1.212
9 My lecturers come to class at the promised time 750 1 5 3.36 1.124
10 My academic results have no errors 750 1 5 3.20 1.367
11 I am likely to complete my course in time 750 1 5 4.12 1.100
12 The university registrar’s office maintains error free records 750 1 5 3.27 1.281
13 Our examinations start at the right time 750 1 5 3.90 1.211
14 Our examination results are published at the right time 750 1 5 3.27 1.364
15 The university communicates effectively of any developments 750 1 5 3.18 1.346
16 The admission department informs me of the university calendar 750 1 5 3.28 1.427
17 The university staff are quick at responding to my queries 750 1 5 2.73 1.246
18 The university staff are always willing to help me 750 1 5 2.99 1.235
19 The university staff are always courteous 750 1 5 2.98 1.283
20 I believe the university gives quality education 750 1 5 4.09 .997
21 The conduct of my lectures instill confidence in me 749 1 5 3.81 1.064
22 The lectures have respect for my opinion 749 1 5 3.74 1.108
23 I feel safe in this learning environment 749 1 5 4.04 1.056
24 The front office staff have knowledge to answer my questions 749 1 5 3.44 1.208
25 My lecturers evaluate me correctly 749 1 5 3.48 1.099
26 My lecturers are approachable and willing to help me 749 1 5 3.73 1.052
27 My lecturers display competence in teaching 749 1 5 3.87 .972
28 My lecturers have experience in academic research 749 1 5 3.94 .960
29 My lecturers are available for consultation outside class time 749 1 5 3.35 1.227
30 The university staff have the customers best interest at heart 749 1 5 3.09 1.235
31 The university employees understand the needs of their customer 749 1 5 3.13 1.228
32 The front office staff are punctual in opening the office 749 1 5 3.24 1.305
33 Then university operation time is convenient to me 749 1 5 3.58 1.236
34 The lecturers use modern equipment’s in class(LCD,VIDEO) 749 1 5 3.37 1.447
35 The academic environments is conducive for learning 749 1 5 3.97 1.085
36 The university has attractive and conducive lecture halls 749 1 5 3.67 1.308
37 The employees have neat and professional appearance 749 1 5 3.79 1.105
38 The university has a neat and well stocked library facility 749 1 5 3.79 1.272
39 The university has sufficient computers 749 1 5 3.15 1.410
40 The website of my university is informative 749 1 5 3.54 1.253
41 The university has conducive accommodation facilities 749 1 5 2.64 1.325
42 The university has conducive facilities for extra curriculum 749 1 5 3.21 1.231
43 The scenic beauty of my university motivates me much 749 1 5 3.62 1.250
44 The examination materials are visually appealing 749 1 5 3.55 1.204
45 The registration material are visually appealing 749 1 5 3.47 1.206
46 The course content is taught as outlined in the curriculum 749 1 5 3.74 1.026
47 The lecturers use effective teaching methods 749 1 5 3.65 .966
48 The lecturer facilitate depth of subject discussion in class 749 1 5 3.47 1.019
49 The examination is within the course content taught 749 1 5 3.80 1.053
50 The curriculum prepares me adequately for the market 749 1 5 3.74 1.065
51 The process followed to get admission to the university is clear 749 1 5 3.96 1.053
52 The process followed to register as a student’s is adequate 749 1 5 3.85 1.121
53 The process of making payment to the university is convenient 749 1 5 3.60 1.407
54 The new student orientation process is informative 749 1 5 3.49 1.237
55 I am well informed of the examination procedures 749 1 5 4.00 1.050
56 I am well informed of the university rules and regulation 749 1 5 3.98 1.081
57 I selected this university because it has a strong brand name 746 1 5 3.93 1.240
58 This university makes a lot of contribution to the society 746 1 5 3.75 1.139
59 Media reports on the university are generally positive 744 1 5 3.59 1.130
60 Employers have a positive perception towards this university 745 1 5 3.81 1.039
61 The university conserves the environment 745 1 5 4.03 1.010
62 I choose this university because it has good reputation 745 1 5 4.03 .989
63 I selected this university because it has superior technology 745 1 5 3.61 1.240
64 I selected this university because it has qualified lecturers 745 1 5 3.89 1.024
65 I selected this university because it has better infrastructure 745 1 5 3.59 1.299
66 A relative referred me to the university 745 1 5 2.53 1.639
67 I was introduced to the university by an alumni 745 1 5 2.13 1.527
68 The university fee is equal to the quality of service i receive 745 1 5 2.88 1.386
69 The university appearance is attractive to me 745 1 5 3.66 1.230
70 The university location is conducive to me 745 1 5 3.81 1.222
71 This university is preferred by my peers (friends, relatives) 745 1 5 3.68 1.303
72 I have experienced a positive relation with the university 744 1 5 3.60 1.075
73 My experience with the teaching staff was excellent 744 1 5 3.50 1.058
74 I am satisfied with the service quality of the administration staff 744 1 5 3.23 1.200
75 I am willing to come back for the further studies in his university 744 1 5 3.46 1.384
76 I am willing to recommend this university to someone else 744 1 5 3.86 1.223
77 Overall , i am satisfied by this university 744 1 5 3.82 1.113
Valid N (listwise) 743
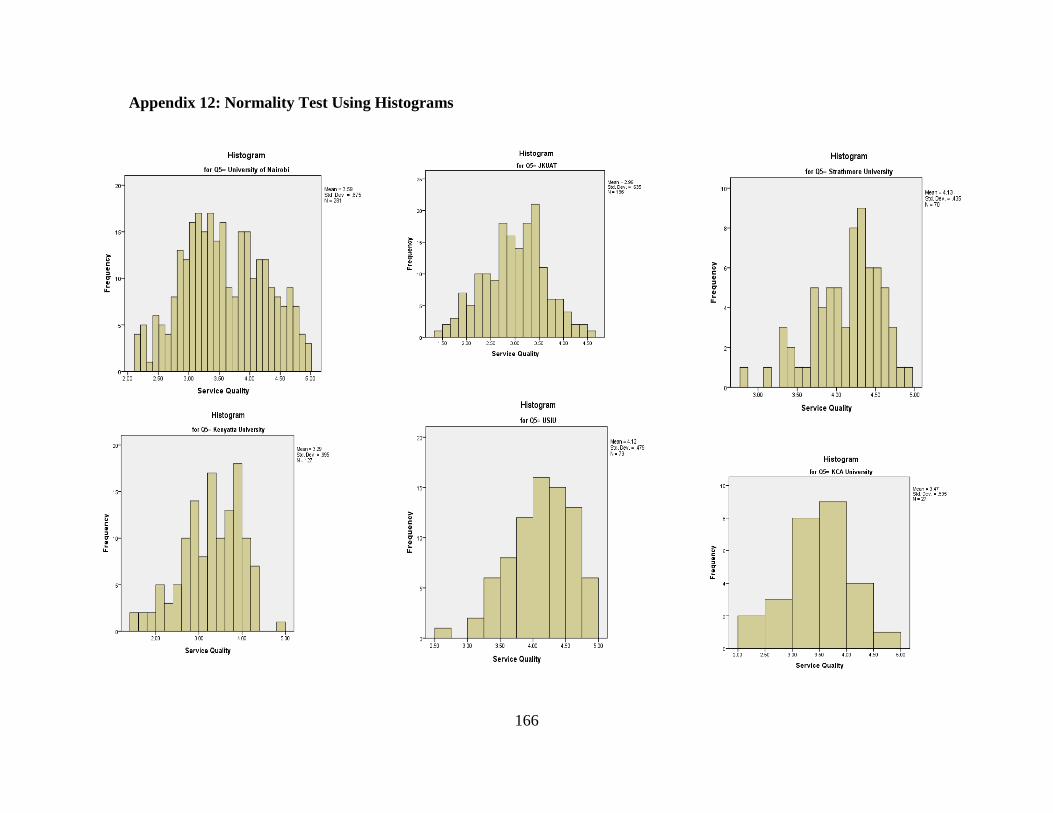
166
Appendix 12: Normality Test Using Histograms
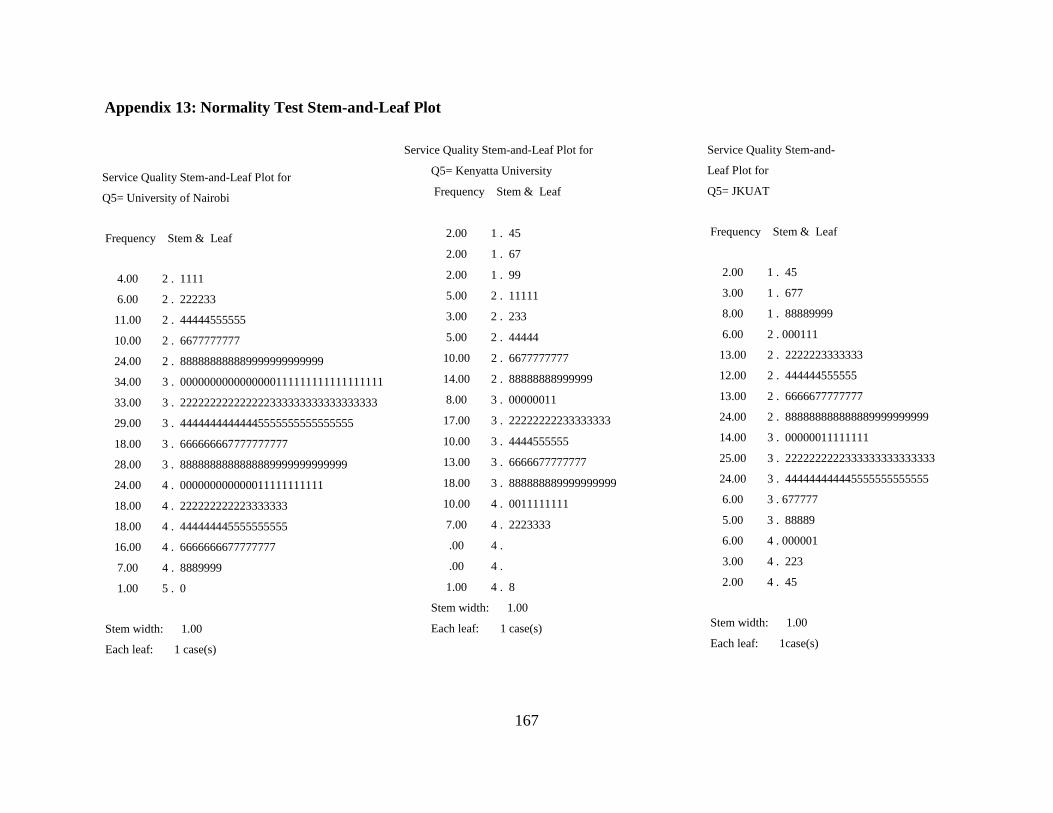
167
Service Quality Stem-and-Leaf Plot for
Q5= Kenyatta University
Frequency Stem & Leaf
2.00 1 . 45
2.00 1 . 67
2.00 1 . 99
5.00 2 . 11111
3.00 2 . 233
5.00 2 . 44444
10.00 2 . 6677777777
14.00 2 . 88888888999999
8.00 3 . 00000011
17.00 3 . 22222222233333333
10.00 3 . 4444555555
13.00 3 . 6666677777777
18.00 3 . 888888889999999999
10.00 4 . 0011111111
7.00 4 . 2223333
.00 4 .
.00 4 .
1.00 4 . 8
Stem width: 1.00
Each leaf: 1 case(s)
Service Quality Stem-and-
Leaf Plot for
Q5= JKUAT
Frequency Stem & Leaf
2.00 1 . 45
3.00 1 . 677
8.00 1 . 88889999
6.00 2 . 000111
13.00 2 . 2222223333333
12.00 2 . 444444555555
13.00 2 . 6666677777777
24.00 2 . 888888888888889999999999
14.00 3 . 00000011111111
25.00 3 . 2222222222333333333333333
24.00 3 . 444444444445555555555555
6.00 3 . 677777
5.00 3 . 88889
6.00 4 . 000001
3.00 4 . 223
2.00 4 . 45
Stem width: 1.00
Each leaf: 1case(s)
Service Quality Stem-and-Leaf Plot for
Q5= University of Nairobi
Frequency Stem & Leaf
4.00 2 . 1111
6.00 2 . 222233
11.00 2 . 44444555555
10.00 2 . 6677777777
24.00 2 . 888888888889999999999999
34.00 3 . 0000000000000000111111111111111111
33.00 3 . 222222222222222333333333333333333
29.00 3 . 44444444444445555555555555555
18.00 3 . 666666667777777777
28.00 3 . 8888888888888889999999999999
24.00 4 . 000000000000011111111111
18.00 4 . 222222222223333333
18.00 4 . 444444445555555555
16.00 4 . 6666666677777777
7.00 4 . 8889999
1.00 5 . 0
Stem width: 1.00
Each leaf: 1 case(s)
Appendix 13: Normality Test Stem-and-Leaf Plot
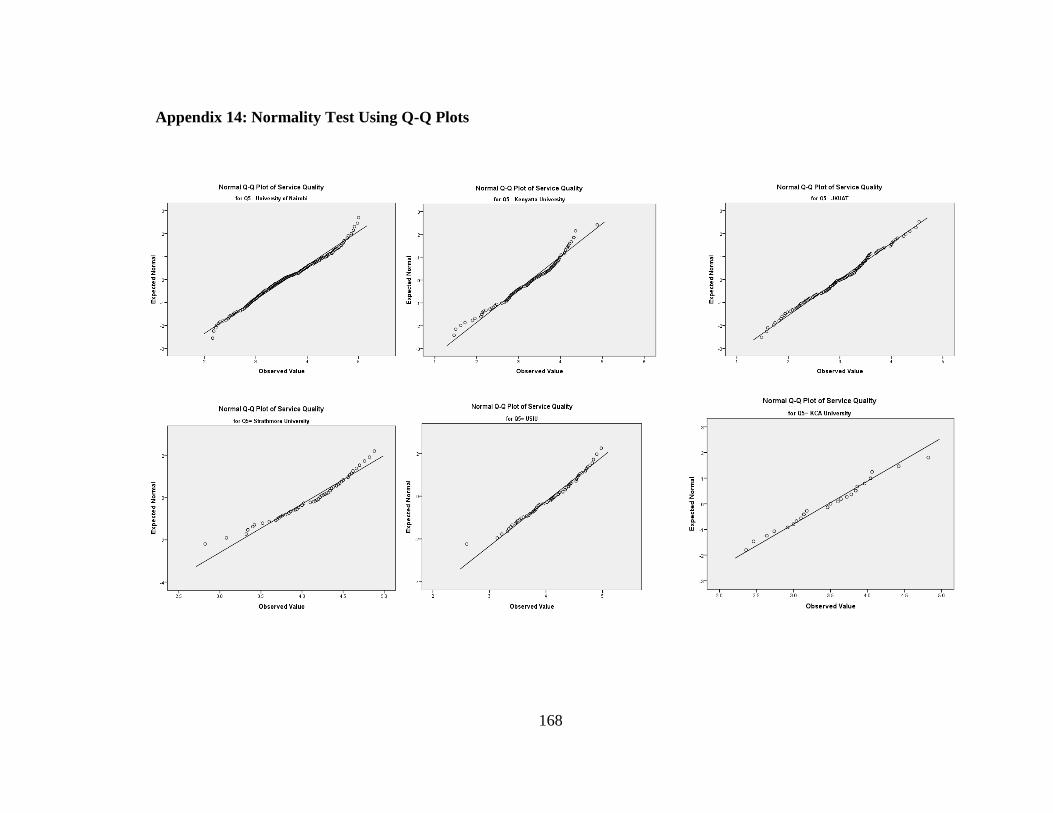
168
Appendix 14: Normality Test Using Q-Q Plots
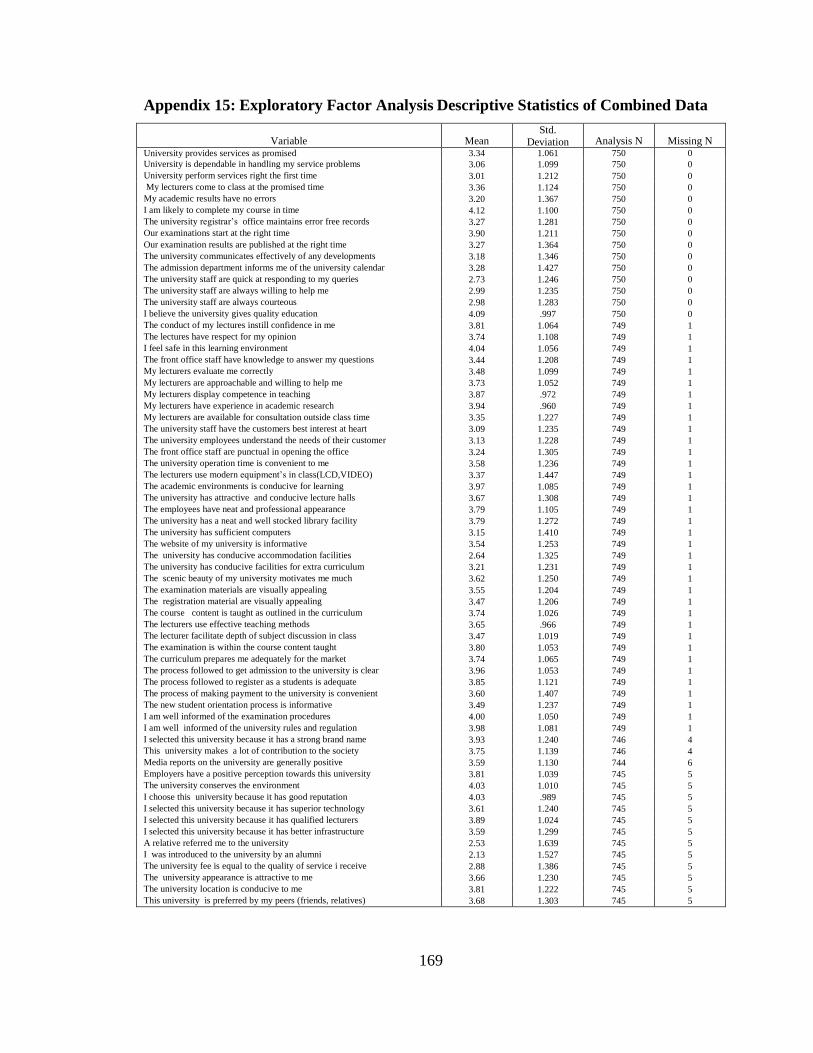
169
Appendix 15: Exploratory Factor Analysis Descriptive Statistics of Combined Data
Variable Mean Std.
Deviation Analysis N Missing N University provides services as promised 3.34 1.061 750 0
University is dependable in handling my service problems 3.06 1.099 750 0
University perform services right the first time 3.01 1.212 750 0
My lecturers come to class at the promised time 3.36 1.124 750 0
My academic results have no errors 3.20 1.367 750 0
I am likely to complete my course in time 4.12 1.100 750 0
The university registrar’s office maintains error free records 3.27 1.281 750 0
Our examinations start at the right time 3.90 1.211 750 0
Our examination results are published at the right time 3.27 1.364 750 0
The university communicates effectively of any developments 3.18 1.346 750 0
The admission department informs me of the university calendar 3.28 1.427 750 0
The university staff are quick at responding to my queries 2.73 1.246 750 0
The university staff are always willing to help me 2.99 1.235 750 0
The university staff are always courteous 2.98 1.283 750 0
I believe the university gives quality education 4.09 .997 750 0
The conduct of my lectures instill confidence in me 3.81 1.064 749 1
The lectures have respect for my opinion 3.74 1.108 749 1
I feel safe in this learning environment 4.04 1.056 749 1
The front office staff have knowledge to answer my questions 3.44 1.208 749 1
My lecturers evaluate me correctly 3.48 1.099 749 1
My lecturers are approachable and willing to help me 3.73 1.052 749 1
My lecturers display competence in teaching 3.87 .972 749 1
My lecturers have experience in academic research 3.94 .960 749 1
My lecturers are available for consultation outside class time 3.35 1.227 749 1
The university staff have the customers best interest at heart 3.09 1.235 749 1
The university employees understand the needs of their customer 3.13 1.228 749 1
The front office staff are punctual in opening the office 3.24 1.305 749 1
The university operation time is convenient to me 3.58 1.236 749 1
The lecturers use modern equipment’s in class(LCD,VIDEO) 3.37 1.447 749 1
The academic environments is conducive for learning 3.97 1.085 749 1
The university has attractive and conducive lecture halls 3.67 1.308 749 1
The employees have neat and professional appearance 3.79 1.105 749 1
The university has a neat and well stocked library facility 3.79 1.272 749 1
The university has sufficient computers 3.15 1.410 749 1
The website of my university is informative 3.54 1.253 749 1
The university has conducive accommodation facilities 2.64 1.325 749 1
The university has conducive facilities for extra curriculum 3.21 1.231 749 1
The scenic beauty of my university motivates me much 3.62 1.250 749 1
The examination materials are visually appealing 3.55 1.204 749 1
The registration material are visually appealing 3.47 1.206 749 1
The course content is taught as outlined in the curriculum 3.74 1.026 749 1
The lecturers use effective teaching methods 3.65 .966 749 1
The lecturer facilitate depth of subject discussion in class 3.47 1.019 749 1
The examination is within the course content taught 3.80 1.053 749 1
The curriculum prepares me adequately for the market 3.74 1.065 749 1
The process followed to get admission to the university is clear 3.96 1.053 749 1
The process followed to register as a students is adequate 3.85 1.121 749 1
The process of making payment to the university is convenient 3.60 1.407 749 1
The new student orientation process is informative 3.49 1.237 749 1
I am well informed of the examination procedures 4.00 1.050 749 1
I am well informed of the university rules and regulation 3.98 1.081 749 1
I selected this university because it has a strong brand name 3.93 1.240 746 4
This university makes a lot of contribution to the society 3.75 1.139 746 4
Media reports on the university are generally positive 3.59 1.130 744 6
Employers have a positive perception towards this university 3.81 1.039 745 5
The university conserves the environment 4.03 1.010 745 5
I choose this university because it has good reputation 4.03 .989 745 5
I selected this university because it has superior technology 3.61 1.240 745 5
I selected this university because it has qualified lecturers 3.89 1.024 745 5
I selected this university because it has better infrastructure 3.59 1.299 745 5
A relative referred me to the university 2.53 1.639 745 5
I was introduced to the university by an alumni 2.13 1.527 745 5
The university fee is equal to the quality of service i receive 2.88 1.386 745 5
The university appearance is attractive to me 3.66 1.230 745 5
The university location is conducive to me 3.81 1.222 745 5
This university is preferred by my peers (friends, relatives) 3.68 1.303 745 5

170
Appendix 16: Unrotated Component Matrix of Combined Data
Variable Component
1 2 3 4 5 6 7 8 9 10 11 The lecturers use effective teaching methods 0.727
The lecturer facilitate depth of subject discussion in class 0.722
The university staff have the customers best interest at heart 0.711
The curriculum prepares me adequately for the market 0.696
University provides services as promised 0.684
The university employees understand the needs of their customer 0.679
The lecturers use modern equipment’s in class(LCD,VIDEO) 0.677
The academic environments is conducive for learning 0.676
The university staff are quick at responding to my queries 0.673
The employees have neat and professional appearance 0.669
The lectures have respect for my opinion 0.669
The conduct of my lectures instill confidence in me 0.664
My lecturers display competence in teaching 0.662
I feel safe in this learning environment 0.656
The website of my university is informative 0.653
The university has attractive and conducive lecture halls 0.653
The front office staff have knowledge to answer my questions 0.652
I selected this university because it has superior technology 0.646
The registration material are visually appealing 0.644
I selected this university because it has qualified lecturers 0.644
The university staff are always courteous 0.643
My lecturers evaluates me correctly 0.642
The university staff are always willing to help me 0.642
My lecturers are approachable and willing to help me 0.640
The university fee is equal to the quality of service i receive 0.639
The university operation time is convenient to me 0.638
The new student orientation process is informative 0.635
The course content is taught as outlined in the curriculum 0.633
The examination is within the course content taught 0.628
University is dependable in handling my service problems 0.626
I believe the university gives quality education 0.625
The process followed to register as a student's is adequate 0.621
The front office staff are punctual in opening the office 0.616
The examination materials are visually appealing 0.614
My lecturers are available for consultation outside class time 0.608
The university communicates effectively of any developments 0.606
The process followed to get admission to the university is clear 0.604
The university has sufficient computers 0.602
The university appearance is attractive to me 0.599
I am well informed of the examination procedures 0.588
My lecturers have experience in academic research 0.588
The admission department informs me of the university calendar 0.582
The university has conducive facilities for extra curriculum 0.581
The process of making payment to the university is convenient 0.579
I selected this university because it has better infrastructure 0.574
The university conserves the environment 0.574
This university makes a lot of contribution to the society 0.571
University perform services right the first time 0.569
The university has a neat and well stocked library facility 0.567
The scenic beauty of my university motivates me much 0.565 0.450
Employers have a positive perception towards this university 0.564
My lecturers come to class at the promised time 0.553
The university registrar's office maintains error free records 0.548
I choose this university because it has good reputation 0.540
Our examinations start at the right time 0.514
The university has conducive accommodation facilities 0.507
I am well informed of the university rules and regulation 0.503
Our examination results are published at the right time 0.479 0.402
The university location is conducive to me 0.460
Media reports on the university are generally positive 0.452
My academic results have no errors 0.423
This university is preferred by my peers (friends and relatives) 0.413
I selected this university because it has a strong brand name
I am likely to complete my course in time
I was introduced to the university by an alumni
A relative referred me to the university 0.421
Extraction Method: Principal Component Analysis.
a. 11 components extracted.
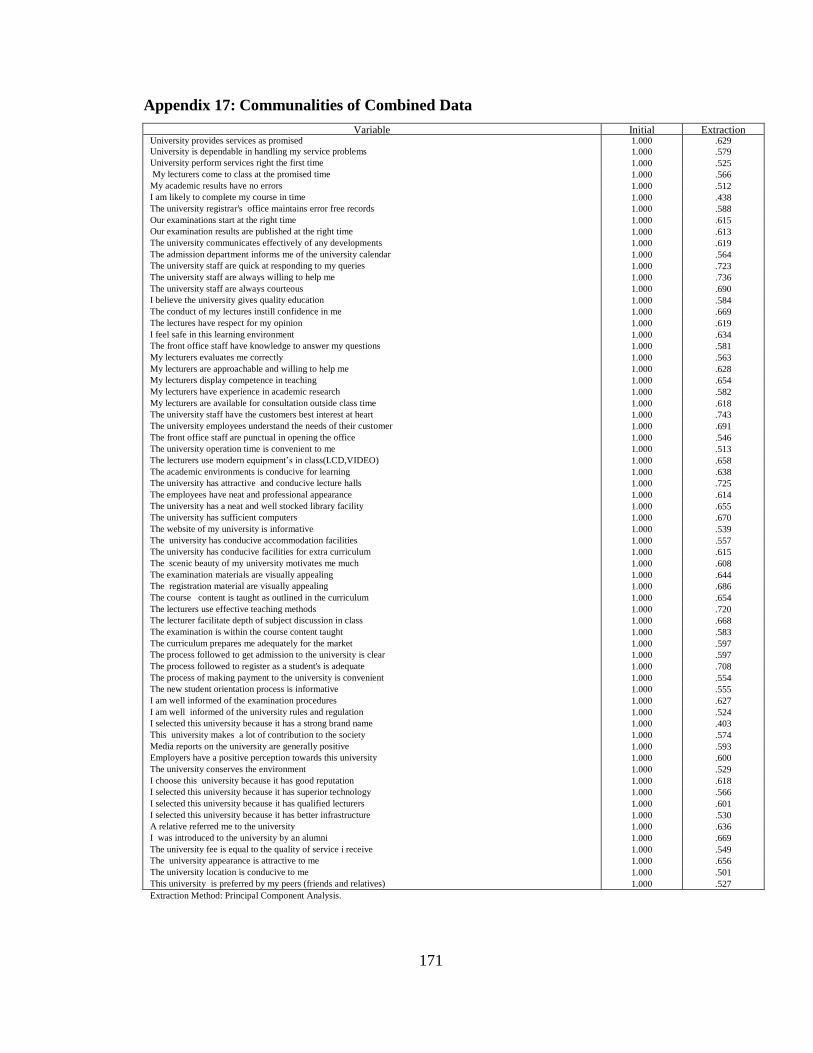
171
Appendix 17: Communalities of Combined Data
Variable Initial Extraction University provides services as promised 1.000 .629
University is dependable in handling my service problems 1.000 .579
University perform services right the first time 1.000 .525
My lecturers come to class at the promised time 1.000 .566
My academic results have no errors 1.000 .512
I am likely to complete my course in time 1.000 .438
The university registrar's office maintains error free records 1.000 .588
Our examinations start at the right time 1.000 .615
Our examination results are published at the right time 1.000 .613
The university communicates effectively of any developments 1.000 .619
The admission department informs me of the university calendar 1.000 .564
The university staff are quick at responding to my queries 1.000 .723
The university staff are always willing to help me 1.000 .736
The university staff are always courteous 1.000 .690
I believe the university gives quality education 1.000 .584
The conduct of my lectures instill confidence in me 1.000 .669
The lectures have respect for my opinion 1.000 .619
I feel safe in this learning environment 1.000 .634
The front office staff have knowledge to answer my questions 1.000 .581
My lecturers evaluates me correctly 1.000 .563
My lecturers are approachable and willing to help me 1.000 .628
My lecturers display competence in teaching 1.000 .654
My lecturers have experience in academic research 1.000 .582
My lecturers are available for consultation outside class time 1.000 .618
The university staff have the customers best interest at heart 1.000 .743
The university employees understand the needs of their customer 1.000 .691
The front office staff are punctual in opening the office 1.000 .546
The university operation time is convenient to me 1.000 .513
The lecturers use modern equipment’s in class(LCD,VIDEO) 1.000 .658
The academic environments is conducive for learning 1.000 .638
The university has attractive and conducive lecture halls 1.000 .725
The employees have neat and professional appearance 1.000 .614
The university has a neat and well stocked library facility 1.000 .655
The university has sufficient computers 1.000 .670
The website of my university is informative 1.000 .539
The university has conducive accommodation facilities 1.000 .557
The university has conducive facilities for extra curriculum 1.000 .615
The scenic beauty of my university motivates me much 1.000 .608
The examination materials are visually appealing 1.000 .644
The registration material are visually appealing 1.000 .686
The course content is taught as outlined in the curriculum 1.000 .654
The lecturers use effective teaching methods 1.000 .720
The lecturer facilitate depth of subject discussion in class 1.000 .668
The examination is within the course content taught 1.000 .583
The curriculum prepares me adequately for the market 1.000 .597
The process followed to get admission to the university is clear 1.000 .597
The process followed to register as a student's is adequate 1.000 .708
The process of making payment to the university is convenient 1.000 .554
The new student orientation process is informative 1.000 .555
I am well informed of the examination procedures 1.000 .627
I am well informed of the university rules and regulation 1.000 .524
I selected this university because it has a strong brand name 1.000 .403
This university makes a lot of contribution to the society 1.000 .574
Media reports on the university are generally positive 1.000 .593
Employers have a positive perception towards this university 1.000 .600
The university conserves the environment 1.000 .529
I choose this university because it has good reputation 1.000 .618
I selected this university because it has superior technology 1.000 .566
I selected this university because it has qualified lecturers 1.000 .601
I selected this university because it has better infrastructure 1.000 .530
A relative referred me to the university 1.000 .636
I was introduced to the university by an alumni 1.000 .669
The university fee is equal to the quality of service i receive 1.000 .549
The university appearance is attractive to me 1.000 .656
The university location is conducive to me 1.000 .501
This university is preferred by my peers (friends and relatives) 1.000 .527
Extraction Method: Principal Component Analysis.

172
Appendix 18: Unrotated Component Matrix of Private University Data
Component
1 2 3 4 5 6 7 8 9 10 11 12 13 14 15 16
The curriculum prepares me adequately for the market .728 The lecturer facilitate depth of subject discussion in class .714
This university makes a lot of contribution to the society .689
The university fee is equal to the quality of service i receive .675
The university staff have the customers best interest at heart .672
The new student orientation process is informative .672
The university conserves the environment .667
The lectures have respect for my opinion .658
The front office staff have knowledge to answer my
questions
.655
The examination is within the course content taught .642
The university appearance is attractive to me .641
The website of my university is informative .635
The university employees understand the needs of their
customer
.633
My lecturers evaluates me correctly .632
The registration material are visually appealing .629
The course content is taught as outlined in the curriculum .624
The scenic beauty of my university motivates me much .604 -
.504
University provides services as promised .603
The university has sufficient computers .602
I am well informed of the examination procedures .601
I selected this university because it has qualified lecturers .597
The university has attractive and conducive lecture halls .595
My lecturers are available for consultation outside class
time
.593
I am well informed of the university rules and regulation .591
The lecturers use effective teaching methods .588
My lecturers have experience in academic research .587
The process followed to get admission to the university is
clear
.586
I feel safe in this learning environment .578
The university staff are always willing to help me .573
The process of making payment to the university is
convenient
.569
I selected this university because it has superior technology .567
The employees have neat and professional appearance .567
The examination materials are visually appealing .566
The process followed to register as a student's is adequate .564
I choose this university because it has good reputation .564 -.463
My lecturers display competence in teaching .561
This university is preferred by my peers (friends and
relatives)
.560
The university staff are always courteous .554
My lecturers are approachable and willing to help me .552
The university has conducive facilities for extra curriculum .546
The academic environments is conducive for learning .543
The university staff are quick at responding to my queries .539
Employers have a positive perception towards this
university
.534 -.437
I believe the university gives quality education .532
I selected this university because it has a strong brand name .516
University perform services right the first time .511 -
.4
11
The university communicates effectively of any
developments
.509
Our examination results are published at the right time .507
The conduct of my lectures instill confidence in me .507
The university registrar's office maintains error free records .497
My lecturers come to class at the promised time .483
I selected this university because it has better infrastructure .479
The front office staff are punctual in opening the office .468
The admission department informs me of the university
calendar
.468
Our examinations start at the right time .455
Media reports on the university are generally positive .455
The university operation time is convenient to me .449
University is dependable in handling my service problems .435
The lecturers use modern equipment’s in
class(LCD,VIDEO)
.410
I am likely to complete my course in time
The university has conducive accommodation facilities .537
I was introduced to the university by an alumni .434
The university has a neat and well stocked library facility .466 .533
The university location is conducive to me -.434
My academic results have no errors .50
7
A relative referred me to the university .42
0
Extraction Method: Principal Component Analysis.
a. 16 components extracted.
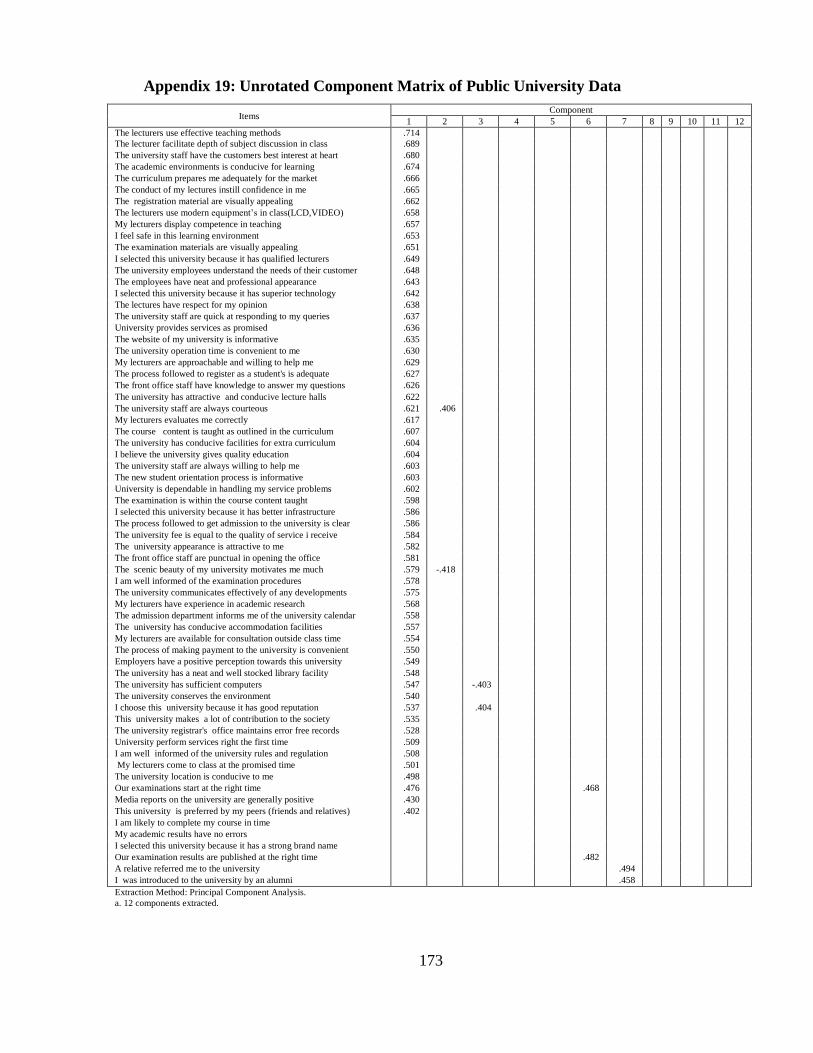
173
Appendix 19: Unrotated Component Matrix of Public University Data
Items Component
1 2 3 4 5 6 7 8 9 10 11 12
The lecturers use effective teaching methods .714
The lecturer facilitate depth of subject discussion in class .689
The university staff have the customers best interest at heart .680
The academic environments is conducive for learning .674
The curriculum prepares me adequately for the market .666
The conduct of my lectures instill confidence in me .665
The registration material are visually appealing .662
The lecturers use modern equipment’s in class(LCD,VIDEO) .658
My lecturers display competence in teaching .657
I feel safe in this learning environment .653
The examination materials are visually appealing .651
I selected this university because it has qualified lecturers .649
The university employees understand the needs of their customer .648
The employees have neat and professional appearance .643
I selected this university because it has superior technology .642
The lectures have respect for my opinion .638
The university staff are quick at responding to my queries .637
University provides services as promised .636
The website of my university is informative .635
The university operation time is convenient to me .630
My lecturers are approachable and willing to help me .629
The process followed to register as a student's is adequate .627
The front office staff have knowledge to answer my questions .626
The university has attractive and conducive lecture halls .622
The university staff are always courteous .621 .406
My lecturers evaluates me correctly .617
The course content is taught as outlined in the curriculum .607
The university has conducive facilities for extra curriculum .604
I believe the university gives quality education .604
The university staff are always willing to help me .603
The new student orientation process is informative .603
University is dependable in handling my service problems .602
The examination is within the course content taught .598
I selected this university because it has better infrastructure .586
The process followed to get admission to the university is clear .586
The university fee is equal to the quality of service i receive .584
The university appearance is attractive to me .582
The front office staff are punctual in opening the office .581
The scenic beauty of my university motivates me much .579 -.418
I am well informed of the examination procedures .578
The university communicates effectively of any developments .575
My lecturers have experience in academic research .568
The admission department informs me of the university calendar .558
The university has conducive accommodation facilities .557
My lecturers are available for consultation outside class time .554
The process of making payment to the university is convenient .550
Employers have a positive perception towards this university .549
The university has a neat and well stocked library facility .548
The university has sufficient computers .547 -.403
The university conserves the environment .540
I choose this university because it has good reputation .537 .404
This university makes a lot of contribution to the society .535
The university registrar's office maintains error free records .528
University perform services right the first time .509
I am well informed of the university rules and regulation .508
My lecturers come to class at the promised time .501
The university location is conducive to me .498
Our examinations start at the right time .476 .468
Media reports on the university are generally positive .430
This university is preferred by my peers (friends and relatives) .402
I am likely to complete my course in time
My academic results have no errors
I selected this university because it has a strong brand name
Our examination results are published at the right time .482
A relative referred me to the university .494
I was introduced to the university by an alumni .458
Extraction Method: Principal Component Analysis.
a. 12 components extracted.
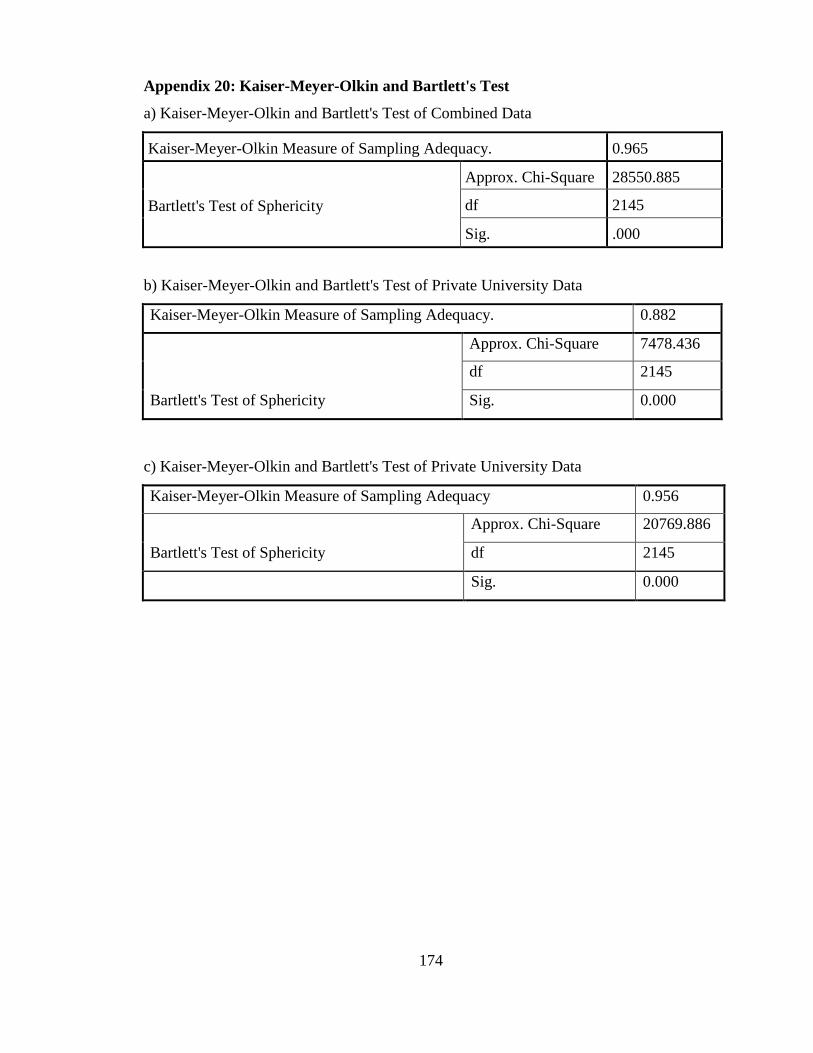
174
Appendix 20: Kaiser-Meyer-Olkin and Bartlett's Test
a) Kaiser-Meyer-Olkin and Bartlett's Test of Combined Data
Kaiser-Meyer-Olkin Measure of Sampling Adequacy. 0.965
Bartlett's Test of Sphericity
Approx. Chi-Square 28550.885
df 2145
Sig. .000
b) Kaiser-Meyer-Olkin and Bartlett's Test of Private University Data
Kaiser-Meyer-Olkin Measure of Sampling Adequacy. 0.882
Bartlett's Test of Sphericity
Approx. Chi-Square 7478.436
df 2145
Sig. 0.000
c) Kaiser-Meyer-Olkin and Bartlett's Test of Private University Data
Kaiser-Meyer-Olkin Measure of Sampling Adequacy 0.956
Bartlett's Test of Sphericity
Approx. Chi-Square 20769.886
df 2145
Sig. 0.000

175
Appendix 21: Linearity Test of Customer Satisfaction and Service Quality
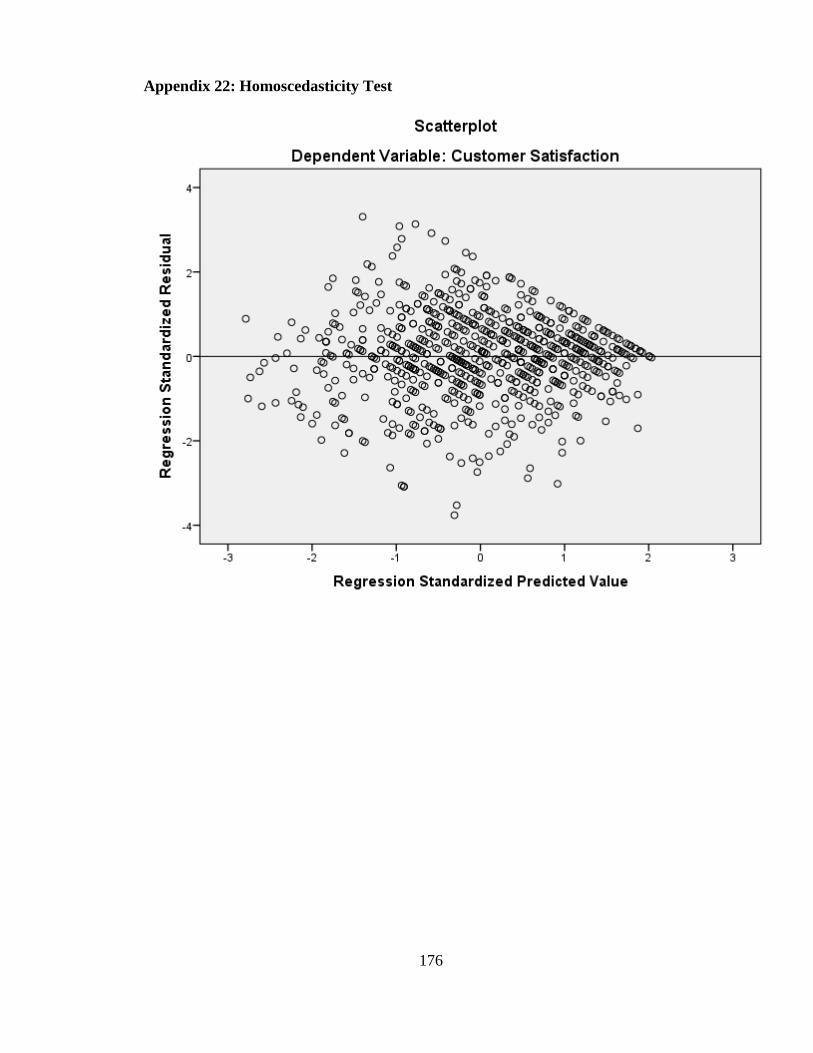
176
Appendix 22: Homoscedasticity Test
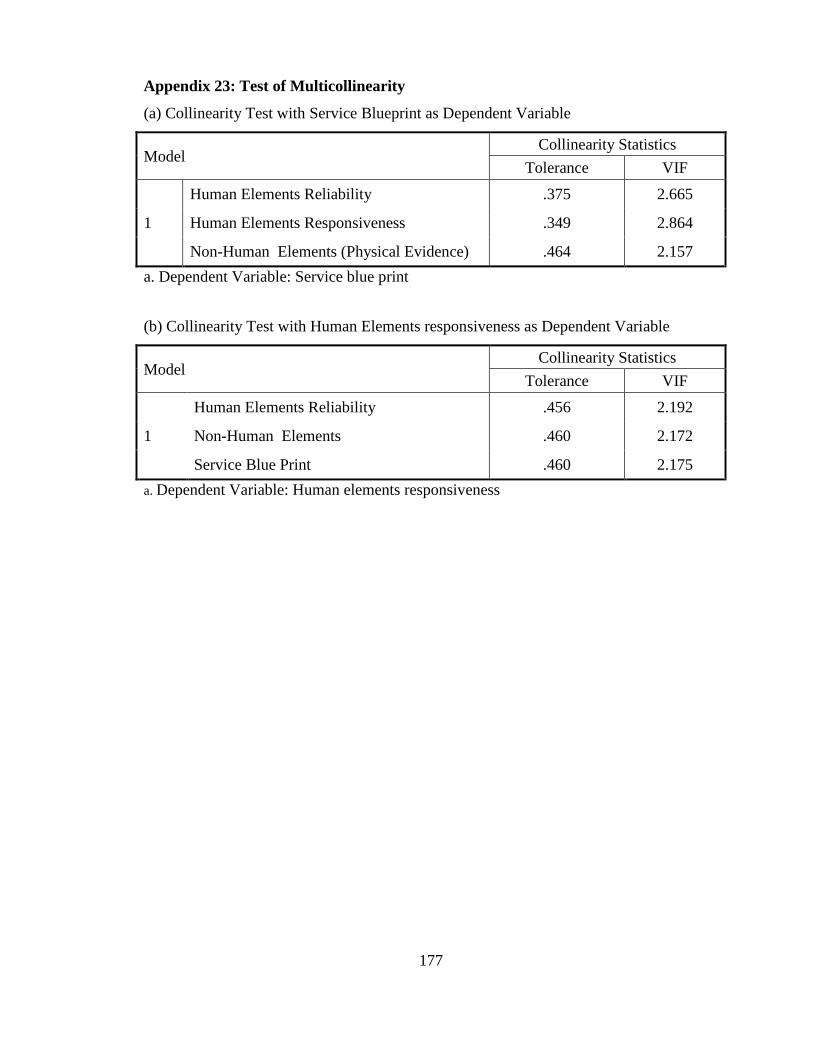
177
Appendix 23: Test of Multicollinearity
(a) Collinearity Test with Service Blueprint as Dependent Variable
Model Collinearity Statistics
Tolerance VIF
1
Human Elements Reliability .375 2.665
Human Elements Responsiveness .349 2.864
Non-Human Elements (Physical Evidence) .464 2.157
a. Dependent Variable: Service blue print
(b) Collinearity Test with Human Elements responsiveness as Dependent Variable
Model Collinearity Statistics
Tolerance VIF
1
Human Elements Reliability .456 2.192
Non-Human Elements .460 2.172
Service Blue Print .460 2.175
a. Dependent Variable: Human elements responsiveness

178
Appendix 24: Test of Multicollinearity Based on Correlation between Factors
Factors
Non-
Human
Elements
Human
Elements
Reliability
Human
Elements
Responsiveness
Service
Blue
Pearson
Correlation
Non-Human Elements 1.000
Human Elements
Reliability .674 1.000
Human Elements
Responsiveness .701 .767 1.000
Service Blue Print .671 .674 .625 1.000
Significance
(1-tailed)
Non-Human Elements
Human Elements
Reliability .000
Human Elements
Responsiveness .000 .000
Service Blue Print .000 .000 .000
N
Non-Human Elements 749
Human Elements
Reliability 749 750
Human Elements
Responsiveness 749 750 750
Service Blue Print 749 749 749 749
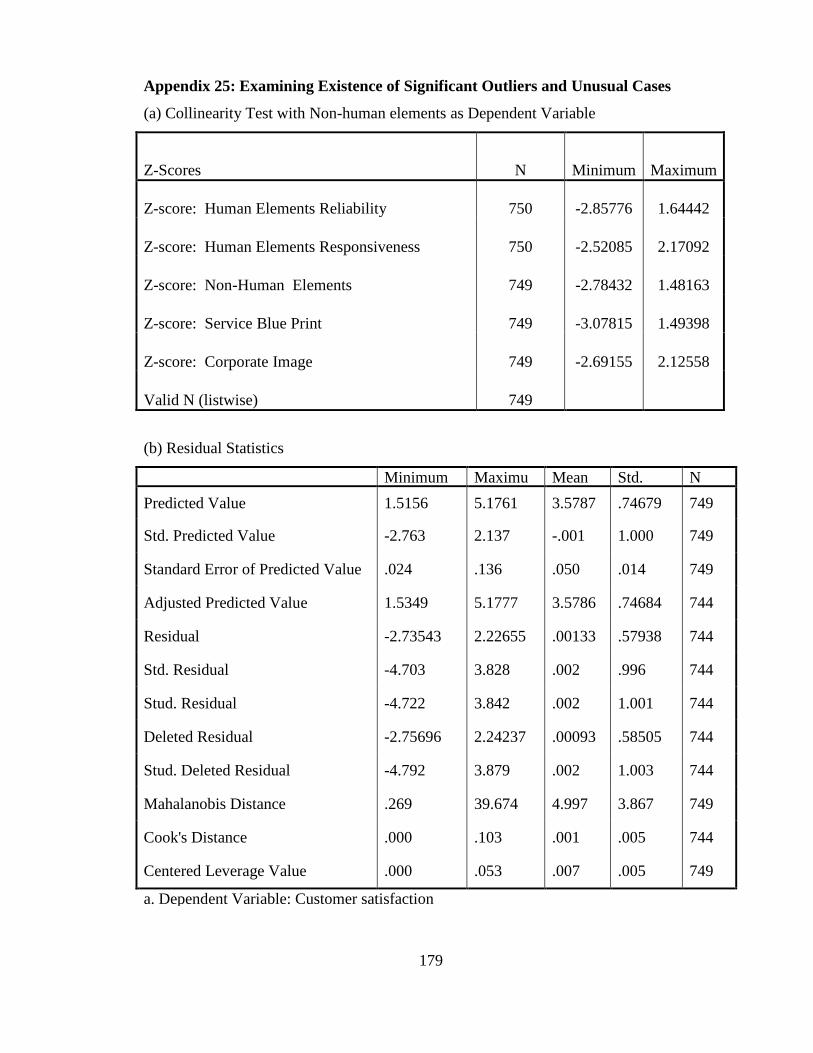
179
Appendix 25: Examining Existence of Significant Outliers and Unusual Cases
(a) Collinearity Test with Non-human elements as Dependent Variable
Z-Scores N Minimum Maximum
Z-score: Human Elements Reliability 750 -2.85776 1.64442
Z-score: Human Elements Responsiveness 750 -2.52085 2.17092
Z-score: Non-Human Elements 749 -2.78432 1.48163
Z-score: Service Blue Print 749 -3.07815 1.49398
Z-score: Corporate Image 749 -2.69155 2.12558
Valid N (listwise) 749
(b) Residual Statistics
Minimum Maximu
m
Mean Std.
Deviatio
n
N
Predicted Value 1.5156 5.1761 3.5787 .74679 749
Std. Predicted Value -2.763 2.137 -.001 1.000 749
Standard Error of Predicted Value .024 .136 .050 .014 749
Adjusted Predicted Value 1.5349 5.1777 3.5786 .74684 744
Residual -2.73543 2.22655 .00133 .57938 744
Std. Residual -4.703 3.828 .002 .996 744
Stud. Residual -4.722 3.842 .002 1.001 744
Deleted Residual -2.75696 2.24237 .00093 .58505 744
Stud. Deleted Residual -4.792 3.879 .002 1.003 744
Mahalanobis Distance .269 39.674 4.997 3.867 749
Cook's Distance .000 .103 .001 .005 744
Centered Leverage Value .000 .053 .007 .005 749
a. Dependent Variable: Customer satisfaction
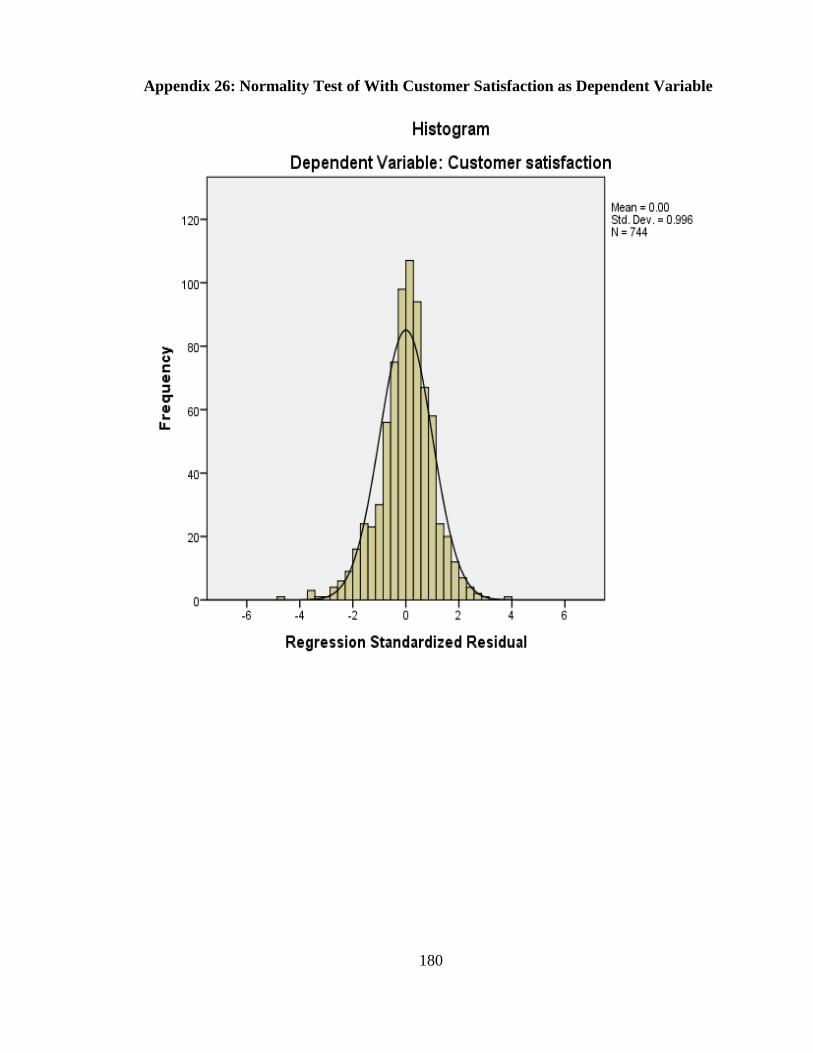
180
Appendix 26: Normality Test of With Customer Satisfaction as Dependent Variable