Investigating the Influence of Teaching Experience on the ...

9
IUJ Journal of Management Received Sept 2020
Vol 8, No.2, Dec 2020 Accepted Oct 2020
Published December 2020
EOI: eoi.citefactor.org/10.11224/IUJ.08.02.02
Influence of observational experience of Public service advertising of Health care
service
Dr. Dhananjoy Datta1 Dr. Prasenjit Pal
2 Prof. Sudhakar Patra
3
Public service advertising related to health care service sector like Dengue, Women health,
Smoking, Swine Flu, HIV / AIDS, Don’t drink and drive, Anti-Alcohol, Cancer, Polio,
Typhoid, Thalassemia, Drinking and smoking, Family Planning, Malaria, Iodine salt,
Immunization for kids in government hospital etc. regularly carried out by the Government.
To promote these philanthropic causes government spends lot of money every year but it need
to be measure that actually these advertisement may influence or not. Hence, in this context
this study is an attempt to examine the influence of observational experience of Public service
advertising of Health care service Sector in Tripura, India. This study is mainly based on the
primary and secondary data. Percentage analysis through table, pie-chart, bar diagram, Chi
square (��) test, Phi, Cramer's V Value and multiple stepwise logistic forward regressions
were applied. However, from the whole analysis of the study it can be strongly conclude that
the influence of observational experience of Public service advertising of Health care service
1 Associate Professor & Coordinator, Faculty of Management Studies, ICFAI University, Tripura,
[email protected] 2 Assistant Professor (SS),Department of Extension and Social Sciences,College of Fisheries, Central Agricultural University
(I),Tripura,[email protected] 3 Professor of Economics,PG Department of Economics, Berhampur University, Bhanj Bihar Ganjam, Odisha,

10
Sector in Tripura, India is very strong and effective. It is also observed that the study have
provided positive outcome and further expansion of field study frequently basis may give
more effective and efficient social wellbeing’s even during the COVID – 19 Pandemic to
cover the effectiveness of promotional campaign carried out by Government of India for
COVID – 19 Pandemic.
Key Words: Public, Health, Advertising, Factors and Observation
Introduction
Management of the economics of public service advertising of health care service sector shall
be followed very efficiently and effectively by any nation proactive to human beings or
society in general. In public health promotion activities Public service advertising is used to
inform the public on issues that are frequently considered to be in the general best interests of
the community at large. Typically, it reflects a social well being, philosophical theory and
humanitarian notion. It is also commonly referred to as a public service announcement (PSA)
or a community service announcement (CSA). The ads are usually broadcast on radio or
television, but may also appear in newspapers or magazines. Public service advertising is
commonly aimed at altering public attitudes by raising consciousness about particular issues.
The public service advertising campaigns are often sponsored by government, trade
associations, civic organizations, non-profit institutions or religious groups.
Research Gaps
It can be seen from the review of literatures related to the Influence of observational
experience of Public service advertising of Health care service Sector in Tripura, India, that
no study has been conducted on these aspects in the state of Tripura. Hence, present study
having in depth of Influence of observational experience of Public service advertising of
Health care service Sector in Tripura, India state perspectives covering various aspects of
Influence of observational experience of Public service advertising of Health care service
Sector in Tripura, India is very significant for sustainable development of inequities in health
outcomes.
Objective of the Study
The research works is an attempt to investigate the following objective:
11
• To study the Influence of observational experience of Public service advertising of
Health care service Sector in Tripura, India.
• To study the relationship between general socio-economic characteristics of
respondents and overall health care service sector related public service advertising
observation experiences in the study area.
• To study the relationship between general socio-economic characteristics of
respondents and the influence of observational experience through electronic, print
and outdoor media of Public service advertising of Health care service Sector in the
study area
Methodology
This study is mainly based on the primary and secondary data. Primary data collected
through pre-tested questionnaire with sample size 240 covering all districts in Tripura and
secondary data collected from the various sources like Published report, Web Articles,
Journals and research report etc. Comparative study for this research have been done through
the assessment of existing research report, articles related to the literature for the factors
influencing observational experience public service advertising of health care service sector.
Percentage analysis through table, pie-chart, bar diagram, Chi square (��), Phi, Cramer's V &
multiple stepwise logistic forward regressions were applied to test the research hypothesis
with the help of SPSS.
Formulation of hypotheses
Based on the objectives of thesis, the following main hypotheses were formulated to know
the association between overall health care service sector related public service advertising
observation experiences and general socio-economic characteristics of respondents in the
study area.
A. There is relationship between general socio-economic characteristics of respondents
and overall health care service sector related public service advertising observation
experiences in the study area (are associated).
B. There is relationship between general socio-economic characteristics of respondents
and the influence of observational experience through electronic, print and outdoor
media of Public service advertising of Health care service Sector in the study area(are
associated).

12
Research Questions
The research questions for the research works are as follows:
What influence of observational experiences through electronic, print and outdoor media of Public
service advertising of Health care service Sector?
Literature Review
In order to build up a appropriate perception of the research problem recognition and to
expand a theoretical structure to carry out the assessment of existing literature for the
economics of public service advertising of health care service sector from the secondary
sources, the following literature have been reviewed.
Potter, A., Jardine,A., Morrissey,A., & Lindsay, M.D.A.( 2019) outcome of the study display
that Fight the Bite communication campaign importantly increased awareness and
anticipation practices among the respondents who were involved in the campaign or research.
Schwartz, L M., Woloshin, S., (2019) works reveals that medical marketing rose significantly
from 1997 to 2016, particularly direct to consumer (DTC) public service advertising for drugs
and health services. Pharmaceutical related public service advertising to health professionals
caused prime expenditure and proves high even with innovative policy linked to industry
influence. In spite of the raise in marketing over 20 years, authoritarian control remains
limited.
Ahmed, W., Bath, P.A., Sbaffi, L. et al., Demartini, G. (2018) revels that mass media public
awareness campaigns are very old techniques for increasing public awareness in order to
build constructive behaviors and beliefs. Moreover, recent trend on social media like Twitter
are effective enough to provide an alternative route for increasing normal and specific
awareness. The study finds out that to what extent Twitter can increase the awareness among
the users about Autism on World Autism Awareness Day. For this purpose study collected
over 2,315,283 tweets in two-month duration. It was found that the autism awareness
campaign was highly successful on Twitter as because numbers of tweets and positive
attitudes were observed in the study period.
Bordarie, J., (2018) works outcomes validate the importance of using social marketing and
communication in order to change social perceptions towards public policies. Based on the
social message and cause an outcome also varies. Research analyses draw attention for using
social awareness campaign for building strong social representation and social marketing.
13
Henley W.H. et al. (2018) worked on improving effectiveness of public service
advertisements to prevent texting and driving of American youth and their results point out
that authoritarian spotlight ads (promotion focus in a texting and donation context) have a
positive effect on attitude toward the ads. Results also point toward that a regulatory focus ad
(avoidance spotlight) by means of an interactive release technique has a constructive result on
behavioral purposes. Accomplishment purposes examination also specify positive outcomes
for behavior from Public service advertisement.
Mansour,D., Nashwan,A., Rasheed,H.,A., Hararah,M., Nassar.,H., Abbas,R.,A.,
Alnuaimi,M., Mrayat,B.,( 2018) published report reveals that use of different social media
message is different based on demographic profile of the people like based on age, education
and socioeconomic groups etc., hence breast cancer public awareness campaign using various
social media should be customized based on demographic profile of the target group. The
study also indicates that public awareness campaign in the GCC still regard as important
challenge due to different culture and language problems.
Data Analysis - Background
This part mainly deals with the socio economic profile of the 240 sample respondents from
all districts in Tripura, India. It is based on the analysis of field level study data collected in
the year 2017 and 2018. As stated earlier, all districts in Tripura, India namely West Tripura
district, Sipahijala district, Dhalai district, North Tripura district, Gomati district, Khowai
district, Unakoti district, and South Tripura district were selected for the study. As the study
is focused on the effectiveness of the economics of the selected public service advertising of
health care service sector in Tripura, India covering the area or subject matter like the
effectiveness of the economics of selected health care service sector related public service
outdoors advertising, influence of health care service sector related public service television
advertising in electronic media and its effect in pursuing the announcement made for public
cause in Tripura, influence of health care service sector related public service print media
advertising and its effect in pursuing the announcement made for public cause in Tripura,
overall reach of the recent government sponsored health care service sector related public
service advertising among public in Tripura and right media for telecasting the health care
service sector related public service advertising to make it more effective, hence in this
regard collection of the socio economic profile sample respondents are essential. Further,
sixteen demographic variables and socio-economic characteristics of respondents considered
for the study are gender of the respondents, age of the respondents, education, category or

14
caste, nature of family, occupational status, marital status, resident location, Public service
advertising observation experiences related to advertising on health care service sector,
Health care service sector related public service advertisement telecasted in television
observation experiences, Health care service sector related public service advertising
published in the print media observation experiences, health care service sector related public
service advertising given in outdoor media observation experiences, family monthly income,
annual expenditure, land ownership in area and types of property holding has been discussed
here.
1. Gender of the Respondents
The Table 1 specifies that, most of the respondents were male married (37.1%) and
unmarried (33.3%). The percentage of the female married and female unmarried was 15.4
percent and 12.9 percent respectively. The percentage of the Transgender and Widow was 0.4
percent each.
Table 1:Gender of the Respondents
Frequency Percent Valid Percent Cumulative Percent
Valid Female - Married 37 15.4 15.4 15.4
Female -
Unmarried 31 12.9 12.9 28.3
Male 1 .4 .4 28.8
Male - Married 89 37.1 37.1 65.8
Male - Unmarried 80 33.3 33.3 99.2
Transgender 1 .4 .4 99.6
Widow 1 .4 .4 100.0
Total 240 100.0 100.0
Source: Field Survey
2. Age of the Respondents:
The Table 2 specifies that, most of the respondents covered in the research work were young
respondents between 18 to 30 years age group (44.6 %), followed by middle aged between 31

15
to 50 years age group were 35.4 percent. The percentage of Old (Above 51 years)
respondents engaged in survey was reasonably very less (20.0 %).
Table 2:Age of the Respondents
Frequency Percent Valid Percent Cumulative Percent
Valid Middle (31 to 50
years)
85 35.4 35.4 35.4
Old (Above 51 years) 48 20.0 20.0 55.4
Young (18 to 30
years)
107 44.6 44.6 100.0
Total 240 100.0 100.0
Source: Field Survey
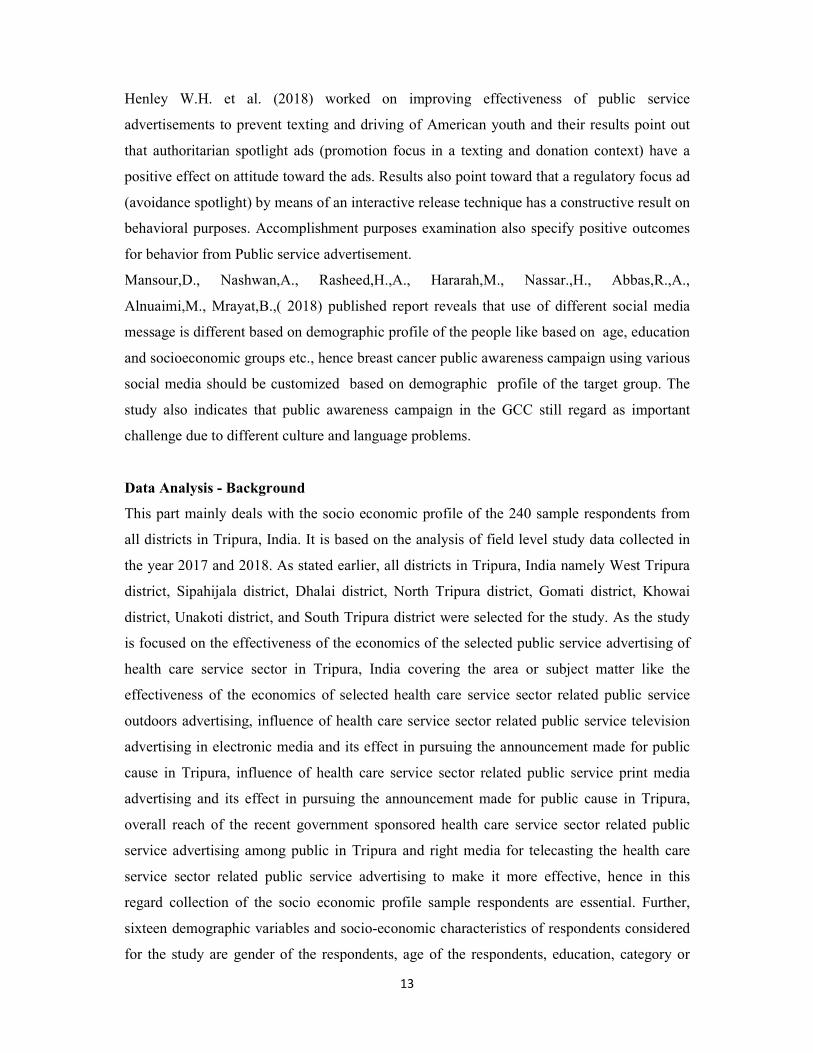
3. Education or Literacy Status of the Respondents:
From the Table 3, it reveals that nearly 34.6% of the respondents had received educated up to
graduation level. 32.5 percent of the respondents had received Post graduation level
education. 17.5 percent of the respondents had received Undergraduate level education. 9.6
percent of the respondents had received High school (11 to 12) level education. 2.9 percent of
the respondents had received Secondary/ Middle school (6 to 10) level education. 2.1 percent
of the respondents had received Doctorate level education.0.8 percent of the respondents had
received Primary school (Up to 5) level education. In total, practically 69.2 percent of the
respondents had received graduation and above level of education out of the total 240
respondents.
Table 3:Education or Literacy Status of the Respondents
Frequency Percent Valid Percent Cumulative Percent
Valid Doctorate 5 2.1 2.1 2.1
Graduate 83 34.6 34.6 36.7
High school (11 to 12) 23 9.6 9.6 46.3
16
MA. political science 1 .4 .4 46.7
Postgraduate 77 32.1 32.1 78.8
Primary school (Up to
5)
2 .8 .8 79.6
Secondary/ Middle
school (6 to 10)
7 2.9 2.9 82.5
Undergraduate 42 17.5 17.5 100.0
Total 240 100.0 100.0
Source: Field Survey
4. Category /Caste of the Respondents
From the Table 4, it was observed that all caste presence in sample size were competitive in
nature like General caste percent were 37.9 followed by Other backward caste 25.0 %, the
scheduled caste 22.1 % and scheduled tribe presence were 15.0 per cent.
Table 4:Category /Caste of the Respondents
Frequency Percent Valid Percent Cumulative Percent
Valid General caste 91 37.9 37.9 37.9
Other Backward
Caste
60 25.0 25.0 62.9
Schedule Caste 53 22.1 22.1 85.0
Scheduled Tribe 36 15.0 15.0 100.0
Total 240 100.0 100.0
Source: Field Survey
5. Family Size / Structure of the Respondents
From the survey, it was found that 47.9 percent of the respondents belonged Nuclear (Up to 4
family members) family structure. The percentage of respondents living in Joint family
(Above 4 members) were 33.8 percent, Married couple (02 Person) family size were 9.6
percent and Single (01 Person) family size were 8.8 percent.

17
Table 5: Family Size / Structure of the Respondents
Frequency Percent Valid Percent Cumulative Percent
Valid Joint (Above 4) 81 33.8 33.8 33.8
Married couple ( 02
Person)
23 9.6 9.6 43.3
Nuclear (Up to 4) 115 47.9 47.9 91.3
Single ( 01 Person) 21 8.8 8.8 100.0
Total 240 100.0 100.0
Source: Field Survey
6. Occupational status or Type of Job of the Respondents
Out of the total 240 sample size, it was found that 22.5 percent respondents were salaried
from State Government, 20.8 percent respondents were students of different colleges and
universities in Tripura, 19.3 percent respondents were self-employed covering profession like
private tutor, farmer, business men etc., 18.3 percent respondents were salaried persons with
private companies,7.5 percent respondents were retired persons from different organizations,
5.1 percent respondents were educated house wife,4.5 percent respondents were salaried with
different Central Government organizations,1.2 percent respondents were educated
unemployed. The same can be noticed from the Table 6.
Table 6: Occupational status or Type of Job of the Respondents
Frequency Percent Valid Percent Cumulative Percent
Valid Business 1 .4 .4 .4
Farmer 2 .8 .8 1.3
Home maker 2 .8 .8 2.1
House wife 3 1.3 1.3 3.3
House Wife 4 1.7 1.7 5.0
Housewife 3 1.3 1.3 6.3
NHM 1 .4 .4 6.7
NHM Contractual 1 .4 .4 7.1
Pensioner 1 .4 .4 7.5
Private tutor 1 .4 .4 7.9
Public 1 .4 .4 8.3
Retired Person 17 7.1 7.1 15.4

18
Salaried - Central
Government
8 3.3 3.3 18.8
Salaried - Private 44 18.3 18.3 37.1
Salaried - State
Government
54 22.5 22.5 59.6
Self-employed 44 18.3 18.3 77.9
Student 50 20.8 20.8 98.8
Un employed 1 .4 .4 99.2
Unemployed 2 .8 .8 100.0
Total 240 100.0 100.0
Source: Field Survey
7. Marital Status of the Respondents
In all the district of Tripura e.g. West Tripura district, Sipahijala district, Dhalai district,
North Tripura district, Gomati district, Khowai district, Unakoti district, and South Tripura
district from the total sample size of 240, it was found that 49.6 percent respondents were
married, 45.8 percent respondents were single, 3.3 percent respondents were widow, 1.3
percent respondents were divorce. The same can be observed from the Table 7.
Table 7: Marital Status of the Respondents
Frequency Percent Valid Percent Cumulative Percent
Valid Divorced 3 1.3 1.3 1.3
In a Relationship 1 .4 .4 1.7
Married 119 49.6 49.6 51.3
Single 109 45.4 45.4 96.7
Widow 8 3.3 3.3 100.0
Total 240 100.0 100.0
Source: Field Survey
8. Resident Location of the Respondents
The data presented in Table 8 on resident location of the respondents shows that nearly 52.1
percent of respondents stay in rural areas, 30.0 percent of respondents stay in urban areas,
17.9 percent of respondents stay in Semi Urban areas.

19
Table 8: Resident Location of the Respondents
Frequency Percent Valid Percent Cumulative Percent
Valid Rural 125 52.1 52.1 52.1
Semi Urban 43 17.9 17.9 70.0
Urban 72 30.0 30.0 100.0
Total 240 100.0 100.0
Source: Field Survey
9. Public service advertising observation experiences related to advertising on Health
care service sector of the Respondents
Overall, 47.5 percent of the respondents have medium (5 to 10 years) Public service
advertising observation experiences related to advertising on health care service sector, 32.5
percent of the respondents have below five 5 years (low) of Public service advertising
observation experiences related to advertising on health care service sector and 20.0 percent
of the respondents have high (11 Years and above) Public service advertising observation
experiences related to advertising on health care service sector which is negligible and
exceptionally less throughout the whole survey areas from the total 240 sample size.
Table 9: Public service advertising observation experiences related to advertising on
Health care service sector of the Respondents
Frequency Percent Valid Percent Cumulative Percent
Valid High (11 Years and
above)
48 20.0 20.0 20.0
Low (<5 Years) 78 32.5 32.5 52.5
Medium (5 to 10 Years) 114 47.5 47.5 100.0
Total 240 100.0 100.0
Source: Field Survey
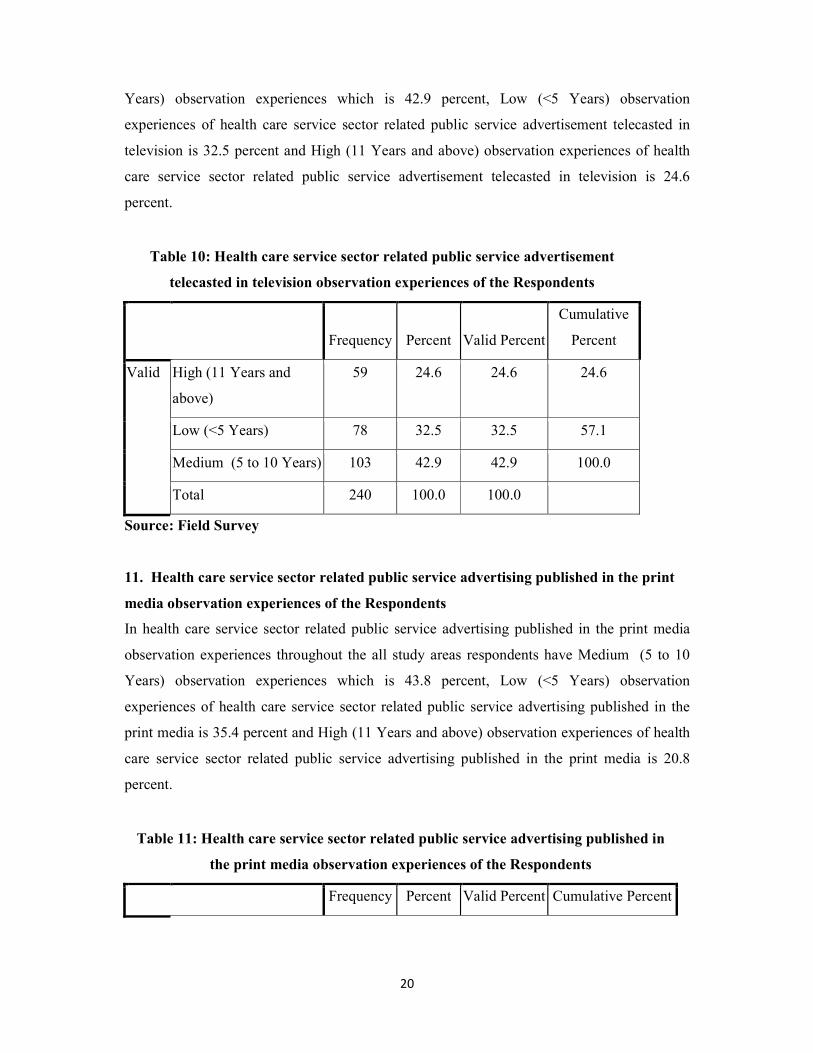
10. Health care service sector related public service advertisement telecasted in
television observation experiences of the Respondents
In health care service sector related public service advertisement telecasted in television
observation experiences throughout the all study areas respondents have Medium (5 to 10
20
Years) observation experiences which is 42.9 percent, Low (<5 Years) observation
experiences of health care service sector related public service advertisement telecasted in
television is 32.5 percent and High (11 Years and above) observation experiences of health
care service sector related public service advertisement telecasted in television is 24.6
percent.
Table 10: Health care service sector related public service advertisement
telecasted in television observation experiences of the Respondents
Frequency Percent Valid Percent
Cumulative
Percent
Valid High (11 Years and
above)
59 24.6 24.6 24.6
Low (<5 Years) 78 32.5 32.5 57.1
Medium (5 to 10 Years) 103 42.9 42.9 100.0
Total 240 100.0 100.0
Source: Field Survey
11. Health care service sector related public service advertising published in the print
media observation experiences of the Respondents
In health care service sector related public service advertising published in the print media
observation experiences throughout the all study areas respondents have Medium (5 to 10
Years) observation experiences which is 43.8 percent, Low (<5 Years) observation
experiences of health care service sector related public service advertising published in the
print media is 35.4 percent and High (11 Years and above) observation experiences of health
care service sector related public service advertising published in the print media is 20.8
percent.
Table 11: Health care service sector related public service advertising published in
the print media observation experiences of the Respondents
Frequency Percent Valid Percent Cumulative Percent

21
Valid High (11 Years and
above)
50 20.8 20.8 20.8
Low (<5 Years) 85 35.4 35.4 56.3
Medium (5 to 10 Years) 105 43.8 43.8 100.0
Total 240 100.0 100.0
Source: Field Survey
12. Health care service sector related public service advertising given in outdoor media
observation experiences of the Respondents
In health care service sector related public service advertising given in outdoor media
observation experiences throughout the all study areas respondents have Medium (5 to 10
Years) observation experiences which is 45.4 percent, Low (<5 Years) observation
experiences of health care service sector related public service advertising given in outdoor
media is 34.2 percent and High (11 Years and above) observation experiences of health care
service sector related public service advertising given in outdoor media is 20.4 percent.
Table 12: Health care service sector related public service advertising given in
outdoor media observation experiences of the Respondents
Frequency Percent Valid Percent Cumulative Percent
Valid High (11 Years and
above)
49 20.4 20.4 20.4
Low (<5 Years) 82 34.2 34.2 54.6
Medium (5 to 10 Years) 109 45.4 45.4 100.0
Total 240 100.0 100.0
Source: Field Survey
13. Family Monthly Income of the Respondents
In case of respondents family monthly income in all the study areas majority was falling in
Medium (10,000 above-25,000 monthly family income) income group which is 45.9percent,
High (25,000 above monthly family income) income group is 27.5 percent and Low (Up to
10,000 monthly family income)income group is 26.6 percent only. The same can be seen in
Table 13.
Table 13: Family Monthly Income of the Respondents

22
Frequency Percent Valid Percent Cumulative Percent
Valid High (25,000 above) 66 27.5 27.5 27.5
Low (Up to 10,000) 64 26.6 26.6 54.1
Medium (10,000 above-
25,000)
110 45.8 45.8 100.0
Total 240 100.0 100.0
Source: Field Survey
14. Land Ownership in Area of the Respondents
Majority (46.3 percent) of the respondents from all district in Tripura owned Small (1
hectare) land. Per cent of respondents holding medium size land (2 hectare) was 28.80 per
cent, Landless (0 hectare) respondents percentage was 14.2 and Large (Above 2 hectare)
landholdings respondents percentage was 10.8 per cent.
Table 14: Land Ownership in Area of the Respondents
Frequency Percent Valid Percent Cumulative Percent
Valid Landless 0 hectare 34 14.2 14.2 14.2
Large Above 2
hectare
26 10.8 10.8 25.0
Medium 2 hectare 69 28.8 28.8 53.8
Small 1 hectare 111 46.3 46.3 100.0
Total 240 100.0 100.0
Source: Field Survey
15. Types of Property Holding of the Respondents
From the Table 15, it appears that 46.3 percent of the respondents were holding both movable
property and immovable property. 38.7 percent of the respondents were holding only
Immovable Property. 13.8 percent of the respondents were holding only Movable Property

23
but one interesting findings was that 1.2 percent of the respondents indicates that they were
having nothing as movable property and immovable property.
Table 15: Types of Property Holding of the Respondents
Frequency Percent Valid Percent Cumulative Percent
Valid Both 111 46.3 46.3 46.3
Immovable Property 92 38.3 38.3 84.6
Movable Property 33 13.8 13.8 98.3
No 1 .4 .4 98.8
Nothing 1 .4 .4 99.2
NOTHING 1 .4 .4 99.6
We don’t have any
movable property
1 .4 .4 100.0
Total 240 100.0 100.0
Source: Field Survey
Figure 16: Maximum Annual Expenditure on
240 Responses

24
Source: Field Survey
16. Maximum Annual Expenditure on
From the Figure 26 on maximum annual expenditure, it very clearly emerge that the
respondents maximum expenditure takes places on medical or health care issues which was
85 percent. 83.3 percent expenditure takes places for food purpose, 69.6 percent expenditure
takes places for clothing and 68.8 percent expenditure takes places for education. Apart from
these expenditures, 2.00 percent expenditure takes places on transportation,travelling and
social service etc. Again 1.00 percent expenditure takes places on expenditure headings like
tourism,newspaper, household items, helping poor for education etc. But it was observed that
maximum annual expenditure takes places medical or health care issues.
Hypotheses analysis
The important demographic profile and socio-economic characteristics data of the 240
respondents from all eight districts which were corresponding to Gender of the respondents,
Age of the respondents, Education or Literacy Status, Occupational status or Type of Job,
25
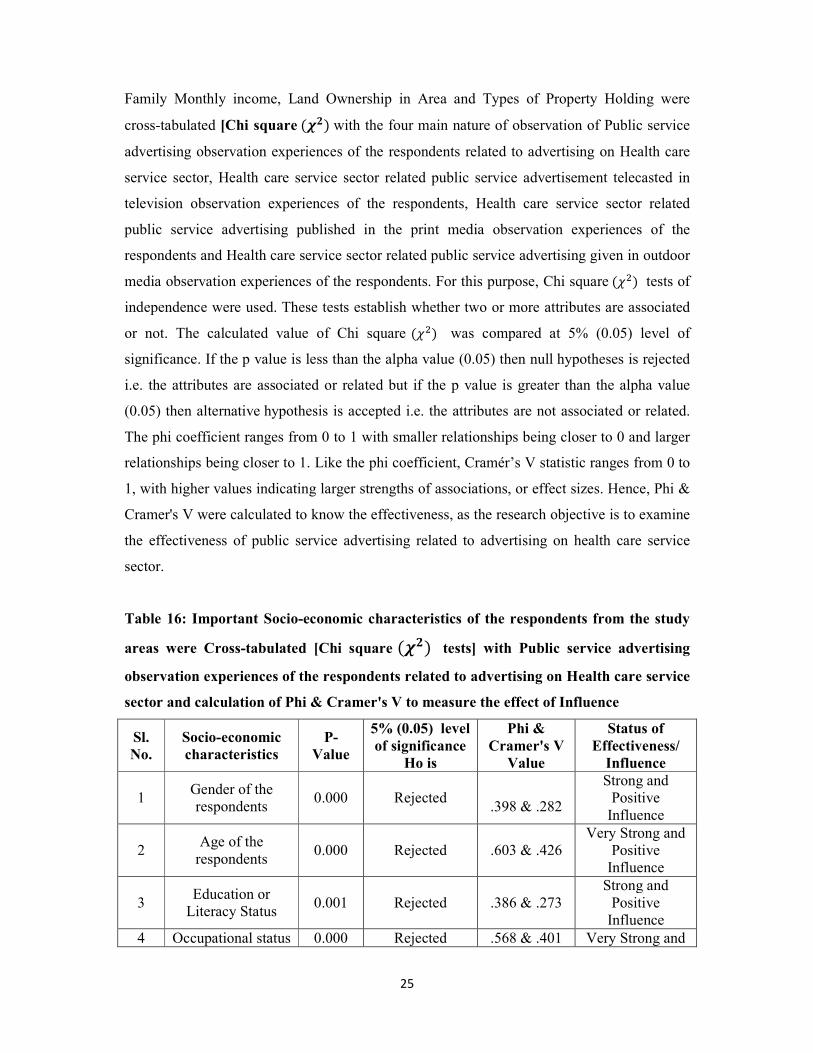
Family Monthly income, Land Ownership in Area and Types of Property Holding were
cross-tabulated [Chi square (��) with the four main nature of observation of Public service
advertising observation experiences of the respondents related to advertising on Health care
service sector, Health care service sector related public service advertisement telecasted in
television observation experiences of the respondents, Health care service sector related
public service advertising published in the print media observation experiences of the
respondents and Health care service sector related public service advertising given in outdoor
media observation experiences of the respondents. For this purpose, Chi square (��) tests of
independence were used. These tests establish whether two or more attributes are associated
or not. The calculated value of Chi square (��) was compared at 5% (0.05) level of
significance. If the p value is less than the alpha value (0.05) then null hypotheses is rejected
i.e. the attributes are associated or related but if the p value is greater than the alpha value
(0.05) then alternative hypothesis is accepted i.e. the attributes are not associated or related.
The phi coefficient ranges from 0 to 1 with smaller relationships being closer to 0 and larger
relationships being closer to 1. Like the phi coefficient, Cramér’s V statistic ranges from 0 to
1, with higher values indicating larger strengths of associations, or effect sizes. Hence, Phi &
Cramer's V were calculated to know the effectiveness, as the research objective is to examine
the effectiveness of public service advertising related to advertising on health care service
sector.
Table 16: Important Socio-economic characteristics of the respondents from the study
areas were Cross-tabulated [Chi square (��) tests] with Public service advertising
observation experiences of the respondents related to advertising on Health care service
sector and calculation of Phi & Cramer's V to measure the effect of Influence
Sl.
No.
Socio-economic
characteristics
P-
Value
5% (0.05) level
of significance
Ho is
Phi &
Cramer's V
Value
Status of
Effectiveness/
Influence
1 Gender of the
respondents 0.000 Rejected
.398 & .282
Strong and
Positive
Influence
2 Age of the
respondents 0.000 Rejected .603 & .426
Very Strong and
Positive
Influence
3 Education or
Literacy Status 0.001 Rejected .386 & .273
Strong and
Positive
Influence
4 Occupational status 0.000 Rejected .568 & .401 Very Strong and

26
or Type of Job Positive
Influence
5 Family Monthly
income 0.046 Rejected .256 & .181
Positive
Influence
6 Land Ownership in
Area 0.000 Rejected .343 & .243
Strong and
Positive
Influence
7 Types of Property
Holding 0.000 Rejected .422 & .298
Strong and
Positive
Influence
Source: Field Survey
Interpretation: Table 16 depicts that all the selected demographic profile and socio-
economic characteristics like Gender of the respondents, Age of the respondents, Education
or Literacy Status, Occupational status or Type of Job, Family Monthly income, Land
Ownership in Area and Types of Property Holding are significantly related or associated with
Public service advertising observation experiences of the respondents related to advertising
on Health care service sector. From the Table 16, it also appears that the strengths of
associations or effect or Influence sizes are very strong, strong and positive.
Multiple stepwise forward logistic regressions analysis
Data were analyzed using multiple stepwise logistic forward regressions (PROC LOGISTIC;
SAS, 2012) to do the stepwise selection for identifying the prognostic factors for Public
Service Advertising Observation Experiences (oe) related to Advertising on Health Care
Service Sector. The model used was the logistic regression (LR) model:
ii xxxx
xβββα
θθ
++++=
−...
)(1
)(log 2211
where, Public Service Advertising Observation Experiences related to Advertising on Health
Care Service score is the dependent variable; gender, age, educational qualification and other
variables are the predictor variables that ‘x’ represents; α = intercept of the model and β = the
coefficient of predictor variables. LR enters predictor variables in a stepwise manner; it will
also fit specified models or perform forward selection of variables. At each step in the
stepping process, an attempt was made to remove any insignificant variables from the model
before adding a significant variable to the model. A significance level of 0.3 was required to
allow a variable to enter into the model, and a significance level of 0.35 was required for a
variable to stay in the model. The step selection was based on the maximum likelihood ratio.
The evaluation of the logistic regression model was done by Hosmer and Lemeshow
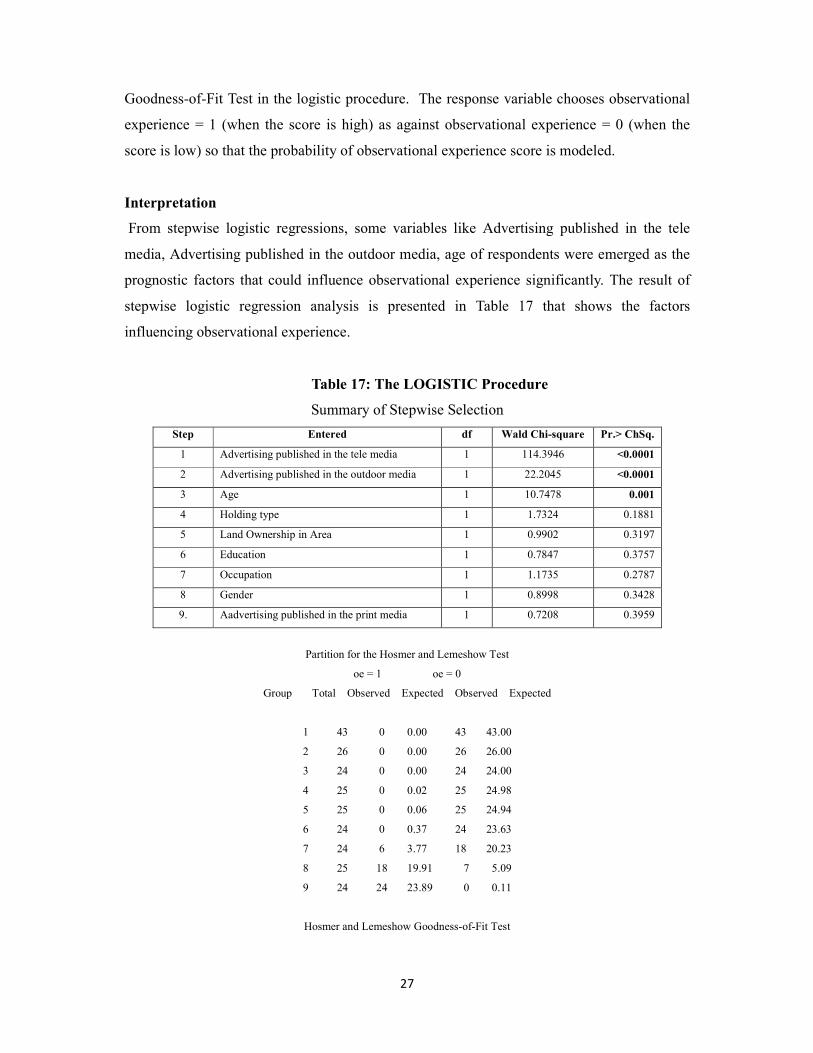
27
Goodness-of-Fit Test in the logistic procedure. The response variable chooses observational
experience = 1 (when the score is high) as against observational experience = 0 (when the
score is low) so that the probability of observational experience score is modeled.
Interpretation
From stepwise logistic regressions, some variables like Advertising published in the tele
media, Advertising published in the outdoor media, age of respondents were emerged as the
prognostic factors that could influence observational experience significantly. The result of
stepwise logistic regression analysis is presented in Table 17 that shows the factors
influencing observational experience.
Table 17: The LOGISTIC Procedure
Summary of Stepwise Selection
Step Entered df Wald Chi-square Pr.> ChSq.
1 Advertising published in the tele media 1 114.3946 <0.0001
2 Advertising published in the outdoor media 1 22.2045 <0.0001
3 Age 1 10.7478 0.001
4 Holding type 1 1.7324 0.1881
5 Land Ownership in Area 1 0.9902 0.3197
6 Education 1 0.7847 0.3757
7 Occupation 1 1.1735 0.2787
8 Gender 1 0.8998 0.3428
9. Aadvertising published in the print media 1 0.7208 0.3959
Partition for the Hosmer and Lemeshow Test
oe = 1 oe = 0
Group Total Observed Expected Observed Expected
1 43 0 0.00 43 43.00
2 26 0 0.00 26 26.00
3 24 0 0.00 24 24.00
4 25 0 0.02 25 24.98
5 25 0 0.06 25 24.94
6 24 0 0.37 24 23.63
7 24 6 3.77 18 20.23
8 25 18 19.91 7 5.09
9 24 24 23.89 0 0.11
Hosmer and Lemeshow Goodness-of-Fit Test

28
Chi-Square DF Pr > ChiSq
3.0273 7 0.8825
NOTE: In calculating the Expected values, predicted probabilities less than 1E-6 and greater than
0.999999 were changed to 1E-6 and 0.999999 respectively.
Findings, Summarizations and Concluding Observation
Overall, 47.5 percent of the respondents have medium (5 to 10 years) Public service
advertising observation experiences related to advertising on health care service sector, 32.5
percent of the respondents have below five 5 years (low) of Public service advertising
observation experiences related to advertising on health care service sector and 20.0 percent
of the respondents have high (11 Years and above) Public service advertising observation
experiences related to advertising on health care service sector which is negligible and
exceptionally less throughout the whole survey areas from the total 240 sample size. In health
care service sector related public service advertisement telecasted in television observation
experiences throughout the all study areas respondents have Medium (5 to 10 Years)
observation experiences which is 42.9 percent, Low (<5 Years) observation experiences of
health care service sector related public service advertisement telecasted in television is 32.5
percent and High (11 Years and above) observation experiences of health care service sector
related public service advertisement telecasted in television is 24.6 percent. In health care
service sector related public service advertising published in the print media observation
experiences throughout the all study areas respondents have Medium (5 to 10 Years)
observation experiences which is 43.8 percent, Low (<5 Years) observation experiences of
health care service sector related public service advertising published in the print media is
35.4 percent and High (11 Years and above) observation experiences of health care service
sector related public service advertising published in the print media is 20.8 percent. In health
care service sector related public service advertising given in outdoor media observation
experiences throughout the all study areas respondents have Medium (5 to 10 Years)
observation experiences which is 45.4 percent, Low (<5 Years) observation experiences of
health care service sector related public service advertising given in outdoor media is 34.2
percent and High (11 Years and above) observation experiences of health care service sector
related public service advertising given in outdoor media is 20.4 percent. Table 16 depicts
that all the selected demographic profile and socio-economic characteristics like Gender of
the respondents, Age of the respondents, Education or Literacy Status, Occupational status or

29
Type of Job, Family Monthly income, Land Ownership in Area and Types of Property
Holding are significantly related or associated with Public service advertising observation
experiences of the respondents related to advertising on Health care service sector. From the
Table 16, it also appears that the strengths of associations or effect or Influence sizes are very
strong, strong and positive. From stepwise logistic regressions, some variables were emerged
as the prognostic factors that could influence observational experience significantly. The
result of stepwise logistic regression analysis is presented in Table 17 that shows the factors
influencing observational experience. Hence, from the whole analysis of the study it can be
strongly conclude that the Influence of observational experience of public service advertising
related to advertising on health care service sector is effective and it is observed that the study
have provided positive outcome and further expansion of field study frequently basis may
give more effective and efficient social wellbeing’s.

30
References
1. Ahmed, W., Bath, P.A., Sbaffi, L. et al., Demartini, G. (2018). Measuring the effect
of public health campaigns on Twitter: the case of World Autism Awareness Day. In:
Transforming Digital Worlds. iConference 2018: Transforming Digital Worlds, 25-
28 Mar 2018, Sheffield, UK. Lecture Notes in Computer Science. Springer Verlag,
pp. 10-16. http://eprints.whiterose.ac.uk/127215/ (Accessed & Retrieved on
26/06/2019 at 12.12pm)https://doi.org/10.1007/978-3-319-78105-1_2.
2. Bordarie, J., (2018). Social representations and social marketing: Effectiveness of
awareness campaigns on the representation of public policies? International Journal of
Nonprofit and Voluntary Sector marketing.24:2. https://doi.org/10.1002/nvsm.1633
(Accessed & Retrieved on 14/06/2019 at 5.56 pm)
https://onlinelibrary.wiley.com/doi/abs/10.1002/nvsm.1633
3. Datta,D., Choudhury , A.K. (2017).The economics of public service advertising of
health care service sector – A Literature Review. International Journal of Research in
Commerce, Economics & Management.7 (10).15-18. ISSN: 2231-4245. UGC
Approved Journal No: 7515.
4. Datta,D., Choudhury , A.K. (2019).Effectiveness of Health Care Service Sector
related Public Service Print Media Advertising in Tripura, India.IUJ Journal of
Management, 7 (01).01-10. ISSN: 2347- 5080.
5. Datta,D., Choudhury , A.K. (2019).Public Service Advertising of Health Care Service
Sector: An Indian Conceptual Framework.IUP Magazine of Marketing Mastermind.
XVI (03).48-58. ISSN: 0972-5156.
6. Datta,D., Choudhury , A.K. (2019). Economics of Health Care Service Sector related
Public Service Outdoor Media Advertising in Tripura. India in International Journal
on Recent Trends in Business and Tourism. Volume no. 03, Issue no.03.ISSN: 2550-
1526.
7. Definition of Health Economics. https://en.wikipedia.org/wiki/Health_economics
(Retrieved on 22th April’2016 at 10.35 am).
8. Definition of Public service advertising. http://www.wisegeek.com/what-is-public-
service-advertising.htm (Retrieved on 22th April’2016 at 10.50 am).
9. Department of Industrial Policy and Promotion (DIPP), RNCOS Reports, Media
Reports, Press Information Bureau (PIB). http://www.ibef.org/industry/healthcare-
india.aspx (Retrieved on 22th April’2016 at 10 am).

31
10. Henley W.H. et al. (2018). Improving effectiveness of public service advertisements
to prevent texting and driving of American youth. International Journal of nonprofit
and voluntary sector marketing. Volume 23, Issue 4.
https://doi.org/10.1002/nvsm.1626 (Accessed & Retrieved on 11/05/2019 at 4.18 pm)
https://wol-prod-cdn.literatumonline.com/pb-assets/journal-banners/1479103x-
1515517653593.jpg
11. Mansour,D., Nashwan,A., Rasheed,H.,A., Hararah,M., Nassar.,H., Abbas,R.,A.,
Alnuaimi,M., Mrayat,B.,( 2018). Use of Social Media in Breast Cancer Awareness:
GCC Countries’ Experience. Journal of Global Oncology (An American Society of Clinical Oncology Journal).
https://ascopubs.org/doi/abs/10.1200/jgo.18.66200 (Accessed & Retrieved on
20/06/2019 at 05.15 pm)
12. Potter, A., Jardine,A., Morrissey,A., & Lindsay, M.D.A.( 2019). Evaluation of a
Health Communication Campaign to Improve Mosquito Awareness and Prevention
Practices in Western Australia. Frontiers in Public Health.
ttps://www.frontiersin.org/articles/10.3389/fpubh.2019.000 (Accessed & Retrieved
on 17/06/2019 at 05.35 pm) https://doi.org/10.3389/fpubh.2019.00054
13. Schwartz, L M., Woloshin, S., (2019).Medical Marketing in the United States, 1997-
2016. JAMA.321 (1):80-96. doi:10.1001/jama.2018.19320 (Accessed & Retrieved on
06/06/2019 at 4.50 pm) https://jamanetwork.com/journals/jama/fullarticle/2720029.