Influence of growth faults on coastal fluvial systems...
13
Influence of growth faults on coastal fluvial systems: Examples from the late Miocene to Recent Mississippi River Delta Christopher Armstrong a, ⁎, David Mohrig a , Thomas Hess a , Terra George a,1 , Kyle M. Straub b a The University of Texas at Austin, Jackson School of Geosciences, USA b Tulane University, Department of Earth and Environmental Sciences, New Orleans, LA 70118, USA abstract article info Article history: Received 3 December 2012 Received in revised form 3 April 2013 Accepted 27 June 2013 Available online 5 July 2013 Keywords: Geomorphology Neotectonics Growth faults Fluvial Stratigraphy Seismic studies The details of how fluvial systems respond to spatial changes in land-surface subsidence produced by active faulting remain incompletely understood. Here, we examine the degree to which the positioning of individual channels and channel-belts is affected by local maxima in subsidence associated with the hanging walls of growth faults. The channel forms and faults are imaged using a seismic volume covering 1400 km 2 of Breton Sound and Barataria Bay in southern Louisiana, USA. We look at the consequences of interactions between chan- nels, channel-belts, and faults in late Miocene to Recent strata. More than fifty individual channels that crossed the traces of active growth faults were examined. Of these channels, only three appear to have been redirected by the faults. There also appeared to be no systematic change in the cross-sectional geometries of channels or channel-belts associated with crossing a fault, though the orientation of the channel-belts appears to be more influenced by faulting than the orientation of individual channels. Seven out of ten mapped channel-belts appear to have been steered by growth faults. We propose that channel belts are more likely to be influenced by faults than individual channels because channel-belts are longer lived features, unlikely to shift their overall position before experiencing a discrete faulting event. In addition, the style of influence in the few cases where an individ- ual channel is affected by a fault is different from that of larger systems. While downstream of a fault channel-belts generally become oriented perpendicular to fault strike, the individual channels are directed along the hanging wall of the fault, running parallel to the fault trace. We relate this to the ratio of the length-scale of fault rollover relative to the channel or channel-belt width. Fluvial-fault interactions with higher values for this ratio are more likely to be carried parallel to the fault trace than systems with lower ratio values. © 2013 Elsevier B.V. All rights reserved. 1. Introduction A basic principle in the study of interactions between fluvial systems and spatially varying subsidence is that rivers can be preferentially attracted to areas of higher subsidence (Alexander and Leeder, 1987). The potential for variations in subsidence to affect fluvial stratigraphy has been documented in numerous field studies (e.g., DeCelles, 1986; Mack and Seager, 1990; Peakall, 1998; Mack and Leeder, 1999; Peakall et al., 2000). Fluvial sensitivity to subsidence is, however, dependent on the interplay of a number of different factors. In a simulation model of alluvial stratigraphy, Bridge and Leeder (1979) found a strong clustering trend in areas of high tectonic tilting due to a fault-created, transverse floodplain slope. In their model, this only occurred when tilting was maintained for a prolonged period of time. Mackey and Bridge (1995) found that tectonic tilting caused channel-belts to shift away from zones of uplift and towards zones of maximum subsidence. However, in their model, if the aggradation rate is high enough to keep pace with subsidence, no fault effect was seen. This numerical re- sult for the case of high sediment supply was confirmed experimentally by Hickson et al. (2005). Kim et al. (2010) demonstrated the impor- tance of the relative magnitudes of the tectonic timescale versus channel-avulsion frequency when determining the likelihood that a channel will be redirected by subsidence. In their associated physical experiment, channels were most influenced by variations in subsidence if channel mobility was low relative to the accumulation of significant surface relief via spatially varying subsidence rates. The majority of previous studies have focused on the effects of large, basin-scale extensional tilting on fluvial systems. Only a few workers have looked at the extent to which local faulting can influence stratigra- phy. Maynard (2006) used high resolution 3D seismic data to document fluvial response to the development of a growth fault related rollover anticline. A series of seismic time slices imaged the evolution of a sys- tem of narrow (100's of meters wide) channels on the hanging wall side of a growth fault. The fluvial system underwent an increase in sin- uosity and avulsion frequency in response to the increase in slope creat- ed by faulting. Taha and Anderson (2008) studied channel avulsion frequency within the Brazos River incised valley, Texas, USA. Using Sedimentary Geology 301 (2014) 120–132 ⁎ Corresponding author at: Southwestern Energy Company, Houston, Texas 77032, USA. E-mail address: [email protected] (C. Armstrong). 1 Present Address: ConocoPhillips Company, Houston, TX 77079, USA. 0037-0738/$ – see front matter © 2013 Elsevier B.V. All rights reserved. http://dx.doi.org/10.1016/j.sedgeo.2013.06.010 Contents lists available at ScienceDirect Sedimentary Geology journal homepage: www.elsevier.com/locate/sedgeo
Transcript of Influence of growth faults on coastal fluvial systems...

Sedimentary Geology 301 (2014) 120–132
Contents lists available at ScienceDirect
Sedimentary Geology
j ourna l homepage: www.e lsev ie r .com/ locate /sedgeo
Influence of growth faults on coastal fluvial systems: Examples from the late Mioceneto Recent Mississippi River Delta
Christopher Armstrong a,⁎, David Mohrig a, Thomas Hess a, Terra George a,1, Kyle M. Straub b
a The University of Texas at Austin, Jackson School of Geosciences, USAb Tulane University, Department of Earth and Environmental Sciences, New Orleans, LA 70118, USA
⁎ Corresponding author at: Southwestern Energy CompE-mail address: [email protected]
1 Present Address: ConocoPhillips Company, Houston
0037-0738/$ – see front matter © 2013 Elsevier B.V. Allhttp://dx.doi.org/10.1016/j.sedgeo.2013.06.010
a b s t r a c t
a r t i c l e i n f oArticle history:Received 3 December 2012Received in revised form 3 April 2013Accepted 27 June 2013Available online 5 July 2013
Keywords:GeomorphologyNeotectonicsGrowth faultsFluvialStratigraphySeismic studies
The details of how fluvial systems respond to spatial changes in land-surface subsidence produced by activefaulting remain incompletely understood. Here, we examine the degree to which the positioning of individualchannels and channel-belts is affected by local maxima in subsidence associated with the hanging walls ofgrowth faults. The channel forms and faults are imaged using a seismic volume covering 1400 km2 of BretonSound and Barataria Bay in southern Louisiana, USA.We look at the consequences of interactions between chan-nels, channel-belts, and faults in late Miocene to Recent strata. More than fifty individual channels that crossedthe traces of active growth faultswere examined. Of these channels, only three appear to have been redirected bythe faults. There also appeared to be no systematic change in the cross-sectional geometries of channels orchannel-belts associated with crossing a fault, though the orientation of the channel-belts appears to be moreinfluenced by faulting than the orientation of individual channels. Seven out of tenmapped channel-belts appearto have been steered by growth faults. We propose that channel belts are more likely to be influenced by faultsthan individual channels because channel-belts are longer lived features, unlikely to shift their overall positionbefore experiencing a discrete faulting event. In addition, the style of influence in the few caseswhere an individ-ual channel is affected by a fault is different from that of larger systems. While downstream of a faultchannel-belts generally become oriented perpendicular to fault strike, the individual channels are directedalong the hanging wall of the fault, running parallel to the fault trace. We relate this to the ratio of thelength-scale of fault rollover relative to the channel or channel-belt width. Fluvial-fault interactions with highervalues for this ratio are more likely to be carried parallel to the fault trace than systems with lower ratio values.
© 2013 Elsevier B.V. All rights reserved.
1. Introduction
A basic principle in the study of interactions between fluvial systemsand spatially varying subsidence is that rivers can be preferentiallyattracted to areas of higher subsidence (Alexander and Leeder, 1987).The potential for variations in subsidence to affect fluvial stratigraphyhas been documented in numerous field studies (e.g., DeCelles, 1986;Mack and Seager, 1990; Peakall, 1998; Mack and Leeder, 1999; Peakallet al., 2000). Fluvial sensitivity to subsidence is, however, dependenton the interplay of a number of different factors. In a simulationmodel of alluvial stratigraphy, Bridge and Leeder (1979) found a strongclustering trend in areas of high tectonic tilting due to a fault-created,transverse floodplain slope. In their model, this only occurred whentilting was maintained for a prolonged period of time. Mackey andBridge (1995) found that tectonic tilting caused channel-belts to shiftaway from zones of uplift and towards zones of maximum subsidence.
any, Houston, Texas 77032, USA.(C. Armstrong)., TX 77079, USA.
rights reserved.
However, in their model, if the aggradation rate is high enough tokeep pace with subsidence, no fault effect was seen. This numerical re-sult for the case of high sediment supplywas confirmed experimentallyby Hickson et al. (2005). Kim et al. (2010) demonstrated the impor-tance of the relative magnitudes of the tectonic timescale versuschannel-avulsion frequency when determining the likelihood that achannel will be redirected by subsidence. In their associated physicalexperiment, channels weremost influenced by variations in subsidenceif channel mobility was low relative to the accumulation of significantsurface relief via spatially varying subsidence rates.
Themajority of previous studies have focused on the effects of large,basin-scale extensional tilting on fluvial systems. Only a few workershave looked at the extent towhich local faulting can influence stratigra-phy.Maynard (2006) used high resolution 3D seismic data to documentfluvial response to the development of a growth fault related rolloveranticline. A series of seismic time slices imaged the evolution of a sys-tem of narrow (100's of meters wide) channels on the hanging wallside of a growth fault. The fluvial system underwent an increase in sin-uosity and avulsion frequency in response to the increase in slope creat-ed by faulting. Taha and Anderson (2008) studied channel avulsionfrequency within the Brazos River incised valley, Texas, USA. Using

121C. Armstrong et al. / Sedimentary Geology 301 (2014) 120–132
core, radiocarbon, aerial photo, and digital elevation-model data, theyexamined the effect of tilting due to a growth fault on avulsion historywithin the valley. Their results showed that a late Pleistocene nodalavulsion point was co-located at a site of active movement on a promi-nent growth fault.
The present study uses an industry-grade 3D seismic volume to ex-amine the effect of local growth faults on fluvial stratigraphy of the lateMiocene to Pliocene deposits of the Mississippi River Delta, as well asthe modern channel of the Mississippi River. The seismic volume im-aged in this study contains dozens of examples of paleo-channels,channel-belts, and valleys that cross growth faults. Most of thesegrowth faults were active for the entire Miocene to Pliocene intervaland continue to be active today (George, 2008) so the fluvial systemscrossing these faults may have been subject to significant spatial varia-tions in subsidence.
The interplay between cross streamversus downstream surface gra-dients has been proposed as a primary control onwhether or not fluvialstratigraphy is influenced by lateral differences in subsidence (Peakallet al., 2000; Kim et al., 2010). If the cross-stream slope created bygrowth faulting ismuch lower than the downstream slope, then growthfaults would not be expected to influence channel behavior. Down-stream slopes in this coastal study area are low (around 1
10;000). Field
data (Gagliano et al., 2003) show that short term, localized fault dis-placement rates can be on the order of 102 mm/year. As a result, localcross-stream gradients are likely to be more than one order of magni-tude greater than the downstream slope, yet small channels appear rel-atively insensitive to faulting. As demonstrated by Kim et al. (2010),channel mobility is also an important factor in fluvial sensitivity to
Fig. 1. Aerial extent of the Breton Sound 3D seismic survey outlined on the modern Mississurvey location (white box) along the Gulf Coast. The approximate center of the 3D seismicAccess to this seismic volume was provided by WesternGeco®; images are satellite photos
growth fault-created subsidence. If the timescale for channel avulsionis short relative to the frequency of faulting events, then an individualchannelmay avulse before feeling the effect of a fault. The relative time-scales of faulting and channel avulsion appear to be an important con-trol for small channels in this dataset.
In addition to the many small channels, the seismic volume imagedin this study shows ten individual channel-belt systems (with widthsranging from 1.5 km to 4 km) that cross growth faults. The relationshipbetween these larger systems and faults has not been previouslyaddressed. While exact avulsion frequencies cannot be constrainedfrom this dataset, channel-belts are relatively long lived features withavulsion frequencies that are likely lower than those of smaller chan-nels. It follows that for channel-belt systems, the ratio of the timescaleof avulsion to faulting is higher than for small channels. This allowsthe relative importance of timescales on the potential for fault influenceon fluvial stratigraphy to be examined.
2. Geological setting of the study area
The 1375 km2 3D seismic survey is located under Breton Sound andBarataria Bay, Louisiana, USA, approximately 50 km southeast of thecity of New Orleans and 50 km northwest of the leading edge of themodern Mississippi River Delta (Fig. 1). The seismic survey clearly im-ages channelized features within deltaic sandstone and mudstone oversubsurface depths ranging between 500 m and 2000 m. Paleo-Data,Inc. provided us with biostratigraphic data from five wells within thestudy area that places the base of this 1500 m depth interval in the latestMiocene and its top in the latest Pliocene (Straub et al., 2009).
sippi River Delta surface (white dashed lines) and regional map showing approximatesurvey is at latitude 29.468408°, longitude −89.518501° (WGS84 coordinate system).from Google Earth®.

Fig. 3. Projections of fault planes overlain on a satellite photo; blue indicates abasinward fault dip and red indicates a landward dip. See Fig. 1 for regional location.
122 C. Armstrong et al. / Sedimentary Geology 301 (2014) 120–132
2.1. Growth faulting
The large volume of terrigenous sediment deposited from the Mio-cene to Recent hasmaintained an ensemble of active growth faultswithinthe survey area. Growth strata preserved on the downthrown sides offaults show that these structures are contemporaneous with deposition(George, 2008) and have listric fault planes that flatten with depth.These faults are a result of local, gravity-driven instabilities due to rapidsediment loading and related withdrawal of the Louann Salt (Nelson,1991). Growth faults are long-lived features and, based on stratigraphicpenetration, some can be observed to persist through the seismic volumefor in excess of 20 million years. Fig. 2 shows the locations for all of thegrowth faults present within the upper 1.5 km of the seismic survey.
The seismic volume images approximately twenty-eight growthfaults. Most fault planes are from 8 to 12 kmwide, dip either basinwardor landward, and have roughly east–west oriented strikes. While theamount of surface displacement that existed on a fault at any specificpoint in geologic time is unknown, modern fault displacementsmeasuredwithin the study areahave produced up to 2 mof vertical dis-placement in the land surface (Gagliano et al., 2003). Fault offsets in-crease with depth to a maximum value of about 120 m (George,2008) at 1500 m into the subsurface, near the base of the studied strat-igraphic interval. Most of the seismically imaged faults appear to extendup to the modern land surface and some affect the modern delta mor-phology. Fig. 3 shows mapped fault planes projected onto a satellitephoto of the modern delta. As demonstrated by Gagliano et al. (2003)and George (2008) and illustrated in Fig. 3, several of these faults corre-spond to abrupt shifts from emergent wetlands to fully submergedareas of open water on the delta surface.
The high concentration of bothmappable channels and growth faultsmakes this seismic volume an ideal survey for examining the interplaybetween fluvial systems and persistent growth faulting. In addition, therange of fluvial styles imaged in the dataset allows for the effect of faultson both small channels and larger fluvial elements to be examined.
3. Methods
3.1. Seismic data
The 1375 km2 3D seismic volume, consisting of merged surveyscovering Breton Sound, Grand Lake, Black Bay, and Quarantine Bay,
Fig. 2. A perspective view of a horizon slice in the seismic data (looking to the north) showinfaults indicate shallower depths). The blue surface shows outlines of several north–south o
was acquired by WesternGeco® in 1998 and 1999. Due to the varietyof survey environments (from wetlands to shallow open marine), amix of energy sources was used during survey acquisition includingairgun, pentolite, and dynoseis. Seismic processing was completed byWesternGeco® in 2006 and lent to The University of Texas at Austinfor research use. Fig. 4 summarizes checkshot results and survey acqui-sition and processing parameters. All seismic analysis for this projectwas based off post-stack data. In the ~500 to 2000 m interval of interest,frequency rollover is about 40 Hz (Fig. 5) and P-wave velocities rangefrom 1900 to 2700 ms−1 which leads to a best case vertical resolutionof about 12 to 16 m. The seismic volume has a sampling rate of 4 ms.
g growth faults within the Miocene to Pliocene survey interval (hotter colors on growthriented late Miocene fluvial systems.

Fig. 4. The relationships between two-way travel time (TWT) and interval velocity and TWT and depth below the present-day surface derived from 5 checkshot wells in the studyarea (George, 2008). Seismic acquisition and processing parameters are also shown here.
123C. Armstrong et al. / Sedimentary Geology 301 (2014) 120–132
3.2. Mapping channels and channel-belts
To define the planform geometry of a channel or channel-belt,a pointset is first created using the digibrush tool in Landmark
Fig. 5. Amplitude spectrum for the seismic volume from approximately 500 m to 2000 mdecrease rapidly above 45 Hz.
Geoprobe™ software that defines the edges of the channelized featurealong the entire length of the channel. With the feature's edges defined,the pointset can then be converted to a surface and unflattened to bringit to a configuration that agrees with the original seismic volume. This
below the present-day surface. Frequency content peaks at about 35 Hz and begins to

124 C. Armstrong et al. / Sedimentary Geology 301 (2014) 120–132
process gives the planform geometry of the channel or channel-belt andallows width, distance along channel, curvature, slope, and sinuosity tobe calculated by recording the coordinates of channel boundaries atconsistent intervals along the channel centerline. This interval wasnever greater than one to two times the width of the channelized fea-ture being measured. Estimates of channel or channel-belt thicknesseswere obtained by defining the difference in time between the roof ofthe channel or valley and the thalweg at the same cross section loca-tions where width was recorded. Then, using time versus depth rela-tionships, time was converted to actual thickness and the width todepth ratio was calculated. No attempt to correct for compaction wasmade for thickness measurements. Similar to channels in Mohrig et al.(2000), fluvial deposits in this dataset are primarily sandy and thereforedifferential compaction effects are not expected to significantly modifychannel geometry in this depth interval. This expectation is supportedby the analysis of porosity logs from wells in the study area. Theselogs record a great deal of local variability in porosity, but the mean re-duction in porosity of sand-rich deposits between the land surface andthe base of the subsurface interval is less than ten porosity units. Addi-tionally, regional dips are low in the survey (slope of around 1
10;000) soany difference inmeasured vertical thickness versus stratigraphic thick-ness is assumed to be insignificant.
These techniques provide measurements for fluvial geometry as it ispreserved in subsurface data. The preserved stratigraphy, however, doesnot necessarily represent a fluvial system that existed at any specificpoint in time. Fluvial stratigraphy is the composite, time-transgressiveresult of erosion and sedimentation. Large fluvial systems imaged inseismic data may be the result of a large channel, the lateral migrationof a small channel over a long period of time, or the result of a numberof small, concurrently active or superimposed channels. Additionally,seismic imaging of channels is based on variations in acoustic impedancewhich may be caused by a number of factors unrelated to fluvial cut andfill processes (changes in pore pressure, changes in fluid content, thepresence of fractures, etc.). If a fluvial system's fill is similar to the
Fig. 6. Definition of channel-belt realignment angle measured at a fault crossing. Theorientation of the channel-belt relative to the strike of the fault is measured both up-stream, Vu, and downstream, Vd, of the structure. View (of channel-belt on a horizonslice in the seismic data) is from directly overhead; channel-belt is located in the NEportion of the survey approximately 1.5 km below the present surface.
surrounding lithology, then there may be no change in amplitude acrossits boundary and it will not be clearly imaged. These caveats aside, thecontinuous (i.e., contiguous and mappable over several tens of kilome-ters) nature of fluvial systems in this dataset provides strong evidencefor the robustness of this 3D seismic based fluvial analysis.
3.3. Measuring fault and channel-belt relationships
Relationships between faults and channel-belts were examined bymeasuring any changes in paleo-flow direction as the channel-beltcrossed the fault (Fig. 6). Change in channel-belt orientation was mea-sured normal to the fault strike at the channel-belt midpoint along thefault trace. The angle defining any difference between the orientationof the normal to fault strike and the direction of the channel-belt wasmeasured over a distance equal to one channel-belt width both up-stream and downstream of the fault. The difference between the up-stream and downstream angles was then calculated, producing ameasure of the change in channel-belt orientation across the fault,which is referred to as the channel-belt reorientation angle (Fig. 6).
Ameasure of themagnitude of faulting at each channel-belt locationis needed in order to compare the effect of faults on channel-belt sys-tems over differing spatial and temporal intervals. Here this is doneusing the offset ratio: the local vertical displacement on the faultdivided by the depth beneath the present-day surface where this dis-placement and channel-belt were measured (Fig. 7). Because fault dis-placement increases roughly linearly with depth (George, 2008), theoffset ratio provides a way to compare displacements throughout the~1500 m studied interval.
4. Data analysis
4.1. Distinction of channels and channel-belts in the seismic volume
Both individual channels and broader channel-belts were identifiedin the seismic data. These are distinguished by dimension (width anddepth) and planform shape. Fig. 8 shows an example of both an individ-ual channel element and a channel-belt imaged in the seismic data aswell as a modern Mississippi River analog for channel-belt develop-ment. The individual channel (Fig. 8A) averages about 200 m in widthand 20 m in depth. Channel-belts are significantly larger than individu-al channels and appear to be a result of lateral channel migration thatover time can lead to a “scoop-shaped” planform character as preservedin the seismic data (Fig. 8B). An analog for this planform geometry can
Fig. 7. Definition of offset ratio (from Gagliano, 2005). In the case where fault throw in-creases roughly linearly with depth, the offset ratio provides a simple way to comparethe magnitude of faulting at different depths within the survey.

Fig. 8. Examples of channel and channel-belt fluvial styles. A) A north–south oriented channel approximately 200 mwide (from the seismic survey). B) A channel-belt ranging fromapproximately 2 to 4 km in width (from the seismic survey). C) A modern analog (the Mississippi River in southwestern Arkansas) for the formation of a channel-belt (satelliteimage from Google Earth®).
125C. Armstrong et al. / Sedimentary Geology 301 (2014) 120–132
be seen in the modern Mississippi River a few hundred kilometers up-stream of the survey area (Fig. 8C).
Fig. 9 presents an overview of the geometry of channelized deposits inthe seismic volume. The average width and depth (i.e., thickness) werecalculated for forty-three fully mapped channelized fluvial elements.Width ranges from around 67 to 31,000 m and depth ranges from 11 to90 m. When plotted (Fig. 9), the channelized bodies from this datasetfollow a power-law scaling relationship between width and depth.Trend-lines for theminimumandmaximumwidth anddepth are also de-rived from the dataset. These show that upper and lower limits on fluvialgeometry follow a similar power law scaling relationship.
Previous work (Mohrig et al., 2010) and this study examined the re-lationship between individual channels (with 75% of measured widthsfalling below 400 m and 90% falling below 1 km) and growth faults.The results show that geometry (width and depth) and planform forthe majority of the mapped channels that intersect growth faults arenot affected by them. The width and depth for all of the 54 mapped
Fig. 9. Width (W) and depth (D) (i.e., channel or channel-belt thickness) average, minimumthe seismic dataset.
paleo-channels do not appear to have been affected by the faults in asystematic way. Fig. 10 shows variations in width to depth ratio for 11cases of channels and channel-belts that cross faults. Notice that thereexists considerable natural variability in channel-elements' width/depth (W/D) measurements with distance downstream. The minimumand maximum values for coefficient of variation (standard deviation/mean) in W/D for the 11 cases are 0.11 and 0.46, respectively, withboth the mean and median values for the coefficient of variation inW/D being 0.30. Recognizing these naturally occurring variations inW/D, it is clear to us that there is no systematic variation in width todepth ratio connected to the channel-elements crossing growth faults.Neither the individual channels nor the channel-belts appear to changetheir cross-sectional shape in response to movement across a fault.
Descriptions of one small channel (Case A) and seven large sub-surface fluvial systems (Cases B–H) are presented in this section. Allof these subsurface cases intersect and appear to be affected by oneor more growth faults.
, and maximum values for forty-three fully mapped examples of fluvial stratigraphy in

Fig. 10.Width to depth ratio versus distance for 11 cases of channels or channel-belts thatcross growth faults (where each colored line represents a different channel orchannel-belt). The red plus signs show where growth faults intersect the channels orchannel-belts. No systematic change in geometry is evident across the faults.
126 C. Armstrong et al. / Sedimentary Geology 301 (2014) 120–132
4.1.1. Case A
Fig. 11 shows a rare example where positioning of a small channelappears to be influenced by a fault. Case A is a narrow (average channelwidth is 120 m), Pliocene age channel located in the eastern portion ofthe seismic survey. For a streamwise distance of several kilometers up-stream of the fault, the channel has a low sinuosity of 1.09. Less than50 m downstream of the fault crossing, the channel abruptly turnsandflows parallel to thedownthrown edge of the hangingwall for a dis-tance exceeding 500 m before turning sharply back into the regionaltransport direction. The average measured channel width is 120 mand we observed no systematic change in either width or channel-fillthickness across the fault zone. Upstream of the fault, the channelposition is approximately 780 mbeneath the land surface; downstreamof the fault, the channel is approximately 822 m beneath the surface.The fault offset ratio with this 42 m of accumulated channel
Fig. 11. A narrow Pliocene channel aligned with the downthrown side of a mappedfault. The two probes (rectangular boxes) show the channel planform as it appears inthe amplitude volume. View is from directly overhead (2D view); hotter colors defineshallower depths for the fault plane which is dipping to the left-hand side of the figure.
displacement is about 5%. Overlaying the channel on the time-structure map for the connected stratal slice (Fig. 12) shows that theredirected segment of channel is positioned directly over the subsi-dence maximum on the downthrown side of the fault. The channelturns out of the fault zone upon reaching a local topographic high la-beled point 1 on Fig. 12 and then moves through a relative topographiclow between high points 2 and 3 in Fig. 12. A second example of an in-dividual channel position right at the edge of a growth-fault hangingwall is shown in Fig. 13. This spatial correlation between channel andfault position and the time-structure maps estimating the positioningof relative highs and lows in surface topography make up the best evi-dence we have for individual channels being redirected by local changein land-surface elevation tied to growth faulting.
4.1.2. Case B
This southwest-trending Miocene age channel-belt is located in theeastern portion of the seismic survey andwasmapped for over a 19 kmdistance (Fig. 14). Over the studied section, the channel-belt has a lowsinuosity of 1.08, an average width of 2.7 km, and an average fill thick-ness of 35 m. The channel-belt is completely cut by one southeast strik-ing growth fault and partially intersects a second growth fault that cutsthe eastern side of the channel-belt about 200 m downstream from themain fault. Only the relationship between the channel-belt and themain fault is considered here. The channel-belt approaches the faultzone at an angle of 15° from the normal to strike of the fault and exitsthe zone oriented about 2.5° from the normal to the strike of the fault.The width of the channel-belt is also observed to increase by about600 m when crossing the fault. The channel-belt crosses the fault at adepth of approximately 1800 m and is displaced 62 m for an offsetratio of 3.4%.
4.1.3. Case C
Case C is a late Miocene channel-belt located in the central portionof the seismic survey and mapped for over a distance of 21 km(Fig. 15). The channel-belt has an overall sinuosity of 1.2 and crossesan east–west trending counter-regional growth fault near the centerof the mapped reach. The channel-belt approaches the structure at a40° angle from the normal to the strike of the fault and leaves thefault zone oriented approximately 14° from normal to the strike ofthe fault. The channel-belt also increases in width across the faultfrom an average of 550 m upstream to 970 m downstream of thestructure. No corresponding change in fill thickness is resolved. Thechannel-belt crosses the fault at a subsurface depth of approximately1600 m and its two segments are offset across the fault by a verticaldistance of 75 m, yielding an offset ratio of 4.7%.
4.1.4. Case D
This south trending, lateMiocene low-sinuosity channel-belt (Fig. 16)is located in the central portion of the survey and crosses two growthfaults about 15 km apart. The fault to the south has no apparent effecton the channel-belt. This may be because the fault only intersects thewestern-most portion of the channel-belt. The fault to the north, how-ever, does seem to influence channel-belt positioning across structure.The channel-belt approaches the structure at an angle of 12° fromnormalto the strike of the fault. Downstream of the fault the channel-belt isoriented less than 3° from perpendicular to the strike of the fault. In thevicinity of the fault there is a slight narrowing of the channel-belt, froma width of 1400 m upstream to a width of 1200 m near the structure.Aswith previous cases, there is no apparent change infill thickness acrossthe fault. The channel-belt crosses this fault at approximately 1300 mdepth and displacement across the fault is 33 m giving an offset ratio of2.5%.
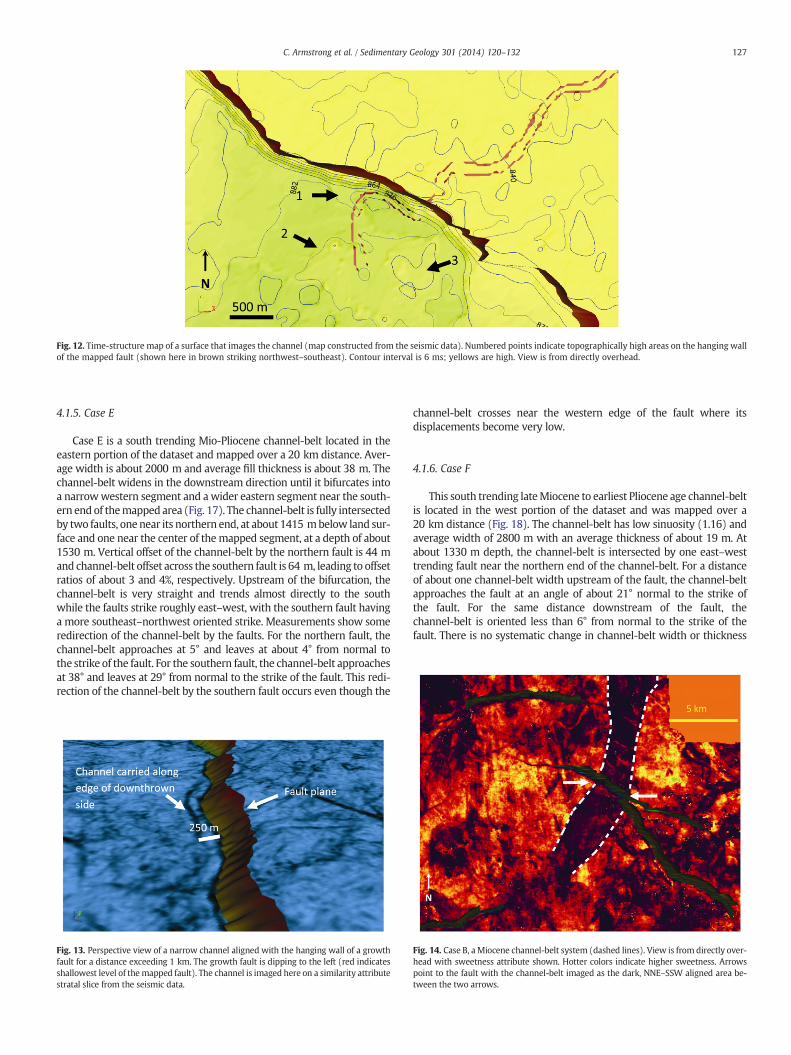
Fig. 12. Time-structure map of a surface that images the channel (map constructed from the seismic data). Numbered points indicate topographically high areas on the hanging wallof the mapped fault (shown here in brown striking northwest–southeast). Contour interval is 6 ms; yellows are high. View is from directly overhead.
127C. Armstrong et al. / Sedimentary Geology 301 (2014) 120–132
4.1.5. Case E
Case E is a south trending Mio-Pliocene channel-belt located in theeastern portion of the dataset and mapped over a 20 km distance. Aver-age width is about 2000 m and average fill thickness is about 38 m. Thechannel-belt widens in the downstream direction until it bifurcates intoa narrowwestern segment and awider eastern segment near the south-ern end of themapped area (Fig. 17). The channel-belt is fully intersectedby two faults, one near its northern end, at about 1415 mbelow land sur-face and one near the center of themapped segment, at a depth of about1530 m. Vertical offset of the channel-belt by the northern fault is 44 mand channel-belt offset across the southern fault is 64 m, leading to offsetratios of about 3 and 4%, respectively. Upstream of the bifurcation, thechannel-belt is very straight and trends almost directly to the southwhile the faults strike roughly east–west, with the southern fault havinga more southeast–northwest oriented strike. Measurements show someredirection of the channel-belt by the faults. For the northern fault, thechannel-belt approaches at 5° and leaves at about 4° from normal tothe strike of the fault. For the southern fault, the channel-belt approachesat 38° and leaves at 29° from normal to the strike of the fault. This redi-rection of the channel-belt by the southern fault occurs even though the
Fig. 13. Perspective view of a narrow channel aligned with the hanging wall of a growthfault for a distance exceeding 1 km. The growth fault is dipping to the left (red indicatesshallowest level of themapped fault). The channel is imaged here on a similarity attributestratal slice from the seismic data.
channel-belt crosses near the western edge of the fault where itsdisplacements become very low.
4.1.6. Case F
This south trending lateMiocene to earliest Pliocene age channel-beltis located in the west portion of the dataset and was mapped over a20 km distance (Fig. 18). The channel-belt has low sinuosity (1.16) andaverage width of 2800 m with an average thickness of about 19 m. Atabout 1330 m depth, the channel-belt is intersected by one east–westtrending fault near the northern end of the channel-belt. For a distanceof about one channel-belt width upstream of the fault, the channel-beltapproaches the fault at an angle of about 21° normal to the strike ofthe fault. For the same distance downstream of the fault, thechannel-belt is oriented less than 6° from normal to the strike of thefault. There is no systematic change in channel-belt width or thickness
Fig. 14. Case B, a Miocene channel-belt system (dashed lines). View is from directly over-head with sweetness attribute shown. Hotter colors indicate higher sweetness. Arrowspoint to the fault with the channel-belt imaged as the dark, NNE–SSW aligned area be-tween the two arrows.

Fig. 15. Case C, a lateMiocene channel-belt system (highlighted). View is fromdirectly over-headwith sweetness attribute shown. Hotter colors indicate higher values for the sweetnessattribute. The arrow points to where the fault intersects the channel-belt.
Fig. 16. Case D, a late Miocene channel-belt system (highlighted). View is from directlyoverhead on a map of the sweetness attribute. Hotter colors indicate higher sweetnessvalues. The arrow points to where the fault intersects the channel-belt.
Fig. 17. Case E, a Mio-Pliocene channel-belt (highlighted). View is from directly over-head with sweetness attribute shown. Hotter colors indicate higher sweetness. The ar-rows point to where the faults intersect the channel-belt.
128 C. Armstrong et al. / Sedimentary Geology 301 (2014) 120–132
across the fault. Total displacement across the fault is 52 m leading to anoffset ratio of about 4%.
4.1.7. Case G
This south–southwest trending Pliocene channel-belt is located inthe eastern portion of the survey and was mapped for over a 23 kmdistance (Fig. 19). The channel-belt crosses two southeast–northwesttrending faults near the center of the mapped channel-belt. Withinmost of the channel-belt, the two faults are separated by only a fewhundred meters and so are measured as a single faulting event. Up-stream of the fault, the channel-belt approaches at an angle of 18°normal to the strike of the fault. Downstream of the fault, thechannel-belt is oriented less than 1° normal to the strike of thefault. The average width is 3400 m and average thickness is 32 m.There is no systematic change in channel-belt geometry across thefault. The channel-belt intersects the faults at about 1400 m depthand is displaced a total of 96 m for an offset ratio of about 7%. Thishigh offset ratio is a result of the channel-belt being displaced byboth faults.
4.1.8. Case H
Case H is a Pliocene age south trending channel-belt located in thecentral portion of the dataset that has very low sinuosity at 1.03 over10 km channel-belt distance (Fig. 20). The channel-belt crosses nearthe center of an east–west trending growth fault and positioning ap-pears to be influenced by the fault. For one channel-belt width up-stream of the fault, the channel-belt approaches at an angle of 24°
normal to the strike of the fault. For the same distance downstreamof the fault, the channel-belt is oriented less than 1° from normal tothe strike of the fault. Width increases from an average of 1600 mat the fault to 2 km approximately 1 km downstream of the fault.Average width for the entire mapped system is 1700 m. The

Fig. 19. Case G, a Pliocene channel-belt (highlighted). View is from directly overheadwithsimilarity attribute shown. Darker colors indicate lower similarity. The arrow points towhere the fault intersects the channel-belt.
Fig. 18. Case F, a Mio-Pliocene channel-belt (highlighted). View is from directly over-head with sweetness attribute shown. Hotter colors indicate higher sweetness. Thearrow points to where the fault intersects the channel-belt.
129C. Armstrong et al. / Sedimentary Geology 301 (2014) 120–132
channel-belt crosses the central portion of the fault at a depth ofabout 920 m and is displaced 44 m leading to an offset ratio of 5.1%.
4.2. Channel-belt reorientation versus offset ratio
The channel-belt reorientation angle is plotted against faulting offsetratio in Fig. 21. The degree of channel-belt reorientation appears to in-crease with fault offset rate. This correlation is difficult to interpret be-cause offset ratio is a cumulative measure of displacement on a growthfault, while a channel-belt will only respond to topographic relief acrossa fault during the time interval that it is active. Despite this shortcoming,the offset ratio does provide a standardized measure of overall faultingactivity and we propose that higher values for the offset ratio are associ-ated with greater likelihoods of significant fault-generated relief at anyarbitrary time in the history of a fault.
4.3. Growth fault influence on the modern lower Mississippi River
Interestingly, the southeastern portion of the survey that containsthe highest density of growth faults (a number of which affect themodern surface) corresponds to the last major channel bend on theMississippi River before it reaches its Bird's Foot Delta. Fig. 22shows a perspective view of the Mississippi River and the subsurfacefaults that extend to the modern surface, showing a one-to-one corre-lation between the positioning of a 13 km reach of the modernMississippi River and the hanging walls of two adjacent growth faults.While correlation does not indicate causality, we propose that thissharp bend in the river is a product of channel redirection by activefaulting. Unfortunately the high density and complex pattern offaulting in this area inhibit measuring any direct relationship be-tween channel position and excess subsidence.
5. Discussion
In general, when a channel-belt emerges downstream of a fault, itis oriented roughly perpendicular to the strike of the fault. This hasbeen demonstrated for seven channel-belts that intersect faults in
Fig. 20. Case H, a Pliocene channel-belt (highlighted). View is from directly overheadwith sweetness attribute shown. Hotter colors indicate higher sweetness. The northset of arrows points to the fault with the channel-belt imaged as the high sweetnessarea between both sets of arrows.

Fig. 21. Degree of channel-belt realignment by faults as a function of the fault offset ratio.
Fig. 22. (A): Projections of fault planes which appear to affect the modern surface ofthe Mississippi River Delta overlain on a satellite image; blue indicates a basinwardfault dip and red indicates a landward dip. (B): Perspective view (from 3D seismicdata) looking to the northwest of the planform of the modern Mississippi River (darkblue) with faults interpreted as affecting the modern surface highlighted (hotter colorsare shallower). Deeper faults that do not appear to affect the surface are shown in solidlight blue.
130 C. Armstrong et al. / Sedimentary Geology 301 (2014) 120–132
the lower Mississippi. In contrast, small channels (those withwidths b 1 km) are rarely affected by faults. For over fifty examplesof small channels within the dataset, only two are clearly redirectedby faults. In addition, the small channels that are influenced by faultsare not affected in the same way as larger channel-belts. Instead of anorientation perpendicular to the strike of the fault, as in channel-belts, small channels appear directed parallel to the strike of thefault along the zone of greatest fault displacement.
5.1. Timescales of avulsion and faulting
The potential for fluvial stratigraphy to be affected by faulting isinterpreted mainly as a function of faulting timescale versus avulsiontimescale. Long term (~105 years) vertical displacement rates forfaults in this dataset are on the order of 10−2 mm/year (George,2008). However, recent short-term displacement rates for thesesame faults can be significantly higher. For two faults within the sur-vey bounds, Gagliano et al. (2003) reported displacements of up to1.4 m over a two year time period. Rationalizing the short andlong-term displacement rates on these same faults leads to a charac-teristic recurrence interval for punctuated, geologically instantaneousfaulting on the order of 104 to 105 years (Fig. 23). If a fluvial systemavulses more frequently than this, it is unlikely to be affected byfaulting. While information on common avulsion frequencies for thelate Miocene to Pliocene period studied is not available, avulsionfrequencies ranging from 500 to 5000 years have been found forHolocene channels and delta lobes (Tornqvist, 1994).
Channel-belts are interpreted to be longer-lived features than smallchannels and as a result are less likely to avulse than small fluvialsystems. These channel-belts are interpreted to be more likely to beinfluenced by faulting events than the smaller channels because oftheir lower mobility. The few small channels that are directed by faultsmost likely experienced a significant faulting event prior to avulsing.
5.2. Rollover towards a fault versus fluvial width
If a fluvial system is affected by a fault, what determines whetherit will be directed parallel or perpendicular to the strike of the fault?The alteration of fluvial orientation across a fault can be interpreted asa function of the length scale for enhanced subsidence with distancefrom a fault (Fig. 24) and the channel or channel-belt width. Faultinduced subsidence is highest at the fault and decreases to zero atsome distance from the fault. This length scale tends to be on theorder of a few hundred meters for faults in this dataset. The widthof channel-belt systems can be over an order of magnitude larger
0
1
2
3
4
5
0 100000 200000 300000
Acc
umul
ated
Dis
plac
emen
t on
G
row
th F
ault
(m
)
Accumulated Time (yr)
ContinuousDisplacementPunctuatedDisplacement
Fig. 23. Illustration of continuous fault displacement (blue line) with a rate of0.014 mm/year versus punctuated displacement (red line) with an infrequently occurring~1 m displacement.
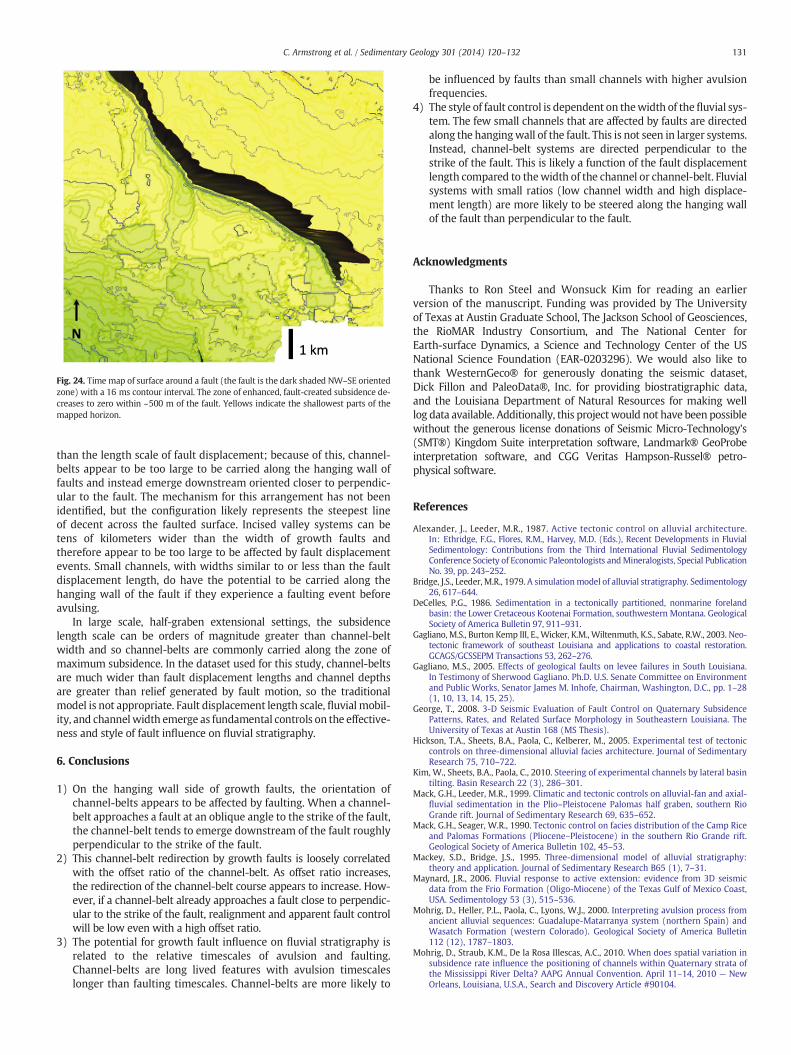
Fig. 24. Time map of surface around a fault (the fault is the dark shaded NW–SE orientedzone) with a 16 ms contour interval. The zone of enhanced, fault-created subsidence de-creases to zero within ~500 m of the fault. Yellows indicate the shallowest parts of themapped horizon.
131C. Armstrong et al. / Sedimentary Geology 301 (2014) 120–132
than the length scale of fault displacement; because of this, channel-belts appear to be too large to be carried along the hanging wall offaults and instead emerge downstream oriented closer to perpendic-ular to the fault. The mechanism for this arrangement has not beenidentified, but the configuration likely represents the steepest lineof decent across the faulted surface. Incised valley systems can betens of kilometers wider than the width of growth faults andtherefore appear to be too large to be affected by fault displacementevents. Small channels, with widths similar to or less than the faultdisplacement length, do have the potential to be carried along thehanging wall of the fault if they experience a faulting event beforeavulsing.
In large scale, half-graben extensional settings, the subsidencelength scale can be orders of magnitude greater than channel-beltwidth and so channel-belts are commonly carried along the zone ofmaximum subsidence. In the dataset used for this study, channel-beltsare much wider than fault displacement lengths and channel depthsare greater than relief generated by fault motion, so the traditionalmodel is not appropriate. Fault displacement length scale, fluvial mobil-ity, and channelwidth emerge as fundamental controls on the effective-ness and style of fault influence on fluvial stratigraphy.
6. Conclusions
1) On the hanging wall side of growth faults, the orientation ofchannel-belts appears to be affected by faulting. When a channel-belt approaches a fault at an oblique angle to the strike of the fault,the channel-belt tends to emerge downstream of the fault roughlyperpendicular to the strike of the fault.
2) This channel-belt redirection by growth faults is loosely correlatedwith the offset ratio of the channel-belt. As offset ratio increases,the redirection of the channel-belt course appears to increase. How-ever, if a channel-belt already approaches a fault close to perpendic-ular to the strike of the fault, realignment and apparent fault controlwill be low even with a high offset ratio.
3) The potential for growth fault influence on fluvial stratigraphy isrelated to the relative timescales of avulsion and faulting.Channel-belts are long lived features with avulsion timescaleslonger than faulting timescales. Channel-belts are more likely to
be influenced by faults than small channels with higher avulsionfrequencies.
4) The style of fault control is dependent on thewidth of thefluvial sys-tem. The few small channels that are affected by faults are directedalong the hangingwall of the fault. This is not seen in larger systems.Instead, channel-belt systems are directed perpendicular to thestrike of the fault. This is likely a function of the fault displacementlength compared to thewidth of the channel or channel-belt. Fluvialsystems with small ratios (low channel width and high displace-ment length) are more likely to be steered along the hanging wallof the fault than perpendicular to the fault.
Acknowledgments
Thanks to Ron Steel and Wonsuck Kim for reading an earlierversion of the manuscript. Funding was provided by The Universityof Texas at Austin Graduate School, The Jackson School of Geosciences,the RioMAR Industry Consortium, and The National Center forEarth-surface Dynamics, a Science and Technology Center of the USNational Science Foundation (EAR-0203296). We would also like tothank WesternGeco® for generously donating the seismic dataset,Dick Fillon and PaleoData®, Inc. for providing biostratigraphic data,and the Louisiana Department of Natural Resources for making welllog data available. Additionally, this projectwould not have been possiblewithout the generous license donations of Seismic Micro-Technology's(SMT®) Kingdom Suite interpretation software, Landmark® GeoProbeinterpretation software, and CGG Veritas Hampson-Russel® petro-physical software.
References
Alexander, J., Leeder, M.R., 1987. Active tectonic control on alluvial architecture.In: Ethridge, F.G., Flores, R.M., Harvey, M.D. (Eds.), Recent Developments in FluvialSedimentology: Contributions from the Third International Fluvial SedimentologyConference Society of Economic Paleontologists andMineralogists, Special PublicationNo. 39, pp. 243–252.
Bridge, J.S., Leeder, M.R., 1979. A simulationmodel of alluvial stratigraphy. Sedimentology26, 617–644.
DeCelles, P.G., 1986. Sedimentation in a tectonically partitioned, nonmarine forelandbasin: the Lower Cretaceous Kootenai Formation, southwestern Montana. GeologicalSociety of America Bulletin 97, 911–931.
Gagliano, M.S., Burton Kemp III, E., Wicker, K.M., Wiltenmuth, K.S., Sabate, R.W., 2003. Neo-tectonic framework of southeast Louisiana and applications to coastal restoration.GCAGS/GCSSEPM Transactions 53, 262–276.
Gagliano, M.S., 2005. Effects of geological faults on levee failures in South Louisiana.In Testimony of Sherwood Gagliano. Ph.D. U.S. Senate Committee on Environmentand Public Works, Senator James M. Inhofe, Chairman, Washington, D.C., pp. 1–28(1, 10, 13, 14, 15, 25).
George, T., 2008. 3-D Seismic Evaluation of Fault Control on Quaternary SubsidencePatterns, Rates, and Related Surface Morphology in Southeastern Louisiana. TheUniversity of Texas at Austin 168 (MS Thesis).
Hickson, T.A., Sheets, B.A., Paola, C., Kelberer, M., 2005. Experimental test of tectoniccontrols on three-dimensional alluvial facies architecture. Journal of SedimentaryResearch 75, 710–722.
Kim, W., Sheets, B.A., Paola, C., 2010. Steering of experimental channels by lateral basintilting. Basin Research 22 (3), 286–301.
Mack, G.H., Leeder, M.R., 1999. Climatic and tectonic controls on alluvial-fan and axial-fluvial sedimentation in the Plio–Pleistocene Palomas half graben, southern RioGrande rift. Journal of Sedimentary Research 69, 635–652.
Mack, G.H., Seager, W.R., 1990. Tectonic control on facies distribution of the Camp Riceand Palomas Formations (Pliocene–Pleistocene) in the southern Rio Grande rift.Geological Society of America Bulletin 102, 45–53.
Mackey, S.D., Bridge, J.S., 1995. Three-dimensional model of alluvial stratigraphy:theory and application. Journal of Sedimentary Research B65 (1), 7–31.
Maynard, J.R., 2006. Fluvial response to active extension: evidence from 3D seismicdata from the Frio Formation (Oligo-Miocene) of the Texas Gulf of Mexico Coast,USA. Sedimentology 53 (3), 515–536.
Mohrig, D., Heller, P.L., Paola, C., Lyons, W.J., 2000. Interpreting avulsion process fromancient alluvial sequences: Guadalupe-Matarranya system (northern Spain) andWasatch Formation (western Colorado). Geological Society of America Bulletin112 (12), 1787–1803.
Mohrig, D., Straub, K.M., De la Rosa Illescas, A.C., 2010. When does spatial variation insubsidence rate influence the positioning of channels within Quaternary strata ofthe Mississippi River Delta? AAPG Annual Convention. April 11–14, 2010 — NewOrleans, Louisiana, U.S.A., Search and Discovery Article #90104.

132 C. Armstrong et al. / Sedimentary Geology 301 (2014) 120–132
Nelson, T.H., 1991. Salt tectonics and listric-normal faulting. In: Salvador, A. (Ed.), TheGulf of Mexico Basin. Geological Society of America, the Geology of North America,v. J, pp. 73–89.
Peakall, J., 1998. Axial river evolution in response to half-graben faulting: Carson River,Nevada, U.S.A. Journal of Sedimentary Research 68, 788–799.
Peakall, J., Leeder, M.R., Best, J., Ashworth, P., 2000. River response to lateral groundtilting: a synthesis and some implications for the modeling of alluvial architecturein extensional basins. Basin Research 12, 413–424.
Straub, K., Paola, C., Mohrig, D., Wolinsky, M.A., George, T., 2009. Compensationalstacking of channelized sedimentary deposits. Journal of Sedimentary Research 79,673–688.
Taha, Z.P., Anderson, J.B., 2008. The influence of valley aggradation and listric normalfaulting on styles of river avulsion: a case study of the Brazos River, Texas, USA.Geomorphology 95 (3–4), 429–448.
Tornqvist, T.E., 1994. Middle and late Holocene avulsion history of the River Rhine(Rhine–Meuse delta, Netherlands). Geology 22, 711–714.