INFLUENCE OF ENTREPRENEURSHIP … National Business and Management Conference Ateneo de Davao...
14
4 th National Business and Management Conference Ateneo de Davao University July 22-23, 2016 482 INFLUENCE OF ENTREPRENEURSHIP EDUCATION, SOCIETAL ENHANCERS AND ENVIRONMENTAL FACTORS TO ENTREPRENEURIAL ACTIVITIES IN DAVAO REGION Candida Santos Ateneo de Davao University – School of Business and Governance [email protected] Abstract This paper aimed to look into the framework conditions that influence entrepreneurial activities in Davao Region. The study was descriptive, correlational and cross-sectional in design and applied Multiple Regression Analysis to establish the relationships of BS in Entrepreneurship education, societal enhancers and environmental factors to the promotion of entrepreneurship. The 106 respondents were purposively selected for their active business engagements from the list of graduates obtained from five higher educational institutions in the region. The respondents were from Batch 2010 to 2015 mostly aged 18 to 30 years old. Top reasons for their business endeavors were the development of new products or services, job generation, improvement of processes and entry into the international market. Most of the respondents experienced failure of business venture and majority of these ventures lasted less than a year. Lack of business know-how, insufficiency of funds, lack of business profitability, lack of market acceptability and personal reasons that included family concerns were the top five reasons for the failure. This research established that societal enhancers characterized by social and cultural norms, technological readiness and entrepreneurial aspirations were established to significantly influence entrepreneurial activities. Based on these findings, the researcher recommended the conduct of tracer studies as assessment tools of the curriculum framework of BS in Entrepreneurship education and the conduct of a similar research tapping established business owners as respondents. Key Words Entrepreneurship; SMEs; business education; startups; multiple regression Introduction The common tao, despite the improved economic rating of the Philippines, have not felt any improvement in their lives. They still feel the burden of rising commodity prices, high unemployment rate, poorly maintained transportation system, lack of physical infrastructure and increasing costs of education, among others. Weak governance, corrupt political climate, population growth rate and high unemployment rate serve as hindrances to economic growth (USAID/Philippines, 2011). The Population Division of the Department of Economic and Social Affairs of the United Nations estimated the population at 100,096,496 as of July 1, 2014. This in combination with poor and inept governance add to the continuous decline of natural resources. Still, one hopes that an
Transcript of INFLUENCE OF ENTREPRENEURSHIP … National Business and Management Conference Ateneo de Davao...

4th National Business and Management Conference
Ateneo de Davao University July 22-23, 2016
482
INFLUENCE OF ENTREPRENEURSHIP EDUCATION, SOCIETAL ENHANCERS
AND ENVIRONMENTAL FACTORS TO ENTREPRENEURIAL ACTIVITIES IN
DAVAO REGION
Candida Santos
Ateneo de Davao University – School of Business and Governance
Abstract
This paper aimed to look into the framework conditions that influence entrepreneurial
activities in Davao Region. The study was descriptive, correlational and cross-sectional in design
and applied Multiple Regression Analysis to establish the relationships of BS in Entrepreneurship
education, societal enhancers and environmental factors to the promotion of entrepreneurship. The
106 respondents were purposively selected for their active business engagements from the list of
graduates obtained from five higher educational institutions in the region.
The respondents were from Batch 2010 to 2015 mostly aged 18 to 30 years old. Top reasons
for their business endeavors were the development of new products or services, job generation,
improvement of processes and entry into the international market. Most of the respondents
experienced failure of business venture and majority of these ventures lasted less than a year. Lack
of business know-how, insufficiency of funds, lack of business profitability, lack of market
acceptability and personal reasons that included family concerns were the top five reasons for the
failure.
This research established that societal enhancers characterized by social and cultural
norms, technological readiness and entrepreneurial aspirations were established to significantly
influence entrepreneurial activities. Based on these findings, the researcher recommended the
conduct of tracer studies as assessment tools of the curriculum framework of BS in
Entrepreneurship education and the conduct of a similar research tapping established business
owners as respondents.
Key Words
Entrepreneurship; SMEs; business education; startups; multiple regression
Introduction
The common tao, despite the improved economic rating of the Philippines, have not felt
any improvement in their lives. They still feel the burden of rising commodity prices, high
unemployment rate, poorly maintained transportation system, lack of physical infrastructure and
increasing costs of education, among others.
Weak governance, corrupt political climate, population growth rate and high
unemployment rate serve as hindrances to economic growth (USAID/Philippines, 2011). The
Population Division of the Department of Economic and Social Affairs of the United Nations
estimated the population at 100,096,496 as of July 1, 2014. This in combination with poor and
inept governance add to the continuous decline of natural resources. Still, one hopes that an

4th National Business and Management Conference
Ateneo de Davao University July 22-23, 2016
483
increase in innovative business climate can translate into economic development at the grassroots
level.
The value of entrepreneurship especially from MSMEs as a potential impetus for socio-
economic growth has long been recognized. The Department of Trade and Industry in 2012, has
reported that 99.6% of the total number of registered enterprises in the Philippines are MSMEs
and that their growth is critical in promoting economic development. This puts the MSMEs as the
potential driving force “behind a resilient national economy” (Shinozaki, 2012) that can create
new businesses and new jobs thereby increasing productivity, technological innovation and
competition (Camposano, 2014).
In “Graduate Employability in Asia”, the Philippines’ unemployment rate in 2009 of 7.7%
is second only to Indonesia’s 8.4% (Valenzuela & Mendoza, 2012). Many expected this to be even
higher primarily because of the change in the definition of “unemployed” adopted by the
Philippine government in April 2005 that excluded actively seeking workers unable to get a job
for at least six months and those who were unwilling to find work of any kind. This limitation
remarkably decreased the number by 50% (IBON, 2009).
Even the most advanced of economies such as the Lisbon Strategy of the European Council
(ICF GHK, 2008) has identified the need to create jobs to sustain its economic growth in this
present global market and created a special group of experts from its member-nations specifically
to come up with definitive strategic plans. The experts zeroed in integrating entrepreneurship in
all levels of their educational system to create a knowledge economy with universities playing an
important role of providing competent, skilled and knowledgeable human resources capable of
meeting the global market demands (Tan & French-Arnold, 2012). As a result, global
competitiveness puts pressure on the educational institutions to review policies, quality,
accreditation and qualifications (Lam, 2010) while coping with the technological changes in the
modern environment.
The BS in Entrepreneurship course program was created to specifically increase business
activities and subsequently, increase job creation. Socio-cultural influence especially in closely-
knit families can enable entrepreneurship. Worldwide annual survey also emphasizes the
conditions of environmental infrastructures as important factors too. This research can shed light
on what can lead to increase in entrepreneurial activities from the perspectives of the BS in
Entrepreneurship graduates.
Method
The research design was descriptive, cross-sectional, and correlational; and used Multiple
Regression Analysis to measure and interpret the primary quantitative data gathered from the
survey. The annually conducted GEM Survey became the primary basis of this research. But unlike
it, the respondents were neither experts in the field nor adults of ages 18 to 64 of the general public,
but graduates of BS in Entrepreneurship of the Higher Education Institutes (HEIs) in Davao
Region.
The CHED Memorandum for BS in Entrepreneurship started in 2005 and total number of
graduates from the HEIs in Davao Region was estimated with the help of CHED Region XI office.
The batches from 2010 to the most recent batch in 2015 were estimated to total around 510.
The researcher asked assistance from the school administrators in tracing these graduates.
Based on the initial list provided by the universities and colleges, the researcher used purposive
4th National Business and Management Conference
Ateneo de Davao University July 22-23, 2016
484
sampling and searched social media sites, specifically Twitter and Facebook, to locate these
graduates. Sent private messages sought participation in the survey and contained a brief
explanation of the research objectives. The survey were answered through a link to the online
survey created for this purpose, by scanned email images or by marking a hard copy of the
questionnaire. Some respondents were traced through a network of friends, family and relatives of
the researcher and the other respondents.
The research looked into the relationships of independent variables, BS in
Entrepreneurship Education, Societal Enhancers and Environmental Factors to Entrepreneurial
Activities in Davao Region, in terms of job creation, promotion of innovation and in increasing
competencies of entrepreneurs.
BS in Entrepreneurship Education considered three indicators - Attitude-Building,
Pedagogy and Partnerships & Collaboration, as building blocks of a successful implementation of
the course program. Social & Cultural Norms, Aspirations and Technological Readiness were
classified as indicators for Societal Enhancers while four indicators of Environmental Factors,
Financial and Commercial Infrastructures, Legal and Physical Infrastructures. Government
Policies and R&D Transfer were adopted from GEM. The self-constructed questionnaire was
aimed at measuring the extent to which the general elements of these three independent variables
deter or embolden respondents to engage in their own businesses.
Perception was scored using a five-point Likert scale that ranged from 5 – (SA) Strongly
Agree; 4 – (A) Agree; 3 – (SWA) Somewhat Agree; 2 – (D) Disagree to 1 – (SD) Strongly
Disagree.
An odd-point scale gave the respondents the freedom to choose the middle neutral point
but at the same time forced the respondents to make a stronger stand of disagreement or agreement.
The self-constructed questionnaire was validated by the Panel of Examiners and was tested for
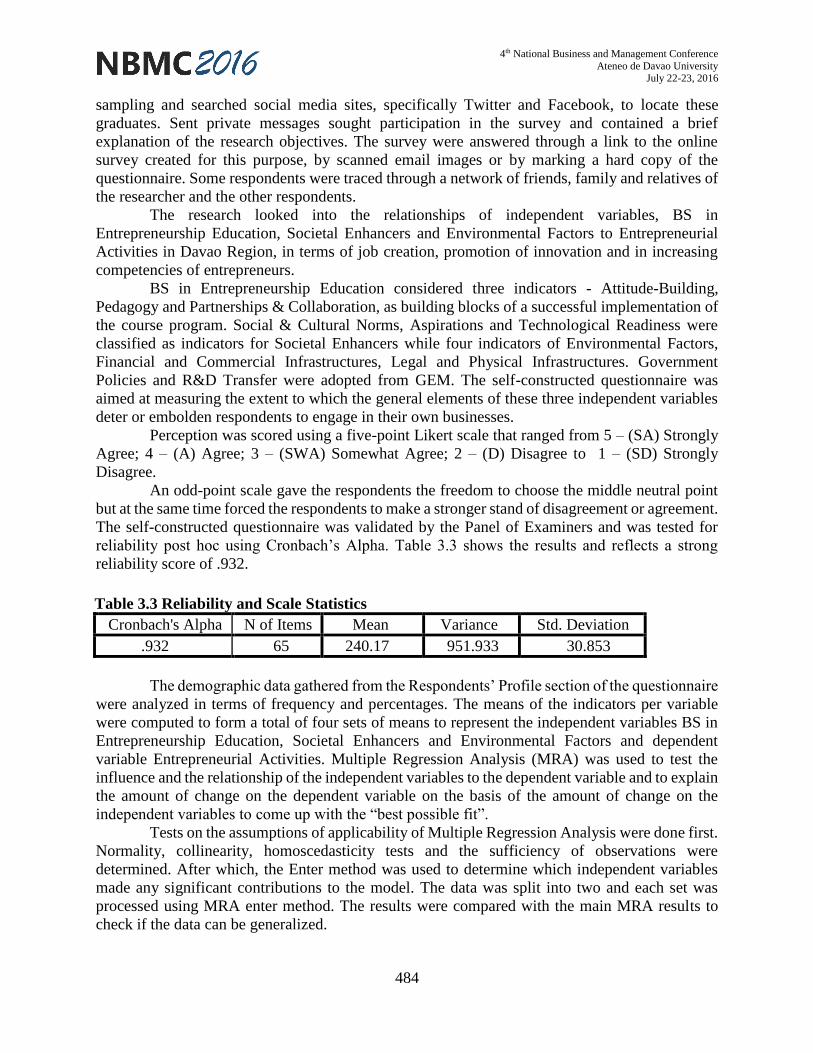
reliability post hoc using Cronbach’s Alpha. Table 3.3 shows the results and reflects a strong
reliability score of .932.
Table 3.3 Reliability and Scale Statistics
Cronbach's Alpha N of Items Mean Variance Std. Deviation
.932 65 240.17 951.933 30.853
The demographic data gathered from the Respondents’ Profile section of the questionnaire
were analyzed in terms of frequency and percentages. The means of the indicators per variable
were computed to form a total of four sets of means to represent the independent variables BS in
Entrepreneurship Education, Societal Enhancers and Environmental Factors and dependent
variable Entrepreneurial Activities. Multiple Regression Analysis (MRA) was used to test the
influence and the relationship of the independent variables to the dependent variable and to explain
the amount of change on the dependent variable on the basis of the amount of change on the
independent variables to come up with the “best possible fit”.
Tests on the assumptions of applicability of Multiple Regression Analysis were done first.
Normality, collinearity, homoscedasticity tests and the sufficiency of observations were
determined. After which, the Enter method was used to determine which independent variables
made any significant contributions to the model. The data was split into two and each set was
processed using MRA enter method. The results were compared with the main MRA results to
check if the data can be generalized.

4th National Business and Management Conference
Ateneo de Davao University July 22-23, 2016
485
Results
The research was based on a total of 106 graduates from four out of the five (4 out of 5)
universities identified by CHED Region XI Office to have produced graduates in the Region.
Respondents’ Profile
Sixty (60), comprising 57% of the respondents were female, 43 or 41% were male and
there were three respondents who did not indicate their gender. Most of the respondents came from
Batch 2014 with the oldest batch from 2010 and the youngest from 2015 while eleven respondents
did not indicate when they graduated. Table 4.1 shows the breakdown of the respondents by batch.
Table 4.1 The Number of Graduates Based on the Year Graduated
Batch Number Number of Respondents Percentage (%)
2010 5 4.72
2011 7 6.60
2012 8 7.55
2013 18 16.98
2014 45 42.45
2015 12 11.32
BLANK 11 10.38
TOTAL 106 100.00
Table 4.2 shows the number of respondents segregated by age. A total of 89 respondents
were 18 to 25 years old (rows 1 and 2), 10 were aged 26 to 30, two (2) respondents were above
30 while five respondents left this portion blank.
Table 4.2 Age Range of Respondents
Age Range Number of Respondents Percentage (%)
18 to 22 years old 40 37.74
23 to 25 years old 49 46.23
26 to 30 years old 10 9.43
Above 30 years old 2 1.89
BLANK 5 4.72
TOTAL 106 100.00
Table 4.3 shows the proportion of respondents based on their current business engagement.
A total of 85.85% were actively involved in business either as sole owner, manager or part-owner.
Fourteen (14) indicated that they were not actively engaged in business at the moment while one
respondent left this portion blank.

4th National Business and Management Conference
Ateneo de Davao University July 22-23, 2016
486
Table 4.3 Engagement in Business of the Respondents
Business Engagement Number of
Respondents
Percentage
(%)
Total
Percentage (%)
Sole owner of a business 20 18.87
85.85
Managing their family business 32 30.19
Part-owner of a business but not involved in
the operations of the business 19 17.92
Employed and in business at the same time 20 18.87
Others 14 13.21 14.15
BLANK 1 0.94
TOTAL 106 100.00 100.00
Purposive interviews were made on the 14 respondents who chose “Others” in this portion
(See Table 4.3). Table 4.4 shows the plans of these 14 respondents with regards to business.
Thirteen (13) of them (rows 1 and 2) said that they were either employed or studying while
preparing for their next start-up businesses while one was recovering from an eye surgery but will
soon be back to help in their family business.
Table 4.4 Plans of the 14 Respondents Currently Not in Business
Business Plans Number of
Respondents
Employed and presently working on start-up business within the year 10
Studying but working on start-up business within this year 3
On sick leave but was helping family business prior to surgery 1
A total of 68.87% of those engaged in business got compensation from their
establishments in the form of a salary, while 19.81% had not received any. See Table 4.5. One of
the respondents, categorized here as “others”, indicated that it was her mother who managed the
money from the business while eleven left this question unanswered.
Table 4.5 Respondents’ Compensation from Business
Category Description
Number of
Respondent
s
Percentag
e (%)
Total
Percentage (%)
has not paid my salary, so far 21 19.81 19.81
given me salary for the past 3 - 24
months 48 45.28
68.87 given me salary for the past 25 - 42
months 17 16.04
given me salary for more than 42 months 8 7.55
others 1 0.94 0.94
BLANK 11 10.38 10.38
TOTAL 106 100.00 100.00
More than half of the respondents (52.83%) started their businesses in College or right
after graduation while the rest started some years after graduation. See Table 4.6. The three (3)

4th National Business and Management Conference
Ateneo de Davao University July 22-23, 2016
487
respondents who chose “Others”, indicated that they were in business for less than a year, while
the rest left the question blank.
Table 4.6 Respondents’ Years in Business
Category Number of Respondents Percentage (%)
Since College or right after graduation 56 52.83
1 – 2 years after graduation 29 27.36
3 – 5 years after graduation 7 6.60
More than 5 years after graduation 1 0.94
Others 3 2.83
BLANK 10 9.43
TOTAL 106 100.00
Table 4.7 shows that 36.79% of the respondents engaged in business to generate jobs,
40.57% to develop new product or service and 20.75% would like to develop a new process. Only
14.15% were interested to enter the international market. The respondents could choose as many
factors as they deemed fit.
Table 4.7 Motivating Factors for Engaging in Business
Motivating Factor Number of Respondents Percentage (%)
To generate jobs 39 36.79
To develop a new product or service 43 40.57
To enter the international market 15 14.15
To develop a new process 22 20.75
Others 4 3.77
BLANK 16 15.09
Table 4.8 shows the number of respondents who failed in business a number of times.
Seventy-seven (77) of the respondents (refer to rows 2, 3 and 4) experienced failure in business.
The rest who had not experienced any were mostly involved in established family-owned
businesses.
Table 4.8 Respondents and Their Failed Business Ventures
Number of Failed Businesses Number of Respondents Percentage (%)
Never 29 27.36
Once 60 56.60
2 – 3 times 17 16.04
more than 3 times already 0 0.00
BLANK 0 0.00
TOTAL 106 100.00
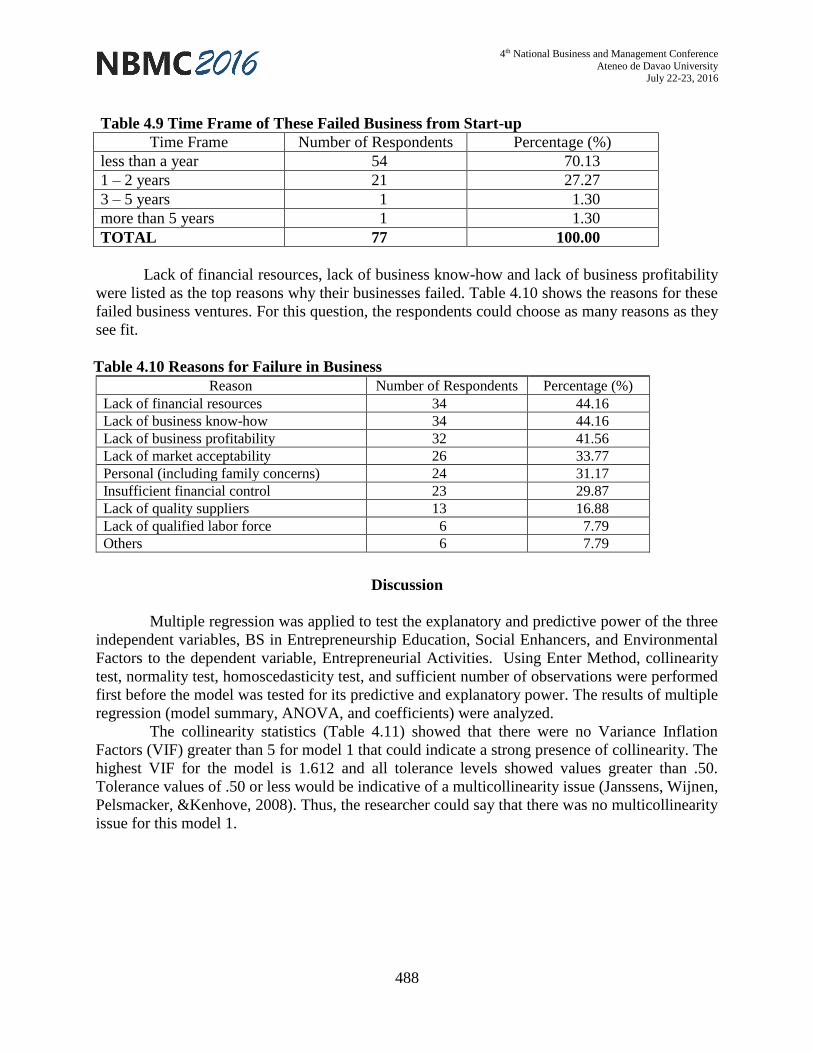
Table 4.9 shows the estimated time frame when these business ventures failed. Fifty-four
(54) respondents corresponding to 70.13% indicated that their failed business occurred during the
first few months from start-up and 21 respondents corresponding to 27.27% indicated that their
failed businesses lasted for a year or two.
4th National Business and Management Conference
Ateneo de Davao University July 22-23, 2016
488
Table 4.9 Time Frame of These Failed Business from Start-up
Time Frame Number of Respondents Percentage (%)
less than a year 54 70.13
1 – 2 years 21 27.27
3 – 5 years 1 1.30
more than 5 years 1 1.30
TOTAL 77 100.00
Lack of financial resources, lack of business know-how and lack of business profitability
were listed as the top reasons why their businesses failed. Table 4.10 shows the reasons for these
failed business ventures. For this question, the respondents could choose as many reasons as they
see fit.
Table 4.10 Reasons for Failure in Business
Reason Number of Respondents Percentage (%)
Lack of financial resources 34 44.16
Lack of business know-how 34 44.16
Lack of business profitability 32 41.56
Lack of market acceptability 26 33.77
Personal (including family concerns) 24 31.17
Insufficient financial control 23 29.87
Lack of quality suppliers 13 16.88
Lack of qualified labor force 6 7.79
Others 6 7.79
Discussion
Multiple regression was applied to test the explanatory and predictive power of the three
independent variables, BS in Entrepreneurship Education, Social Enhancers, and Environmental
Factors to the dependent variable, Entrepreneurial Activities. Using Enter Method, collinearity
test, normality test, homoscedasticity test, and sufficient number of observations were performed
first before the model was tested for its predictive and explanatory power. The results of multiple
regression (model summary, ANOVA, and coefficients) were analyzed.
The collinearity statistics (Table 4.11) showed that there were no Variance Inflation
Factors (VIF) greater than 5 for model 1 that could indicate a strong presence of collinearity. The
highest VIF for the model is 1.612 and all tolerance levels showed values greater than .50.
Tolerance values of .50 or less would be indicative of a multicollinearity issue (Janssens, Wijnen,
Pelsmacker, &Kenhove, 2008). Thus, the researcher could say that there was no multicollinearity
issue for this model 1.

4th National Business and Management Conference
Ateneo de Davao University July 22-23, 2016
489
Table 4.11 Coefficients
Model
Unstandardized
Coefficients
Standardized
Coefficients t Sig.
Correlations Collinearity
Statistics
B Std.
Error Beta
Zero-
order Partial Part Tolerance VIF
1
(Constant) 1.014 .373 2.716 .008
BS in
Entrepreneurship
Education
-.009 .067 -.011 -.135 .893 .222 -.013 -
.010
.812 1.231
Societal
Enhancers
.753 .108 .627 6.952 .000 .662 .567 .515 .673 1.486
Environmental
Factors
.055 .076 .068 .724 .471 .417 .071 .054 .620 1.612
a. Dependent Variable: Entrepreneurial Activities
On Normality Test, the Kolmogrov-Smirnov and Shapiro-Wilk tests on standardized
residuals were performed to determine the null hypothesis that there is no normality among the
observed variables. The results showed (see Table 4.12) that the p values of .200 and .180 for the
Kolmogorov-Smirnov and Shapiro-Wilk tests, respectively, were not significant. Since these
values were greater than .05, the null hypothesis that corresponds to a normal distribution of the
variable was accepted.
Table 4.12 Tests of Normality
Kolmogorov-Smirnova Shapiro-Wilk
Statistic df Sig. Statistic df Sig.
Standardized Residual .068 106 .200* .983 106 .180
*. This is a lower bound of the true significance.
a. Lilliefors Significance Correction
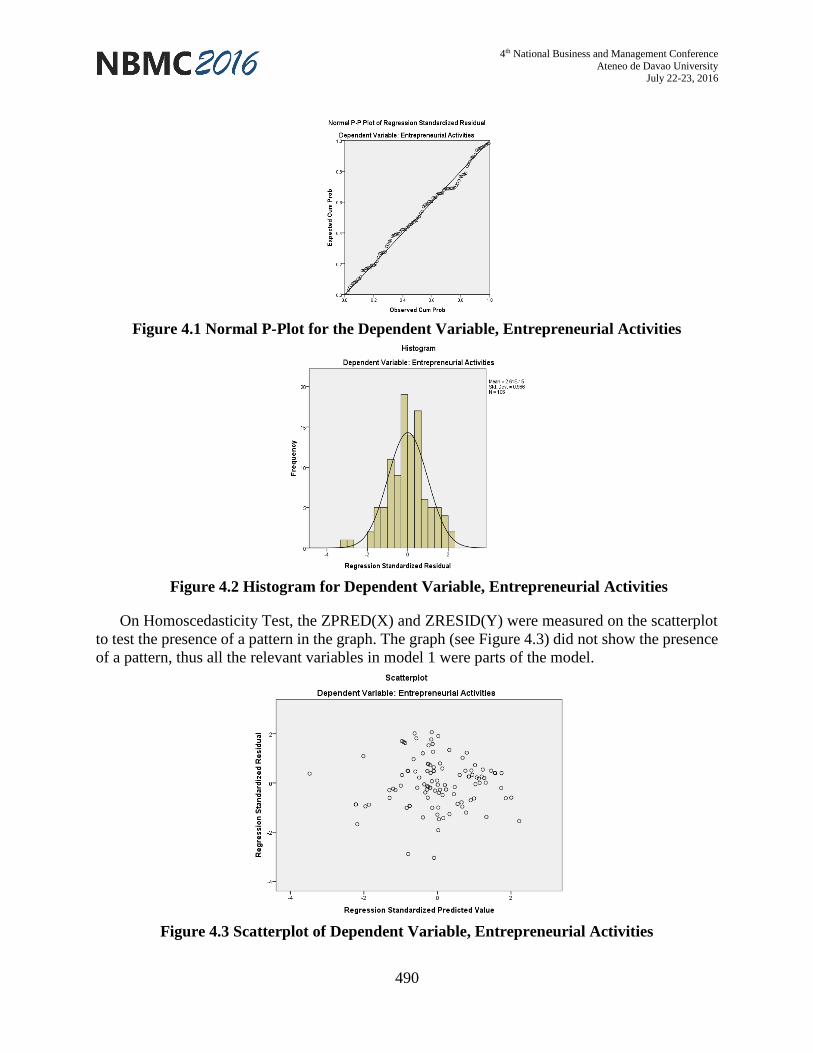
Moreover, a close fit between the dotted line and the 45-degree curve (see Figure 4.1) was
necessary to guarantee normality (Janssens, Wijnen, Pelsmacker, &Kenhove, 2008). Thus, the data
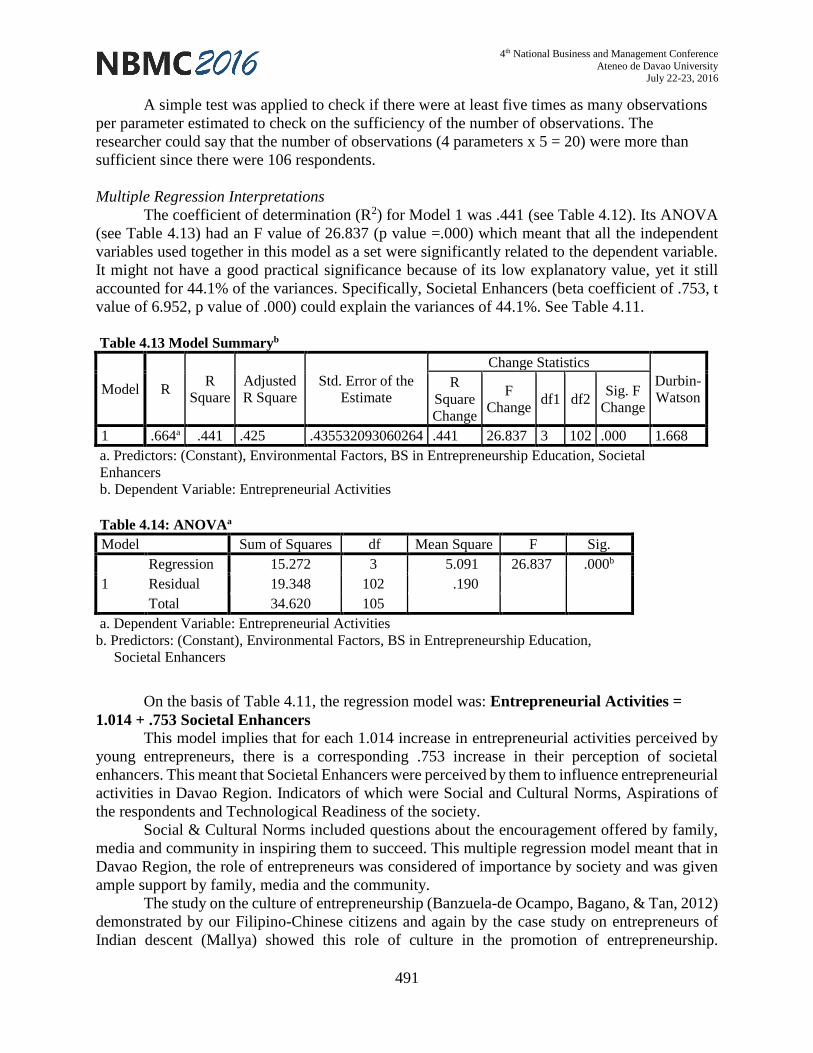
(observed variables) were normally distributed. The normal distribution histogram for the
dependent variable (See Figure 4.2) also manifested no normality problem. Thus, the data passed
the normality tests.
4th National Business and Management Conference
Ateneo de Davao University July 22-23, 2016
490
Figure 4.1 Normal P-Plot for the Dependent Variable, Entrepreneurial Activities
Figure 4.2 Histogram for Dependent Variable, Entrepreneurial Activities
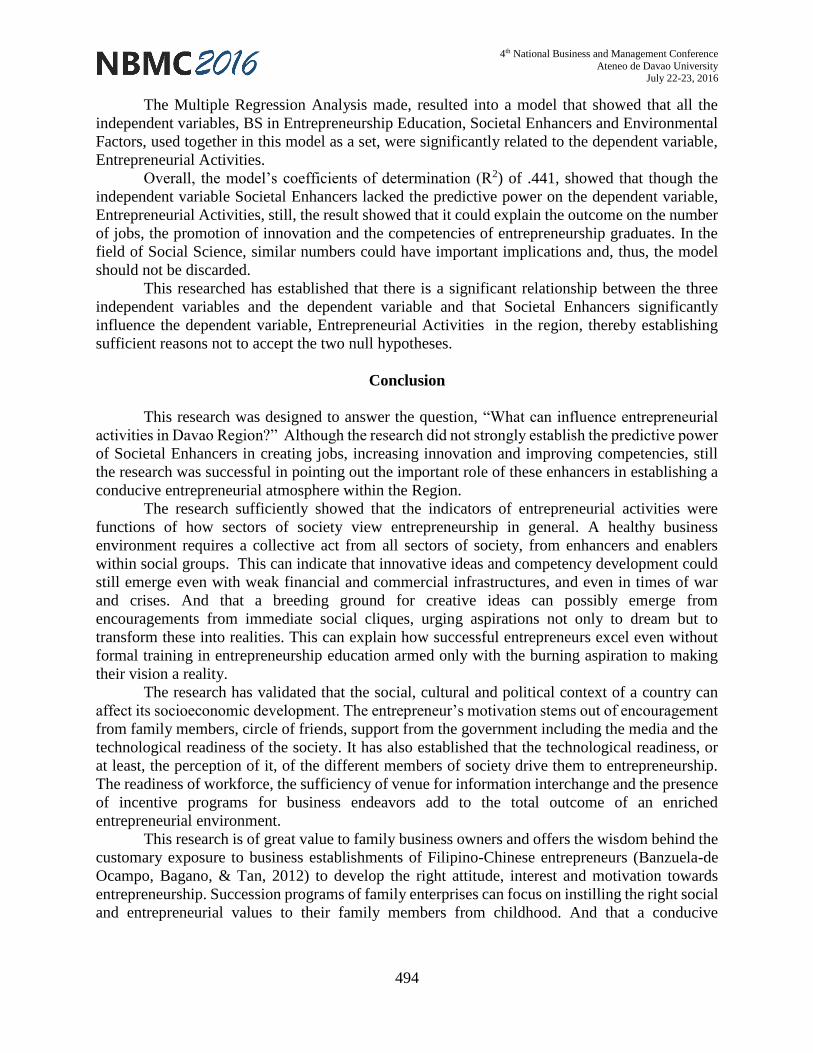
On Homoscedasticity Test, the ZPRED(X) and ZRESID(Y) were measured on the scatterplot
to test the presence of a pattern in the graph. The graph (see Figure 4.3) did not show the presence
of a pattern, thus all the relevant variables in model 1 were parts of the model.
Figure 4.3 Scatterplot of Dependent Variable, Entrepreneurial Activities
4th National Business and Management Conference
Ateneo de Davao University July 22-23, 2016
491
A simple test was applied to check if there were at least five times as many observations
per parameter estimated to check on the sufficiency of the number of observations. The
researcher could say that the number of observations (4 parameters x 5 = 20) were more than
sufficient since there were 106 respondents.
Multiple Regression Interpretations
The coefficient of determination (R2) for Model 1 was .441 (see Table 4.12). Its ANOVA
(see Table 4.13) had an F value of 26.837 (p value =.000) which meant that all the independent
variables used together in this model as a set were significantly related to the dependent variable.
It might not have a good practical significance because of its low explanatory value, yet it still
accounted for 44.1% of the variances. Specifically, Societal Enhancers (beta coefficient of .753, t
value of 6.952, p value of .000) could explain the variances of 44.1%. See Table 4.11.
Table 4.13 Model Summaryb
Model R R
Square
Adjusted
R Square
Std. Error of the
Estimate
Change Statistics
Durbin-
Watson R
Square
Change
F
Change df1 df2
Sig. F
Change
1 .664a .441 .425 .435532093060264 .441 26.837 3 102 .000 1.668
a. Predictors: (Constant), Environmental Factors, BS in Entrepreneurship Education, Societal
Enhancers
b. Dependent Variable: Entrepreneurial Activities
Table 4.14: ANOVAa
Model Sum of Squares df Mean Square F Sig.
1
Regression 15.272 3 5.091 26.837 .000b
Residual 19.348 102 .190
Total 34.620 105
a. Dependent Variable: Entrepreneurial Activities
b. Predictors: (Constant), Environmental Factors, BS in Entrepreneurship Education,
Societal Enhancers
On the basis of Table 4.11, the regression model was: Entrepreneurial Activities =
1.014 + .753 Societal Enhancers This model implies that for each 1.014 increase in entrepreneurial activities perceived by
young entrepreneurs, there is a corresponding .753 increase in their perception of societal
enhancers. This meant that Societal Enhancers were perceived by them to influence entrepreneurial
activities in Davao Region. Indicators of which were Social and Cultural Norms, Aspirations of
the respondents and Technological Readiness of the society.
Social & Cultural Norms included questions about the encouragement offered by family,
media and community in inspiring them to succeed. This multiple regression model meant that in
Davao Region, the role of entrepreneurs was considered of importance by society and was given
ample support by family, media and the community.
The study on the culture of entrepreneurship (Banzuela-de Ocampo, Bagano, & Tan, 2012)
demonstrated by our Filipino-Chinese citizens and again by the case study on entrepreneurs of
Indian descent (Mallya) showed this role of culture in the promotion of entrepreneurship.

4th National Business and Management Conference
Ateneo de Davao University July 22-23, 2016
492
Entrepreneurs like Brijmohan Lal Munjal invested on relationships with family and community
members to build his company, the Hero Group. G.D. Birla established the Birla Brothers Ltd.
armed with generations of business traditions started by his grandfather. Both success stories
demonstrated the role of social and cultural norms in promoting entrepreneurship.
The study on the Entrepreneurship graduates of St. Paul University in Manila (Bignotia,
2014) established that majority of its respondents found the lack of support from family as one
that could inhibit them from going into business. This was similarly reflected by 31% of the
research respondents who identified personal including family problems as one of the reasons for
their failed business ventures (see Table 4.10).
Technological Readiness, as an indicator, included supply of skilled labor, training on
technological developments, and venue for sharing of Science-related researches and inventions
as well as incentives on modern social issues like green technologies. The fact that this indicator
was seen to be significant was aligned with the respondents’ aspiration to go into business for the
development of new products or services and for the development of new processes. (See Table
4.7.) It was also understandable for the respondents to see technological readiness as an
important element of entrepreneurship since they perceived the lack of quality suppliers,
qualified labor force and market acceptability as reasons behind their failure of previous business
engagements. (See Table 4.10.)
Aspirations focus on the motivating factors and rewards of entrepreneurship in terms of
work-life balance, providing employment, creating new products and competing in the global
market. The significance of aspirations as an indicator could be related to the case study about
Sikap Buhay on informal women entrepreneurs (Pascual, 2008) that accounted its success to the
self-confidence gained by the women and to the support that the family members gave them.
Table 4.15 was lifted from an article from Malawi Medical Journal (Mukaka, 2012) used
as a guide in the use of correlation coefficient in medical research. This was used to interpret the
degree of correlation of the variables in this research.
Table 4.15 Guidelines for Interpretation of Correlation Coefficients
Correlation Coefficient Interpretation
90 to 1.00 (−.90 to −1.00) Very high positive (negative) correlation
.70 to .90 (−.70 to −.90) High positive (negative) correlation
.50 to .70 (−.50 to −.70) Moderate positive (negative) correlation
.30 to .50 (−.30 to −.50) Low positive (negative) correlation
.00 to .30 (.00 to −.30) negligible correlation
Source: Malawi Medical Journal (2012)
The summary and interpretation of the strength of correlation (Table 4.15) between
independent variables, and between independent and dependent variables were performed using
MRA correlations output. The results showed that the independent variables had low or moderate
positive correlation with each other. On the other hand, the correlations between independent and
dependent variables showed that variables had either moderate positive or low positive or
negligible correlation.

4th National Business and Management Conference
Ateneo de Davao University July 22-23, 2016
493
Table 4.16 Correlations of Variables
Correlations between Independent Variables Remarks
1. B.S. in Entrepreneurship Education was weakly correlated
with Environmental Factors (.420, p value .000) and Societal
Enhancers (.326, p value .000)
Null Hypothesis
rejected
2. Societal Enhancers was moderately correlated with
Environmental Factors (.563, p value .000).
Null Hypothesis
rejected
Correlations between Independent and Dependent
Variables Remarks
1. Entrepreneurial Activities was moderately correlated with
Social enhancers (.662, p value .000), weakly correlated with
Environmental Factors (.417, p value .000), and very weakly
correlated with B.S. in Entrepreneurship Education (.222, p
value .011)
Null Hypothesis
rejected
Based on Split-Samples (Table 4.17), the data were validated for generalization. The
original data were split into 2 samples using research randomizer software. The data for Split
Sample 1 and Split Sample 2 when compared with the data on the Main Sample were not vastly
different. Thus, the data can be generalized across the population.
Table 4.17: Comparison of Main Sample with Split Samples
Model Component Main Sample
(n=106)
Split Sample
1 (n=53)
Split Sample
2 (n=53)
Model 1 (using Enter Method)
R2
Adjusted R2
Standard error of the estimate
.441
.425
.435532
.432
.398
.463315
.483
.451
.406204
BS in Entrepreneurship Education:
independent variable
Beta Coefficient
T Value
P Value
Not entered
Not entered
Not entered
Social Enhancers: independent variable
Beta Coefficient
T Value
P Value
.753
6.952
.000
.692
4.497
.000
.810
5.240
.000
Environmental Factors: independent
variable
Beta Coefficient
T Value
P Value
Not entered
Not entered
Not entered
The research has established the profile of Entrepreneurship graduates engaged in business.
There was a slight difference in the number of female entrepreneurs over male entrepreneurs.
Majority of them were below 30 years old, failed in business and believed in giving compensation
for their efforts in their own business.
4th National Business and Management Conference
Ateneo de Davao University July 22-23, 2016
494
The Multiple Regression Analysis made, resulted into a model that showed that all the
independent variables, BS in Entrepreneurship Education, Societal Enhancers and Environmental
Factors, used together in this model as a set, were significantly related to the dependent variable,
Entrepreneurial Activities.
Overall, the model’s coefficients of determination (R2) of .441, showed that though the
independent variable Societal Enhancers lacked the predictive power on the dependent variable,
Entrepreneurial Activities, still, the result showed that it could explain the outcome on the number
of jobs, the promotion of innovation and the competencies of entrepreneurship graduates. In the
field of Social Science, similar numbers could have important implications and, thus, the model
should not be discarded.
This researched has established that there is a significant relationship between the three
independent variables and the dependent variable and that Societal Enhancers significantly
influence the dependent variable, Entrepreneurial Activities in the region, thereby establishing
sufficient reasons not to accept the two null hypotheses.
Conclusion
This research was designed to answer the question, “What can influence entrepreneurial
activities in Davao Region?” Although the research did not strongly establish the predictive power
of Societal Enhancers in creating jobs, increasing innovation and improving competencies, still
the research was successful in pointing out the important role of these enhancers in establishing a
conducive entrepreneurial atmosphere within the Region.
The research sufficiently showed that the indicators of entrepreneurial activities were
functions of how sectors of society view entrepreneurship in general. A healthy business
environment requires a collective act from all sectors of society, from enhancers and enablers
within social groups. This can indicate that innovative ideas and competency development could
still emerge even with weak financial and commercial infrastructures, and even in times of war
and crises. And that a breeding ground for creative ideas can possibly emerge from
encouragements from immediate social cliques, urging aspirations not only to dream but to
transform these into realities. This can explain how successful entrepreneurs excel even without
formal training in entrepreneurship education armed only with the burning aspiration to making
their vision a reality.
The research has validated that the social, cultural and political context of a country can
affect its socioeconomic development. The entrepreneur’s motivation stems out of encouragement
from family members, circle of friends, support from the government including the media and the
technological readiness of the society. It has also established that the technological readiness, or
at least, the perception of it, of the different members of society drive them to entrepreneurship.
The readiness of workforce, the sufficiency of venue for information interchange and the presence
of incentive programs for business endeavors add to the total outcome of an enriched
entrepreneurial environment.
This research is of great value to family business owners and offers the wisdom behind the
customary exposure to business establishments of Filipino-Chinese entrepreneurs (Banzuela-de
Ocampo, Bagano, & Tan, 2012) to develop the right attitude, interest and motivation towards
entrepreneurship. Succession programs of family enterprises can focus on instilling the right social
and entrepreneurial values to their family members from childhood. And that a conducive

4th National Business and Management Conference
Ateneo de Davao University July 22-23, 2016
495
environment of support from family, friends and social groups spell the realization of a succession
program.
This research has serious implications to CHED’s Policies, Standards and Guidelines
(PSGs) of the BS in Entrepreneurship course program. The course program’s elements must be
examined and evaluated carefully for relevance and applicability to the real world. The assessment
made on ASEAN’s member countries (ERIA & OECD, 2014) found that the Philippines got the
highest score in the promotion of entrepreneurial education in comparison to the other member
countries. It also found that the country still has to work towards its improvement. And if the
government is serious in seeing entrepreneurship as a driving force of economy then they have to
take notice and look at the methods on how to translate these educational endeavors towards
shaping highly-motivated entrepreneurs. The case study conducted by Dela Salle University (Aure,
Alonday, Kang & Mapue, 2013) can be replicated as it dwelt primarily on the importance of
motivation building as the anchor towards sustainability of entrepreneurial endeavors.