Influence of Cement-Voids Ratio on Stress-Dilatancy Behavior of Artificially Cemented Sand
10
Influence of Cement-Voids Ratio on Stress-Dilatancy Behavior of Artificially Cemented Sand Nilo Cesar Consoli, Ph.D. 1 ; Rodrigo Caberlon Cruz, D.Sc. 2 ; António Viana da Fonseca, D.Sc. 3 ; and Matthew Richard Coop, Ph.D. 4 Abstract: The addition of cement is an interesting remediation technique when the project requires improvement of the local soil for the construction of pavement base layers, in slope protection of earth dams and canal linings, as a support layer for shallow foundations and to prevent sand liquefaction. The present study was carried out to quantify the influence of the amount of cement and the porosity in a cement- voids ratio, defined as the ratio between the volume of cement and the volume of voids of a mixture, on the stress-dilatancy behavior of an artificially cemented sand. A program of triaxial compression tests considering three distinct cement-voids ratios was carried out with two combinations of volumes of voids and volumes of cement at each cement-voids ratio. Results showed that the stress-dilatancy relationship is alike for a given cement-voids ratio and that the stress-strain behavior is also similar. The cement-voids ratio is therefore an appropriate parameter to assess stress-dilatancy of the sand-cement mixture studied. DOI: 10.1061/(ASCE)GT.1943-5606.0000565. © 2012 American Society of Civil Engineers. CE Database subject headings: Stress; Dilatancy; Cement; Triaxial tests; Voids; Sand (soil type). Author keywords: Stress-dilatancy; Cement-voids ratio; Triaxial tests; Soil-cement. Introduction The use of traditional techniques in earthworks, such as engi- neered fills, canal lining, and subgrades for pavements, often faces problems because of high costs and/or environmental issues. Such problems are primarily because of the need for borrowing great volumes of good quality material (which might be difficult to find nearby, and the transportation costs could be high) and dis- posing the local soil in deposits. In these cases, an alternative is the improvement of the local soil by the addition of cementitious materials [e.g., Porbaha et al. (1998, 2000); Consoli et al. (2003, 2006, 2008, 2009a, 2009b); Thomé et al. (2005), Rattley et al. (2008)]. In recent studies, the effects of the soil-cement ratio have been investigated by numerous laboratory studies aimed at finding the amount of cement that meets the target properties in tensile and compressive strength [e.g., Consoli et al. (2010)]. Of particular im- portance for soil-cement mixtures is the interaction between the density of the soil and the amount of cement used, as investigated, for example, for artificially cemented carbonate sands by Huang and Airey (1993), both having a strong influence on the yield envelope and peak strength. Consoli et al. (2007) established a unique dosage methodology on the basis of rational criteria where the cement-voids ratio plays a fundamental role in the assessment of the target unconfined compressive strength. This study, there- fore. aims to quantify the influence and interaction of both the amount of cement and the porosity on the stress: dilatancy behavior of an artificially cemented quartzitic sand by means of a cement- voids ratio. Experimental Program The experimental program was carried out in two parts. First, the geotechnical properties of the soil were characterized. Then, a num- ber of triaxial compression tests were undertaken on specimens with a range of confining pressures, voids ratios, and quantities of cement. Materials The sand used in the testing was obtained from the region of Osorio, in Southern Brazil, being classified (ASTM 1993) as a nonplastic uniform fine sand (see Fig. 1) with a rounded particle shape (see Fig. 2) and a specific gravity of the solids of 2.63. Mineralogical analysis showed that sand particles are predominantly quartz. The grain size is purely fine sand with a mean effective diameter (D 50 ) of 0.16 mm and uniformity and curvature coefficients of 1.9 and 1.2, respectively. The minimum (e min ) and maximum (e max ) void ratios are 0.6 and 0.9, respectively. Portland cement of high initial strength (Type III) was used as the cementing agent. Its fast gain of strength allowed the adoption of a 7-day curing period. The specific gravity of the cement grains is 3.15. Distilled water was used for the characterization tests, but for the unconfined compression and triaxial samples, tap water was used. 1 Associate Professor, Dept. of Civil Engineering, Federal Univ. of Rio Grande do Sul, Porto Alegre, Rio Grande do Sul, Brazil. (corresponding author). E-mail: [email protected] 2 Research Fellow, Federal Univ. of Rio Grande do Sul, Porto Alegre, Rio Grande do Sul, Brazil. E-mail: [email protected] 3 Associate Professor, Faculty of Engineering, Univ. of Porto, Porto, Portugal. E-mail: [email protected] 4 Professor, City Univ. of Hong Kong, Hong Kong, China; formerly, Imperial College London, London, UK. E-mail: mrcoop@cityu .edu.hk Note. This manuscript was submitted on March 10, 2010; approved on May 9, 2011; published online on May 11, 2011. Discussion period open until June 1, 2012; separate discussions must be submitted for individual papers. This paper is part of the Journal of Geotechnical and Geoenvir- onmental Engineering, Vol. 138, No. 1, January 1, 2012. ©ASCE, ISSN 1090-0241/2012/1-100–109/$25.00. 100 / JOURNAL OF GEOTECHNICAL AND GEOENVIRONMENTAL ENGINEERING © ASCE / JANUARY 2012 J. Geotech. Geoenviron. Eng. 2012.138:100-109. Downloaded from ascelibrary.org by Saskatchewan University on 09/25/12. For personal use only. No other uses without permission. Copyright (c) 2012. American Society of Civil Engineers. All rights reserved.
-
Upload
matthew-richard -
Category
Documents
-
view
214 -
download
0
Transcript of Influence of Cement-Voids Ratio on Stress-Dilatancy Behavior of Artificially Cemented Sand

Influence of Cement-Voids Ratio on Stress-DilatancyBehavior of Artificially Cemented Sand
Nilo Cesar Consoli, Ph.D.1; Rodrigo Caberlon Cruz, D.Sc.2;António Viana da Fonseca, D.Sc.3; and Matthew Richard Coop, Ph.D.4
Abstract: The addition of cement is an interesting remediation technique when the project requires improvement of the local soil for theconstruction of pavement base layers, in slope protection of earth dams and canal linings, as a support layer for shallow foundations and toprevent sand liquefaction. The present study was carried out to quantify the influence of the amount of cement and the porosity in a cement-voids ratio, defined as the ratio between the volume of cement and the volume of voids of a mixture, on the stress-dilatancy behavior of anartificially cemented sand. A program of triaxial compression tests considering three distinct cement-voids ratios was carried out with twocombinations of volumes of voids and volumes of cement at each cement-voids ratio. Results showed that the stress-dilatancy relationship isalike for a given cement-voids ratio and that the stress-strain behavior is also similar. The cement-voids ratio is therefore an appropriateparameter to assess stress-dilatancy of the sand-cement mixture studied. DOI: 10.1061/(ASCE)GT.1943-5606.0000565. © 2012 AmericanSociety of Civil Engineers.
CE Database subject headings: Stress; Dilatancy; Cement; Triaxial tests; Voids; Sand (soil type).
Author keywords: Stress-dilatancy; Cement-voids ratio; Triaxial tests; Soil-cement.
Introduction
The use of traditional techniques in earthworks, such as engi-neered fills, canal lining, and subgrades for pavements, often facesproblems because of high costs and/or environmental issues. Suchproblems are primarily because of the need for borrowing greatvolumes of good quality material (which might be difficult tofind nearby, and the transportation costs could be high) and dis-posing the local soil in deposits. In these cases, an alternative isthe improvement of the local soil by the addition of cementitiousmaterials [e.g., Porbaha et al. (1998, 2000); Consoli et al. (2003,2006, 2008, 2009a, 2009b); Thomé et al. (2005), Rattley et al.(2008)].
In recent studies, the effects of the soil-cement ratio have beeninvestigated by numerous laboratory studies aimed at finding theamount of cement that meets the target properties in tensile andcompressive strength [e.g., Consoli et al. (2010)]. Of particular im-portance for soil-cement mixtures is the interaction between thedensity of the soil and the amount of cement used, as investigated,for example, for artificially cemented carbonate sands by Huangand Airey (1993), both having a strong influence on the yield
envelope and peak strength. Consoli et al. (2007) established aunique dosage methodology on the basis of rational criteria wherethe cement-voids ratio plays a fundamental role in the assessmentof the target unconfined compressive strength. This study, there-fore. aims to quantify the influence and interaction of both theamount of cement and the porosity on the stress: dilatancy behaviorof an artificially cemented quartzitic sand by means of a cement-voids ratio.
Experimental Program
The experimental program was carried out in two parts. First, thegeotechnical properties of the soil were characterized. Then, a num-ber of triaxial compression tests were undertaken on specimenswith a range of confining pressures, voids ratios, and quantitiesof cement.
Materials
The sand used in the testing was obtained from the region of Osorio,in Southern Brazil, being classified (ASTM 1993) as a nonplasticuniform fine sand (see Fig. 1) with a rounded particle shape (seeFig. 2) and a specific gravity of the solids of 2.63. Mineralogicalanalysis showed that sand particles are predominantly quartz. Thegrain size is purely fine sand with a mean effective diameter (D50)of 0.16 mm and uniformity and curvature coefficients of 1.9 and1.2, respectively. The minimum (emin) and maximum (emax) voidratios are 0.6 and 0.9, respectively. Portland cement of high initialstrength (Type III) was used as the cementing agent. Its fast gain ofstrength allowed the adoption of a 7-day curing period. The specificgravity of the cement grains is 3.15. Distilled water was used forthe characterization tests, but for the unconfined compression andtriaxial samples, tap water was used.
1Associate Professor, Dept. of Civil Engineering, Federal Univ. of RioGrande do Sul, Porto Alegre, Rio Grande do Sul, Brazil. (correspondingauthor). E-mail: [email protected]
2Research Fellow, Federal Univ. of Rio Grande do Sul, Porto Alegre,Rio Grande do Sul, Brazil. E-mail: [email protected]
3Associate Professor, Faculty of Engineering, Univ. of Porto, Porto,Portugal. E-mail: [email protected]
4Professor, City Univ. of Hong Kong, Hong Kong, China; formerly,Imperial College London, London, UK. E-mail: [email protected]
Note. This manuscript was submitted on March 10, 2010; approved onMay 9, 2011; published online on May 11, 2011. Discussion period openuntil June 1, 2012; separate discussions must be submitted for individualpapers. This paper is part of the Journal of Geotechnical and Geoenvir-onmental Engineering, Vol. 138, No. 1, January 1, 2012. ©ASCE, ISSN1090-0241/2012/1-100–109/$25.00.
100 / JOURNAL OF GEOTECHNICAL AND GEOENVIRONMENTAL ENGINEERING © ASCE / JANUARY 2012
J. Geotech. Geoenviron. Eng. 2012.138:100-109.
Dow
nloa
ded
from
asc
elib
rary
.org
by
Sask
atch
ewan
Uni
vers
ity o
n 09
/25/
12. F
or p
erso
nal u
se o
nly.
No
othe
r us
es w
ithou
t per
mis
sion
. Cop
yrig
ht (
c) 2
012.
Am
eric
an S
ocie
ty o
f C
ivil
Eng
inee
rs. A
ll ri
ghts
res
erve
d.

Methods and Procedures
Molding and Curing of SpecimensFor all tests, cylindrical specimens 70 mm in diameter and 140 mmhigh were used. After the sand, cement and water were weighed,and the sand and cement were mixed to a uniform consistency. Thewater was then added, continuing the mixing process, until a homo-geneous paste was created. The amount of cement for each mixturewas calculated on the basis of the mass of dry soil and the targetmoisture content.
After mixing sufficient material for one specimen, the mixturewas stored in a covered container to avoid moisture losses beforesubsequent compaction. The time it took to prepare a sample (mix-ing and compaction) was always less than 1 h, which is muchshorter than the initial setting time of 3.25 h of the Portland cementused. The specimen was statically compacted in three layers insidea cylindrical PVC split mold, which was lubricated so that eachlayer reached the specified dry density. The top of each layer wasslightly scarified. After molding, the specimens were immediatelyextracted from the split mold, and their weight, diameter, andheight measured with accuracies of about 0.01 g and 0.1 mm.The samples were then sealed within plastic bags to avoid anysignificant changes of moisture content and were cured in a humidroom at 23°� 2°C and a relative humidity above 95% for 6 days.The samples were considered suitable for testing if they metthe following tolerances: dry density (γd) within �1% of the targetvalue, moisture content (ω) within �0:5% of the target value,diameter within �0:5 mm, and height within �1 mm (all these
tolerances were measured just after the specimens were extractedfrom the molds).
The dry density (γd) of the specimens was calculated as thecombined dry mass of the soil and cement divided by the total vol-ume of the sample. To keep the dry density (γd) of the specimensconstant with increasing cement content, the proportion of the soilwas reduced slightly to compensate. As the specific gravity of thecement grains (3.15) is greater than the specific gravity of the soilgrains (2.63), for the calculation of void ratio and porosity, acomposite specific gravity was used, based on the proportions ofsoil and cement in each specimen. The void ratio (e) of the spec-imens is defined as the volume of voids divided by the volume ofsolids, in which the volume of voids refers to the volume of remain-ing voids after the cement powder is added and the volume of solidsrefers to sand particles and cement powder. The water content isdefined as the weight of all water contained in the mixing dividedby the weight of solids (sand particles and cement powder).
Unconfined Compression TestsUnconfined compression tests have been used in most of the ex-perimental programs reported in the literature sometimes to verifywhether a consistent strength was reached for cement mixes butalso to assess the importance of the various factors influencingthe strength of cemented soils. One of the reasons for this popular-ity is the accumulated experience with this kind of test for concrete.The test is also simple and quick, while being relatively reliable andinexpensive.
An automatic loading machine, with maximum capacity of50 kN and proving rings with capacities of 10 kN and 50 kN andresolutions of 0.005 kN and 0.023 kN, respectively, were used forthe unconfined compression tests. After curing the samples in ahumid room for 6 days, the specimens were submerged in a watertank for 24 h to achieve saturation and to minimize suction withinthe samples so that the total curing period before testing was 7 days.The water temperature was controlled and maintained at 23� 3°C.Immediately before the test, the specimen was taken out the tankand dried superficially with an absorbent cloth. The unconfinedcompression test was then carried out and the maximum loadreached by the specimen recorded. The rate of displacementadopted was 1.14 mm per minute. As acceptance criteria, it wasstipulated that the individual strengths of three specimens, moldedwith the same characteristics, should not deviate by more than 10%from the mean strength.
Triaxial Compression TestsThe triaxial compression tests were carried out at a controlled rateof deformation of 0:0173 mm=min (the tests were run at a suffi-ciently low axial strain rate to ensure full drainage within the speci-men). Pressure transducers monitored the pore pressure andconfining stress, while the deviator load was measured with a loadcell with a capacity of 10 kN and a resolution of 0.005 kN, locatedwithin the triaxial chamber. The axial strains were measured bymeans of two independent systems; an internal system, using twolocal deformation transducer (LDT) sensors (Goto et al. 1991),allowed the measurement of the initial strains with a resolutionsmaller than 1 μm, and an externally mounted linear variable differ-ential transformer (LVDT) with a resolution smaller than 10 μmmeasured the relative displacement between the triaxial chamberand the loading piston.
The triaxial tests followed the general procedures described inBS 1377 (British Standard 1990). Bender elements (BE) other pie-zoceramic transducers have opened a new window in laboratorytesting, by enabling to perform standard mechanical, static, orcyclic tests simultaneously with seismic wave dynamic tests. Theattraction of the BE technique is its apparent simplicity: one of the
Fig. 1. Grain size distribution
Fig. 2. Particle shape photograph (image by authors)
JOURNAL OF GEOTECHNICAL AND GEOENVIRONMENTAL ENGINEERING © ASCE / JANUARY 2012 / 101
J. Geotech. Geoenviron. Eng. 2012.138:100-109.
Dow
nloa
ded
from
asc
elib
rary
.org
by
Sask
atch
ewan
Uni
vers
ity o
n 09
/25/
12. F
or p
erso
nal u
se o
nly.
No
othe
r us
es w
ithou
t per
mis
sion
. Cop
yrig
ht (
c) 2
012.
Am
eric
an S
ocie
ty o
f C
ivil
Eng
inee
rs. A
ll ri
ghts
res
erve
d.

transducers is excited at one end of a specimen by using a singlepulse excitation, and the time required for this to be registeredby the receiving bender element at the other end of the specimencan be simply read off an oscilloscope to obtain the travel timeand hence, the shear wave velocity. Its capabilities in monitoringthe evolution of stiffness with effective stresses, influenced byfactors such as cementation, curing, and load stabilization, amongothers, by means of shear waves and also in observing otherprocesses, namely saturation using compression (P) waves, are par-ticularly appealing. Recognizing that, in cemented materials, thecontrol of saturation is far from being representative by assuringhigh values of the Skempton B parameter, the recourse to the ad-vantage of the measurement of P-waves was taken possibly toverify the saturation. This was made by measuring compressionwave velocities (VP) higher than 1500 m=s, as proposed byIshihara et al. (2001) and well-confirmed in several studies inresidual soils (Ferreira 2003).
After applying the effective confining pressure (back-pressuresof about 400 kPa were applied in all specimens), the samples weresheared under drained conditions in compression until failure. Forthe calculation of the applied stresses, the area corrections pro-posed by La Rochelle et al. (1988) were adopted. From the ob-servations of the shapes of the specimens during testing, it wasconsidered that the samples suffered deformation as a right cylin-der until reaching the peak stress. After the peak, it was consideredthat the deformations were a combination of bulging and slidingon a shear plane. Nonlubricated ends were used in triaxial testingand carried out in the present research. No corrections were madefor the restraint imposed by the latex membrane because it wasconsidered difficult to evaluate and of insignificant magnitudecompared to the applied stresses.
Program of TestsThe unconfined compression tests constituted the first part of thisresearch and the schedule of tests was chosen in such a way as toevaluate the influence of both void ratio and cement content. Thesamples were molded at voids ratios of 0.68, 0.73, and 0.80 (rep-resenting distinct particle packings, ranging from dense to loosespecimens), all with the same moisture content of about 10%(the moisture content was selected for a good workability of the
sand-cement blends). For each void ratio seven different cementpercentages were used: 1%, 2%, 3%, 5%, 7%, 9%, and 12%. Thesepercentages were chosen considering both the local Brazilian andinternational experience with soil-cement mixtures [e.g., Mitchell(1981), Schnaid et al. (2001), Consoli et al. (2009a)] in bothexperimental and practical works. Because of the scatter of datathat is typical of unconfined compression tests, for each combina-tion three specimens were tested.
Eighteen consolidated isotropically drained (CID) triaxial com-pression tests were also carried out, details of which are given inTable 1, with cement contents ranging from 3.0–10.3% and voidsratios from 0.69–0.82. The basis for the combinations of the voidsratio and cement content will be discussed subsequently; for eachcombination, there were three tests with effective confining stressesof 20, 200, and 400 kPa. For test T-13 (voids ratio ¼ 0:71,cement content ¼ 8:6, and confining pressure ¼ 20 kPa) an extraspecimen with identical characteristics was also molded and tested,giving very similar results for the complete stress-strain behavior.After obtaining this evidence of the repeatability of the results, theauthors then tested one specimen for all other cases studied.
Results
Effect of the Volume of Cement and Volume of Voidson Compressive Strength
Fig. 3 shows the raw data (for the three studied volumes of voidsof the specimens—Vv) and the fitted lines for the unconfined com-pressive strength (qu) as a function of the volume of cement withinthe specimens (Vce). It can be observed in Fig. 3 that the volumeof cement has a great effect on the compressive strength of thissand-cement mixture, in which a small addition of cement isenough to generate a significant gain in strength. The lines shownon the figure are best fit lines, demonstrating that a power functionadapts well with the relation qu � Vce.
Fig. 4 shows how the volume of voids of the specimens affectsthe unconfined compressive strength of the sand-cement mixture.The compressive strength increases with reducing volume of voidsof the compacted mixture. The beneficial effect of a decrease in the
Table 1. Summary of the Triaxial Compression Tests
Specimen Confining pressure (kPa) e Cement (%) Diameter and height (cm) ω (%) Vp (m=s) Vv (cm3) Vce (cm3) Vce=Vv q (kPa)
T-01 20 0.78 3.0 7:09 × 14:36 9.67 1,652.19 248.69 7.83 0.031 350.16
T-02 200 0.78 3.0 7:09 × 14:3 9.65 1,619.42 246.84 7.82 0.032 677.81
T-03 400 0.78 3.0 7:09 × 14:39 9.64 1,540.19 248.96 7.86 0.032 995.21
T-04 20 0.81 3.3 7:09 × 14:29 9.5 1,822.08 251.93 8.44 0.034 429.73
T-05 200 0.82 3.3 7:09 × 14:31 9.8 1,897.35 254.80 8.38 0.033 735.12
T-06 400 0.81 3.3 7:09 × 14:31 9.23 1,572.60 252.57 8.44 0.033 995.47
T-07 20 0.71 5.0 7:09 × 14:45 9.89 1,873.33 236.35 13.64 0.058 828.14
T-08 200 0.71 5.0 7:09 × 14:45 9.86 1,903.08 236.32 13.64 0.058 1,340.8
T-09 400 0.70 5.0 7:09 × 14:31 9.94 1,789.79 235.17 13.64 0.058 1,788.85
T-10 20 0.82 6.0 7:09 × 14:27 9.43 1,844.51 254.26 14.90 0.059 759.53
T-11 200 0.82 6.0 7:09 × 14:28 9.87 1,803.59 253.28 14.91 0.059 1,198.05
T-12 400 0.80 6.0 7:09 × 14:31 9.61 1,681.21 251.51 15.06 0.060 1,450.61
T-13 20 0.71 8.6 7:09 × 14:40 9.41 2,181.81 235.00 22.50 0.096 1,479.66
T-14 200 0.69 8.6 7:09 × 14:31 9.54 2,135.58 231.00 22.52 0.097 2,215.14
T-15 400 0.70 8.6 7:09 × 14:39 9.65 2,022.64 234.19 22.53 0.096 2,594.36
T-16 20 0.80 10.3 7:09 × 14:20 9.52 2,032.39 249.35 24.83 0.100 1,697.41
T-17 200 0.80 10.3 7:09 × 14:23 9.53 2,237.06 250.12 24.84 0.099 2,061.9
T-18 400 0.80 10.3 7:09 × 14:22 9.95 2,083.65 249.94 24.83 0.099 2,753.39
102 / JOURNAL OF GEOTECHNICAL AND GEOENVIRONMENTAL ENGINEERING © ASCE / JANUARY 2012
J. Geotech. Geoenviron. Eng. 2012.138:100-109.
Dow
nloa
ded
from
asc
elib
rary
.org
by
Sask
atch
ewan
Uni
vers
ity o
n 09
/25/
12. F
or p
erso
nal u
se o
nly.
No
othe
r us
es w
ithou
t per
mis
sion
. Cop
yrig
ht (
c) 2
012.
Am
eric
an S
ocie
ty o
f C
ivil
Eng
inee
rs. A
ll ri
ghts
res
erve
d.

volume of voids of the specimens on the compressive strength hasbeen reported by several researchers (e.g., Moore et al. 1970). Inparticular, Chang and Woods (1992) have already shown throughelectron microscopy on different sands with various kinds of ce-ment that the existence of a larger number of interparticle contactsand, consequently, a greater possibility of the cement to promoteeffective bonds at these contacts explains the increase in the rate ofcompressive strength gain with the reduction in the volume of voidsof the specimen. The effectiveness of cementation may increasesignificantly with the sand gradation (a uniform sand is being usedin the present study), where as a well-graded sand could providemore points of contact.
Effect of Cement-Voids Ratio
As seen in the results presented in Figs. 3 and 4, qu is dependentof the volume of voids and the volume of cement of the mixture.Increasing the volume of voids causes a reduction of qu, whereasincreasing values of the volume of cement gives larger values of qu.
It is proposed herein the existence of empirical relations forstrength versus cement-voids ratio (Vce=Vv), as defined in Eq. (1),
quantifying the proportion of cement within a specimen relative tothe total volume of voids
Vce
Vv¼ Volume of cement
Volume of voidsðwater þ airÞ ð1Þ
Fig. 5 presents the unconfined compressive strength (qu) as afunction of the cement-voids ratio (Vce=Vv) for all of the specimenstested in this program. A good correlation (R2 ¼ 0:98) can be ob-served between the cement-voids ratio (Vce=Vv) and the unconfinedcompressive strength (qu) of the sand-cement studied [see Eq. (2)].
quðkPaÞ ¼ 29;266
�Vce
Vv
�1:35
ð2Þ
The existing relation qu versus Vce=Vv suggests that Vce=Vv ef-fectively links the effects of both variables (Vv and Vce) in a com-bined factor controlling qu. From a mechanical standpoint, it meansthat although Vce and Vv affect separately qu, the negative effect onqu of increasing values of volume of voids might be counteractedby increasing the volume of cement (for a given change in the vol-ume of voids, a variation in the volume of cement would be enoughto balance the strength gain or loss). It might be expected that thestrength of a cemented sand would depend on the amount of ce-ment used and also on the number of particle contacts becauseit is at the particle contacts that the accumulation of cement willbe most effective. The volume of cement Vce is one way of quan-tifying the amount of cement added, whereas the number of particlecontacts will be controlled by the density, which may be quantifiedthrough the volume of voids, Vv. It is then an empirical observationthat these two effects can be simply combined by taking the ratioVce=Vv, although this ratio is now well-established for a range ofsoils in the effect that it has on strength (Consoli et al. 2007, 2010,2011). Establishing a theoretical basis for this ratio would requirean analysis of how the cement is distributed throughout the soilsample, perhaps through X-Ray CT scanning, but this is beyondthe scope of the current work.
With the aim of examining the stress-strain behavior of speci-mens of the same cement-voids ratio, but with different values ofcement content and porosity, three different values of Vce=Vv closeto 0.03, 0.06, and 0.10 were chosen to represent the curve obtainedin Fig. 5, and triaxial tests were then carried out for these ratios atconfining stresses of 20, 200, and 400 kPa. Table 1 presents thevoids ratios and cement contents at molding and brief results of
Fig. 3. Variation of unconfined compressive strength (qu) with volumeof cement of the specimen (Vce)
Fig. 4. Variation of unconfined compressive strength (qu) with volume of voids of the specimen (Vv)
JOURNAL OF GEOTECHNICAL AND GEOENVIRONMENTAL ENGINEERING © ASCE / JANUARY 2012 / 103
J. Geotech. Geoenviron. Eng. 2012.138:100-109.
Dow
nloa
ded
from
asc
elib
rary
.org
by
Sask
atch
ewan
Uni
vers
ity o
n 09
/25/
12. F
or p
erso
nal u
se o
nly.
No
othe
r us
es w
ithou
t per
mis
sion
. Cop
yrig
ht (
c) 2
012.
Am
eric
an S
ocie
ty o
f C
ivil
Eng
inee
rs. A
ll ri
ghts
res
erve
d.

each of test. As shown in Table 1, measured compression wavevelocities (VP) of all 18 triaxial compression tests were higher than1;500 m=s, guaranteeing saturation of all specimens tested undertriaxial compression.
Fig. 6 presents the deviator stress-axial strain-volumetricstrain behavior for specimens with Vce=Vv ¼ 0:03 but which havebeen molded at two different voids ratios and cement contentsand then sheared under confining pressures of 20, 200, and400 kPa. The general pattern of behavior, as for other cemented
sands [e.g., Cuccovillo and Coop (1999)], is an evolution from brit-tle, strain softening behavior, dominated by the cement bonds atlow confining stresses, to more gentle strain softening with peakstrength occurring at higher axial strains at elevated confining stresslevels. The strain localization (usually in the form of a dominantshear band) occurred in all triaxial tests carried out and becamevisible after the peak strength at about the stage in which the maxi-mum dilation rate occurs. It is important to recall that for specimenswith lower values of Vce=Vv and higher confining stresses, speci-men bulging preceded the occurrence of strain localization.
The volumetric strains are strongly dilative at low stress levels,evolving to compression at higher stresses; the change in slope ofthe volumetric strain curves for 20 kPa confining stress at around1% axial strain (approximately where the maximum dilation rate istaking place), probably corresponding to fully developed shearband. However, the comparison between tests at different cementcontents and voids ratios but the same Vce=Vv ratio show that thepeak strengths at each confining pressure are similar, confirmingthat the use of cement-voids ratio holds for specimens under con-fining pressures and unconfined compression tests. For a givencement-voids ratio the stress-strain curves and volumetric re-sponses up to peak are also similar so that the normalization canbe, therefore, extended to the deviator stress-axial strain-volumetricvariation curve up to the peak.
The shearing behavior for specimens with Vce=Vv ¼ 0:06 and0.10 are presented in Figs. 7 and 8, respectively, showing that thegeneral patterns for the three cement-voids ratios studied are sim-ilar, with the deviator stress-axial strain-volumetric strain curveup to peak similar at each confining pressure for the same Vce=Vvratio. Although there is some scatter in the data, with slightly differ-ent peak strengths in some cases, there are no consistent trends. Thelarger the cement-voids ratio, the larger the peak deviator stress
Fig. 5. Variation of unconfined compression strength with cement-voids ratio
Fig. 6. Stress-axial strain-volumetric variation curves for the drainedtriaxial tests (T-01 to T-06) for Vce=Vv ¼ 0:03 (molded at 2 differentvolume of voids and volume of cement—see Table 1) at confiningpressures of 20, 200, and 400 kPa
Fig. 7. Stress-axial strain-volumetric variation curves for the drainedtriaxial tests (T-07 to T-12) for Vce=Vv ¼ 0:06 (molded at 2 differentvolume of voids and volume of cement—see Table 1) at confiningpressures of 20, 200, and 400 kPa
104 / JOURNAL OF GEOTECHNICAL AND GEOENVIRONMENTAL ENGINEERING © ASCE / JANUARY 2012
J. Geotech. Geoenviron. Eng. 2012.138:100-109.
Dow
nloa
ded
from
asc
elib
rary
.org
by
Sask
atch
ewan
Uni
vers
ity o
n 09
/25/
12. F
or p
erso
nal u
se o
nly.
No
othe
r us
es w
ithou
t per
mis
sion
. Cop
yrig
ht (
c) 2
012.
Am
eric
an S
ocie
ty o
f C
ivil
Eng
inee
rs. A
ll ri
ghts
res
erve
d.

reached, the stiffer and more dilative the material, and the greaterthe postpeak drop in the deviator stress.
After peak, the uniqueness defined by the cement-voids ratiostarts to break down because the cement no longer dominatesbehavior. In general, after peak, the denser samples are more dilat-ive. This greater dilation should correspond to slightly higher stressratios at a given axial strain, but there are again some discrepanciesin the data, particularly for the higher cement contents, which mayresult from the effect of strain localization. At very high confiningstresses, beyond those investigated here, it is expected that theuniqueness of behavior defined by the cement-voids ratio mustagain break down because it might be expected that at very highstresses the behavior would be dominated by the frictional charac-teristics of the soils, not the cement, and the soil would fail directly
at its critical state rather than showing a peak. This evolution from acement dominated “cohesive” behavior at low confining stressesand/or high cement contents evolving to a “frictional” behaviordominated by the sand matrix at high confining stresses and/orlow cement contents has commonly been seen in the literaturefor a range of artificially and naturally cemented sands [e.g., Coopand Atkinson (1993), Airey (1993), Huang and Airey (1993),Cuccovillo and Coop (1999), Coop and Willson (2003)].
Figs. 9–11 present the stress-ratio (q=p0)-dilatancy (δεv=δεs)relationships for the cement-voids ratios of 0.03, 0.06, and 0.10,respectively, at confining pressures of 20, 200, and 400 kPa, in eachcase with two different voids ratios and volumes of cement (seeTable 1 for details). The results show that for each cement-voidsratio and for each confining pressure, the stress-dilatancy behavioris quite similar for each of the two specimens. There is some scatterin the data at low stress ratios, probably because the rate of dilationis calculated as the ratio of two small values of strain. However, atlower stress levels and/or higher cement contents (i.e., higherVce=Vv ratios), the initial part of the dilatancy behavior is domi-nated by the cement, and the paths are vertical with a small rateof compression, which is perhaps related to the increase of p0 dur-ing drained shearing. There is then a well-defined yield point wherethe path deviates. It has not been investigated whether the stress-strain behavior up to this point is reversible, and so it is not knownwhether this yield point corresponds to the onset of plasticity, but itdoes represent a change in the relationship between the volumetricstrain and shear strain, which occurs shortly before the peakstrength, and so it is probably the point at which the cement startsto yield significantly. At higher stress levels and/or lower cementcontents, the initial path tends to be slightly inclined to the right,and so the initial path is not quite unique, but again, a distinctchange of direction is observable just before the peak strength isreached. The inclinations of the paths at higher cement-voids ratiosand/or higher confining stresses may indicate a greater componentof plastic strain before the change of path direction, in which casethe yield point is more correctly a gross-yield rather than a trueyield point.
As others have observed for cemented sands [e.g., Cuccovillo &Coop (1999)]. after this yield point the rate of dilation increasesquickly, reaching a maximum at or shortly after the peak stress-ratio, before reducing as the soil strain softens toward a critical stateat which the behavior is purely frictional. The gross-yield thereforeprobably represents the onset of major bond degradation, and thespecimens must undergo substantial loss of cement bondingbetween the gross-yield and the peak. In general, the pattern is
Fig. 8. Stress-axial strain-volumetric variation curves for the drainedtriaxial tests (T-13 to T-18) for Vce=Vv ¼ 0:10 (molded at 2 differentvolume of voids and volume of cement—see Table 1) at confiningpressures of 20, 200, and 400 kPa
Fig. 9. Stress (q=p0)-dilatancy (δεv=δεs) relationships for cement-voids ratio ∼ 0:03 (molded at 2 different volumes of voids and volumes of cement—see Table 1) at confining pressures of 20, 200, and 400 kPa
JOURNAL OF GEOTECHNICAL AND GEOENVIRONMENTAL ENGINEERING © ASCE / JANUARY 2012 / 105
J. Geotech. Geoenviron. Eng. 2012.138:100-109.
Dow
nloa
ded
from
asc
elib
rary
.org
by
Sask
atch
ewan
Uni
vers
ity o
n 09
/25/
12. F
or p
erso
nal u
se o
nly.
No
othe
r us
es w
ithou
t per
mis
sion
. Cop
yrig
ht (
c) 2
012.
Am
eric
an S
ocie
ty o
f C
ivil
Eng
inee
rs. A
ll ri
ghts
res
erve
d.
that the smaller the confining pressure, the larger the stress-ratioachieved, and the greater the maximum rate of dilation.
Fig. 12 presents the stress-dilatancy relationships for cement-voids ratios of 0.03, 0.06, and 0.10 but for a single confining pres-sure of 200 kPa. At the same confining stress, the stress-dilatancybehavior is fairly uniquely defined by the cement-voids ratio; the
larger the cement-voids ratio, the larger the stress-ratio reached, andthe greater the maximum rate of dilation.
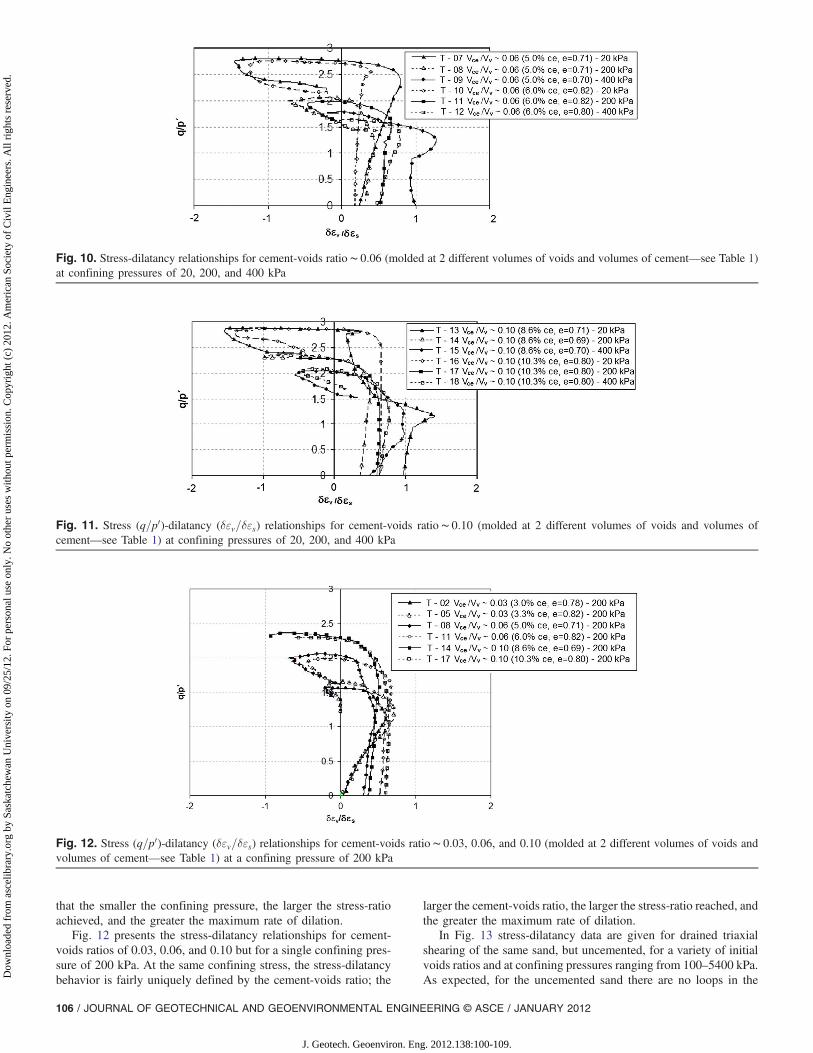
In Fig. 13 stress-dilatancy data are given for drained triaxialshearing of the same sand, but uncemented, for a variety of initialvoids ratios and at confining pressures ranging from 100–5400 kPa.As expected, for the uncemented sand there are no loops in the
Fig. 10. Stress-dilatancy relationships for cement-voids ratio ∼ 0:06 (molded at 2 different volumes of voids and volumes of cement—see Table 1)at confining pressures of 20, 200, and 400 kPa
Fig. 11. Stress (q=p0)-dilatancy (δεv=δεs) relationships for cement-voids ratio ∼ 0:10 (molded at 2 different volumes of voids and volumes ofcement—see Table 1) at confining pressures of 20, 200, and 400 kPa
Fig. 12. Stress (q=p0)-dilatancy (δεv=δεs) relationships for cement-voids ratio ∼ 0:03, 0.06, and 0.10 (molded at 2 different volumes of voids andvolumes of cement—see Table 1) at a confining pressure of 200 kPa
106 / JOURNAL OF GEOTECHNICAL AND GEOENVIRONMENTAL ENGINEERING © ASCE / JANUARY 2012
J. Geotech. Geoenviron. Eng. 2012.138:100-109.
Dow
nloa
ded
from
asc
elib
rary
.org
by
Sask
atch
ewan
Uni
vers
ity o
n 09
/25/
12. F
or p
erso
nal u
se o
nly.
No
othe
r us
es w
ithou
t per
mis
sion
. Cop
yrig
ht (
c) 2
012.
Am
eric
an S
ocie
ty o
f C
ivil
Eng
inee
rs. A
ll ri
ghts
res
erve
d.

stress–dilatancy relationship, as are seen for cemented soils.At the critical state, when δεv=δεs ¼ 0 at large axial strains, allspecimens reached about the same stress-ratio, corresponding toa critical state line gradient, M ¼ 1:22, which is equivalent to afriction angle at constant volume of about 30°.
Fig. 14 presents the stress-dilatancy data for all the cementedsamples for all cement-voids ratios and confining pressures. As ob-served previously, at small strains, the initial paths seem to beslightly dependent both on the cement-voids ratio and confiningpressure, and although a single trend has been identified on thefigures, as Coop and Willson (2003) were able to do for Castlegatesandstone, which had only one voids ratio and degree of cementing,here there is some small systematic variation. However, at inter-mediate strains around the peak strength, the stress-dilatancy rela-tionship seems uniquely defined by the cement-voids ratio at anyconfining stress. After the peak, the soil strain softens, apparentlyfollowing a unique straight line frictional trend on the stress-dilatancy plot, back toward a similar frictional critical state to thatof the uncemented sand. However, as the stress-ratio reduces, strainlocalization occurs so that the rate of dilation reduces more rapidlythan the stress-ratio, bringing the path inside the expected frictional
relationship. The intercept of the frictional trend is about 1.20,which is about the same as that of the uncemented sand.
Schnaid et al. (2001) has presented an experimental model inwhich it is shown that deviatoric stress at failure obtained in drainedtriaxial tests on granular cemented soils can be expressed as a linearfunction of the degree of cementation and the initial mean effectivestress, the degree of cementation directly represented by the uncon-fined compressive strength of the cemented soil and the effect of theinitial mean effective stress by the deviatoric stress at failure ofthe uncemented soil. Consequently, the authors have suggestedthat the triaxial shear strength can be conveniently expressed asa function of the unconfined compressive strength of the cementedsoil and the uncemented soil friction angle. From the findings pre-sented in the present work, the unconfined compressive strength(qu) is shown to be a function of the Vce=Vv ratio and for a varietyof initial voids ratios, cement contents, and considering the wholerange of confining pressures studied, at large axial strains, all spec-imens reached about the same stress-ratio, equivalent to a frictionangle at constant volume of about 30°. Therefore, linking theSchnaid et al. (2001) model to qu, a function of the Vce=Vv ratio,it should be expected that for a given soil, the peak deviatoric stressobtained in a drained triaxial test at a given confining stress should
Fig. 13. Stress (q=p0)-dilatancy (δεv=δεs) relationships for uncemented sand (molded at different initial voids ratios) at confining pressures of100–5400 kPa
Fig. 14. Stress-dilatancy paths of all cemented specimens tested
JOURNAL OF GEOTECHNICAL AND GEOENVIRONMENTAL ENGINEERING © ASCE / JANUARY 2012 / 107
J. Geotech. Geoenviron. Eng. 2012.138:100-109.
Dow
nloa
ded
from
asc
elib
rary
.org
by
Sask
atch
ewan
Uni
vers
ity o
n 09
/25/
12. F
or p
erso
nal u
se o
nly.
No
othe
r us
es w
ithou
t per
mis
sion
. Cop
yrig
ht (
c) 2
012.
Am
eric
an S
ocie
ty o
f C
ivil
Eng
inee
rs. A
ll ri
ghts
res
erve
d.

be a function only of the Vce=Vv ratio, which is exactly what wasobtained in the present research for specimens with unique Vce=Vvbut which have been molded at different voids ratios and distinctcement contents.
The molded triaxial specimens covered cement contents rang-ing from 3.0–10.3% and voids ratios from 0.69–0.82, the find-ings valid inside the studied range, which would be typical of theeasily achievable densities in practice. Further studies are plannedto reach extremes of the voids ratio range (from emin ¼ 0:60 toemax ¼ 0:90) and increasing cement content range, intending tomake the conclusions of the research suitable for a wider rangeof voids ratio and cement content.
Conclusions
From the data presented in this paper, the following conclusionscan be drawn:(1) For a given cement-voids ratio (Vce=Vv) and confining pres-
sure, the peak strength of soil-cement specimens and the de-viator stress-axial strain-volumetric variation response curveup to peak are similar, suggesting that the Vce=Vv parametermight control most of the stress-strain behavior up to peak.After peak, the soil strain softens toward a critical state atwhich the behavior is purely frictional.
(2) For a given cement-voids ratio and confining pressure, thestress-dilatancy behavior is similar for specimens moldedwith different voids ratios and cement contents, with onlyminor differences at small strains. The smaller the confiningpressure or cement-voids ratio, the larger the stress-ratioachieved and the greater the maximum rate of dilation.
(3) After the peak, considering all cemented specimens, allcement-voids ratios and all confining pressures studied, thedata apparently follow a unique straight line frictional trendon the stress-dilatancy plot, back toward a similar frictionalcritical state to that of the uncemented sand. However, asthe stress-ratio reduces, strain localization occurs so that therate of dilation reduces more rapidly than the stress-ratio,bringing the path inside the expected frictional relationship.At this point, the calculated strains lose their physical mean-ing. The intercept of the frictional trend is about 1.20, which isabout the same as that of the uncemented sand.
Acknowledgments
The authors wish to express their gratitude toMCT/CNPq (BrazilianResearch Council—Ministry of Science and Technology—Projects Produtividade em Pesquisa, Edital Universal, PNPD andINCT), Brazilian Agency for Electrical Energy (ANEEL—ProjectP&D CEEE-GT/UFRGS), PRODOC/CAPES, and to MCTES/FCT(Portuguese Science and Technology Foundation of PortugueseMinistry of Science and Technology) for their support to the re-search group.
Notation
The following symbols are used in this paper:D50 = mean effective diameter;
e = voids ratio;emax = maximum voids ratio;emin = minimum voids ratio;
q = deviator stress (¼ σ01 � 2σ0
3);qu = unconfined compressive strength;
p0 = mean normal effective stress (¼ ðσ01 þ 2σ0
3Þ=3);R2 = coefficient of determination;Vce = volume of cement;Vp = compression wave velocity;Vv = volume of voids;γd = dry density;
δεv=δεs = dilatancy;εa = axial strain;εv = volumetric strain;σ1 = major principal stress;σ3 = confining stress; andω = moisture content (expressed in relation to the
sum of dry soil and cement).
References
Airey, D. W. (1993). “Triaxial testing of a naturally cemented carbonatesoil.” J. Geotech. Eng., 119(9), 1379–1398.
ASTM. (1993). “Standard classification of soils for engineering purposes.”ASTM D 2487-93, West Conshohocken, PA.
British Standard. (1990). “Soil for civil engineering purposes.” BS 1377,London, UK.
Chang, T. S., and Woods, R. D. (1992). “Effect of particle contact bond onshear modulus.” J. Geotech. Eng., 118(8), 1216–1233.
Consoli, N. C., Cruz, R. C., Floss, M. F., and Festugato, L. (2010).“Parameters controlling tensile and compressive strength ofartificially cemented sand.” J. Geotech. Geoenviron. Eng., 136(5),759–763.
Consoli, N. C., Dalla Rosa, A., Corte, M. B., Lopes, L. S. Jr., and Consoli,B. S. (2011). “Porosity/cement ratio controlling strength of artificiallycemented clays.” J. Mater. Civ. Eng., 23(8), 1249-1254.
Consoli, N. C., Dalla Rosa, F., and Fonini, A. (2009a). “Plate load tests oncemented soil layers overlying weaker soil.” J. Geotech. Geoenviron.Eng., 135(12), 1846–1856.
Consoli, N. C., Foppa, D., Festugato, L., and Heineck, K. S. (2007).“Key parameters for strength control of artificially cemented soils.”J. Geotech. Geoenviron. Eng., 133(2), 197–205.
Consoli, N. C., Rotta, G. V., and Prietto, P. D. M. (2006). “Yielding-compressibility-strength relationship for an artificially cemented soilcured under stress.” Géotechnique, 56(1), 69–72.
Consoli, N. C., Thomé, A., Donato, M., and Graham, J. (2008). “Loadingtests on compacted soil, bottom ash and lime layers.” Proc. Inst. Civ.Engrs. Geotech. Eng., 161(1), 29–38.
Consoli, N. C., Vendruscolo, M. A., and Prietto, P. D. M. (2003). “Behaviorof plate load tests on soil layers improved with cement and fiber.”J. Geotech. Geoenviron. Eng., 129(1), 96–101.
Consoli, N. C., Viana da Fonseca, A., Cruz, R. C., and Heineck, K. S.(2009b). “Fundamental parameters for the stiffness and strength controlof artificially cemented sand.” J. Geotech. Geoenviron. Eng., 135(9),1347–1453.
Coop, M. R., and Atkinson, J. H. (1993). “The mechanics of cementedcarbonate sands.” Géotechnique, 43(1), 53–67.
Coop, M. R., and Willson, S. M. (2003). “Behavior of hydrocarbon reser-voir sand and sandstones.” J. Geotech. Geoenviron. Eng., 129(11),1010–1019.
Cuccovillo, T., and Coop, M. R. (1999). “On the mechanics of structuredsands.” Géotechnique, 49(6), 741–760.
Ferreira, C. (2003). “Implementation and application of piezoelectrictransducers for the determination of seismic wave velocities in soilspecimens: Assessment of sampling quality in residual soils.” M.S.thesis, Faculty of Engineering, Univ. of Porto, Porto, Portugal (inPortuguese).
Goto, S., Tatsuoka, F., Shibuya, S., Kim, Y. S., and Sato, T. (1991).“A simple gauge for local small strain measurements in the laboratory.”Soils Found., 31(1), 169–180.
Huang, J. T., and Airey, D. W. (1993). “Effects of cement and density on anartificially cemented sand.” Proc. 1st Int. Symp. Hard Soils-Soft Rocks,A. A. Balkema, Rotterdam, The Netherlands, 1, 553–560.
108 / JOURNAL OF GEOTECHNICAL AND GEOENVIRONMENTAL ENGINEERING © ASCE / JANUARY 2012
J. Geotech. Geoenviron. Eng. 2012.138:100-109.
Dow
nloa
ded
from
asc
elib
rary
.org
by
Sask
atch
ewan
Uni
vers
ity o
n 09
/25/
12. F
or p
erso
nal u
se o
nly.
No
othe
r us
es w
ithou
t per
mis
sion
. Cop
yrig
ht (
c) 2
012.
Am
eric
an S
ocie
ty o
f C
ivil
Eng
inee
rs. A
ll ri
ghts
res
erve
d.

Ishihara, K., Tsuchiya, H., Huang, Y., and Kamada, K. (2001). “Recentstudies on liquefaction resistance of sand-effect of saturation (keynotelecture).” Proc., 4th Int. Conf. on Recent Advances in GeotechnicalEarthquake Engineering and Soil Dynamics, S. Prakash, ed., St. Louis.
La Rochelle, P., Leroueil, S., Trak, B., Blais-Leroux, L., and Tavenas, F.(1988). “Observational approach to membrane and area corrections intriaxial tests.” Proc., Symp. on Advanced Triaxial Testing of Soil andRock, ASTM, West Conshohocken, PA, 715–731.
Mitchell, J. K. (1981). “Soil improvement—State-of-the-art report.” Proc.,10th Int. Conf. on Soil Mechanics and Foundation Engineering.,International Society of Soil Mechanics and Foundation Engineering,Stockholm, Sweden, 509–565.
Moore, R. K., Kennedy, T. W., and Hudson, W. R. (1970). “Factors affect-ing the tensile strength of cement-treated materials.” Highway ResearchRecord 315: Soil Stabilization: Multiple Aspects, Highway ResearchBoard, Washington, DC, 64–80.
Porbaha, A., Shibuya, S., and Kishida, T. (2000). “State of the art in deepmixing technology: Part III—Geomaterial characterization.” Proc. ICEGround Improv., 4(3), 91–110.
Porbaha, A., Tanaka, H., and Kobayashi, M. (1998). “State of the art indeep mixing technology: Part II—Applications.” Proc. ICE GroundImprov., 2(3), 125–139.
Rattley, M. J., Lehane, B. M., Consoli, N. C., and Richards, D. J. (2008).“Uplift of shallow foundations with cement stabilized backfill.” Proc.ICE Ground Improv., 161(2), 103–110.
Schnaid, F., Prietto, P. D. M., and Consoli, N. C. (2001). “Predictionof cemented sand behavior in triaxial compression.” J. Geotech.Geoenviron. Eng., 127(10), 857–868.
Thomé, A., Donato, M., Consoli, N. C., and Graham, J. (2005). “Circularfootings on a cemented layer above weak foundation soil.” Can. Geo-tech. J., 42(6), 1569–1584.
JOURNAL OF GEOTECHNICAL AND GEOENVIRONMENTAL ENGINEERING © ASCE / JANUARY 2012 / 109
J. Geotech. Geoenviron. Eng. 2012.138:100-109.
Dow
nloa
ded
from
asc
elib
rary
.org
by
Sask
atch
ewan
Uni
vers
ity o
n 09
/25/
12. F
or p
erso
nal u
se o
nly.
No
othe
r us
es w
ithou
t per
mis
sion
. Cop
yrig
ht (
c) 2
012.
Am
eric
an S
ocie
ty o
f C
ivil
Eng
inee
rs. A
ll ri
ghts
res
erve
d.