Influence of Bicuspid Valve Geometry on Ascending Aortic Fluid Dynamics: A Parametric Study
11
Influence of Bicuspid Valve Geometry on Ascending Aortic Fluid Dynamics: A Parametric Study *Christian Vergara, †Francesca Viscardi, ‡Luca Antiga, and †Giovanni Battista Luciani *Department of Information Engineering and Mathematical Methods, University of Bergamo; ‡Biomedical Engineering Department, Mario Negri Institute, Bergamo; and †Division of Cardiac Surgery, University of Verona,Verona, Italy Abstract: Bicuspid aortic valve (BAV) predisposes to aortic aneurysms with a high prevalence. A first hypothesis for this phenomenon is related to fibrillin deficiency (genetic hypothesis). The present article focused on a complementary, hemodynamic hypothesis stating that it is the peculiar fluid dynamics of blood in the ascending aorta of patients with BAV configurations that leads to aneurysm formation. To corroborate this hypothesis, a parametric study was performed based on numerical simulations of ascending aorta hemodynamics with different configura- tions of orifice area and valve orientation. The resulting wall shear stress (WSS) distributions and degree of asym- metry of the blood jet were investigated, and surrogate indices introduced. The results showed that WSS was more pronounced in subjects with BAV morphologies,also in the nonstenotic case. In particular, a maximum WSS of 3 Pa was found (vs. 1.5 Pa in subjects with a tricuspid configuration). It is localized at the mid-ascending aorta, the segment more prone to dilate as shown by the index related to maximum WSS (0.869 in BAV vs. 0.322 in tricuspid). Moreover, the asymmetry of the blood flow was found larger for decreasing valve area, the related index at mid-ascending aorta being more than three times higher than that found for tricuspid configuration (0.70 vs. 0.20). Further, WSS and flow asymmetry were higher also at the sinus of Valsalva and sinotubolar junction for a latero- lateral (LL) BAV configuration in keeping with the clinical observation on association between BAV configurations and different aortic aneurysm morphology. These findings may help explain the higher risk of aneurysm formation in BAV patients.The proposed indices will require valida- tion prior to application in clinical settings. Key Words: Bicuspid aortic valve—Ascending aorta—Wall shear stress—Aortic aneurysm—Computational fluid dynamics. Bicuspid aortic valve (BAV) is the most common congenital heart disease (0.5–2%) (1). It predisposes to aortic valve pathology and aortic aneurysms with a high prevalence (33%) (2). Even in patients with nor- mally functioning aortic BAV, echocardiographic finding of aortic dilatation is common (52%) (3). Classification systems for BAV are disparate (echocardiographic, surgical, anatomical) and fail to be comprehensive (4–6). However, two common con- figurations can be recognized: anteroposterior (AP), with an ideal fusion of the two coronary cusps, and latero-lateral (LL), with an ideal fusion of the right and noncoronary cusps (7). These phenotypes are known to hold pathogenetic (1,8) and embryogenetic (9) differences. Pathogenesis of aortic dilatation in the presence of BAV is controversial. Some authors underline the role of fibrillin deficiency and endothe- lial nitric oxide synthase, claiming a genetic hypoth- esis (10,11). An alternative hemodynamic hypothesis states that flow patterns through a bicuspid orifice may cause altered fluid dynamics and promote aneu- rysm formation (12). To support the latter theory, echocardiographic studies found maximum shear stress at ascending aortic wall convexity (the external aortic wall portion relative to the curvature) (13), while magnetic resonance-based studies showed abnormal aortic flow patterns (14), abnormal wall shear stresses (WSS) (15,16), and eccentric aortic jet (17) in BAV patients, suggesting that hemodynamic factors (rather than genetic) contribute to ascending aortic aneurysm formation. In a previous computational study, these findings have been confirmed, with quantification of aortic doi:10.1111/j.1525-1594.2011.01356.x Received May 2011; revised July 2011. Address correspondence and reprint requests to Prof. Giovanni Battista Luciani, Division of Cardiac Surgery, University of Verona, O.C.M. Piazzale Stefani 1, Verona 37126, Italy. E-mail: [email protected] © 2011, Copyright the Authors Artificial Organs © 2011, International Center for Artificial Organs and Transplantation and Wiley Periodicals, Inc. Artificial Organs 2012, 36(4):368–378
-
Upload
christian-vergara -
Category
Documents
-
view
212 -
download
0
Transcript of Influence of Bicuspid Valve Geometry on Ascending Aortic Fluid Dynamics: A Parametric Study

aor_1356 368..378
Influence of Bicuspid Valve Geometry on Ascending AorticFluid Dynamics: A Parametric Study
*Christian Vergara, †Francesca Viscardi, ‡Luca Antiga, and †Giovanni Battista Luciani
*Department of Information Engineering and Mathematical Methods, University of Bergamo; ‡Biomedical EngineeringDepartment, Mario Negri Institute, Bergamo; and †Division of Cardiac Surgery, University of Verona, Verona, Italy
Abstract: Bicuspid aortic valve (BAV) predisposes toaortic aneurysms with a high prevalence. A first hypothesisfor this phenomenon is related to fibrillin deficiency(genetic hypothesis). The present article focused on acomplementary, hemodynamic hypothesis stating that it isthe peculiar fluid dynamics of blood in the ascending aortaof patients with BAV configurations that leads to aneurysmformation. To corroborate this hypothesis, a parametricstudy was performed based on numerical simulations ofascending aorta hemodynamics with different configura-tions of orifice area and valve orientation. The resultingwall shear stress (WSS) distributions and degree of asym-metry of the blood jet were investigated, and surrogateindices introduced. The results showed that WSS wasmore pronounced in subjects with BAV morphologies, alsoin the nonstenotic case. In particular, a maximum WSS of3 Pa was found (vs. 1.5 Pa in subjects with a tricuspid
configuration). It is localized at the mid-ascending aorta,the segment more prone to dilate as shown by the indexrelated to maximum WSS (0.869 in BAV vs. 0.322 intricuspid). Moreover, the asymmetry of the blood flow wasfound larger for decreasing valve area, the related index atmid-ascending aorta being more than three times higherthan that found for tricuspid configuration (0.70 vs. 0.20).Further, WSS and flow asymmetry were higher also at thesinus of Valsalva and sinotubolar junction for a latero-lateral (LL) BAV configuration in keeping with the clinicalobservation on association between BAV configurationsand different aortic aneurysm morphology. These findingsmay help explain the higher risk of aneurysm formationin BAV patients. The proposed indices will require valida-tion prior to application in clinical settings. Key Words:Bicuspid aortic valve—Ascending aorta—Wall shearstress—Aortic aneurysm—Computational fluid dynamics.
Bicuspid aortic valve (BAV) is the most commoncongenital heart disease (0.5–2%) (1). It predisposesto aortic valve pathology and aortic aneurysms with ahigh prevalence (33%) (2). Even in patients with nor-mally functioning aortic BAV, echocardiographicfinding of aortic dilatation is common (52%) (3).Classification systems for BAV are disparate(echocardiographic, surgical, anatomical) and fail tobe comprehensive (4–6). However, two common con-figurations can be recognized: anteroposterior (AP),with an ideal fusion of the two coronary cusps, andlatero-lateral (LL), with an ideal fusion of the rightand noncoronary cusps (7). These phenotypes are
known to hold pathogenetic (1,8) and embryogenetic(9) differences. Pathogenesis of aortic dilatation inthe presence of BAV is controversial. Some authorsunderline the role of fibrillin deficiency and endothe-lial nitric oxide synthase, claiming a genetic hypoth-esis (10,11). An alternative hemodynamic hypothesisstates that flow patterns through a bicuspid orificemay cause altered fluid dynamics and promote aneu-rysm formation (12). To support the latter theory,echocardiographic studies found maximum shearstress at ascending aortic wall convexity (the externalaortic wall portion relative to the curvature) (13),while magnetic resonance-based studies showedabnormal aortic flow patterns (14), abnormal wallshear stresses (WSS) (15,16), and eccentric aortic jet(17) in BAV patients, suggesting that hemodynamicfactors (rather than genetic) contribute to ascendingaortic aneurysm formation.
In a previous computational study, these findingshave been confirmed, with quantification of aortic
doi:10.1111/j.1525-1594.2011.01356.x
Received May 2011; revised July 2011.Address correspondence and reprint requests to Prof. Giovanni
Battista Luciani, Division of Cardiac Surgery, University ofVerona, O.C.M. Piazzale Stefani 1, Verona 37126, Italy. E-mail:[email protected]
bs_bs_banner
© 2011, Copyright the AuthorsArtificial Organs © 2011, International Center for Artificial Organs and Transplantation and Wiley Periodicals, Inc.
Artificial Organs 2012, 36(4):368–378
WSS in BAV patients (18). In that work, only tworepresentative configurations, one for AP and one forLL BAV subtype, have been considered, and thecomputed WSS has been compared, in a quali-tative way, with those obtained for a tricuspidconfiguration. In the present study, we build on ourprevious work to provide a deeper understanding onthe role of valve geometry and orientation on ascend-ing aorta hemodynamics. In particular, there arethree main developments: the performance of a para-metric study on the area and the orientation of BAV,the introduction of novel WSS-based indices for thequantitative assessment of the influence of valvegeometry on localization and magnitude of WSS inthe ascending aorta, and the introduction of quanti-tative insight on the asymmetry of the blood flow jetexiting the valve through the introduction of an indexdesigned to be readily tested as tool for routineradiological evaluations.
MATERIALS AND METHODS
Reconstruction of geometries from magneticresonance imaging (MRI) data
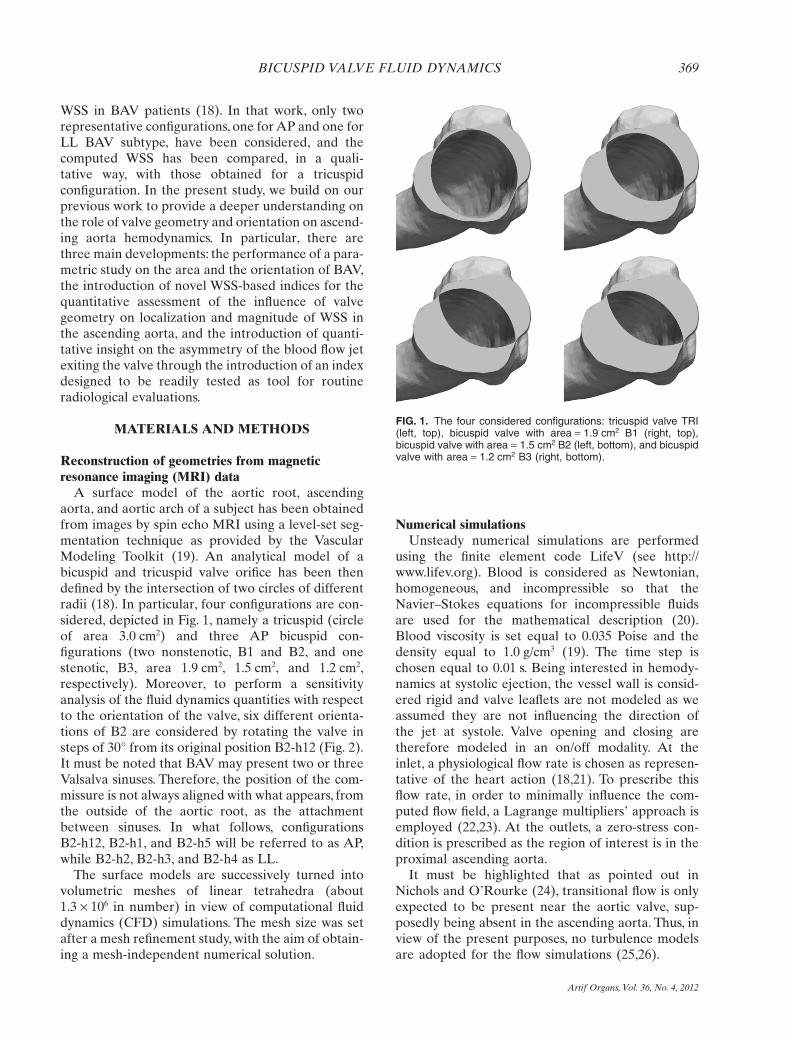
A surface model of the aortic root, ascendingaorta, and aortic arch of a subject has been obtainedfrom images by spin echo MRI using a level-set seg-mentation technique as provided by the VascularModeling Toolkit (19). An analytical model of abicuspid and tricuspid valve orifice has been thendefined by the intersection of two circles of differentradii (18). In particular, four configurations are con-sidered, depicted in Fig. 1, namely a tricuspid (circleof area 3.0 cm2) and three AP bicuspid con-figurations (two nonstenotic, B1 and B2, and onestenotic, B3, area 1.9 cm2, 1.5 cm2, and 1.2 cm2,respectively). Moreover, to perform a sensitivityanalysis of the fluid dynamics quantities with respectto the orientation of the valve, six different orienta-tions of B2 are considered by rotating the valve insteps of 30° from its original position B2-h12 (Fig. 2).It must be noted that BAV may present two or threeValsalva sinuses. Therefore, the position of the com-missure is not always aligned with what appears, fromthe outside of the aortic root, as the attachmentbetween sinuses. In what follows, configurationsB2-h12, B2-h1, and B2-h5 will be referred to as AP,while B2-h2, B2-h3, and B2-h4 as LL.
The surface models are successively turned intovolumetric meshes of linear tetrahedra (about1.3 ¥ 106 in number) in view of computational fluiddynamics (CFD) simulations. The mesh size was setafter a mesh refinement study, with the aim of obtain-ing a mesh-independent numerical solution.
Numerical simulationsUnsteady numerical simulations are performed
using the finite element code LifeV (see http://www.lifev.org). Blood is considered as Newtonian,homogeneous, and incompressible so that theNavier–Stokes equations for incompressible fluidsare used for the mathematical description (20).Blood viscosity is set equal to 0.035 Poise and thedensity equal to 1.0 g/cm3 (19). The time step ischosen equal to 0.01 s. Being interested in hemody-namics at systolic ejection, the vessel wall is consid-ered rigid and valve leaflets are not modeled as weassumed they are not influencing the direction ofthe jet at systole. Valve opening and closing aretherefore modeled in an on/off modality. At theinlet, a physiological flow rate is chosen as represen-tative of the heart action (18,21). To prescribe thisflow rate, in order to minimally influence the com-puted flow field, a Lagrange multipliers’ approach isemployed (22,23). At the outlets, a zero-stress con-dition is prescribed as the region of interest is in theproximal ascending aorta.
It must be highlighted that as pointed out inNichols and O’Rourke (24), transitional flow is onlyexpected to be present near the aortic valve, sup-posedly being absent in the ascending aorta. Thus, inview of the present purposes, no turbulence modelsare adopted for the flow simulations (25,26).
FIG. 1. The four considered configurations: tricuspid valve TRI(left, top), bicuspid valve with area = 1.9 cm2 B1 (right, top),bicuspid valve with area = 1.5 cm2 B2 (left, bottom), and bicuspidvalve with area = 1.2 cm2 B3 (right, bottom).
BICUSPID VALVE FLUID DYNAMICS 369
Artif Organs, Vol. 36, No. 4, 2012

Indices for the comparison of differentconfigurations
Because the main aim of this article is the quanti-tative comparison of hemodynamics among differentBAV configurations, in this section, new indices for aquantification of WSS are introduced. To this end, letA be the area of a surface of interest and let S(t) be athreshold for the WSS W(t), t being the time. LetAQ(t, S) be the area of the region of interest such thatat time t, the WSS is greater than S(t):
A t S t S dA t sif W t S t
if W t S tQ A
, , , ,,
,.( ) = ( ) ( ) =
( ) ≥ ( )( ) < ( ){∫ ε ε
1
0
The following two functions are introduced
Q t sA t s
AQ
1 ,,
,( ) =( )
Q t SW t dA
AAQ
2 ,( ) =( )∫
and the following global indices, namely themaximum and the mean value of Qj(t, S), j = 1,2,over the cardiac beat, are defined
Q S Q t S jj t T jMAX ( ) = ( ) =∈[ ]max , , , ,,0 1 2 (1)
Q ST
Q t S dt jj jTMEAN ( ) = ( ) =∫
11 2
0, , , . (2)
In what follows, it is referred to Q1 indices as WSSdistribution indices while to Q2 indices as WSS inten-sity indices.
Another specific behavior of the blood flow down-stream of bicuspid valves is the asymmetry of the jetentering in the aorta (18). In order to quantify suchasymmetry with a synthetic index, the velocity mag-nitude field on a slice orthogonal to the vessel axis ismapped onto the circle of unit radius. In this circle,the distance D between the point corresponding tothe maximum velocity and the center is computed(Fig. 3), yielding a number between 0 and 1. A highvalue of D means that the asymmetry is pronounced.
RESULTS
In this section, the results obtained from numericalsimulations for the different geometric configura-tions are presented. Section “WSS analysis” isfocused on the WSS distribution, aiming at findingrelations between WSS intensity and location, anddifferent valve configurations. Section “flow asymme-try analysis” is focused on finding a relationship
FIG. 2. The six considered configurationsfor B2: B2-h12 (left, top), B2-h1 (center,top), B2-h2 (right, top), B2-h3 (left,bottom), B2-h4 (center, bottom), andB2-h5 (right, bottom).
FIG. 3. Mapping of a slice orthogonal to the aorta axis onto thecircle of radius equals 1. The point C (the center) and the point M(where the maximum velocity occurs) are mapped onto C′ andM′, whose distance defines the index D.
C. VERGARA ET AL.370
Artif Organs, Vol. 36, No. 4, 2012

between different valve configurations and thedegree of asymmetry of the blood flow entering theascending aorta.
WSS analysisIn Fig. 4, the WSS at time t = 0.16 s (i.e., few
instants just after the peak systole, when WSS ismaximum) is reported.A clear increase in WSS in thebicuspid cases with respect to tricuspid is observed.An increase is also evident when comparing B1 withB2, while it is less pronounced when comparing B2with B3. Interestingly, the region of higher WSSmoves toward the aortic root for decreasing areas ofthe orifice.
In order to quantitatively characterize aortichemodynamics according to the indices proposed inthe previous section, the region of interest shown inFig. 5, left, is considered. Reported in Table 1 is thevalue of Qi
MAX and QiMEAN, i = 1,2, defined in Eqs. 1
and 2, for three values of S. These results consistentlyshow highest values for bicuspid configurations com-pared with tricuspid in particular values increase fordecreasing areas. According to these results, thequalitative behavior of the indices is essentially inde-pendent of the choice of the threshold S so that inwhat follows, we consider just one value of S.
In order to characterize WSS patterns at differentlevels of the aorta, the following locations are consid-ered: annulus (A1), Valsalva sinus (A2), sinotubolarjunction (STJ, A3), and mid-ascending aorta (A4)(see Fig. 5, right). Reported in Table 2 are the valuesof the indices, for S = 1 Pa at these locations (it isobserved that in this case, the integrals for the com-putation of AQ and Q2 are performed over lines). Inthese results, all four indices show that the WSS at theannulus is higher for tricuspid, while at the otherthree levels, it is higher for bicuspid configurations.Again, the values of the indices show that the WSS ishigher for decreasing values of the area, with theexception of index Q1
MAX(1) for levels A2 and A3 andof Q2
MAX(1) for level A4.In Fig. 6, the WSS at time t = 0.16 s for the six
rotated configurations of B2 is reported.These resultsshow that there are no pronounced differencesamong the six cases, which, however, are character-ized by exposure to higher WSS compared withtricuspid. In Table 3, we show the values of the
FIG. 4. Wall shear stress (in Pascal) at t = 0.16 s: TRI configu-ration (left, top), B1 configuration (right, top), B2 configuration(left, bottom), and B3 configuration (right, bottom).
FIG. 5. Left: region of interest where the quantities Qj arecomputed. Right: four different locations where the fluid dynam-ics quantities are computed. From bottom to top: annulus, Val-salva sinus, STJ, mid-ascending aorta.
TABLE 1. Values of the four proposed indices forS = 1,2,3 Pa. WSS intensity indices Q2 are expressed in
Pa/cm2
TRI B1 B2 B3
Q1MAX(1) 0.358 0.492 0.550 0.593
Q1MAX(2) 0.030 0.153 0.175 0.191
Q1MAX(3) 0.000 0.029 0.063 0.084
Q1MEAN(1) 0.162 0.230 0.270 0.336
Q1MEAN(2) 0.003 0.042 0.059 0.075
Q1MEAN(3) 0.000 0.005 0.014 0.024
Q2MAX(1) 0.178 0.382 0.456 0.513
Q2MAX(2) 0.004 0.086 0.145 0.189
Q2MAX(3) 0.000 0.006 0.026 0.053
Q2MEAN(1) 0.051 0.128 0.169 0.222
Q2MEAN(2) 0.000 0.019 0.039 0.059
Q2MEAN(3) 0.000 0.001 0.005 0.013
BICUSPID VALVE FLUID DYNAMICS 371
Artif Organs, Vol. 36, No. 4, 2012

indices for these configurations, with S = 2 Pa,showing that LL configurations B2-h2 and B2-h4 areassociated to slightly higher values.
Finally, in Fig. 7, the values of the indices for the sixrotated configurations with S = 1 Pa are reported atdifferent levels. The values of the indices at theannulus (level A1) have been omitted because for allthe bicuspid configurations, they are negligible withrespect to the tricuspid configuration (Table 2). Itcan be observed that at level A2 the highest values ofall four indices are obtained for configuration B2-h3,B2-h4, and B2-h5. At level A3, the intensity indicesand Q1
MEAN are higher for the LL configurations,while index Q1
MAX assumes an almost constant valueamong the six configurations. In addition, at level A4,the distribution indices are higher for the AP configu-rations, while the intensity indices feature an irregu-lar trend, even if the highest value is reached for theAP configuration B2-h1. Last, in all configurations,the four indices are highest at STJ and mid-ascendingaorta levels.
TABLE 2. Values of the four proposed indices forS = 1 Pa at the four locations Aj, j = 1, . . . ,4. WSS intensity
indices Q2 are expressed in Pa/cm2
TRI B1 B2 B3
A1 Q1MAX(1) 0.102 0.051 0.016 0.024
A1 Q1MEAN(1) 0.051 0.026 0.003 0.005
A1 Q2MAX(1) 0.025 0.019 0.001 0.001
A1 Q2MEAN(1) 0.011 0.006 0.000 0.000
A2 Q1MAX(1) 0.040 0.214 0.129 0.845
A2 Q1MEAN(1) 0.008 0.016 0.041 0.167
A2 Q2MAX(1) 0.002 0.023 0.046 0.461
A2 Q2MEAN(1) 0.000 0.002 0.011 0.088
A3 Q1MAX(1) 0.161 0.194 0.963 0.912
A3 Q1MEAN(1) 0.079 0.035 0.173 0.362
A3 Q2MAX(1) 0.046 0.019 0.524 0.559
A3 Q2MEAN(1) 0.018 0.003 0.056 0.175
A4 Q1MAX(1) 0.669 0.731 0.801 0.826
A4 Q1MEAN(1) 0.290 0.380 0.443 0.465
A4 Q2MAX(1) 0.322 0.994 0.953 0.869
A4 Q2MEAN(1) 0.090 0.364 0.394 0.367
FIG. 6. Wall shear stress (in Pascals) at t = 0.16 s: B2-h12 (left, top), B2-h1 (center, top), B2-h2 (right, top), B2-h3 (left, bottom), B2-h4(center, bottom), and B2-h5 (right, bottom).
C. VERGARA ET AL.372
Artif Organs, Vol. 36, No. 4, 2012

Flow asymmetry analysisFigure 8 reports the velocity field at peak instant
t = 0.12 s at levels A2,A3, and A4, and on the right thevelocity vectors. In Table 4, the values of index Dobtained at these locations are shown. The resultsclearly show an increment of the asymmetry of bloodflow for decreasing values of the orifice’s area. Inparticular, configurations B2 and B3 have roughly thesame degree of asymmetry, which is higher comparedwith that in B1.
In Fig. 9, the velocity field at time t = 0.12 s for thesix rotated configurations, at levels A2, A3, and A4,and the related velocity vectors (on the right) arereported. A tendency toward great asymmetry andvelocity vectors at the level of sinus of Valsalva andsinotubular junction in the LL configurations isapparent. Lastly, Table 5 presents the values of indexD for these configurations at these locations, showingthat the differences in the degree of asymmetry forthe six orientations are present but not pronounced.
DISCUSSION
Numerical approaches for the study of hemody-namics in the ascending aorta have been employedsuccessfully in the past. Prior studies are available(25–27), where an open tricuspid valve configurationwas considered. Recently,Tse et al. performed a com-parison between preaneurismal and postaneurismalaorta of the same patient, highlighting the role ofnumerical tools in the investigation of the complica-tions due to a bicuspid configuration (28). Again, noopening and closure mechanism of the leaflets wasmodeled. All these studies were performed usingrigid walls and laminar flow. Other works investi-gated the mechanism of bicuspid valve opening inrealistic, although not patient-specific, geometries(29,30).
The current study presents an application of com-putational methods to address the clinical question ofaortic aneurysms in BAV patients. This methodologywas previously used to study differences in WSSexposure among tricuspid and two normally func-tioning BAV configurations, pointing out that inthe latter, WSS was higher (17). Support for these
TABLE 3. Values of the four proposed indices for S = 2 Pa for the six rotatedconfigurations. WSS intensity indices Q2 are expressed in Pa/cm2
B2-h12 B2-h1 B2-h2 B2-h3 B2-h4 B2-h5
Q1MAX(2) 0.175 0.161 0.192 0.171 0.186 0.170
Q1MEAN(2) 0.059 0.053 0.074 0.065 0.067 0.067
Q2MAX(2) 0.145 0.136 0.171 0.132 0.171 0.134
Q2MEAN(2) 0.039 0.036 0.053 0.040 0.050 0.034
FIG. 7. Plot of the four WSS indices with threshold equal to 1 Pa.The vertical line separates the AP configurations (left) from the LLconfigurations (right). Valsalva sinus (level A2), top; STJ (levelA3), middle; mid-ascending aorta (level A4), bottom.
BICUSPID VALVE FLUID DYNAMICS 373
Artif Organs, Vol. 36, No. 4, 2012

observations can be found in previous works (13,31)that suggested that in these cases, the risk of aneu-rysm formation might be high, thereby corroboratingthe hemodynamic hypothesis of ascending aortaaneurysm formation (17). In the present analysis,
BAV area and orientation were varied to look forpotential relationships between valve geometry andlocation and magnitude of WSS and asymmetry ofthe jet. In addition, new synthetic indices for theevaluation of hemodynamic impairment, whichmight be related to the risk of aneurysm formation,have been proposed.
Estimates for maximum WSS for the tricuspid caseis about 1.5 Pa (Fig. 4), in agreement with values pre-viously reported (25,32), while for the bicuspid cases,it is about 3 Pa. This value seems to be higher whencompared with prior results (28). It must be noted,however, that in the latter article, Tse and associatesreported time-averaged WSS generated in a case ofBAV with valve insufficiency.
FIG. 8. Velocity field at three different locations and velocity vectors in the zone of interest for the four configurations. From top to bottom:TRI, B1, B2, B3. From left to right: Valsalva sinus, STJ, mid-ascending aorta, velocity vectors—t = 0.12 s.
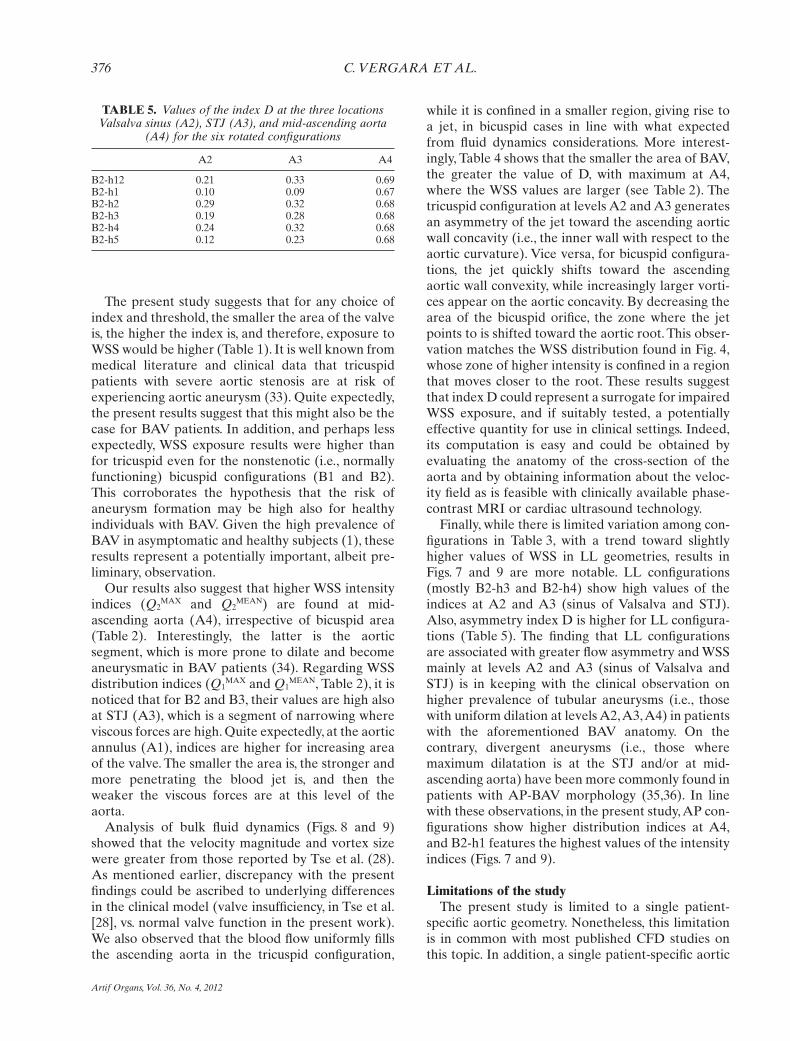
TABLE 4. Values of the index D at the three locationsValsalva sinus (A2), STJ (A3), and mid-ascending aorta
(A4)
A2 A3 A4
TRI 0.32 0.26 0.20B1 0.09 0.19 0.61B2 0.21 0.33 0.69B3 0.22 0.35 0.70
C. VERGARA ET AL.374
Artif Organs, Vol. 36, No. 4, 2012

FIG. 9. Velocity field at three different locations and velocity vectors in the zone of interest, for the six configurations. From top to bottom:B2-h12, B2-h1, B2-h2, B2-h3, B2-h4, B2-h5. From left to right: Valsalva sinus, STJ, mid-ascending aorta, orthogonal section—t = 0.12 s.
BICUSPID VALVE FLUID DYNAMICS 375
Artif Organs, Vol. 36, No. 4, 2012
The present study suggests that for any choice ofindex and threshold, the smaller the area of the valveis, the higher the index is, and therefore, exposure toWSS would be higher (Table 1). It is well known frommedical literature and clinical data that tricuspidpatients with severe aortic stenosis are at risk ofexperiencing aortic aneurysm (33). Quite expectedly,the present results suggest that this might also be thecase for BAV patients. In addition, and perhaps lessexpectedly, WSS exposure results were higher thanfor tricuspid even for the nonstenotic (i.e., normallyfunctioning) bicuspid configurations (B1 and B2).This corroborates the hypothesis that the risk ofaneurysm formation may be high also for healthyindividuals with BAV. Given the high prevalence ofBAV in asymptomatic and healthy subjects (1), theseresults represent a potentially important, albeit pre-liminary, observation.
Our results also suggest that higher WSS intensityindices (Q2
MAX and Q2MEAN) are found at mid-
ascending aorta (A4), irrespective of bicuspid area(Table 2). Interestingly, the latter is the aorticsegment, which is more prone to dilate and becomeaneurysmatic in BAV patients (34). Regarding WSSdistribution indices (Q1
MAX and Q1MEAN, Table 2), it is
noticed that for B2 and B3, their values are high alsoat STJ (A3), which is a segment of narrowing whereviscous forces are high. Quite expectedly, at the aorticannulus (A1), indices are higher for increasing areaof the valve. The smaller the area is, the stronger andmore penetrating the blood jet is, and then theweaker the viscous forces are at this level of theaorta.
Analysis of bulk fluid dynamics (Figs. 8 and 9)showed that the velocity magnitude and vortex sizewere greater from those reported by Tse et al. (28).As mentioned earlier, discrepancy with the presentfindings could be ascribed to underlying differencesin the clinical model (valve insufficiency, in Tse et al.[28], vs. normal valve function in the present work).We also observed that the blood flow uniformly fillsthe ascending aorta in the tricuspid configuration,
while it is confined in a smaller region, giving rise toa jet, in bicuspid cases in line with what expectedfrom fluid dynamics considerations. More interest-ingly, Table 4 shows that the smaller the area of BAV,the greater the value of D, with maximum at A4,where the WSS values are larger (see Table 2). Thetricuspid configuration at levels A2 and A3 generatesan asymmetry of the jet toward the ascending aorticwall concavity (i.e., the inner wall with respect to theaortic curvature). Vice versa, for bicuspid configura-tions, the jet quickly shifts toward the ascendingaortic wall convexity, while increasingly larger vorti-ces appear on the aortic concavity. By decreasing thearea of the bicuspid orifice, the zone where the jetpoints to is shifted toward the aortic root. This obser-vation matches the WSS distribution found in Fig. 4,whose zone of higher intensity is confined in a regionthat moves closer to the root. These results suggestthat index D could represent a surrogate for impairedWSS exposure, and if suitably tested, a potentiallyeffective quantity for use in clinical settings. Indeed,its computation is easy and could be obtained byevaluating the anatomy of the cross-section of theaorta and by obtaining information about the veloc-ity field as is feasible with clinically available phase-contrast MRI or cardiac ultrasound technology.
Finally, while there is limited variation among con-figurations in Table 3, with a trend toward slightlyhigher values of WSS in LL geometries, results inFigs. 7 and 9 are more notable. LL configurations(mostly B2-h3 and B2-h4) show high values of theindices at A2 and A3 (sinus of Valsalva and STJ).Also, asymmetry index D is higher for LL configura-tions (Table 5). The finding that LL configurationsare associated with greater flow asymmetry and WSSmainly at levels A2 and A3 (sinus of Valsalva andSTJ) is in keeping with the clinical observation onhigher prevalence of tubular aneurysms (i.e., thosewith uniform dilation at levels A2,A3,A4) in patientswith the aforementioned BAV anatomy. On thecontrary, divergent aneurysms (i.e., those wheremaximum dilatation is at the STJ and/or at mid-ascending aorta) have been more commonly found inpatients with AP-BAV morphology (35,36). In linewith these observations, in the present study, AP con-figurations show higher distribution indices at A4,and B2-h1 features the highest values of the intensityindices (Figs. 7 and 9).
Limitations of the studyThe present study is limited to a single patient-
specific aortic geometry. Nonetheless, this limitationis in common with most published CFD studies onthis topic. In addition, a single patient-specific aortic
TABLE 5. Values of the index D at the three locationsValsalva sinus (A2), STJ (A3), and mid-ascending aorta
(A4) for the six rotated configurations
A2 A3 A4
B2-h12 0.21 0.33 0.69B2-h1 0.10 0.09 0.67B2-h2 0.29 0.32 0.68B2-h3 0.19 0.28 0.68B2-h4 0.24 0.32 0.68B2-h5 0.12 0.23 0.68
C. VERGARA ET AL.376
Artif Organs, Vol. 36, No. 4, 2012

geometry was intentionally chosen so as to focus onthe dependence of blood fluid dynamics in theascending aorta upon valve orientation and area,neglecting the potential bias introduced by individualgeometric factors. However, the numerical analysisgenerated by the present model requires testing onlarger clinical data set. A second limitation is theassumption of rigid walls, which is probably simplisticas the displacement of aortic walls is not negligible.However, prior work highlighted that differences inWSS between rigid and compliant case should notexceed 10% (25). Moreover, valve leaflets andopening and closing mechanisms were not taken intoaccount. Due to complexity inherent with modeling,no studies incorporating valve leaflet biomechanicsand CFD in real patient-specific geometries are avail-able at present. In addition, it must be noted that thepresent study is focused on the study of the jet exitingthe valve orifice at peak systole. Because, as observedfrom Figs. 8 and 9, the jet seems to exit perpendicularto the valve plane, it can be argued that the presentresults capture the major features of the flow ina realistic setting. Work on incorporating fluid–structure interaction and valve dynamics in thesimulation is currently under way. Finally, this hemo-dynamic theory may not account for progression ofascending aortic aneurysm in patients after aorticvalve replacement or repair, observed in somepatients. In fact, a more recent and balanced view onpathogenesis of aortic dilatation in bicuspid valvesuggests that hemodynamic and genetic factors maybe complementary rather than alternative (12).
CONCLUSIONS
Although with some limitations, the present studyalong with the prior one (18) is, to the best of theauthors’ knowledge, the first attempt to explore theinfluence of valve geometry on aortic aneurysm for-mation using a numerical approach. The presentwork might offer clues and indices on ascendingaortic hemodynamics in BAV patients. In turn,this might provide a theoretical basis for clinicalvalidation with the ultimate goal of predicting thenatural history of BAV and planning surgical strat-egies before the aorta incurs severe aneurysmaldilatation.
Acknowledgments: The authors would like tothank Giovanni Puppini, MD, for performing imageacquisition. The first author has been partially sup-ported by the ERC Advanced Grant No. 227058MATHCARD.
REFERENCES
1. Fedak PW, David TE, Borger M, Verma S, Butany J, WeiselRD. Bicuspid aortic valve disease: recent insights in patho-physiology and treatment. Expert Rev Cardiovasc Ther2003;3:295–308.
2. Ward C. Clinical significance of the bicuspid aortic valve. Heart2010;83:81–5.
3. Nistri S, Sorbo MD, Marin M, Palisi M, Scognamiglio R,Thiene G. Aortic root dilatation in young men with normallyfunctioning bicuspid aortic valves. Heart 1999;82:19–22.
4. Sievers HH, Schmidtke C. A classification system for the bicus-pid aortic valve from 304 surgical specimens. J Thorac Cardio-vasc Surg 2007;133:1226–33.
5. Sabet HY, Edwards WD, Tazelaar HD, Daly RC. Congenitallybicuspid aortic valves: a surgical pathology study of 542 cases(1991 through 1996) and a literature review of 2715 additionalcases. Mayo Clin Proc 1999;74:14–26.
6. Roberts WC. The congenital bicuspid aortic valve. Am JCardiol 1970;26:72–3.
7. Schaefer BM, Lewin MB, Stout KK, Byers PH, Otto CM.Usefulness of bicuspid aortic valve phenotype to predictelastic properties of the ascending aorta. Am J Cardiol2007;99:686–90.
8. Fedak PW, de Sa MP, Verma S, et al. Vascular matrix remod-eling in patients with bicuspid aortic valve malformations:implications for aortic dilatation. J Thorac Cardiovasc Surg2003;126:797–805.
9. Fernàndez B, Duràn AC, Fernàndez-Gallego T, et al. Bicuspidaortic valves with different spatial orientations of the leafletsare distinct etiological entities. J Am Coll Cardiol2009;54:2312–8.
10. Lee TC, Zhao YD, Courtman DW, Stewart DJ. Abnormalaortic valve development in mice lacking endothelial nitricoxide synthase. Circulation 2000;101:2345–8.
11. Collins MJ, Dev V, Strauss BH. Variation in the histopatho-logical features of patients with ascending aortic aneurysms: astudy of 111 surgically excised cases. J Clin Pathol 2008;61:519–23.
12. Barker AJ, Markl M. The role of hemodynamics in bicuspidaortic valve disease. Eur J Cardiothorac Surg 2011;39:805–6.
13. Bauer M, Siniawski H, Pasic M, Schaumann B, Hetzer R. Dif-ferent hemodynamic stress of the ascending aorta wall inpatients with bicuspid and tricuspid aortic valve. J Card Surg2006;21:218–20.
14. Hope MD, Meadows AK, Hope TA, et al. Images in cardio-vascular medicine. Evaluation of bicuspid aortic valve andaortic coarctation with 4d flow magnetic resonance imaging.Circulation 2008;117:2818–9.
15. Weigang E, Kari FA, Beyersdorf F, et al. Flow sensitive fourdimensional magnetic resonance imaging: flow patterns inascending aortic aneurysms. Eur J Cardiothorac Surg2008;34:11–6.
16. Barker AJ, Lanning C, Shandas R. Quantification of hemody-namic wall shear stress in patients with bicuspid aortic valveusing phase-contrast MRI. Ann Biomed Eng 2010;38:788–800.
17. Den Reijer PM, Sallee D III, van der Velden P, et al. Hemo-dynamic predictors of aortic dilatation in bicuspid aortic valveby velocity-encoded cardiovascular magnetic resonance. J Car-diovasc Magn Reson 2010;12:4.
18. Viscardi F, Vergara C, Antiga L, et al. Comparative finite-element model analysis of ascending aortic flow in bicuspidand tricuspid aortic valve. Artif Organs 2010;34:1114–20.
19. Antiga L, Piccinelli M, Botti L, Ene-Iordache B, Remuzzi A,Steinman DA. An image-based modeling framework forpatient-specific computational hemodynamics. Med Biol EngComput 2008;46:1097–112.
20. Formaggia L, Quarteroni A, Veneziani A, eds. CardiovascularMathematics—Modeling and Simulation of the CirculatorySystem. Milan, Italy: Springer, 2009.
BICUSPID VALVE FLUID DYNAMICS 377
Artif Organs, Vol. 36, No. 4, 2012

21. Avolio A. Multi-branched model of the human arterial system.Med Biol Eng Comput 1980;18:709–18.
22. Formaggia L, Gerbeau JF, Nobile F, Quarteroni A. Numericaltreatment of defective boundary conditions for the Navier–Stokes equation. SIAM J Numerical Anal 2002;40:376–401.
23. Veneziani A, Vergara C. Flow rate defective boundary condi-tions in haemodynamics simulations. Int J Numerical MethodsFluids 2005;47:803–16.
24. Nichols WW, O’Rourke MF. McDonald’s Blood Flow in Arter-ies: Theoretical, Experimental and Clinical Principles. London:Edward Arnold, 1998.
25. Jin S, Oshinski J, Giddens DP. Effects of wall motion andcompliance on flow patterns in the ascending aorta. J BiomechEng 2003;125:347–54.
26. Morris L, Delassus P, Callanan A, et al. 3-d numerical simula-tion of blood flow through models of the human aorta. JBiomech Eng 2005;127:767–75.
27. Shahcheraghi N, Dwyer HA, Cheer AY, Barakat AI,Rutaganira T. Unsteady and three-dimensional simulation ofblood flow in the human aortic arch. J Biomech Eng 2002;124:378–87.
28. Tse KM, Chiu P, Lee HP, Ho P. Investigation of hemodynam-ics in the development of dissecting aneurysm within patient-specific dissecting aneurismal aortas using computationalfluid dynamics (CFD) simulations. J Biomech 2011;44:827–36.
29. Weinberg EJ, Kaazempur Mofrad MR. A multiscale compu-tational comparison of the bicuspid and tricuspid aorticvalves in relation to calcific aortic stenosis. J Biomech 2008;41:3482–7.
30. Conti CA, Della Corte A, Votta E, et al. Biomechanical impli-cations of the congenital bicuspid aortic valve: a finite elementstudy of aortic root function from in vivo data. J Thorac Car-diovasc Surg 2010;140:890–6.
31. Cecconi M, Manfrin M, Moraca A, et al. Aortic dimensions inpatients with bicuspid aortic valve without significant valvedysfunction. Am J Cardiol 2005;95:292–4.
32. Efstathopoulos EP, Patatoukasa G, Pantos I, Benekos O,Katritsis D, Kelekis NL. Wall shear stress calculation inascending aorta using phase contrast magnetic resonanceimaging. Investigating effective ways to calculate it in clinicalpractice. Phys Med 2008;24:175–81.
33. Bonow RO, Carabello B, de Leon AC Jr, et al. Guidelines forthe management of patients with valvular heart disease: execu-tive summary: a report of the American College of Cardiology/American Heart Association Task Force on PracticeGuidelines (Committee on Management of Patients with Val-vular Heart Disease). Circulation 1998;98:1949–84.
34. Russo CF, Cannata A, Lanfranconi M, Vitali E, Garatti A,Bonacina E. Is aortic wall degeneration related to bicuspidaortic valve anatomy in patients with valvular disease? JThorac Cardiovasc Surg 2008;136:937–42.
35. Della Corte A, Romano G, Tizzano F, et al. Echocardio-graphic anatomy of ascending aorta dilatation: correlationswith aortic valve morphology and function. Int J Cardiol2006;113:320–6.
36. Luciani GB, Favaro A, Casali G, Santini F, Mazzucco A. Reop-erations for aortic aneurysm after the Ross procedure. J HeartValve Dis 2005;14:766–72.
C. VERGARA ET AL.378
Artif Organs, Vol. 36, No. 4, 2012