Inflation: Risks and Opportunities - Society of Actuaries in Ireland
34
Daragh McDevitt Global Head of Inflation Structuring Inflation: Risks and Opportunities Thursday, 21 st May 2009 Dublin
Transcript of Inflation: Risks and Opportunities - Society of Actuaries in Ireland
Daragh McDevittGlobal Head of Inflation Structuring
Inflation:Risks and OpportunitiesThursday, 21st May 2009Dublin

Presenter's name حي– – 1Presenter's name حي– – 11
Contents
What is inflation?How can I hedge inflation risk?What is going on in the inflation markets?How to take advantage of market disruption?ConclusionAppendix: Inflation Market Overview

Daragh McDevittGlobal Head of Inflation Structuring
What is inflation?
Presenter's name حي– – 3Presenter's name حي– – 33
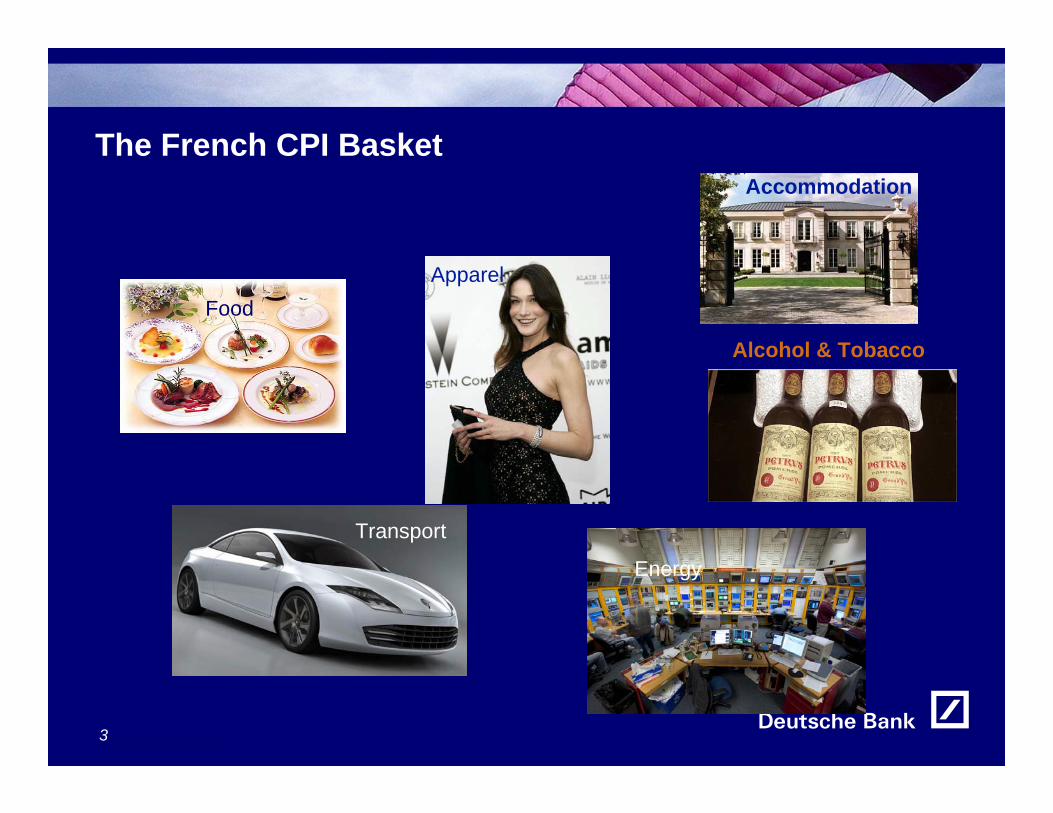
The French CPI Basket
Food
Alcohol & Tobacco
Accommodation
Energy
Apparel
Transport

Presenter's name حي– – 4Presenter's name حي– – 44
The UK RPI Basket
Accommodation
Energy
Apparel
Transport
Food
Alcohol and Tobacco
Presenter's name حي– – 5Presenter's name حي– – 55
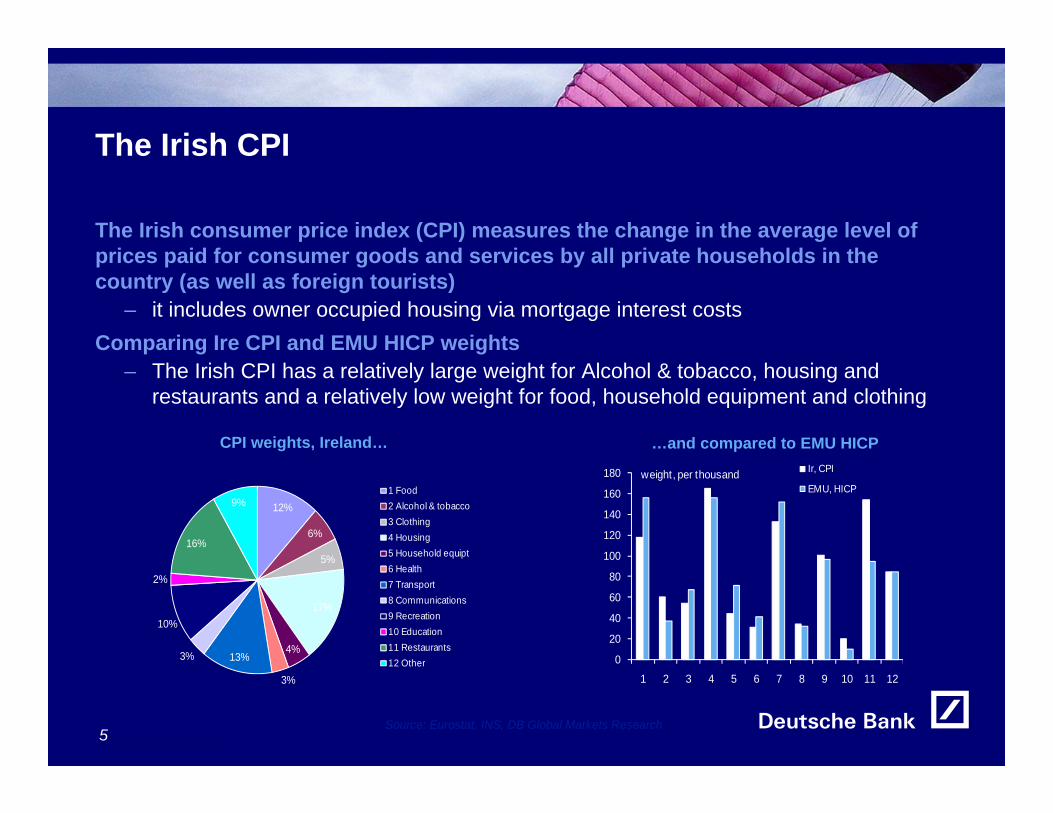
The Irish CPI
The Irish consumer price index (CPI) measures the change in the average level of prices paid for consumer goods and services by all private households in the country (as well as foreign tourists)
– it includes owner occupied housing via mortgage interest costsComparing Ire CPI and EMU HICP weights
– The Irish CPI has a relatively large weight for Alcohol & tobacco, housing and restaurants and a relatively low weight for food, household equipment and clothing
Source: Eurostat, INS, DB Global Markets Research
CPI weights, Ireland… …and compared to EMU HICP
0
20
40
60
80
100
120
140
160
180
1 2 3 4 5 6 7 8 9 10 11 12
Ir, CPI
EMU, HICPweight, per thousand
12%
6%
5%
17%
4%
3%
13%3%
10%
2%
16%
9%1 Food2 Alcohol & tobacco3 Clothing4 Housing5 Household equipt6 Health7 Transport8 Communications9 Recreation10 Education11 Restaurants12 Other

Presenter's name حي– – 6Presenter's name حي– – 66
Ireland has exhibited higher than average inflation
Annual Inflation
-4%
-2%
0%
2%
4%
6%
8%
Jan-
97
Jan-
98
Jan-
99
Jan-
00
Jan-
01
Jan-
02
Jan-
03
Jan-
04
Jan-
05
Jan-
06
Jan-
07
Jan-
08
Jan-
09
EUR HICPIrish CPIIrish HICPUKRPI

Daragh McDevittGlobal Head of Inflation Structuring
How can I hedge inflation risk?

Presenter's name حي– – 8Presenter's name حي– – 88
The Risk Premium
The Fisher Equation Nominal Yields
Real Yields
Inflation
Risk Premium
Liquidity Premium
The Markets Nominal Bonds
Real Bonds
Break even swaps
Nominal YieldBreak Even
InflationReal Yield
Index Linked Bond
Real Yield
Break Even Inflation Swap
Break Even Inflation
( 1 + N ) = ( 1 + R )*( 1 + I )* ( 1 + RP ) * (1+ LP)
Inflation swaps contain the risk premium
Presenter's name حي– – 9Presenter's name حي– – 99
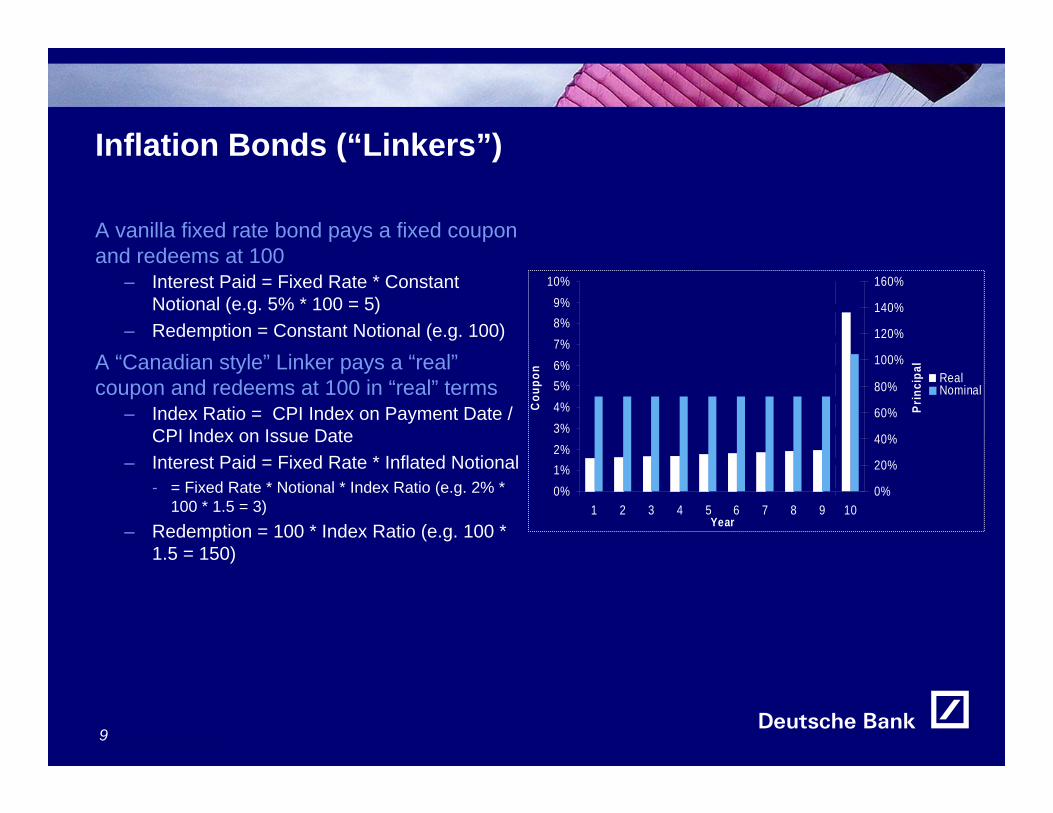
Inflation Bonds (“Linkers”)
A vanilla fixed rate bond pays a fixed coupon and redeems at 100
– Interest Paid = Fixed Rate * Constant Notional (e.g. 5% * 100 = 5)
– Redemption = Constant Notional (e.g. 100)
A “Canadian style” Linker pays a “real”coupon and redeems at 100 in “real” terms
– Index Ratio = CPI Index on Payment Date / CPI Index on Issue Date
– Interest Paid = Fixed Rate * Inflated Notional - = Fixed Rate * Notional * Index Ratio (e.g. 2% *
100 * 1.5 = 3)– Redemption = 100 * Index Ratio (e.g. 100 *
1.5 = 150)
0%1%2%3%4%5%6%7%8%9%
10%
1 2 3 4 5 6 7 8 9 10Year
Cou
pon
0%
20%
40%
60%
80%
100%
120%
140%
160%
Prin
cipa
l
RealNominalS i 3

Presenter's name حي– – 10Presenter's name حي– – 1010
What is an inflation swap?
The cash-flows– Receive Compounded Inflation from Start
to Maturity: pay one cash-flow- CPIt/CPI0 -1
– Pay a known Fixed cash-flow at Maturity- (1 + X%)^t- X is known as the break-even inflation rate
What is the break-even rate?– The rate where the market is indifferent
between buying and selling inflation– Includes the risk premium– Is often thought of as the average expected
inflation rate
1)1( NBEI
1)0(
)( CPI
NCPI
Fixed
Floating

Presenter's name حي– – 11Presenter's name حي– – 1111
How do I hedge insurance risks using swaps?
What are the underling risks?– Insurer is exposed to compounded inflation from today to payment date on each flow– Thus a zero-coupon swap is required for each payment– Combining the individual swaps gives an “annuity” swap with a single rate
0%
2%
4%
6%
8%
10%
12%
14%
1 2 3 4 5 6 7 8 9 10
Real Payment Inflation

Presenter's name حي– – 12Presenter's name حي– – 1212
The Option Market
Year on Year– Pays Year on Year inflation (CPI-3M/CPI-15M) -1) minus strike– For example 10 year 3% cap costs 6.14% (0.73% p.a.)– 0% floor costs 1.15% or 0.14% p.a.
Zero Coupon– Pays compounded inflation minus compounded strike
- (CPIt/CPI0)) – (1+X%)^t– For example 10 year 3% cap costs 6.14% (0.73% p.a.)– 0% floor costs 1.15% or 0.14% p.a.
LPI– Indexation of inflation is capped and/or floored
- LPIt = LPIt-1 * max (CPIt/CPIt-1 ,1)- E.g. if inflation is floored at 0% 10 year annuity swap moves from 2.05% to 2.5% due to option
value
Daragh McDevittGlobal Head of Inflation Structuring
What is going on in Inflation Markets?

Presenter's name حي– – 14Presenter's name حي– – 1414
EUR Inflation SwapsAnnual Inflation
1.5%
1.7%
1.9%
2.1%
2.3%
2.5%
2.7%
2.9%
Apr
04
Oct
04
Apr
05
Oct
05
Apr
06
Oct
06
Apr
07
Oct
07
Apr
08
Oct
08
Apr
09
%
-102030405060708090100
Oil
Pric
e €
EUR 10 Year Inf lation
EUR 30 Year Inf lation
Oil in EUR
Inflation is measured every year
Oil at $150 and stable is not inflationary

Presenter's name حي– – 15Presenter's name حي– – 1515
Volatility has driven breakevens
Breakeven fall has caused gamma hedging by the street to hedge retail 0% floors
3% cap premiums 0.5% higher despite a sell off of over 1% in 5 year breakeven
Low strike floors are trading at a premium and well above their fair economic value given unlikely prolonged deflation scenario
EUR Option Premium
0
50
100
150
200
250
300
350
Jan
08
Feb
08
Mar
08
Apr 0
8
May
08
Jun
08
Jul 0
8
Aug
08
Sep
08
Oct
08
Nov
08
Dec
08
Jan
09
Feb
090
0.5
1
1.5
2
2.5
3
3.55 Year 0% Floor5 Year 3% Cap5 Year Breakeven

Presenter's name حي– – 16Presenter's name حي– – 1616
Bonds and Swaps Diverge…
Swap Richness is the difference between the implied and like for like inflation rate in the bond and that in the swap market
This represents an arbitrage
Swap Richness
-50
-30
-10
10
30
50
70
90
Oct
09
Apr
15
Sep
20
Mar
26
Sep
31
Mar
37
Italy
France
Germany
Greece
US
UK8
UK3
Daragh McDevittGlobal Head of Inflation Structuring
How to Take Advantage of Market Disruption
Presenter's name حي– – 18Presenter's name حي– – 1818
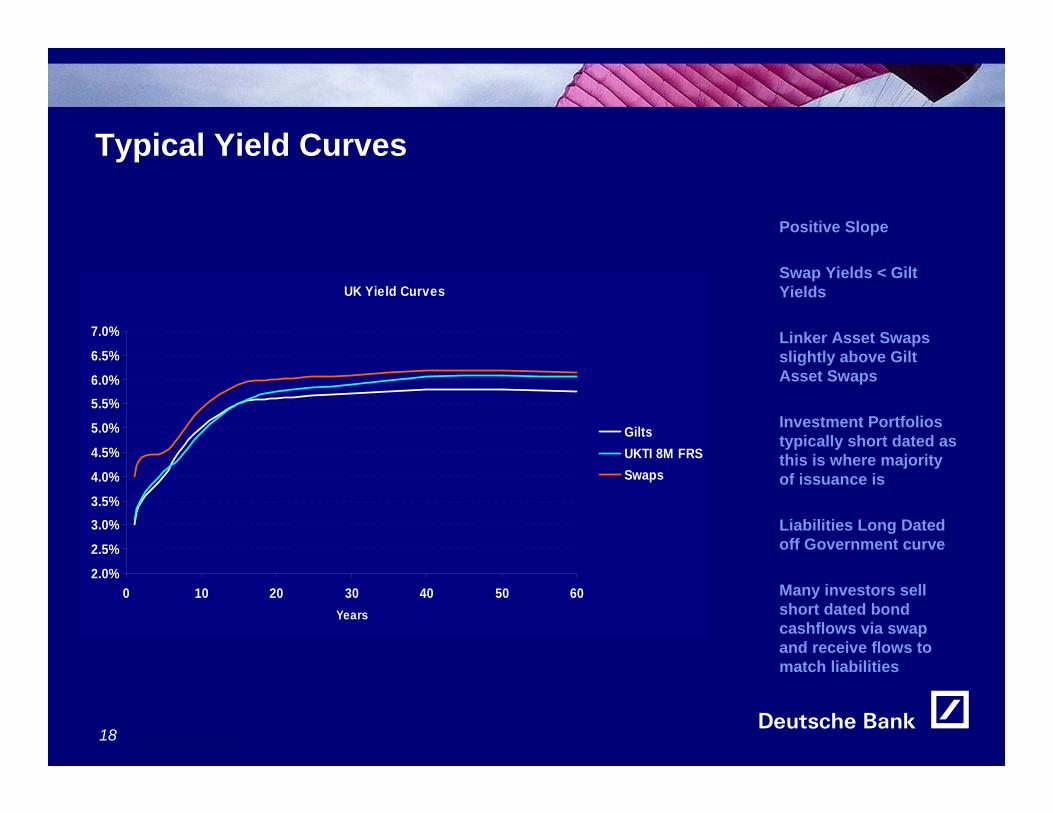
Typical Yield Curves
Positive Slope
Swap Yields < Gilt Yields
Linker Asset Swaps slightly above Gilt Asset Swaps
Investment Portfolios typically short dated as this is where majority of issuance is
Liabilities Long Dated off Government curve
Many investors sell short dated bond cashflows via swap and receive flows to match liabilities
UK Yield Curves
2.0%
2.5%
3.0%3.5%
4.0%
4.5%
5.0%
5.5%6.0%
6.5%
7.0%
0 10 20 30 40 50 60Years
GiltsUKTI 8M FRSSwaps
Presenter's name حي– – 19Presenter's name حي– – 1919
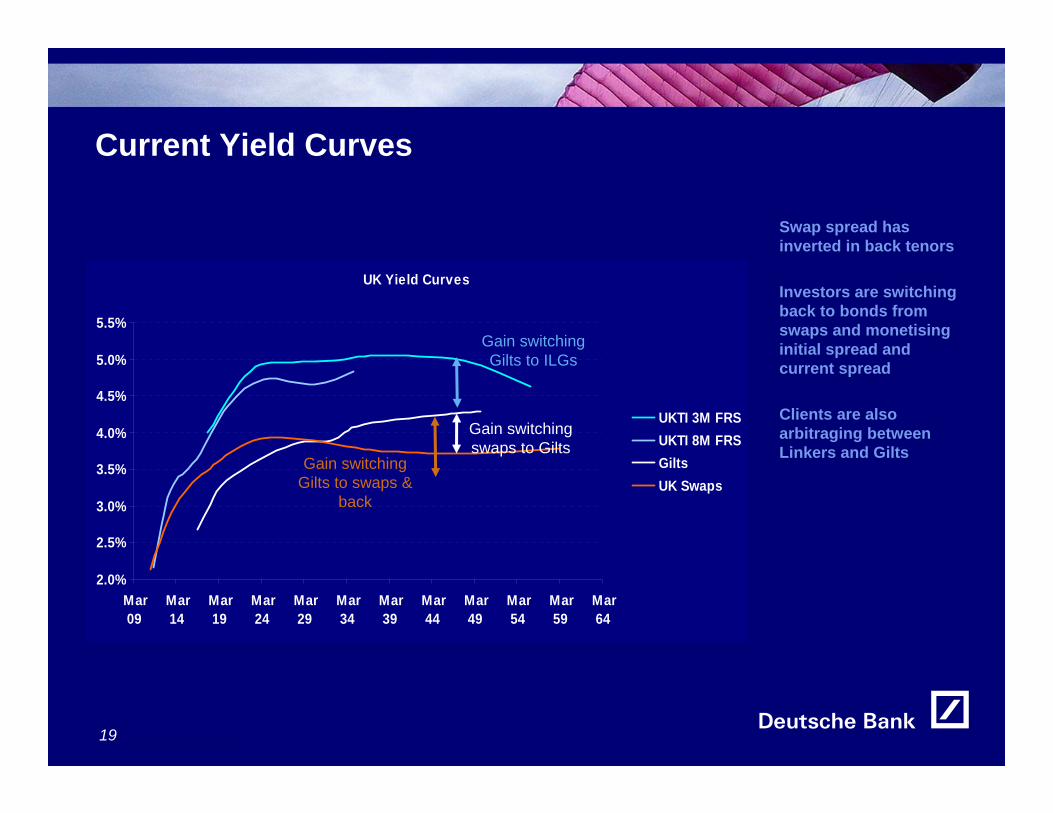
Current Yield Curves
UK Yield Curves
2.0%
2.5%
3.0%
3.5%
4.0%
4.5%
5.0%
5.5%
Mar09
Mar14
Mar19
Mar24
Mar29
Mar34
Mar39
Mar44
Mar49
Mar54
Mar59
Mar64
UKTI 3M FRSUKTI 8M FRSGiltsUK Swaps
Gain switching Gilts to swaps &
back
Gain switching swaps to Gilts
Gain switching Gilts to ILGs
Swap spread has inverted in back tenors
Investors are switching back to bonds from swaps and monetising initial spread and current spread
Clients are also arbitraging between Linkers and Gilts
Presenter's name حي– – 20Presenter's name حي– – 2020
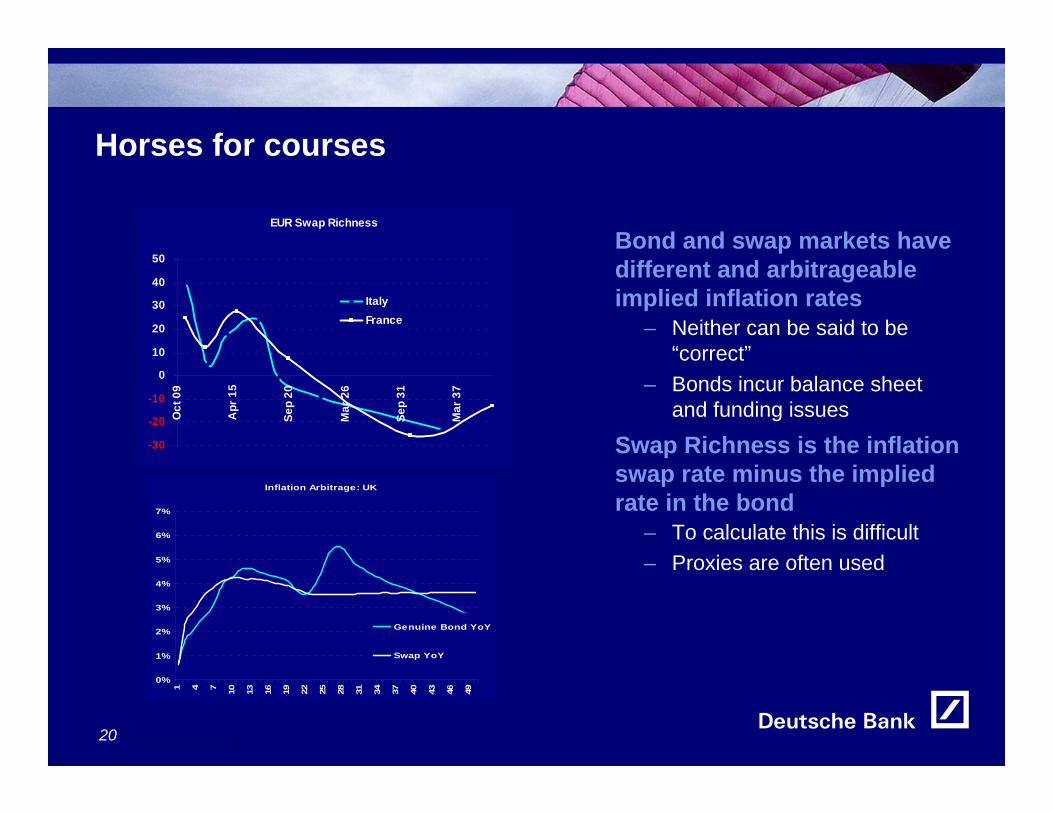
Horses for courses
Bond and swap markets have different and arbitrageable implied inflation rates
– Neither can be said to be “correct”
– Bonds incur balance sheet and funding issues
Swap Richness is the inflation swap rate minus the implied rate in the bond
– To calculate this is difficult– Proxies are often used
EUR Swap Richness
-30
-20
-10
0
10
20
30
40
50
Oct
09
Apr
15
Sep
20
Mar
26
Sep
31
Mar
37
ItalyFrance
Inflation Arbitrage: UK
0%
1%
2%
3%
4%
5%
6%
7%
1 4 7 10 13 16 19 22 25 28 31 34 37 40 43 46 49
Genuine Bond YoY
Swap YoY

Presenter's name حي– – 21Presenter's name حي– – 2121
What is a portfolio switch?
The recent turmoil has thrown up a significant opportunity to obtain substantial pickups over nominal bonds
–Selling nominal government bonds–Buying inflation linked government bonds (“Linkers”) and –Swapping them to a fixed rate for attractive pickups
This pickup can be realized as both
–A running yield enhancement–An upfront cash release (duration * pick up)
– should the client choose to invest less for the same given income
Presenter's name حي– – 22Presenter's name حي– – 2222
Where does the pick up come from?
We have a clear arbitrage by maturity between the price of inflation in the bond market versus the inflation swap marketThis has been driven by inflation bonds not being included in the flight to quality Banks unwinding bonds held on balance sheet to provide inflation for
swaps Hedge funds and street stopping out of bond v swap inflation basis
position Retail and institutional selling of Linkers in the face of oil sell off
In normal markets the basis described is between -10 and 20 basis points in the EUR and UK markets

Presenter's name حي– – 23Presenter's name حي– – 2323
The Linker Switch: boxes and arrows
–Client sells Nominal bonds to DB and buys Linkers of equal value
–Client pays all of the cash-flows on bonds to DB via swap
–DB pays Fixed rate cash-flows to Client to the maturity of each underlying bond
–Client is immune to inflation as all inflation cash-flows are neutralised via the swap
Enhanced Structure
Fixed RateCash-flows
Cash Upfront(the higher yield implies less bonds are required
for the same income)
Current PortfolioClient Nominal
Portfolio
Inflation Linked Cash-flows
Client Linker Portfolio
Inflation Linked Cash-flows
Fixed RateCoupons

Presenter's name حي– – 24Presenter's name حي– – 2424
20,966,218£423,330,181
5,077,5674.98%33 50 UK3 32 15.0 17.04.25%101,919,835 100,000,000 UKT 32
4,259,1614.17%32 40 UK3 27 13.1 8.44.23%102,224,835 100,000,000 UKT 27
5,556,8895.01%56 36 UK3 22 9.0 -19.93.63%110,849,163 100,000,000 UKT 20
6,072,6015.61%86 22 UK3 17 6.5 -64.52.85%108,336,348 100,000,000 UKT 16
Cash SavingSavingPick
UpAsset swapLinker DV01Asset
SwapYieldProceedsNotionalBond
Example Portfolio Switch
Over 0.8% yield pick-up for switching from Gilts to Gilts…
Pick-up * Present Value of 1bp to maturity
£21m PV value created from switch

Presenter's name حي– – 25Presenter's name حي– – 2525
What are the risks and rewards?
Assuming there is no default by the issuer then the client receives an enhanced fixed rate to maturity generating additional revenue–Client is exposed to default of issuer as with nominal bonds
Throughout the life of the trade the client is exposed to the mark to market of the fixed rate asset swap–No ex-ante reason why this should be more volatile than equivalent fixed rate bond
The relative value changes from time to time and so further revenue can be made by switching to between currencies e.g. UK and US Linkers/Nominals depending on degree of anomaly–Pick up under 20 would imply advisable to switch back –US trading over Italy in EUR would suggest time to buy the TIPS market
By engaging in this type of opportunity the client can gain not just the initial pick up but can generate multiples of this over time

Presenter's name حي– – 26Presenter's name حي– – 2626
Alternative Strategies
Positive exposure under CSA from derivative transactions– Cancel/ Recoupon the swap to release MTM– Buy Linker Asset Swaps – Libor asset is replaced by Libor plus asset
Negative Exposure Under CSA from derivative transactions– Buy Linker asset swaps– Replace cash collateral with Linkers– Receive Libor/Euribor + > 100 instead of Sonia/Eonia
Replace existing Linkers with foreign currency Linkers swapped to real yield
– Sell OATei 2040 @ 2.07% Real Yield – Buy Foreign Currency denominated inflation/nominal bond– Pay foreign currency cash-flows to match bond– Receive identical cash-flows as per EUR Bond– Receive cash upfront
Presenter's name حي– – 27Presenter's name حي– – 2727
Conclusion
Inflation hedging releases regulatory capital
Inflation markets present opportunity– Arbitraging govvy or swap curves– Selling volatility at absurdr levels– Switching from inflation bonds to swaps to improve performance
This type of arbitrage activity can generate alpha for no minimal risk– Govvies, Linkers or swaps under a csa will all deliver the required cashflows– Cheapest market differs by tenor and by market
Clients should act swiftly to monetize this market opportunity !

Presenter's name حي– – 28Presenter's name حي– – 2828
Appendix: Euro Bonds
Presenter's name حي– – 29Presenter's name حي– – 2929
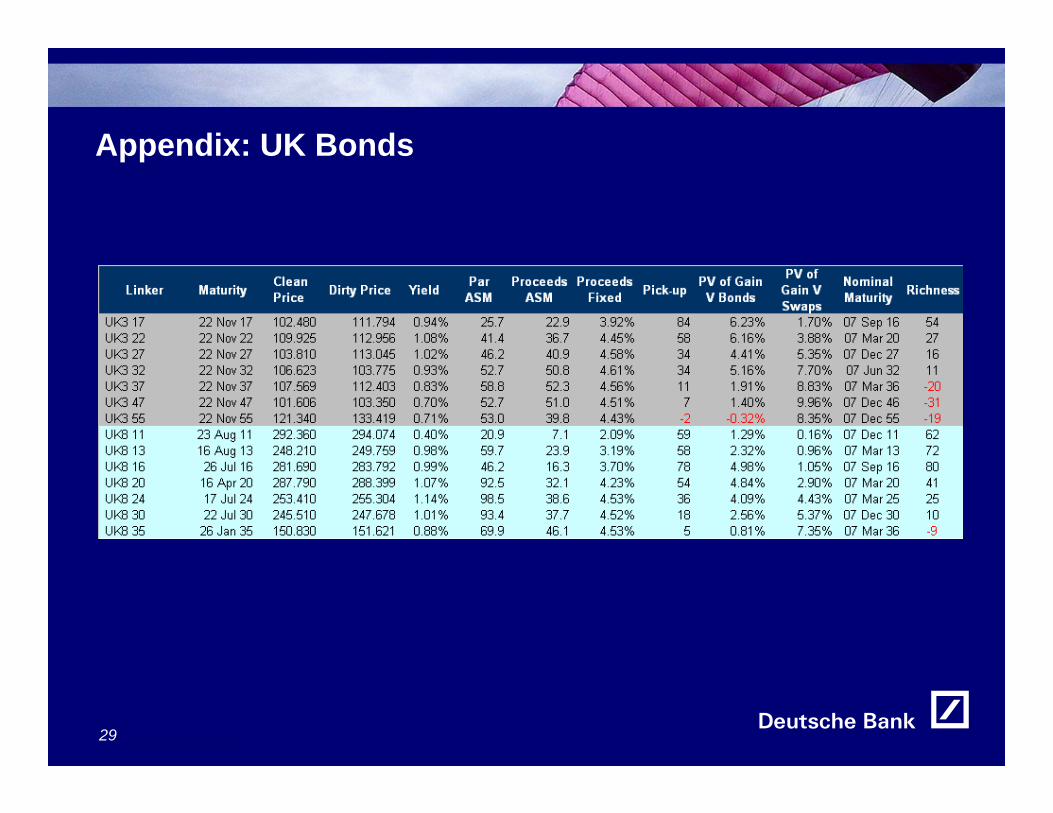
Appendix: UK Bonds
Presenter's name حي– – 30Presenter's name حي– – 3030
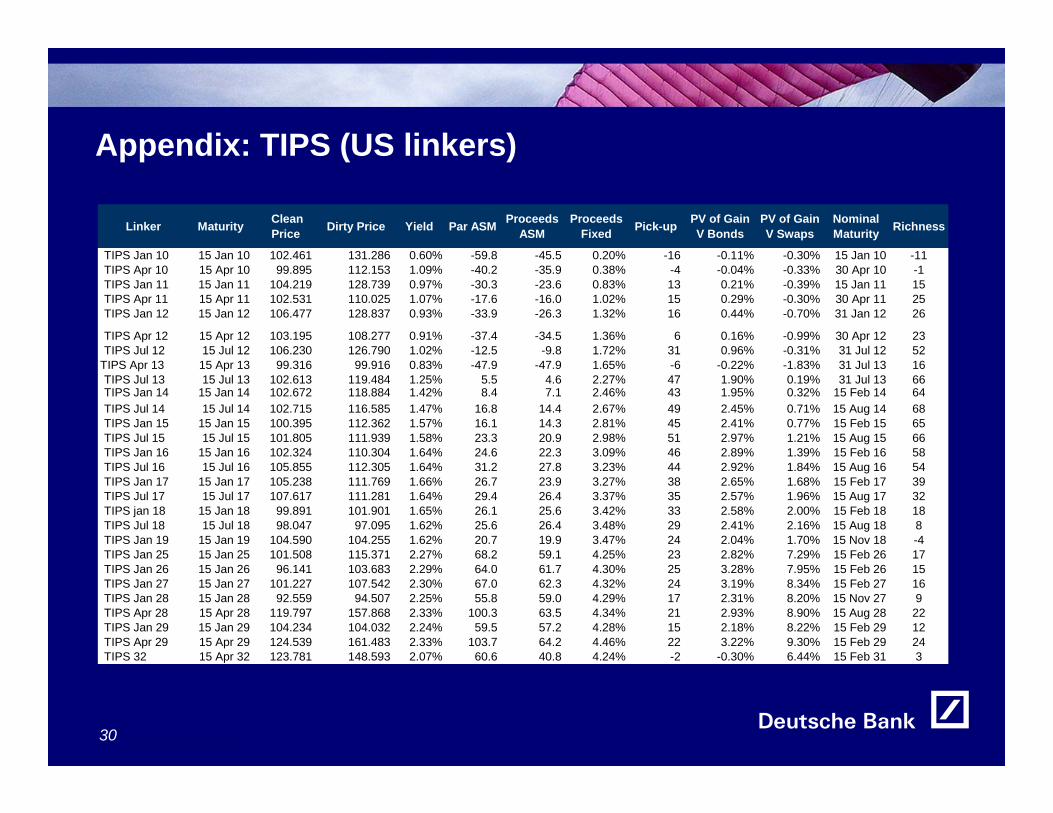
Appendix: TIPS (US linkers)
Linker Maturity Clean Price Dirty Price Yield Par ASM Proceeds
ASMProceeds
Fixed Pick-up PV of Gain V Bonds
PV of Gain V Swaps
Nominal Maturity Richness
TIPS Jan 10 15 Jan 10 102.461 131.286 0.60% -59.8 -45.5 0.20% -16 -0.11% -0.30% 15 Jan 10 -11TIPS Apr 10 15 Apr 10 99.895 112.153 1.09% -40.2 -35.9 0.38% -4 -0.04% -0.33% 30 Apr 10 -1TIPS Jan 11 15 Jan 11 104.219 128.739 0.97% -30.3 -23.6 0.83% 13 0.21% -0.39% 15 Jan 11 15TIPS Apr 11 15 Apr 11 102.531 110.025 1.07% -17.6 -16.0 1.02% 15 0.29% -0.30% 30 Apr 11 25TIPS Jan 12 15 Jan 12 106.477 128.837 0.93% -33.9 -26.3 1.32% 16 0.44% -0.70% 31 Jan 12 26
TIPS Apr 12 15 Apr 12 103.195 108.277 0.91% -37.4 -34.5 1.36% 6 0.16% -0.99% 30 Apr 12 23TIPS Jul 12 15 Jul 12 106.230 126.790 1.02% -12.5 -9.8 1.72% 31 0.96% -0.31% 31 Jul 12 52
TIPS Apr 13 15 Apr 13 99.316 99.916 0.83% -47.9 -47.9 1.65% -6 -0.22% -1.83% 31 Jul 13 16TIPS Jul 13 15 Jul 13 102.613 119.484 1.25% 5.5 4.6 2.27% 47 1.90% 0.19% 31 Jul 13 66TIPS Jan 14 15 Jan 14 102.672 118.884 1.42% 8.4 7.1 2.46% 43 1.95% 0.32% 15 Feb 14 64TIPS Jul 14 15 Jul 14 102.715 116.585 1.47% 16.8 14.4 2.67% 49 2.45% 0.71% 15 Aug 14 68TIPS Jan 15 15 Jan 15 100.395 112.362 1.57% 16.1 14.3 2.81% 45 2.41% 0.77% 15 Feb 15 65TIPS Jul 15 15 Jul 15 101.805 111.939 1.58% 23.3 20.9 2.98% 51 2.97% 1.21% 15 Aug 15 66TIPS Jan 16 15 Jan 16 102.324 110.304 1.64% 24.6 22.3 3.09% 46 2.89% 1.39% 15 Feb 16 58TIPS Jul 16 15 Jul 16 105.855 112.305 1.64% 31.2 27.8 3.23% 44 2.92% 1.84% 15 Aug 16 54TIPS Jan 17 15 Jan 17 105.238 111.769 1.66% 26.7 23.9 3.27% 38 2.65% 1.68% 15 Feb 17 39TIPS Jul 17 15 Jul 17 107.617 111.281 1.64% 29.4 26.4 3.37% 35 2.57% 1.96% 15 Aug 17 32TIPS jan 18 15 Jan 18 99.891 101.901 1.65% 26.1 25.6 3.42% 33 2.58% 2.00% 15 Feb 18 18TIPS Jul 18 15 Jul 18 98.047 97.095 1.62% 25.6 26.4 3.48% 29 2.41% 2.16% 15 Aug 18 8TIPS Jan 19 15 Jan 19 104.590 104.255 1.62% 20.7 19.9 3.47% 24 2.04% 1.70% 15 Nov 18 -4TIPS Jan 25 15 Jan 25 101.508 115.371 2.27% 68.2 59.1 4.25% 23 2.82% 7.29% 15 Feb 26 17TIPS Jan 26 15 Jan 26 96.141 103.683 2.29% 64.0 61.7 4.30% 25 3.28% 7.95% 15 Feb 26 15TIPS Jan 27 15 Jan 27 101.227 107.542 2.30% 67.0 62.3 4.32% 24 3.19% 8.34% 15 Feb 27 16TIPS Jan 28 15 Jan 28 92.559 94.507 2.25% 55.8 59.0 4.29% 17 2.31% 8.20% 15 Nov 27 9TIPS Apr 28 15 Apr 28 119.797 157.868 2.33% 100.3 63.5 4.34% 21 2.93% 8.90% 15 Aug 28 22TIPS Jan 29 15 Jan 29 104.234 104.032 2.24% 59.5 57.2 4.28% 15 2.18% 8.22% 15 Feb 29 12TIPS Apr 29 15 Apr 29 124.539 161.483 2.33% 103.7 64.2 4.46% 22 3.22% 9.30% 15 Feb 29 24TIPS 32 15 Apr 32 123.781 148.593 2.07% 60.6 40.8 4.24% -2 -0.30% 6.44% 15 Feb 31 3

Presenter's name حي– – 31Presenter's name حي– – 3131
Presenter's name حي– – 32Presenter's name حي– – 3232
Contact details
Daragh [email protected]+44 207 545 2750

Presenter's name حي– – 33Presenter's name حي– – 3333
DISCLAIMER
MARKETING MATERIALThis document is intended for discussion purposes only and does not create any legally binding obligations on the part of Deutsche Bank AG and/or its affiliates (“DB”). Without limitation, this document does not constitute an offer, an invitation to offer or a recommendation to enter into any transaction. When making an investment decision, you should rely solely on the final documentation relating to the transaction and not the summary contained herein. DB is not acting as your financial adviser or in any other fiduciary capacity with respect to this proposed transaction. The transaction(s) or products(s) mentioned herein may not be appropriate for all investors and before entering into any transaction you should take steps to ensure that you fully understand the transaction and have made an independent assessment of the appropriateness of the transaction in the light of your own objectives and circumstances, including the possible risks and benefits of entering into such transaction. For general information regarding the nature and risks of the proposed transaction and types of financial instruments please go to www.globalmarkets.db.com/riskdisclosures. You should also consider seeking advice from your own advisers in making this assessment. If you decide to enter into a transaction with DB, you do so in reliance on your own judgment. The information contained in this document is based on material we believe to be reliable; however, we do not represent that it is accurate, current, complete, or error free. Assumptions, estimates and opinions contained in this document constitute our judgment as of the date of the document and are subject to change without notice. Any projections are based on a number of assumptions as to market conditions and there can be no guarantee that any projected results will be achieved. Past performance is not a guarantee of future results. This material was prepared by a Sales or Trading function within DB, and was not produced, reviewed or edited by the Research Department. Any opinions expressed herein may differ from the opinions expressed byother DB departments including the Research Department. Sales and Trading functions are subject to additional potential conflicts of interest which the Research Department does not face. DB may engage in transactions in a manner inconsistent with the views discussed herein. DB trades or may trade as principal in the instruments (or related derivatives), and may have proprietary positions in the instruments (or related derivatives) discussed herein. DB may make a market in the instruments (or related derivatives) discussed herein. Sales and Trading personnel are compensated in part based on the volume of transactions effected by them. The distribution of this document and availability of these products and services in certain jurisdictions may be restricted by law. You may not distribute this document, in whole or in part, without our express written permission. DB SPECIFICALLY DISCLAIMS ALL LIABILITY FOR ANY DIRECT, INDIRECT, CONSEQUENTIAL OR OTHER LOSSES OR DAMAGES INCLUDING LOSS OF PROFITS INCURRED BY YOU OR ANY THIRD PARTY THAT MAY ARISE FROM ANY RELIANCE ON THIS DOCUMENT OR FOR THE RELIABILITY, ACCURACY, COMPLETENESS OR TIMELINESS THEREOF. DB is authorised under German Banking Law (competent authority: BaFin - Federal Financial Supervising Authority) and regulated by the Financial Services Authority for the conduct of UK business.