Single Monetary Policy, Inflation Targeting, Interest Rate ...

Inflation Misinformation andMonetary PolicyLAWRENCE S. DAVIDSON
Consumer prices, held back by the recession and an-other ~
1wp in gasoline and car prices, nDse only two-tenths
of one pcrc~it in Fehroary fronD January’s level, contin-uing the sharp decline in the inflation rat It shows asteady decline in in flation over the past several months)
rr.1 tIE above excerpt is a perfect example of mis-
in fonn ation. a problem that stems Coin coufos ing themeasurement ofpriee change with the measurementand causes of inflation. The foil nrc to distinguish thesymptoms — like changing gasoline prices — fromthe causes of inflation can lead to serious policyerrors.
This article presents evidence to support thehypothesis which states that efforts to counteractshort-term price changes generally are unnecessarytmd counterproductive ,2 We begin bx analyzing thebehavior of the indliyidlual components of the per-son al consumption expenditures index to determinethe <<causes” of observed quarterly changes in the
Lawrence S. Davidson, an ~issociate prolessor ol husiness ccii-nOniics and pnhlie polic at Indiana cniversitv, is a visilitigscholar at the Federal Beseive Bank of St. Louis.
jP~~ciclRick Tiinc.s, March 24.1982.2
’T’l~iisdoes not iilplv. lr>wcv.’r. that such prier:’ chan.ces i:hiimpose cosk on c.:ertaiii groi.ips. .I’ol ic:vinake rs nicav v•• ish to erisictlegislation to add re.ss these pi’iihlcnis. it is armed here only thatsnch increases do not warrant inacroecrnoiiiiic reoiechial ~Oi icr.Alan Blinder conies to the sanie csinclnsiois: ‘‘ From the macroperspective, the voiatil ito: .mf the Cl’I often distrac.’i:s att:’ntionIroni the ecnnomnivs m.mni.~.lerlying or i:i~ise1me nit:e oh infl~itnnispeculate that extreinie Sw ngs in th:’ dI.IL in Hation rate (DeeD—sionahlv contrihute to extreme swings hi national eeonomriicpoi icy.’’ Alan El iridm.~.’r, ‘‘‘Thi..:. (.~.P,nssinucr Price Index amid theNieasuiremneut of Recenmtluflation,’’ Bi’ookincs Pmm/Dcr.s oui Leo—uis’inic \cticitij it chruary 1980), p. 564.
average price level. We then analyze the pen orin—ance of a variable series con strueted to approximatethe cyclical or nontrend movements in the measuredinflation rate. An analysis of this series reveals whythe public should be reluctant to pressure poi ic—makers into reacting quickly to even large short-runchanges in the measured inflation rate. Finally wepresent data nh ich si iggest that monetary p0 licies tocombat short—run changes in the in flation rate raisethe risk of increasing the underlying or long—termtrend of inflation.
S:,i c .Inj’laticii-i:.: 4•fltfl~S)JJc<tjr
US, .It4
cinPhrY
The mneasum’ement of inflation necessarily beginswith a price index. ihe most widely known and usedlindex is the consumer price index (CPU, all index ofthe average price o [a fixed basket of goodis and serv-ices chosen by a typical urban family. The fixed—weight personal consumption expenditures priceindex (PCEI), though similar in most respects to theCP1, is preferable to it in one particular aspect— itstreatment of’ the weight of housing costs .~ ihe imn-portan t points for our discussion are:
Ii ‘the PURl is axveightcd axerage oh indivvlital goods
pri d’d’ 5.
t2t ‘flie value oh the PULl in any given mouth can hegreatly imiuhi teuced 1w changes ui tilt’ price of iuirli-
itlual coin nil milit ~es.
The measurect inflation rate is a simple niathe-mnati cal transformation of the above price index. Forexample, instead of saying that the value ofthe PCI-Hrose from 110 to 104. the inflation rate expresses this
l~or(rio re on this prohlcmri. see RI inder, ‘‘The (:nrisuimnier Pricemdc’s auDi the \ieasnrenieuut of Recent I nllatiori, pp. 539-65.
15

FEDERAL RESERVE BANK OF ST. LOUIS JUNE/JULY 1982
price rise as a percentage change. In the above ctx—anTple, we would say that the inflation rate was 4
104 — 100percent, d)~( 100 ) x 100 percent.
Calculating the inflation rate in tllis way leads onetdl the valid conclusion that a large increase in theprice of one good (e.g., food) can cause a large changein the value of the PCF:I and, therefore, in the inca—sured inflation rate, It is incorrect, however, to say’that food prices cause inflation.
This is because the arithmetic view tells only partof the story. Individual prices rise and fitlI, often inseemingl random onmd unpredictable way’s. Econ—omnists call these re/a tire price changes (since md—vidnal prices are changing relative to one another).Monetary and fiscal policy are not designed to heeffective iii changing relative prices. ihese andother illacrO stabilization policies are better stuted toaffect the joint moyenlent (If all prices, or inflation.
To understand inflation, we ulust first distinguishbetween inflation and relative pnce changes. Rela-tive prices are (letermined by the supply and de-mand conditions in the markets for individual goods.For example, suppose that there were a change inpeoples tastes tllat caused them to spend mllOretlleir income on recreation and less on durablegoods, while other saving and spending plans re-mained the same. This change in relative demandshould raise the relative price of recreational goodsand services while lowering that of durahles . Sincetotal spending remains unchanged, the total demandfor all goods and services is unchanged; only theallocation (If demand across markets has beenaltered, Thc’refore. the overall price level is thesame; only relative prices have changed.
If individuals temporarily redluced saving so they’cOil Id c’onti 91 ne pm trehasin g the sanmc’ amount (Ifclurablc’ goods while purchasing more recreationalservices, then the total do1 lar demand and the pricelevel would be higher.4 Individuals would lIt’ actingas if they were given more income, causing them to
spend more. Once they’ replc’uish their savings.however, total demand and the price level will re-turn to their original lower levels. Thus, a permami ent
~ll all individuals ‘educed their savings, their wouhd he lesslonijahle hinds acaihDilhe or
1~nsiiucssmvestnlent, ‘Therefore, the
liDci’ease in consmnuier spending laci1it~itemlhy tlim’ temporary rm’—clnctioim in saving would he offset iw adecliac in hmnsiuess spenul—tug on investment goods. Althomiglu the cousunler price index istcnipmurarily increased, an investment defl~itorwould he lo’vcr, Ac’niulhi ed umeasure of nverahl consumer amid himsiness priee~would he uuu~ufIectechh~his ehuammge in saving.
clnuige in relative demand does not cause sustainedinflation, though it does cause permanentchanges inrelative prices and may’ cause a temporary c’homge inthe price level.
Rc’lative price changes also occur when tllere arechanges in supply conditions,~These include rela-tive changes in lallor productivity, wages or othercosts associated with the production process. Suchchanges ill a given individual market can cause thc’cost—per-u lit to rise, whiell in turn causes its relative
price to rise. With a given income, people who con-tinue to buy’ tile higher—priced item will be forced to
spend lc’s5 Oil other goods, wllieh puts downwardpressure on tllese prices. This ‘<cost-pusll” examplehas tIlt’ same outcome as the relative demand cmx—ample: relative prices are Tlernlamlently changed, theprice level may change temporarily, lInt inflation is
unaffected.
In the case of increases in the price of inputs likeoil, whicll are usc’d to produce many’ goods, tilt’ in-creases in the price level may he more pervasive andsustai led. Ifinereases in the price of oil are pushedthrough,’’ causing the retail price of most goods torise, individuals whose income has not similarlyri semI are able to Ilny fewer goods and services at thehigher prices. Both the qnantit\’ demanded andsupplied are, therefore, lowered. This lower rate (If
output is permanent unless incomes rise. A tax rc’—Ilate accompanied lly’an increase in the growth rate(If money could temporaril~’raise incomes enough torestore demand to the earlier ratc’ of production, butwill le~tdto another uld’rea5e in the price level asnldividlnals attenlpt to buy’ nlore of all goods.
The point of tllese exaumples is that a varic’ty ofhictors aflbcting the cost and relative demamldl strnc’—tunes in individual markets can cause relative pric’c’sto change. Ihe constrailt that binds the pricechanges in all tIlt’ markets is total spending, or in—cone. Witllout a coin mensurate increase ill spend-ing, none (If these fitetors call cause all prices to rise,that is, none can lead to a pernlanent risc’ in tile
pride index.
The Re!atiori.shi’p Between fntcttion. endIntht. n:ute! PrC~.teCh.a rige.s
A risc’ hI the mneasurc’dl iii flation rate always Il mdc’s agreat deal of information. The increase mlmav rc’sult
Dora ulore mk’tailed exphanatinui of cost-push inflation, see DallasS. Batten, ‘IuH~mtinu: DIe c~nst—Pumsh\hvth,’’ this Reeo’mc lione/July 19Sf), pp. 20—26.
16

FEDERAL RESERVE BANK OF ST. LOUIS JUNE/JULY 1982
Table I
Means and Standard DevIations of Percentage Changes inthe PCEI and Its 18 Major Components1
11/1959 lV/1987 1/1988 1/1981Standard Standard
Category Weglit Mean deviation Mean deviation
Motor vehtcles 052 1.13% 385% 506% 463%Furniture 045 030 116 369 256
Otherdurables 017 127 189 501 336Food 261 182 237 696 458
Clothing 082 1.66 155 381 226Gas&oul 031 1.62 481 1058 1729Fuel oil & coal 012 1 01 4.33 1472 2005Other nondi.trables 081 1 18 1 29 571 3.31Housing services .137 1 53 045 5 54 1 84Housing operations 060 1 73 1 69 6 57 3 24Transportation services 037 232 1.97 733 482Per onal care services 019 276 1 76 7 IS 3 02Medical services 058 376 1.88 764 409
Personal business services 054 3,39 344 7 11 3.23Education & research 013 287 1 66 7 50 267Recreation services 022 353 1 90 5 11 1.88Religious & welfare 015 1 61 309 7 31 3 66Net foreign travel 003 1 62 529 767 1498
PCEI 1,000 185 098 634 239
1Figures are average of annuali ed quarterly rates of change
from all prices using together, oi merely one price centag s of total expenditure allocated to eachrising by itself. Fuithermore, this change may prove component.to be either temporary or permanent. Policymakers
I’he measured average yearly inflation rate moreconcerned with the causes of and cure for inflation .
. . than tripled from 1.85 percent in the initial period towould find this hiddlen information highly relevant.6.34 percent in the latter. The standard deviation, a
Consider the behavior of the individual prices of measure of dispersion arouiTd the average, more thangoods and services mncludledi in the PCEI over the doubled. In the 1968—81 period, the annualizedpast 23 years. Table 1 lists various information about quarterly inflation rate averaged 6.34 percent perthe 18 major categories that make up this index. year, but the average deviation in any particularBecause inflation generally has been higher since quarter was about 2.4 percent. This implies that the1968, the table can be conveniently divided into two inflation rate was between 1.5 percent and 11.1 per-periods: a nine—year period before 1968 and a 14- cent, 95 percent of the time. During this periodyear period afterward. The table shows the mean andthe standard deviation forthe PCEI andeach ofits 18 ________________________________________________components over both periods. This PCEI is a fixed— price and quantity change. The fixed-weight index is’’a Illeasure
weight version, which retains the weights from the ~ ~~‘edluarter’to-(tuarter ~ ciIaiI~e. Once fixed, mm set of6 . weights perfectly captm.ires the buying pattermls of the average
first quarter of 1959. The weights are the per— household over a long period of time. We arhitrarilychose to useweights from tile beginning of tile sample period Using weightslm’oni tIme emld ofthe period would not measurably alter the resultshere. This is because the weights have not changed enougil on8
A fixed—weight index is used ilecause variable—weight indices, ildi”idual price doillpOneilts to change the llehavior of the over-when (‘Den to compare quarter—to—quarter c tuange s, 01ix toge timer all menDrued inflation rate
17

FEDERAL RESERVE BANK OF ST. LOUIS JUNE/JULY 1982
(1968-81), selected categories averagedl between:~
Housing services: 1.9% to 9.1%
Motor vehicles: —4.0Y~-to 14.6%Nmel oil and coal: —-24.6cc to 54.02<3-
Fuel oil and coal prices, the fastest-growing con-sumer prices, averaged over 14 percent per year, fol-lowed closely by gas and oil atabout 10.6 perceutperyear. Furniture (3.7 percent) and clothing (3.8 per-cent) were the most slowly growing consumer prices.
The evidlence fionl table 1 suggests that tile mea-suredI inflation of the recent past is not the result ofall prices rising at the same rate each quarter. Thesefigures, however, say very little about the role ofparticular relative prices as causes of sustained pricechange. For example, fuel oil and coal prices rose, onaverage, fluster than any of the other prices. But theseincreases were anything but gradlual or persistent. Oftile 88 quarters from 11/1959 to 1/1981, the inflationrate ofhuel oil and coal exceeded tile rate ofthe PCEIonly 45 times. That means during 43 of the quarters,fuel oil and coal prices rose more slowly than overallinflation. In 22 of these quarters, the absolute priceof fuel oil and coal fell (a negative inflation rate forthis category). During these 88 quarters, there wasnot a single episode when the inflation rate on fueloil and coal increased for nuore thami four consectmtn-equarters. This patterml (though not necessarily tilemagnitude) of volatility is typical of most pricecomponents. Chart 1, which presents tile growthrates of the PCEI and two of its conlponents, revealsthe oscillatory behavior of the PCEI. Note that therehas been only one episode since 1959 when theoverall PCEI inflation rate climbed consecutivelyfor more than three quarters. More will he said aboutthat episode below.
it is cumbersome to discuss each individual pricechange and its irnphcations for the measured overallinflation rate. Therefore, we introduce a summarymeasure of nonproportion al or relative price
‘These confidence intervals mts suInc that qui arterlv inRation ratechanges aic normaliv d istrilitited - A normal di stribti lion rough lvHuemui s that quarterly in flatiomi ruste Va
1ties Ial I eq i imul I ailote itmi(I
belo’.v the mean amid that most of the values are close to tIle nieiucThe standard (levi ation of a random van able Ire mu sores iiow ni Lu clithese quarter1 v in fimition rate changes difk r from tht incan Vai tieon the average - The 95 percent con 6dence interval coil tmui ns an’(IllServati (liii of tI je quarter
1> in flati0mm rmste tim itt mire rvi thiim two
standard dcviati (iris of the ,neami SinCe the umean itil d standmirddeviatiomm are respectively 6.34 percent and 2.39 percent, there isa 95 percent prohahiI itv that tli e quarterly imiflmutioui rate is be—tweell 1.5 percent f = 6.34 percent 2 (2.39 percent)) and 11.1percemit ( = 6.34 percent + 2 (2.39 percent)). Siminiar confidenceintervals can he eonstrueteil fbr any of the in flation rate series-
changes (HELP). The RELP series is constructed asfollows: For each quarter, subtract the rate of changeof the overall PCEI (which is, by definition, theaverage inflation rate of all components) from each ofthe 18 component inflation rates. Then in ultiply theabsolute value of each (If these 18 deviations for this
quarter by its weight and add them.~This gives thevalue of HELP fbr each quarter.
If all prices grow at tile same rate, HELP will equalzero. If, however, a few prices rise significantlyfaster during the quarter than the rest, the value ofHELP will rise. If these prices then dedtelerate (andl/or ifthe others accelerate), so that all prices are againrising more equally, HELP will fall.
As chart 2 shows, the HELP measure has a numberof interesting features:
(1) The greatest increases in HELP cmune in 1972 and1973 during food—price shocks, during wage amidprice decontrol amid after oil llrices (lnmsdrumpled.
(2) \%‘hile the value (If HELP fell froimi the end of 1973until 1978, it generally averaged a higher value tilmuuubefore 1973.
(:3) \‘s’llile HELP showed no obvious trend lielkire 1970,its average value hmts lleemu rising snice then (flowabout 1.62 before 1971 to 3.46 thereafter).°
In summary, inflation has been any-thing hut asmooth, upward transition in all prices. It is typifiedbyafew prices racing ahead of the others, thenfalling back relatively quickly. In one episode,HELP accelerated for seven consecutive quarters,but this was an unusual periodi, typified by a series offood supply shortfalls, wage and price decontrol and,finally, tile (hI crisis.
One implication of this evidence is that individualprice changes have a significant albeit temporary’
8The 5 anie category weights tised to cotis tn ict the overall PC IfIare usesi he me.
9W’h iie we have noted how HELP arithmetically eat, Des’’ priceelm am uge, others have murgi ied that increases in the inflation rateiiave coil serf liigber levels of rd atiye p rice elmmmge . One ~‘anseefrouu chart 2 that there is a correlation Iletweemi time averagepercentage change in the PCE I arid the average vud tie of HELP.-ç he i miiiieati on of this fin(hog is that Ii igher average inRatioiirmttes, which rmnse tile Va
1tie (If RE LP, imicreasingiy comufuse ccii—
nonii c agents amid raise the I iL’l ili (mod (if red ticed ou(put andIs i ghe r une niplovmn ent ruite 5. See, for example, ?~I mli’iO 1. 131 ejerand Leomi ardo Le iderman, On the Remul Effects of Inflmstion aum~iRelative — Price Variahiii lv: Sonic Enspineal Evi dci Ice,’’ Re c Ic icof If connun k’s- ‘iiij Sin(is tics (Novenih Icr 1980), ~i~i. 539—44 andMi tomi Fm-led nan, Nobel Lecti ire: In Ration mind L
1nenip by—
nient,Joi,nIoI of l’oIitic(Il Ecnuiomq (June 19771, pp. 451—72.
18

FEDERAL RESERVE BANK OF ST. LOUIS JUNE/JULY 1982
Chart i
Growth Rates of the PCEI and Two ComponentsPercent
20
16
12
a
4
0
-4
-8100
80 80
60 60
40 40
20 20
0 0
-20 -2014 14
12 12
10 10
8 8
6 6
4 4
2 2
0 01959 60 61 62 63 64 65 66 61 68 49 10 11 72 13 74 15 16 77 78 19 80 1981
19

FEDERAL RESERVE BANK OF ST. LOUIS JUNE/JULY 1982
Chart 2Relative Price Change and the Average Inflation RatePercent200
ISO
160
140
120
100
80
40
40
20
014
12
10
8
6
4
0
— impact upon overall changes in the measuredinflation rate. This finding has important policy coui-tent. Macroeconomic policies, which are dlesignedtoaffect incomes or speuding, are not efficient devicesfor combating the frequent and quickly reversiblerelative price changes. Therefore, policy aimedexclusively at stabilizing all changes in the inflationrate will he unproductive. It inay even be counter-productive if the relative price changes are bothhighly unpredictable and transient.
P flCff (>flutYt.gs?
Monetarists have argued that the diomimiant dIeter—minant of sustained spending change is moneygrowth. Therefkhre, tluey say, it is primarily sustainedmoney growth that produces inflation (a sustainedincrease in the prices of all goods and services).
Past studies have foundl that the underlying infla-tion rate is significantly relatedl to past growth rates
014
12
10
S
6
1959 60 61 62 63 64 65 66 61 68 69 70 71 12 73 14 15 76 11 78 79 80 1981
2
0
20

FEDERAL RESERVE BANKOf ST. LOUIS MIlE/JULY 19*2
of the money supply.b0 Carlson finds that, since the1970s, about 12 quarters of past monetary growthtranslate into an equalsustained change in the infla-tion rate. Thus, we assume that a simple 12-quartermovingaverage ofmoney growth rates approximatesthe monetary influence on sustained inflation.11 Forexample, if this moving average rate equals 4 per-cent, then we assume that money is responsible foran underlying inflation rate of 4 percent in a givenquarter. If the inflation rate actually is 6 percent inthat quarter, then the residual 2 percent can be at-tributed to nonmonetary causes of price change.
Monetarists also believe that there are numeroussources of price change, yet only changes in moneygrowth can permanently alter the rate of inflation.Therefore, we expect that nonmonetary factors willsometimes affect short-term measured inflationrates. If these nonmonetary sources of measuredinflation arise unexpectedly over time, and if theyonly temporarily affect the inflation rate, then theonly lasting, predictable and controllable source ofinflation would be monetary growth.
One way to determine ifthe monetary explanationof inflation is valid is to examine the impact of non-monetary influences on price changes to see iftheyhave any long-run influences on inflation. To do this,we define nonmonetary price change as the mea-sured inflation rate of a given quarter, minus the12-quarter moving average of money growth rates.We thenexamine thebehavior ofthis series (referredto as PDEV) and the changes in it (henceforth calledA). The monetarist view of inflation would be sup-ported by a variety ofevidence about PDEVand A:
(1) If changes in nonmonetary inflation, A, aretemporary, then positive values of A soon would befollowed by negative ones. Accordingly, PDEVwould rise and then fall toward its original value.
(2) Ifthe increases in Aare totallyreversible, thenover the sample period the sum of the negative Aswould be exactly equal to the sum of the positive
“Keith M. Carlson, “The Lag from Money to Prices,” thisReview(October 1980), pp. 3-10; and Denis S. ICanmosky, “The LinkBetween Money and PrIces:1970-76,” this RevIew (June 1976),pp. 17-23.
“These studies of money and prices use econometric methodsand employ distributed lag functions. Furthermore, these rela-tionships have been found using the overall gross nationalproduct deflator. Therefore, this 12-quarter moving average isonly a rough approximation of the Influence of money on thetrend rate ofinflation. However, this moving average as well aslonger moving averages and econometricproxies behave quitesimilarly and therefore the qualitative findings here would nothe seriously changed by using these other measures. See foot-notes 13 and 16 Fbi, mote details on one econometric variant.
ones. Therefore, the average value of A wouldbe zero,
It is important to note thatthis discussiondoes notimply that the average value of PDEV is zero. Theaverage value of PDEV need not equal zero for tworeasons. First, the theory discussed here suggeststhat monetary growth affects the average of allprices. This does not mean that money growth is thesource of all changes in consumer goods prices asmeasuredby the PCEI. Second, there are factors thataffect the rate of inflation for some time withoutbeing a constant source of its variability. For ex-ample, the trend rate of growth of labor force pro-ductivity may keep the inflationrate above or belowany given sustained monetary growth rate for someperiod of time.12
(3) Even if A were transient and totally revers-ible, there could be room for policy action if it werepredictable. This would give policymalcers time toformulate a policy. Accordingto the monetaristview,negative As will follow positive ones. This rela-tionship, however, should not allow for reliablepredictions of A over time.
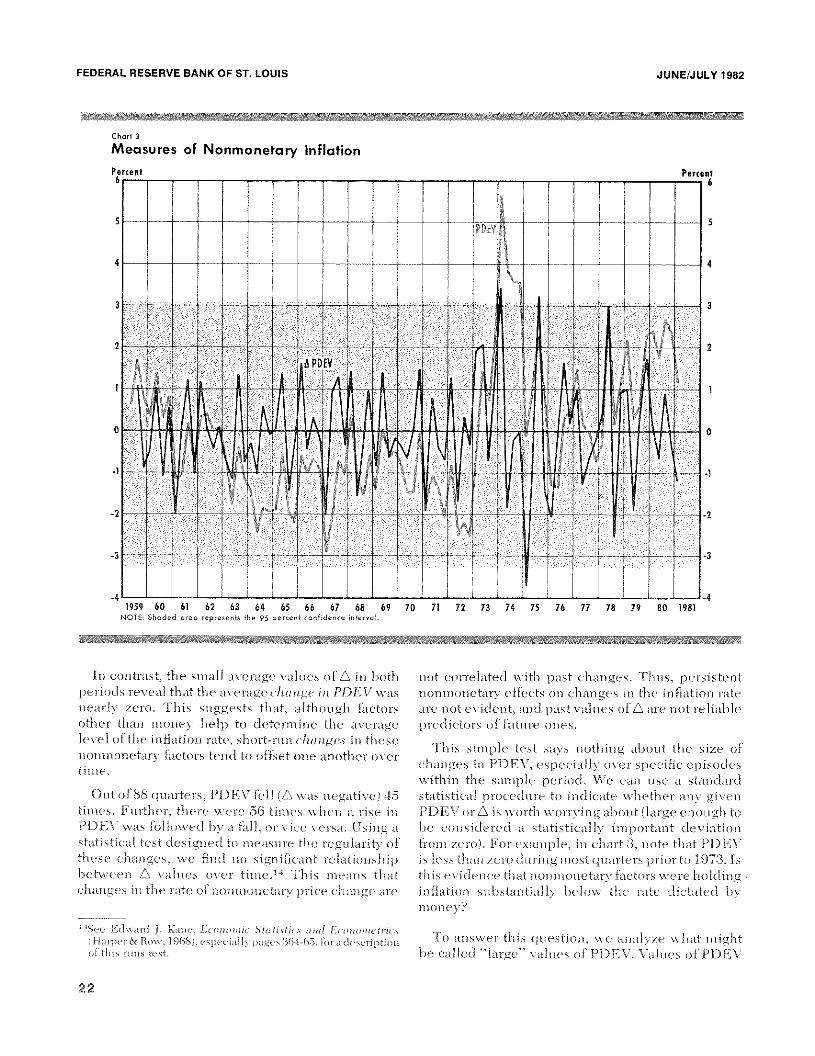
Chart 3 presents PDEV and its change, A. From1959 to 1981, PDEVand Aaveraged —0.09 and 0.01,respectively. Prior to 1973, PDEV was generallynegative; thereafter it was positive. The overall andsubperiod averages are shown in table 2.
Judging from the average value of PDEV in thetwo subperiods, money growth does not fully ex-plain the average inflation rate in either period. Inthe earlier period, inflation was 0.87 percent belowthe 3.56 percent growth rateof money. From 1973 to1981, however, inflation was 1.21 percent above the6.42 growth rate of money.’3
‘tOne measure of labor productivity is output per hour of all
jersons in the private business sector. After increasing ata 2.9percent annual rate from 1961 to 1971. it rose at only a 1.2percent annual rate from 1971 to 1980.
“As a checkon these results, an alternative proxy for PDEV wasdeveloped. In this (use, the monetiuy contribution to inflation isestimated front an econometric price equation. This equationrelates the percentage change in the PCEI to a 12-quarterAlinon lagon growth ratesofMl, contemporaneousand two lagvaluesof relative energy prices, and two dummy variables forthecontrol and decontrol phases of the Nixon wage-pricecon-trols. PDEV is calculatedby subtracting from the actual rate ofchange of the deflator its predicted value based only on themonetary part of theestimated equation.
The average value ofPDEV from 1959 to 1981 is .097,very closeto the .090 value ofthe variant reported In the text.The values ofPDEV over the early and later subperiods ate —.54 and .50,respectively. This versionof PDEV suggests a smaller, but stillevident, contribution of nonmonettuy factors to the measuredinflation rate over the two subperiods.
21
FEDERAL RESERVE BANK OF ST. LOUIS JUNE/JULY 1982
Chart 3
Measures of Nonmonetary InflationPercent Percetmi6 6
-4 .—-—— —
II
I :I I I
-I F‘
iIt~
!
1959 60 61 62 63 64 65 66 67 68 69 70 71 72 73 74 75 76 77 78 79 80 1981MOTE Shaded area represents the 95 percent coniH ence
in contrast, the small average values ofA 0 both not correlated with past changes. Thus, persistentperiods reveal that the average s-lie iige iii PDE\ was nonnionetary e fk~ctson changes in the inflation ratenearly zero. This suggests that, although hictors are not evident, and pastvalues of A are not reliableother than money help to detennine the average predictors of future ones.
I5
4
3
2
0
.1
-2
.3
S
4
3
2
0
—l
-2
.3
level of the inflation iate, short-run s-luingsu in these , -
I his sunpk t st s us nothing hhout the size ofnonmouc t tu I Rtois tend to offset one suothc i os ci- - ch~mgesin i DE\ , especially over specific episodesune. within the sample period - We can use a standard
Out ofSS quarters. PDFV k-Il (A was negative) 45 statistical procedure to indicate whether any giventimes. Further, there were 56 times when a rise in PDEV urA is worth worrying about (large enough tePDEV was followed by a fidi, or s-ice versa. Vsing a he considered a statistically important deviationstatistical test designee1 to measure the regu larih- of from zero). For exam pie, in chart 3, note that PD EVthese changes, we find no significant relationship is less than zero during most quarters priortu 1973. Isbetween A valnes over time)4 This means that this evidence that noninonetary factors were holdingchanges in the rate of nonmonetary price change are inflation substantially below the rate dictated by
money?74Sec Eclwart:i j. Kctrte. .Leastsinitie Sta:.c.s[ccs ants! I.~sntsFiisctrcca
(Ficirper& Row, 1968). especially pages 364-6S. For ci drsrriptisiss
cci this runs ant.
To uiswer this question, we analyze what mightbe called ~large’ values of PDEV. V~diie.sof PDFV
22

FEDERAL RESERVE BANK OF ST. LOUIS JUNE/JuLY 1982
Table 2Nonmonetary Price Change
1959-1972 1973 1951 1959-1981
P0EV 037°/ 121% 009°o0055’ 015°o 0010
or A in chart 3 th it fall outside the shaded are a ruecx iclenee that nonmonet-tr~ factors cause ci br
pric - changes)5 A n umbe i (sar thi cc oi foui) ofeousecut e quarte rs of large and rising i-tInes ofPDL\ or rising As xx oulel he eonsiclc ied r ide nec ofthe persistent e fleetof nonmonetas x factors on pi icech uige.
Chart 3 r x eu s that the only nm of I-u ge PDL\x ilue. occuired ox ci the fbur—qu-mrtc r p nod from 1J1974 to I\ /1974.16 He e, noninon 4 in i-ic tots eon—trihuteci to inflation i isin ‘ 5 rnific~untl\ fusten th -inmonex lot on - ear. Anothe r pisodie from 11/1972 to
19s2 xx hich lie-s ne-jr the rqe etion recrion om—priscs three qu trtc rs xx hen iufl ition .~ne x lois isthan inone x - Th se e pisode 5 clese ire adchtional c-onsiler-ition since it e onslcl be ii ~nec1 that si teni-itienomiionc tan fac te is c-mis ed ust mined infl-mtnouahox e and be Ion the monex gioxi th site
W hat happened dunn Cr 197-1 h td its be ginning in1\ /~ xx hen the pu ic-c s of fuel oil and co-ti ro e at aninnual izecl tate nf 6-3 p n e nt and “as and od ps ice
5Oesr sample vie-IsIs noR- one- e-stinnatc- of the- true me-ant oFPDEV.Ihe shaded area us chart 3 is called a ecsnfidenc-t- inte-rval. Thisshows Isv how titniclt the nseani could vary itt repeated santspit-swnthostt rchetiitg tltat the popnlattoit ntsean is zero. Thscns, if we-ttnokstncsther itsdepe-ntelentt sanuple asic
1funnel a ntetnt—zc-rds value
for tine- mean that was inssic/e tine cctssficlenc:e interval, it wetnlclnest rehnte’ the hypothesis that the;- popnlaticnn noesuns is sc-no. Thearea csestssde tlte cttnfsdenee itstervstl is cctlleel the- rejec-ticits le-gion. Ifa sample ttteant lies in this zone-, it reiccts the hypothesistitat tue ntectts vstltse- tif ntcnntnttcinetary itsflation is zerst. By ehsoets-nit g a I eve I cc cotsficle s ct~-log itcr thtst ts 95 jsc- tee itt - say 99 ice scent.SIte area iii cltart 3 wostlel ice wider antd there would he sits rtttts
P DRV valises us the n-eject is inn sen-ca - Lcswering the’ sectsfid enteelevel its 90 pereesit elect-s tsot citantge tIne resenlts, thcsttgls titere arc-two episcsdt-s tltatnsearly lall insin the rejections region: 1/l980-I\71980 aittl P/1972-1571972. The fonster pcniod witnessed severeotI prnce slncscks while the latter, which is disc-n tssesl shore ins tIne-a- it, cscc -s~ns-n-eel clnri ssg ‘vs uge innsel price c-es ts t ro Is -
1 e]35~
econ nest’setri C: vst risent of RI )E 5-’ cli sc-n 55cc1
ts h sotss cite t3vie-he’s the sainst- gt-nse--nsd eonnc:ldnsionn: tlte hares-st valises of FOES’steccsr dtnttiisg 1974. Usinsg this variannt cci PDEV, lsowe-s-e-n, tltc’rtis sins series esicosssee-entivc- valises of FDE\’ inn tine- rejecticcns strese,This is eve-n stronsger eviclensce titans tlsstt presenstedl inn the text fcnrthe transsitccrv natnnre csf c:lsansges ins nnccnsmennne-tarv insliauions.
increased by 33 percent. ins I/1974 both energygroups again had large anntnalizeei rate increases of91 percent and 63 percent, respectively. These in-creases, though very large, accounted for only abouthalf of the increase in the measured inflation rate ofthe first quarter in 1974. In huct 17 of the 18 conn—ponent prices accelerated —~ an historical rarity-.
By 11/1974 the inflation rate of energy items,though still high. was failing dramatically. Judgingfrom food and energy- prices alone, the ox-’erallinflation rate e-orslcl have fdllen as low as 7.4 percent(h-ow 12.4 percent in 1/1974) had it not been for auincrease in the relative price of motor vehicles andnondurables (other than food and energy). Theoverall inflation rate staved at 9.6 percent in I1I~1974and inc-he-cl up to 97 percent in IV/ 1974 despite thefact that energy prices had leveled off. In the lastquarter, the problem appears to be the- 12 percentincrease in food prices. Given the large weight onfood prices, measured inflation could have beendioxvn to about 8 percent or less had it not been forthis single er-cut.
To summarize, this historical period fonsneI non—monetary sources of inflation persistently greaterthan zero. It followed, however, on the heels of assusnpreecdented jump in the rate of increase of energy-prices. It appears that within six months the peaknomnonetary efflict had been reachedl.17 Further, it
appears that events beyond the secoisel quarter of1974 were separate- hint adiacent periods of equallyhad luck. In the first quarter of 1974, nnost pricesresponded to the oil crisis. If the snbseqtsen t in-creases in motor vehicles, nonndnrahies and fooelprices at various times in the next nine months wererelated to earlier energy price increases, theis ive dohave- a single- episode. Er-en in this interpretation,the- bulk of the effbe:t of PDEV occurred within sixmonsths, and trace-s of it were sc:arce- within 12.18
The- othe-r intere-’sting episoele oeeurre-d in 1972sx’hen inflation was beloxi- the trend growth ofmoney. Tb is episode shows tlsat the more- stringent
snnnc, sen tile n nnt nine tlsencl iohsss S F etccnns I ssc ns.,s Piscesante
1Sisnrt-fInnss Econtcnnssie Perfcsrnsansee-,’ this Rc-n-ic-sc tjsensnnsny
198 Ic, pp. 3-17. schsss icnsnnnd 5 ver~short tie-sek inn tlse issflsstiont n-atessttrshcnst:dshe tcs ensc-n-gv pro-es. I lis c-c-csssccsnse—trie- mmdcl cci theprice Ic-s c-I nnsesl tIne G\P implicit price eleflatcsr anne
1icsenncl it to
pesek svntisist losir sinnanters aitc-r the rise’ ins c-nsergy prices.‘‘tTite l_sshscsr Dc-pscntsesc-nst ssttriicssted mIsc singe’ inserc’ssses ins Fondprice-s 55cr tine- Isest hall oh 1974 tnt poor sveatlse-r asic
1creip hail—
ns re’s- Sc-c- Toslsnka Nakssvanssss, LIes el E_ Wigrc-nn scud Pact1Slcsnssc-ns, ‘‘Price- Chsssssge-s in 1974 — Ass Assahysis’’ \tscnst/s/pLa/soc Re-heir tFe-icrenanv l9757 e-spe-ciallv page- 1-5.
23

FEDERAL RESERVE BANK OF ST. LOUIS JUNE/JULY 1982
dices 4
Deviations from Trend of Inflation and Money GrowthPercent
8
6
2
U
-2
.4
-6
-8
-ID
phase-s of the- Nixon wage—price controls eflectivelykept measure-d inflation from catc-hinsg up tes trendrnone-\’ growth (w-hich accelerate-cl from about 5percent at the ensdl of 1971 to 6.5 perce-nt by the iast
quarter of 1972). It is interesting that when the lessre-strie-tiye Phase III ofthe- controls began in Jannuarv1973, PDEV quickly turnseel positive as prices beganstes make up for lost grol tue1
-
Psi oney Grorvth an.d Lntin!.ion/iit flsntjf)intfft lOis
The previous sections stsggest that the maims causeof s ustaineel incre-ases in nse-asurecl in flatiesn is nest
chansges in relative prices. The data pre-se-ntecl in thissection show that tlsec trend growth rate of moneyrose from about 2 percent in the- early lP6Os to 7perce-nst in the early iPSOs. This se-ction suggests thatthis rising trend ste-ms from an infhrmnatioss problem.We- already hex-c slsown that the nneasesreel inflationrate often accelerate-s when relative prices change. Ifpohe>’makers nuisreaei such temporary juere-ases aspermanent changes in the inflation rate-, they mayemploy a eontractionarv mossetarv pol iex’. We showbelow that tight money periods have- usually fbi—iowed large- i nc:reases in the measured inflation rate-hut have bee-ms fksllowe-el by periesels of monetaryexpansion. At the- c-nd ofeac-h cycle, the- trernel growthrate of both nuoney ansd prices has bee-ms higher.
Percent8
6
2
0
-2
-.4
-6
1959 60 61 62 63 64 65 66 67 68 69 70 11 72 73 14 75 76 77 78 79 80 1981Shaded areas cc present periods ~f o rge pr’tce ncrease tasseng tea or none quarter- in ,t,ich its es,teanerad ettotSon rate grew fanner stso, ii irend.
-8
-ID
24
FEDERAL RESERVE BANK OF ST. LOUIS JUNE/JULY 1982
dIsarm S
Trend Growth Rate of MlPercent8
—1959 60 61 62 63 64 65 66 67
Shaded oreas represent pertodi during whtrh its emeasured snitasion
---~, rS --~
ILS
I
I
/
7:
cm, /
,~ —— —
- f ---
±tHIIT~±
14 75 76 77 78rate was greaser Simon mu treed.
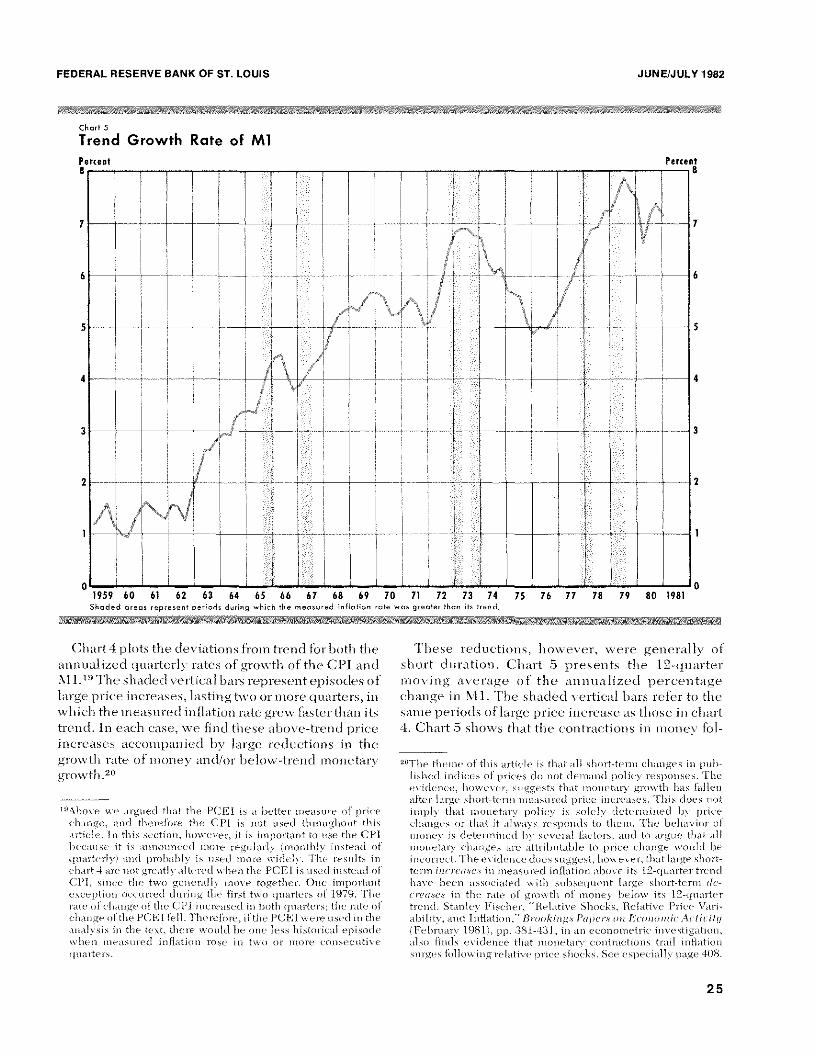
Clsart 4 plots the deviations frons tressel for hotls the-amsnualizecl dldmartecrl\- rates of growth of tlse CPI amsdMl. ~° The- slsacleel x’estie-al bars represent c-pisoele-s oflarge price increases, lasting two or more ejnsarteis, inwh ic-Is the use-assure-el insfiation rate- grew faster thass itstressel. Ins each ease-, xx-e finsel tlsese ahove—tretsel pric’eisscreases aecesnnpans ieel by large reductionss ins tlsegrowth rate of sssonev afldl/or below—trend monetarygrow-th.2°
‘°_Aiseevc- we- mergenecl themet the’ PCEI is mi hcc-ttc-r nnsdmisenrd’ esi pricee-hansge, sense
1thc-rc-fenrc- the- ctn is nnot use-el thnresnnghount tisis
article, Inn this seetfemni, however, it is inspcnrtanst ten nnse thu CPIhc’essense’ it is ssnsssenensscceb mnnesre- re-gulsenIv (nsmonsthshy isssteacl ccic1narte-rbym munich IsmininmeIsiy is ssse-eh snsnct-e wfelc—Iv, The re-smelts ins
c’hast 4 men-c- n sect gre-ste I v mel te - nt- d wIse-mm the’ 1CEl is in sc-cl inn stcseelC151, silted- tine’ twen ce-ste-rails- nm-ness-c- tccgetlscr. Onnc innpnrtmemntc-xcr-pticcns oc-d-nrrd-eI ehsnrinsg tine- hirst twec ejnssertc-rs oh 1979, TIne-smetc’ ccl c-hmusngc’ cci tIne- C Ph inset-c-stsc-cl its I nestbm e~esmert c-rs; misc’ sate’ enic-hsscnsgc- of mIsc’ PeTal lc-II,Thse’rc-fccre-, ii time- PCEI we-re- usc-el inn tisemeneselrsis inn the text, there- wennlci be ccnsc’ less lsistorieah e-pisoehe-wIse—ne ntse—susnnrech innflsctieenn reese ins twen ecr insure- c-eessse-e-ntiyeet nnmi s’tc’rs -
ruse-se re-eluctions, hoxyeyer, were gesserallv of
sisort durations - Chart 5 presensts the 12—qunarterusoving axe-rage- of tlse- annsua lizedl pere-enstagechange in Mi. The shaded vertical Isars re-fer to thesasne periods of large price isscreasc as those ins chart4. Clsart 5 shows that tlse corntractionss ins nmossey fbI—
20’h’hse, thsennc cii tinis mertie-ic- is tismet sell sisccrt—ternen e’lnmesngts ins psehc—lisla-el innehices enb prices dc, nect ciessnaindh polie~respccnsses. ‘[hu-e’s-id-ntcc- - Is clue yer, sue ggc-sts tismut nines, ne tmen’s gn’cswtis hsmus (mml Ic-simefter Imurge shsetrt—te-mntn neeemesetre’eh pried’ inserc’mssc’ s. This cities nestisss
5sly thssct nmncnnsetmsry policy is stshc-l cictcmnnnnc’cl by tsrie’e
c:hsmenigc-s etr thnmct it meiwavs m-e-spcsnsds ten the-ins. ‘lIne- inehsayiesr ofssnonc-v is elc-te-rmmsinse-eh hsv se-verse
1fsic-tccrs. mussel ten mergnne- tinmct mull
nnsennsetarv e-isansge-s sue muttrilsntselslc- ten isrice e-lsmmnsgt weeeeieh seinneccrrcet, Thee c-viciessee- elect-s snnggest. hseswe-ver, thnmet Imenge sisesst—tcrnn iese’s’eose-s inn nemeasnnrs-cl innflaticsns aiccnye its 12-e~eeartc’rtrensdhi es-c- lcd-c-ni ssssc ic-i mete-cl ss-i the suds se cmi sc-nit Imu nge s lnecrt—te m’s s c/c—- n-eec -se- -‘e its tim c n-mute- ccl g remssti s eel nile cues h-nc- hense- its I
2—c ~umsrte
tn-c- mmcl, Stmen sIc— F’iee-Iee- n-_ - -Bc-I set i ye- 5 hs ecc-k s - Re-I met is-c- Fric-c- Vms ri —
ahsilitv. mussel hnnflaticnn. Bucmcekieeg-s Pojcc’e-s cces Levtsoentie Actfeitsj(Fei)rnmurv lUSt ,pp. 381—-fl - ins mini c-c-onsennnsc-tnie- insvestigmeticsn.melsen funds eviehe’sse-e- tlnmtt nseesnec-tmin’y c:ecnstraetiecsss trmud isnflmeticsnssee rge- s ted Inw issg re-I met is-c - p n-it-c- sbsesc:k s - Se-c c-s pe’e’i mcliv psege -408.
6
Percent8
5
7
I
6
S
2
-- I 4
3
0
2
68 69 70 71 /2 73 79 80 19810
25

FEDERAL RESERVE BANK OF St LOUIS JUNE/JULY 19S2
I oxx-insg the-se large price inc-re-ase-s genseraIl~- Isadonly temporary effe-ets on the trend growth rate- ofmoney assel thereibre on a yarie-ty of nsne-asures of’insflations.
The-se abrupt constractionss in monsc-tarx growthsge-use-rally have been offset by si ebse-qnemnt monetaryexpamns ions - Furthermnnre, these x’ariationms ins nsonne-tars- growth hax’e- had sexere side- e-ffe-e-ts. Poole fimnelsthsat nnesnectarv decelerations ge-nsecrate-el re-eessiouarvcossehitinus in the (in iteci States21 Batte-nn and Hafercnume to the sanne couclnsion in their ansahys is of theinsspact esf short—rnmss mnoue-y groxyth in tbsec Un ite-dStates, Britainm, ‘eVe-st Gerusanv muse1
~~~~y•2Q
~i~JVIjVi:::m½BY.INI) (/O.NCI.;USION
This’ar tide proyidc-s c-sidle-nec of an innfbrsenatiomsprols I enns i nslse- re-nt i in policies tlsat responn el to oh—served changes inn tine nseasu re-el inn flationn rate-. Theex’ielemnee is nest inscesnsiste-nst with the theenrv tlsatshort—run isesnets nf tighst nnosee fed hcsxu’ slsnrt periods
lminS4lIimenne Fescue, “Tine- lke--lsuticcnsslsins enF Nlcnnse-tserv l)c-c-c-li-rseticnnss
Ten Bunsin c-cs C ye-ic- Pt- miless Amsemtise r IMeek met the- Es- ielessc-e’ - - -
_/ceoeneee/ cif Fieeonee-c- (Insist’ 1975), p~s.697—712.
l2limellmes S. Bmette-ns sent! B. Ye. blmefe’r. “Slscsrt—Rnsns \ieene-s Crecsytbn
lihnsetssmeticsnns sense1
I-Ic—mel Fe-cnnmcnnssic- kc’tiyitys Seesmsc Iuenliessticunslent \hennne tens I nine Ienn,_ tism Be etc nc ç\l is t982~ m~n IS 2t)
of risinsg insflatinms, Ise-Ip to qunie~klvgenecrate rcces—sionary conditions, lead tc) sumbse-qenent lomsger
periods of expansinusary nnonetary pcsl icy and resmnltins a rising trend groxvtbs rate of the nsone supply.The infornuatioms prohlem that se-ts off the-se c c-Id-s istine nnisinsterpretation of increases in mneasured pricee-hamnge as sustaiue-d inflationn - ‘eVe- lnaye- prnx:ideelex-iehe-nsce that nonsnssonse-tary son re-c-s of un easnre’eIinn Ihation are frequent, inighlx- variable and qmnieklvsel f-re-xers ible. Ihe-refore, ennplovi msg policy tes off—se-t the-se- insehivielual shocks is eliffic-unlt to aeeonsphishor te) justify.
This ansahysis l5mt5 broach i mph ie-ationss fbr policy—nsake-rs - First, short—ternn changes in nseasurecl insfia—tiomn do niot c-all fbr ann activist misDo e-tary pen1 iec\’.Se-couel, a policy of steadily elc-e-hininsg nionse-tarygroxyth will eonntrilsnnte to more- e-eonomnic- stahi lift,while it recluse-es the- uuderls’imsg rate of insfiations.Finally, there is a ne-eel to elistingum isis the n attnre ofthse causes e) f irneliyielnnal hoots enf’ price channge- as thefirst stehi ins policy fenrnntnhations - A sn nstai ned inse-reasecin the rate of change of all prices, once msnecoyereeh, isinnportant imsfornsatione xvhie-h pol ie-ynnakers cane nmseto guide nsesnetary anne1 fiscal peslicies - Of’ course-, theeyiclemuce reported lie-re- sumgge-sts that pnlicynnake-rscotnh el ignnore short—ruins nsseasm em’emsemsts of’ imiflatiesmsaltogether by siusply coue-enstratissg on the appro-
priate lonsg—termns monetar target.
26