INFLATION DRIVERS IN ZIMBABWE - Reserve Bank … · 3 1.3 Reflecting a combination of both demand...
53
INFLATION DRIVERS IN ZIMBABWE SUPPLEMENT 1 OF 4 TO THE 1 ST QUARTER, 2005 MONETARY POLICY REVIEW DELIVERED BY THE GOVERNOR Dr G GONO MAY 2005
Transcript of INFLATION DRIVERS IN ZIMBABWE - Reserve Bank … · 3 1.3 Reflecting a combination of both demand...

INFLATION DRIVERS IN ZIMBABWE
SUPPLEMENT 1 OF 4
TO THE 1ST QUARTER, 2005
MONETARY POLICY REVIEW
DELIVERED
BY
THE GOVERNOR
Dr G GONO
MAY 2005
2
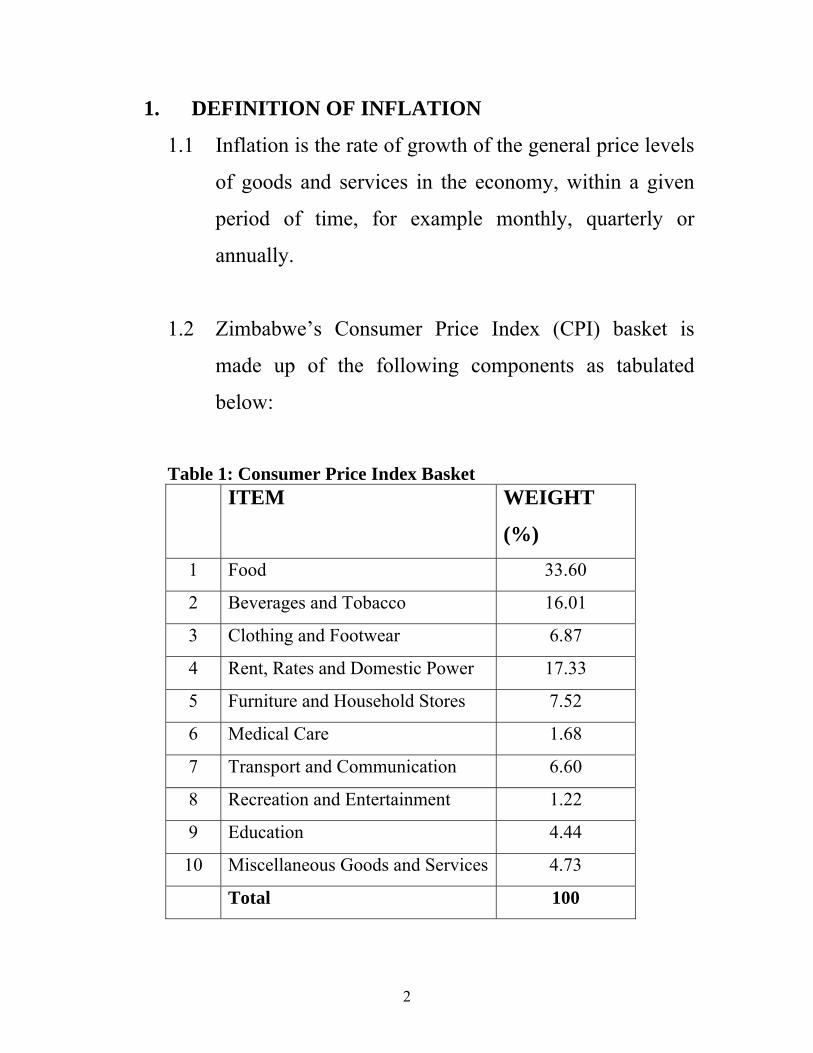
1. DEFINITION OF INFLATION
1.1 Inflation is the rate of growth of the general price levels
of goods and services in the economy, within a given
period of time, for example monthly, quarterly or
annually.
1.2 Zimbabwe’s Consumer Price Index (CPI) basket is
made up of the following components as tabulated
below:
Table 1: Consumer Price Index Basket
ITEM WEIGHT
(%) 1 Food 33.60
2 Beverages and Tobacco 16.01
3 Clothing and Footwear 6.87
4 Rent, Rates and Domestic Power 17.33
5 Furniture and Household Stores 7.52
6 Medical Care 1.68
7 Transport and Communication 6.60
8 Recreation and Entertainment 1.22
9 Education 4.44
10 Miscellaneous Goods and Services 4.73
Total 100

3
1.3 Reflecting a combination of both demand pull and cost
push inflation drivers, the period 2000 to January 2004
saw Zimbabwe registering unprecedented levels of
inflation build up (Figures 1 and 2).
Figure 1:
Year on Year Inflation
-100
0
100
200
300
400
500
600
700
Mar 2002 to Mar 2005
%
TREND LINE

4
Figure 2
Month on Month Inflation
0
5
10
15
20
25
30
35
40
Jan 2003 to Mar 2005
%
2. ENEMY NO. 1 IN ZIMBABWE… INFLATION
Within the context of Zimbabwe’s Turnaround
programme, inflation has been declared the economy’s
number one enemy. This has been clearly spelt out in the
maiden Monetary Policy Statement of December 2003 and
subsequent ones as well as in the Government Budget
Statements.
TREND LINE

5
2.1 The need to reduce inflation is predicated on the
corrosive social and economic costs, associated with it.
These include:
i. Erosion of purchasing power of incomes;
ii. Widespread uncertainty, which makes forward
business planning difficult;
iii. Speculative activities, which divert resources from
productive activities;
iv. Penalizes fixed income earners like pensioners;
v. Strain on the country’s foreign exchange due to
increased import demand;
vi. Low worker morale, which affects productivity,
quality and the supply of goods and services;
vii. Stifles economic growth;
viii. Penalizes savers who are key to any future
investment, growth and development; and
ix. Erodes the competitiveness of the country’s goods
and services in international markets.
2.2 Against the background of the above social and
economic costs, no other variable has generated
widespread debate and controversy in Zimbabwe as
inflation.

6
2.3 It is for this reason that the Reserve Bank of Zimbabwe
has decided to invest time and effort to unravel the
dynamics of inflation focusing on the major drivers.
2.4 These inflation drivers emanate from either the demand
or supply side effects on changes in the general price
levels.
2.5 On the demand side, excessive money supply growth
was identified as one of the major cause of inflation.
Empirical evidence for Zimbabwe has shown that
excessive money supply growth, which is not matched
by productive economic activity, has adverse effects on
inflation. Money supply growth emanates from the
actions of both the private sector and Government to
the extent of their borrowing from the banking system.
2.6 On the supply side, there is an inverse relationship
between real output and inflation. As output rises, this
has a dampening effect on inflation because of the
increase in the supply of goods and services.

7
2.7 In Zimbabwe, there are supply bottlenecks, which have
been brought about by various factors including natural
disasters (drought), shortage of inputs, and structural
rigidities including infrastructural deficiencies. These
factors have to some extent adversely affected
production and have resulted in demand outstripping
supply leading to inflationary pressures during the last
few years.
2.8 Over Zimbabwe’s recorded history, there has been a
marked inverse relationship between inflation, GDP
growth (Figure 4) and average rainfall received.
2.9 An analysis of the country’s total rainfall endowments
since 1901(Figure 3) to the current season reflect a
clear downward trend which signals increased
susceptibility of the county’s productive systems to the
vagrancies of droughts.

8
Figure 3
Rainfall Amount from 1901 to 2004 (mm)
0
200
400
600
800
1000
1200
140019
01/0
2
1905
/06
1909
/10
1913
/14
1917
/18
1921
/22
1925
/26
1929
/30
1933
/34
1937
/38
1941
/42
1945
/46
1948
/50
1953
/54
1957
/58
1961
/62
1965
/66
1969
/70
1973
/74
1977
/78
1981
/82
1985
/86
1989
/90
1993
/94
1997
/98
2001
/02
Rai
nfal
l (m
m)
Figure 4
GDP and Inflation
050
100150200250300350400450
1986
1987
1988
1989
1990
1991
1992
1993
1994
1995
1996
1997
1998
1999
2000
2001
2002
2003
2004
Infla
tion
(%)
-10
-5
0
5
10
15G
DP
(%)
Inflation Rate GDP Growth rate 2.10 To unlock the supply chain, the RBZ has embarked on
the re-orientation of the public enterprise and local

9
authorities (PLARP), which have a significant role to
play in infrastructure development.
2.11 In addition to PLARP, the RBZ identified specific items in
the CPI basket whose prices have a significant impact on
inflation developments. The identified sectors are listed
below:
i. Food sub sector;
ii. Rent and Rates;
iii. Energy; and
iv. Education.
3. MONETARY AGGREGATES
3.1 On the demand side, money supply growth unrelated to
economic activity is a major source of inflation in the
economy. The Reserve Bank therefore, created a Framework
for Liquidity Management, whose primary objective is to
contain money supply growth to levels consistent with
inflation targets.
3.2 The first step was to identify the main causes of money
supply growth and design strategies and instruments, to

10
achieve the announced money supply and inflation targets.
This involved the construction of a Liquidity Forecasting
Program (LFP), which is a key input into the overall
Liquidity Management Program (LMP).
3.3 Challenges
3.3.1 In order to reduce money supply to levels consistent with
inflation targets, the Reserve Bank maintains a certain level
of market shortage. The major challenges to the Reserve
Bank’s efforts to siphon liquidity from the market and
achieve the desired level of shortage are the following
sources of liquidity injections:
i. Accommodation of banks;
ii. Large Treasury Bill maturities;
iii. Government salary payments and other expenditures;
and
iv. Foreign exchange purchases particularly during the
tobacco auction season.
3.4 Strategies

11
3.4.1 In the quest to control money supply to levels consistent with
inflation targets, the Reserve Bank developed the following
strategies:
a) Formulation of instruments that control money supply;
b) Coordination of the activities of the Reserve Bank’s
Divisions, particularly those that disburse funds to the
market. This entails synchronization of the Productive
Sector Facility (PSF) and PLARP disbursements with
liquidity mopping up operations - critical for effective
management;
c) Development of the private placement initiative for OMO
bills, so as to tap in more excess liquidity.
d) Re-introduction of 2-5 year OMO bonds, with yields
indexed to inflation, to lock up liquidity on a more longer
term basis, while at the same time helping to spread out
costs.
e) Introduction of tap issues for long-term liquidity
management instruments, with competitive yields, which
are inflation-indexed.

12
f) Enforcement of full compliance with statutory reserve
requirements. Banking Supervision and Surveillance
conducts spot inspections to ensure full compliance with
statutory reserves.
g) Synchronization of the PLARP program.
h) Continuous formal communication with the market, on the
Bank’s Liquidity Management Program (LMP); and
i) Designing of a program for the issuance of PLARP bonds
guided by liquidity forecasts and the funding needs of
parastatals and local authorities.
3.5 The Reserve Bank recognizes the impact of supply
constraints and cost-push factors of inflation and in this
respect, task forces were identified to research on some of the
critical areas and come up with strategies that would reduce
inflationary pressures.
4. FOOD SUB SECTOR
4.1 Sub Groups in the Food and Beverages Groups

13
4.1.1 The food group is divided into sub groups where the major
items are bread and cereals, meat and fruits and vegetables
with weights of 11.99%, 6.56% and 5.97%, respectively.
Details of sub groups in the food and beverages categories
are shown in Table 2 below.
Table 2: Sub Groups in the Food and Beverages Groups
ITEM WEIGHT
A FOOD 33.60
1 Bread and cereals 11.99
2 Meat 6.56
3 Fish 1.17
4 Milk, cheese and eggs 2.37
5 Oils and fats 2.14
6 Fruits and vegetables 5.97
7 Coffee and tea 0.28
8 Condiments and confectionary 2.91
9 Meals outside home 0.19
B BEVERAGES AND
TOBACCO
16.01
1 Beverages 14.31
2 Tobacco 1.69

14
i. The detailed breakdown of the food CPI items is appended in
Annex 2.
4.2 Challenges Faced By The Food Sector
4.2.1 The drought that the country is experiencing in the 2004/05
agricultural season has resulted in the resurgence of shortages
of basic food commodities. The goods that are currently in
short supply in the economy include dried kapenta
(matemba), cooking oil, flour, bread, fresh milk, powdered
milk, lacto, sugar, meat (beef), mealie- meal, soft drinks, fruit
and vegetables.
4.2.2 Companies are currently operating below full capacity due to
the following factors, among others;
i. Shortage of imported inputs;
ii. Shortage of locally produced raw materials owing to the
drought;
iii. The beef and dairy industries are mainly affected by a
limited number of herds for beef and milk. This

15
industry is also affected by shortage of stock-feed and
veterinary drugs.
iv. Cooking oil and other oil products are mainly affected
by the shortage of soya beans, sun flower and maize.
4.3 Strategies For The Food Sector
4.3.1 Since 2005 is a drought year, the RBZ, Government and
other relevant stakeholders are putting measures in place that
will increase the supply of goods and services particularly
food in order to reign in on inflation arising from the
shortages. The strategies below are basically concentrated on
improving food supply.
4.3.2 Maize and Wheat
i. The Government and the Central Bank are introducing
a winter crop incentive scheme and ensure security of
tenure so that the farmers are motivated to develop their
farms and enhance productivity.

16
ii. The RBZ and the Government are ensuring sufficient
supplies of maize and wheat through imports of the
grain.
4.3.3 Meat
i. More resources are being channelled towards poultry
farming in the short term since chicken is a close
substitute for beef, which is in short supply. This is
because chicken has a shorter rearing period than cattle.
ii. The RBZ and other stakeholders have put in place a
financing structure for restocking the national herd and
investment in research and development. This will result
optimum use of the Cold Storage Company facilities.
iii. The Government through relevant line Ministries has put
in place measures to prevent the spread of contagious
diseases such as foot and mouth thereby reducing the
losses resulting from such outbreaks.
4.3.4 Milk And Cheese

17
The RBZ has set up a Z$150 billion facility for the Dairy
industry to enhance the capacity of milk production. The
funds will among other things be used for:
i. Restocking the dairy herd, and
ii. Training upcoming milk producers on issues of
preservation and handling of milk, since it is a
perishable product.
4.3.5 Fruit And Vegetables
The RBZ has set-up a fund to ensure increased and consistent
supply of fruit and vegetables through the following
initiatives:
i. Irrigation rehabilitation for farms near urban areas
which can grow fruits and vegetables;
ii. Developing marketing zones for fruit and vegetables
and putting in place transport arrangements to move the
produce from the farmers to the consumers.
iii. Identifying and arranging financing for potato seed
production to cover the current deficit.
4.3.6 Oils And Fats

18
i. The RBZ together with other stakeholders has
established a facility to ensure sufficient supply of soya
beans and other raw materials required for production
of cooking oil, through the 2005 summer program.
4.3.7 Sugar
The challenge lies in the distribution of the product.
Middlemen are being allowed to distribute sugar and
artificial shortages are being created resulting in hoarding
and subsequent trading at exorbitant prices on the parallel
market. The Reserve Bank and Government are ensuring that
the distribution channels are clear and efficient.
4.3.8 Medium to long term measures
19
i. The Reserve Bank has structured targeted financing
facilities to the agricultural sector to improve
production.
ii. The Reserve Bank and Government are revamping
Agricultural Extension Services to educate the farmers
on effective agricultural production.
iii. The Reserve Bank has set up financing structures for
dam construction and rehabilitation of irrigation
infrastructure to ensure consistent supply of water for
irrigated agricultural produce.
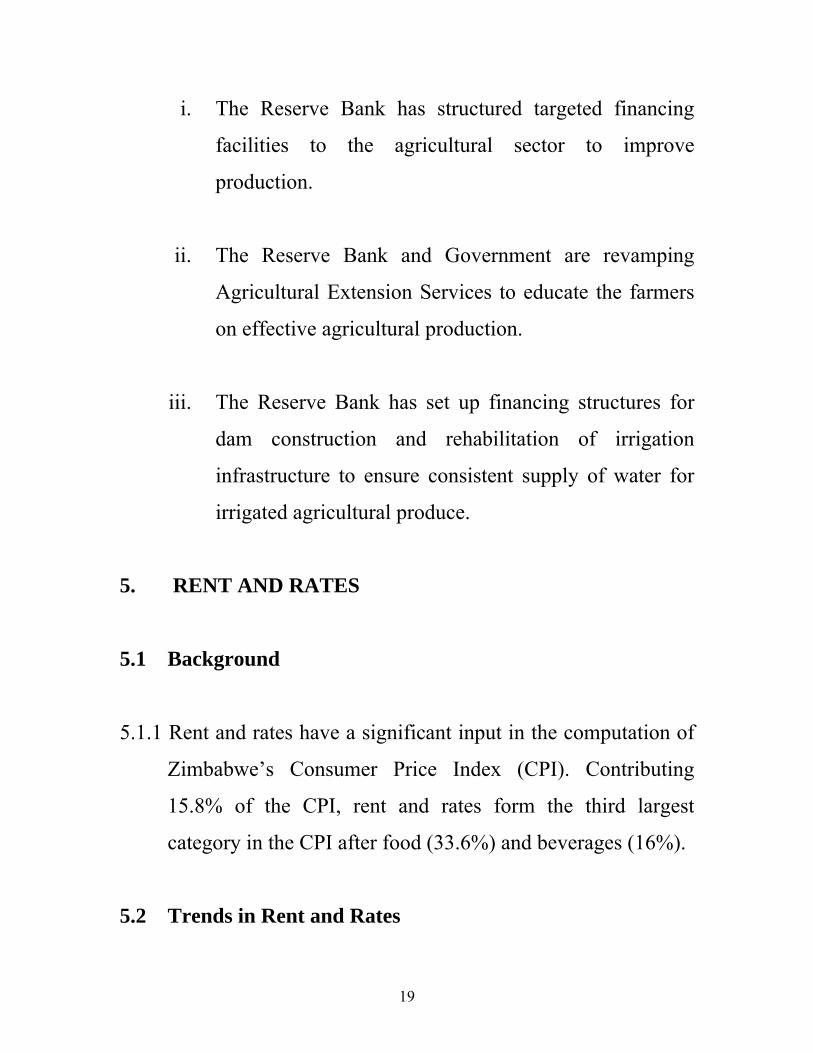
5. RENT AND RATES
5.1 Background
5.1.1 Rent and rates have a significant input in the computation of
Zimbabwe’s Consumer Price Index (CPI). Contributing
15.8% of the CPI, rent and rates form the third largest
category in the CPI after food (33.6%) and beverages (16%).
5.2 Trends in Rent and Rates

20
5.2.1 As shown in the figure 1 below, in 2003, most Estate Agents
and Property owners had resorted to quarterly adjustments of
rentals and rates due to the high inflation, which prevailed
then.
5.2.2 In 2004, as inflation slowed down, upward adjustments in
rent and rates became less frequent, resulting in low and
relatively stable inflation in this category.
5.2.3 There is some seasonality in rental adjustments (Figure 5)
with significant increases occurring in January as new leases
are agreed upon or the escalation clauses are implemented. In
January 2005, the category increased by 64% largely due to
the adjustment in rates which was rescinded in February
hence the decline of 22%.

21
Figure 5
Increases in Rent, Rates & Domestic Power
-20
0
20
40
60
80
Jan 2003 to Mar 2005
%
5.3 Major Challenge for Rent and Rates
5.3.1 Extensive stakeholder consultations and research has shown
that the upward pressure on rent and rates is a result of the
shortage of affordable industrial, commercial and residential
properties. Current estimates of the housing backlog from
Local Authorities show that over 2 million people are on the
housing waiting list, countrywide. Factors that are currently
restraining supply in the sector include:
i. Unavailability of serviced land. Due to lack of adequate
funding, most Local Authorities have not been able to

22
service land for the construction of houses and offices.
Much of land servicing has been left to private land
developers, whose capacity and scale is limited.
ii. Lack of serviced land has also been caused, in some
instances, by inefficiencies in the handling of land
development paperwork. Restricted capacities of most
local authorities’ water supply and sewerage reticulation
systems have also hindered the servicing of stands and
construction of new houses and offices.
iii. Construction costs have also been escalating and are
currently prohibitive. Given the high cost of building
materials such as cement, building sand, quarry stones,
timber, roofing material, glass, iron and steel, plumbing
and bricks, it is cheaper to buy an existing property than to
build. This has resulted in increased pressures on existing
housing units leading to high property prices.
iv. The high mortgage rates, which prevailed over the past
couple of years, have acted as a deterrent to potential
house owners who have no choice but find themselves
having to rent and be at the mercy of landlords.

23
v. The cost of bricks, which constitute between 15% and
25% of construction costs, is currently between $500 000
and $800 000 per 1000 for commons compared to $13 000
in 2003. Taking the lower figure, this is an increase of
over 3500%
5.4 Other Causes of Increases in Rent and Rates
5.4.1 Pegging rentals in foreign currency at black market rates has
also been identified as contributing to the levels of rents
currently prevailing. Some unscrupulous real estate agents
and a new group of owner managers in the property market
who engage in unethical practices for the sake of profiteering
have been the major culprits.
5.4.2 The upward rental adjustments in January 2005, were as a
result of catch-up effects on expiring lease agreements whose
rentals had remained at low levels for the rest of 2004. It is
also during January that most of the escalation clauses in
lease agreements are effected.

24
5.4.3 Rent and rates have also been directly increasing in line with
increases in inflation and associated charges such as
amenities, insurance, maintenance costs.
5.4.4 High demand for houses by Zimbabweans in the diaspora has
contributed to the increase in property prices, which are now
beyond the reach of many. Affordability has left many
families with just one option, which is to rent hence the
continued escalation in rentals.
5.5 Possible Solutions to the Rent and Rates Challenges
5.5.1 The major solution to the rent and rates challenge lies in
enhancing the sector’s supply side. The Reserve Bank has
identified the following measures to mitigate the inflationary
pressures coming from rent and rates:
i. The RBZ encourages employee housing schemes to be set
up by companies for their staff;
ii. Speeding up land development processes to increase the
availability of serviced stands. The same should be done
for approvals for site and construction plans;

25
iii. The RBZ urges Local Authorities to work with private
investors in the servicing of land and this can be done on a
Build Operate and Transfer (BOT) basis. This will assist
Local Authorities, which have serious financial
constraints;
6. ENERGY
6.1 Due to the universality of application of electricity, fuel and
coal in all productive systems, any slippages and unjustifiable
price adjustments of these energy sources inevitably trigger
an adverse domino effect on the country’s cost structures.
6.2 It is for this reason that under the recently launched
Parastatals and Local Authorities Reorientation Program
(PLARP), greater focus is being placed on enhancing
operational efficiencies so as to mitigate the undesirable
knock-on effects on inflation caused by random increases in
energy prices.
6.3 The PLARP initiative seeks to ensure that the general public
is not burdened by pricing models that lump in vast margins

26
to cover for operational inefficiencies, which have been noted
to be the case at the moment.
6.4 The energy items in the CPI basket fall under domestic
power. They include electricity, paraffin, fuel and gas.
Changes in the prices of these items, have a significant
impact on the prices of the other items of the CPI basket.
6.5 The energy sector has a direct weight of 2.36 in the CPI
basket.
6.6 Challenges
6.6.1 The challenges faced by the providers of energy range from
the unavailability of spare parts for electricity plants to
logistics in the procurement and distribution of fuel as well as
indebtedness.
6.6.2 Tariff adjustments by the utilities have knock-on effects on
the rest of the economy and therefore, the timing and extent
of these adjustments is vital.

27
6.6.3 It is preferable that where these adjustments are justifiable
and necessary, they be staggered over a period of time so as
to smoothen their impact on the rest of the economy.
6.6.4 There is also need to improve the logistics in terms of the
distribution of fuel in the country.
6.6.5 The lack of efficient distribution chains has often resulted in
shortages and the development of parallel markets where the
commodities are available at exorbitant prices.
6.7 All the public utilities involved in the provision of one
energy type or the other, NOCZIM, ZESA and the other
players have to improve their operations to ensure that the
country does not grind to a halt since they supply inputs that
are vital to all the other sectors of the economy.
7. EDUCATION
7.1. Introduction
7.1.1 Education constitutes 4.3% in the Consumer Price Index
basket, with fees contributing 3.4% to the basket. Other

28
components of this sub-category are school uniforms (0.8%)
and education books (0.2%). Figure 6 below gives a profile
of the month on month changes in the education index since
January 2004.
Figure 6:
Month on Month Education Profile
020406080
100120140
Jan-0
4
Feb-04
Mar-04
Apr-04
May-04
Jun-0
4Ju
l-04
Aug-04
Sep-04
Oct-04
Nov-04
Dec-04
Jan-0
5
Feb-05
Mar-05
%
Line 1 School fees
School uniforms Books
7.1.2 From the graph above we note that the increase in education
is cyclical with the main driver being school fees. The peaks
in school fees are consistent with the start of each term with
the exception for the start of the 3rd term in 2004, when
controls on school fees, were put in place.

29
7.1.3 High increases in school fees have been witnessed over the
past couple of years and these hikes prompted the
Government to intervene with a view to ensuring that
education remains affordable to all. The hikes in school fees
were being justified on the prevailing high inflation
environment.
7.2 Challenges Facing Schools
7.2.1 In general, private schools have always been more expensive
than public schools mainly because they offer more in terms
of both curricular and extra curricular activities. However,
the continued increase in fees has been exerting pressure on
inflation. The increase in school fees has been a result of the
following challenges, among others:
i. Private school fees are structured to fully recover costs. Two
approaches are used to come up with the school fees
structure:
• Flat fees, whereby the costs are divided into three equal
instalments.

30
• Progressive fees, whereby the fees for the first term are the
lowest, but progressively increase for the second and third
terms.
ii. The major cost driver in private schools are staff costs,
which constitute between 55% and 60% of overall
education costs. Previously, the Ministry of Education
used to provide a teachers grant. Until 2001 the
differences in fees and levies between private and public
schools was not so wide because of this grant.
iii. Salary increases were therefore considered to be the main
determinant of school fee adjustments. Private schools try
to maintain the salaries of their staff competitive so as to
retain them.
iv. Boarding fees have gone up in response to the increase in
the price of food items and other amenities like electricity
and water. These constitute between 20% and 30% of
private schools costs.

31
v. Private schools are also responsible for their capital
expenditure as well as the maintenance of physical
infrastructure of their schools, both buildings and grounds.
vi. The rising cost of textbooks – some of which have to be
imported.
vii. Increases in Government subsidies to schools have been
lower than inflation over the last five years resulting in
pressure for public schools to also increase school levies.
7.3 Solutions
7.3.1 In order to avert some of the challenges being faced by both
public and private schools, the RBZ proposes that the
Government, through the relevant organs should consider the
following;
i. Establishment of a virtual warehouse which would facilitate
the central buying of commodities and services in bulk for
both public and private schools – allowing the schools to
benefit from discounts through economies of scale, and

32
ii. The engagement of the printing and publishing industry to
increase their printing capacity so that school textbooks and
exercise books are printed locally thus avoiding importation
costs.
8. In its endeavor to reign in on inflation, the RBZ is
implementing some of the solutions to the challenges as
stated above and the Bank urges all stakeholders to operate
constructively in the stabilization of the economy.

33
ANNEX I
UNDERSTANDING THE COMPUTATION OF INFLATION
1. Introduction
1.1 This Annexure attempts to explain the way inflation is
computed by the Central Statistical Office (CSO) of
Zimbabwe. The basic methodology and base years are very
much similar to those utilized by other SADC countries, for
example, South Africa, Namibia and Tanzania. The range of
the CPI basket and weights being used today are within the
ranges used by other developed countries.
2. Data Collection
2.1 Surveys to collect data on inflation are done around the 15th
of each month. This means enumerators carry out surveys
from the 13th to the 17th of each month. It is also important to
carry out the surveys at the same time every month so as to
determine an expenditure pattern that is not influenced by
changes in income levels. This is because the prices of some
products, particularly fruits and vegetables, fluctuate with the
time of the month especially month ends.

34
2.2 The surveys for all products except fruits and vegetables are
done in shops. The prices of fruits and vegetables are
collected from the respective green markets (musika)
throughout the country.
3. Weights
3.1 Data to compute weights is obtained from household surveys
(Income Consumption and Expenditure Surveys or ICES).
The Central Statistical Office (CSO) samples a number of
households throughout the country, where their consumption
expenditure pattern is recorded for the year. The data is
collected on a monthly basis and integrated for the whole
year. From this data, the annual average household
consumption expenditure is calculated. This data is used to
calculate the weights for each item in the CPI basket. Ideally
the CSO should adjust the weights once in every 5 years.
3.2 The current Consumer Price Index is using the 1995 base
year and the CSO is currently working on finalising a survey
(the ICES) for a more recent base year. This means that in the
near future, new weights will be utilized in the computation
of inflation.

35
3.3 However, the weights which are currently in use are credible
since they are on the whole, indicative of the consumers’
expenditure pattern, for example, food at 33.6 weight
constitutes the largest category in the CPI basket. All
stakeholders are urged to give support to the CSO in their
endeavor to update the Income, Consumption and
Expenditure Survey, which is used to come up with more
recent weights. The base year should be updated on a regular
basis so that weights are more reflective of current
expenditure patterns.
4 Methodology
4.1 The CSO uses the Laspeyres index to calculate the consumer
price index and its presentation is given below.
4.2 The Laspeyres Index is given by;
Laspeyres Index= (∑ P1 Q0 ⁄ ∑P0Q0)* 100
Where P1 = price in the current year
P0 = price in the base year
Q0 = quantities sold in the base year

36
i. The Laspeyre’s index indicates how much the cost of buying
base year quantities at current year prices is, compared with
the base year costs.
ii. It requires quantities measured for only one period - the base.
iii. The Laspeyres method uses quantities consumed during the
base period.
4.2.1 Strength of the Laspeyres
i. By using the same base period, it allows for direct
comparison of indices.
ii. If the CPI is computed using the Laspeyres index, then the
CPI is considered as an upper bound to a cost of living
index1 in that, the CPI does not reflect the changes in buying
or consumption patterns that consumers would make to
adjust to relative price changes. The ability to substitute
means that the increase in the costs to consumers of
maintaining their level of well being tends to be less than the
1 A cost of living index would measure changes over time in the amount that consumers need to spend to reach a certain “level of utility” or “standard of living”.

37
increase in the costs of the mix of goods and services that
they previously purchased. This is because the costs of living
index is affected by the substitution effect and the income
effect. When the prices of goods change, consumers
substitute the goods in their basket to try and remain on the
same level of satisfaction, but the Laspeyres index does not
substitute the items in the basket.
iii. It is simple and less cumbersome to use.
4.2.2 Disadvantages of the Laspeyres Index
The Laspeyres Index does not take into consideration
changes in consumption patterns. Items purchased in large
quantities just a few years ago may be relatively unimportant
today, since consumers tend to adjust their consumption
patterns depending on income, climatic changes, prices and
structural changes in the economy.
4.2.3 Policy
It is rational for trade unions to bargain for a percentage that
is lower than the inflation rate because the Laspeyres index

38
overstates the cost of living since the basket is not adjusted in
accordance with price changes.
4.3 Paasche Index
4.3.1 The Paasche method uses quantity measures of the current
period rather than for the base period as shown below;
4.3.2 Paasche Index is given by;
Paasche Index = (∑ P1 Q1 ⁄ ∑P0Q1)* 100
Where P1 = price in the current period
P0 = price in the base period
Q1 = quantities sold in the current period
NB The difference between the Paasche and the Laspeyre’s
Indices reflects the change in consumption patterns of
consumers.
4.3.3 Advantages of the Paasche Index
i. It is particularly helpful since it combines the effects of
changes in price and consumption patterns.

39
ii. The Paasche Index generally shows a trend towards less
expensive goods and services, which is what consumers do
when prices change.
4.3.4 Disadvantages of the Paasche Index
i. There is need to tabulate quantity measures for each
period examined which may be time consuming and
expensive. Data for this purpose may not be available.
ii. Since quantities considered in the Paasche Index are
different, it is difficult to make intertemporal
comparisons of the indices in different periods.
4.4 Fallacy of Inflation and Price Changes
4.4.1 Most people have often criticized the CSO for
misrepresenting inflation data especially if the inflation rate
declines. People always argue that there cannot be a
reduction in inflation when prices are always rising in the
shops. A fall in inflation implies that the general prices are
rising at a slower rate than for the comparable period.
Therefore, a decline in inflation does not mean a fall in
prices.

40
4.5 Table 3 below shows the 10 broad categories of items in the
CPI basket and their weights. A further breakdown of these
major categories is included in Annex 2.
Table 3: Consumer Price Index Basket
ITEM WEIGHT
(%) 1 Food 33.60
2 Beverages and Tobacco 16.01
3 Clothing and Footwear 6.87
4 Rent, Rates and Domestic Power 17.33
5 Furniture and Household Stores 7.52
6 Medical Care 1.68
7 Transport and Communication 6.60
8 Recreation and Entertainment 1.22
9 Education 4.44
10 Miscellaneous Goods and Services 4.73
Total 100

41
ANNEX 2: CONSUMER PRICE INDEX (CPI) BASKET
Item Weight Item Weight
ALL ITEMS 100 Maize meal 6.41
FOOD 33.60 Maize meal –super refined 1.82
Bread & cereals 11.99 Maize meal-roller meal 4.59
Bread 3.92 Rice and cereals 0.71
White bread 3.69 Rice - long grain 0.32
Brown bread 0.24 Rice - short grain 0.32
Other bakery products 0.04 Spaghetti 0.01
Bun 0.01 Macaroni 0.01
Scone 0.01 Breakfast cereals 0.03
Cake 0.01 Baby cereal 0.03
Biscuits 0.10 Meat 6.56
Biscuits-plain marie 0.02 Beef 4.74
Biscuits-loose 0.02 Rump steak-beef 0.78
Biscuits-lemon creams 0.02 Topside-beef 0.78
Biscuits-assorted 0.02 Stewing steak-beef 0.78
Flour 0.81 Ration meat-beef 0.78
Flour-self raising 0.40 Liver-beef 0.78
Flour –plain 0.40 Mince (beef) 0.78

42
Item Weight Item Weight
Boerewors-beef 0.06 Milk- sterilized 0.37
Offals 0.17 Powdered milk- full cream 0.18
Offal-beef 0.05 Powdered milk - for babies 0.04
Offal-beef 0.12 Other milk products 0.09
Chicken 1.34 Cheese 0.04
Chicken-full 1.34 Ice cream 0.03
Other meat products 0.32 Yoghurt 0.02
Pork 0.17 Eggs 0.50
Bacon 0.03 Eggs 0.50
Sausages-pork 0.06 Oils and fats 2.14
Tinned meat 0.05 Butter 0.02
Fish 1.17 Butter 0.02
Fish 1.17 Cooking oil 1.64
Frozen fish 0.50 Cooking oil -olivine 0.82
Dried fish 0.65 Cooking oil -panol 0.82
Tinned fish 0.02 Margarine 0.48
Milk, cheese and eggs 2.37 Margarine-stork 0.35
Milk 1.78 Soft margarine - hellio 0.13
Sour milk 0.37 Fruits and vegetables 5.97
Fresh milk 0.83 Fresh fruits 0.43

43
Item Weight Item Weight
Apples 0.06 Tinned peas 0.03
Bananas 0.15 Tinned fruit 0.02
Mangoes 0.07 Coffee and tea 0.28
Oranges 0.14 Coffee 0.06
Fresh vegetables 4.90 Coffee - instant 0.03
Green beans 0.03 Coffee ground 0.03
Cabbages 0.61 Tea 0.22
Okra 0.06 Tea bags 0.11
Carrots 0.03 Tea leaves 0.11
Onions 0.26 Condiments and confectionary 2.91
Rape/Covo/Chomoulier 1.65 salt 0.21
Tomatoes 1.28 Table salt 0.21
Potatoes 0.77 Sauces and other foods 0.50
Cucumber 0.01 Tomato sauce 0.04
Sweet potatoes 0.21 Curry powder 0.08 Tinned and dried vegetables 0.64 Gravy-powder 0.01
Baked beans 0.30 Soup 0.01
Dried beans 0.30 Vinegar 0.00

44
Item Weight Item Weight
Jam- sun sweet 0.04 BEVERAGES AND TOBBACCO 16.01
Jam - mixed fruit 0.04 Beverages 14.31
Baking powder 0.02 Fruit juice 2.41
Sweets 0.02 Fruit juice 2.41
Peanuts 0.09 Soft drinks 2.92
Potato crisps 0.05 Coca cola - bottled 1.42
Peanut butter 0.11 Coca cola - tinned 1.42
Sugar 2.20 Tonic water 0.08
White Sugar 1.10 Clear beer 3.31
Brown Sugar 1.10 Clear beer - castle (bottle store) 1.10
Meals outside home 0.19 Clear beer - Bohlingers (bottle store) 1.10
Meals outside home 0.19 Clear beer - castle (hotel) 1.10
Hamburger 0.01 Opaque beer 4.68
Chips 0.03 Opaque beer - packed 2.34
Sadza 0.05 Opaque beer - draught 2.34
Dinner meal 0.05 Other bar drinks 0.99
Quarter chicken 0.03 Brandy 0.10
Pie 0.02 Gin 0.10

45
Item Weight Item Weight
Whisky 0.13 Shirts - long sleeve 0.32
Wine 0.57 Shirts - short sleeve 0.28
Whisky 0.09 Socks and briefs 0.08
Tobacco 1.69 Socks 0.06
Cigarettes 1.53 Briefs 0.02
Cigarettes - kingsgate 0.77 Women's clothing 1.98
Cigarettes - Berkeley 0.77 Costume 0.87
Other tobacco 0.16 Dress 0.21
Snuff 0.04 Skirt - flared 0.17
Pipe tobacco 0.12 Skirt - pencil 0.17 CLOTHING AND FOOTWEAR 6.87 Blouse 0.25
Clothing 5.30 Jersey 0.32
Men's clothing 2.15 Women's underwear 0.13
Trousers-formal 0.60 Panties 0.06
Trousers 0.19 Brassiere 0.02
Jean trousers 0.08 Panty-hose 0.01
Suits - double breast 0.29 Petticoat 0.05
Suits - single breast 0.29 Night dress 0.03
Pullover 0.09 Night dress 0.03

46
Item Weight Item Weight
Shorts 0.19 Children’s Shoes 0.37
Dress 0.21 Girls school shoes 0.12
T Shirt 0.19 Girls party shoes 0.12
Rompers 0.04 Boys school shoes 0.12
Napkins 0.07 Sports shoes 0.05
Dress Material 0.23 Sports shoe 0.05 Dress material - single metre 0.11
RENT, RATES and DOMESTIC POWER 17.33
Dress material - double metre 0.11 Rent & rates 15.79
Footwear 1.57 Rent 14.25
Men's shoes 0.55 Rent high density 7.12
Shoes - leather 0.27 Rent low density 7.12
Canvas shoes 0.27 Sewerage rates 0.13
Women's shoes 0.60 Sewage - high density 0.07
Court shoes 0.15 Sewage - low density 0.07
Casual shoes 0.15 Dust removing rates 0.13
Sandals 0.15 Dust removing rates - high density 0.07
Canvas shoes 0.15 Dust removing rates - low density 0.07
Children’s Shoes 0.37 Owners rates 0.40

47
Item Weight Item Weight
Owners rates - for land 0.20 FURNITURE AND HOUSEHOLD 7.52
Owners rates - for impro ement
0.20 Soft furnishings 1.20
Water Charges 0.87 Textiles 1.01 Water Charges – low density 0.44 Bed sheets 0.15 Water Charges- high density 0.44 Blanket 0.43 Repair and Maintenance 0.75 Bed spread 0.43
Materials for Repair 0.50 Other textiles 0.18
Asbestos Sheet 0.25 Towel 0.07
Cement 0.25 Curtain material 0.12
Window panes 0.25 Household utensils 0.62
Door Lock 0.25 Cutlery 0.03
Paint 0.25 Kitchen knife 0.01
Domestic power 0.80 Tea spoon 0.01
Electricity 0.32 Kitchen Utensils 0.56 Electricity charges - metred 600 units 0.16 Plate 0.05 Electricity charges - monthly charge for 0.16 Teapot 0.05
Paraffin and gas 0.48 Plate 0.10
Paraffin 0.42 Coffee mug - enamelware 0.10
Gas 0.06 Coffee mug - chinaware 0.06

48
Item Weight Item Weight
Frying pan 0.10 Electric stove 0.14
Pot 0.10 Refrigerator 0.45
Drinking glass 0.03 Deep freezer 0.08
Drinking glass 0.03 Hot plate stove 0.03
Furniture and carpets 1.31 ` Primus stove 0.01
Furniture 1.28 Other household equipment 0.03
Bedroom suite 0.05 Pressing iron - adjustable 0.00
Bed & Mattress 0.29 Pressing iron - non adjustable 0.00
Table & chairs 0.06 Electric fan 0.01
Lounge suite - dralon 0.27 Electric heater 0.01 Lounge suite – weave/rexin 0.27 Household operations 3.66
Wardrobe 0.05 Detergents 2.37
Dining room suite 0.14 Washing powder - surf 0.26
Room divider 0.09 Washing powder - cold power 0.26
Kitchen dresser 0.06 Disinfectant 0.03
Carpets 0.03 Toilet cleaner 0.03
Floor carpets 0.03 Laundry soap - wrapped 0.90
Household equipment 0.74 Laundry soap - mottled 0.90
Stoves and refrigerators 0.71 Laundry services 0.10

49
Item Weight Item Weight
Dry cleaning - men's suit 0.05 MEDICAL CARE 1.68 Dry cleaning - women's costume 0.05 Medicines 0.39 Garden tools and fertiliser 0.23 Medicines 0.39
Fertiliser 0.18 Antibiotics 0.07
Hosepipe 0.02 Antihypertensive 0.07
Hoe 0.02 Anti diabetics 0.07
Garden fork 0.02 Anti asthma 0.07
Household operations 0.78 Pain killer 0.07
Light bulb 0.07 Cough-mixture 0.07 Candles 0.11 Medical fees 1.29
Insecticides 0.11 Hospital fees 0.33 Matches 0.16 Government in-patient 0.06
Floor polish 0.10 Municipality out-patient 0.06
Torch battery 0.17 Government out-patient 0.06
Shoe polish 0.07 Private clinic ward fee 0.06
Other household 0.18 Private hospital 0.09
Knitting wool 0.15 Other medical fees 0.96 Operations Maternity fee
Sewing thread 0.02 Medical examination 0.01
Needle 0.01 Private consultation per visit 0.18

50
Item Weight Item Weight Laboratory test chest x-ray 0.01 Petrol - gasoline 0.87
Ambulance charge 0.01 Diesel oil 0.15
Medical aid contribution 0.76 Public transport 3.51 TRANSPORT And COMMUNICATION 6.60 Railway fares 0.06
Vehicle running costs 2.19 Rail journey - economy 0.02
Vehicle insurance 0.18 Rail journey - standard 0.02
Vehicle insurance 0.18 Rail journey - sleeper 0.02 Car parts 0.45 Commuter fares 3.39
Car tyre 0.13 Commuter fares 1.46
Car battery 0.06 Bus fare - convectional long distance bus 0.96
Brake pads 0.06 Bus fare - luxury coach long distance 0.96
Distributor points 0.06 Taxi fares 0.03 Plugs 0.06 Taxi fares 0.03 Gasket 0.06 Air fares 0.04 Vehicle repairs and lubricants 0.55 Air fare – local journey 0.01
Repairs 0.24 Air fare - regional 0.01
Engine oil 0.05 Air fare - international 0.01
Brake fluid 0.01 Car hire 0.01
Full service 0.25 Car hire 0.01
Fuel 1.02 Communication 0.35

51
Item Weight Item Weight
Postal services 0.04 Sport equipment 0.01
Postage - local letter 0.02 Tennis racquet 0.00
Postage - international 0.02 Golf ball 0.00
Telephone services 0.31 Tennis balls 0.00 Telephone charge - monthly rental charge 0.06 Football 0.00 Telephone call - local metred 0.06 Newspapers 0.17 Telephone call - international metred 0.06 Daily newspaper 0.08 Cell phone - monthly fixed rental
0.06 Weekly newspaper 0.08
Cell phone - call charge 0.06 Magazines 0.03 Purchase of new cars 0.52 Local magazine 0.02
Purchase of new cars 0.52 International magazine 0.02
New car - type 1 0.17 Music 0.12
New car - type 2 0.17 Audio cassette - local 0.04
New car - type 3 0.17 Audio cassette - international 0.04
Purchase of bicycles 0.03 Compact disc 0.04
Purchase of bicycles 0.03 Photography 0.05 Bicycle 0.03 Photographic film 0.03 RECREATION AND ENTERTAINMENT 1.22 Film development 0.03 Entertainment services 1.22
Radio and television 0.64

52
Item Weight Item Weight Radio & cassette player 0.27 Correspondence fees 0.14 Television 0.29 Private college fees 0.85
Video cassette recorder 0.08 Examination fees 0.18
Sport fees 0.07 Examination fees-"O" level 0.18
Sports fees 0.03 School uniforms 0.84
Golf club fee 0.03 School uniforms 0.84
Gym fee 0.01 Girls uniform 0.13 Other Expenditure on Entertainment 0.12 Boys shorts 0.13
Radio listener's licence 0.04 Boys shirts 0.13 Television listener's licence 0.04 Jersey 0.13
Video cassette hire 0.01 Blazer 0.13
Cinema seats 0.02 Tracksuit 0.18
EDUCATION 4.44 Educational books 0.19
Education fees 3.42 Writing equipment 0.13
Education fees 1.39 Exercise Books 0.05
Tuition fees 0.85 Ball point pen 0.08
Boarder fees 0.54 Textbooks 0.05
College fees 1.85 Mathematics textbook 0.03
University fees 0.85 Economics textbook 0.03

53
Item Weight Item WeightMiscellaneous Goods And Services 4.73
Other goods and services 2.13
Personal care 2.60 Travel goods 0.30
Men's hair services 0.11 Suitcase 0.24
Men's hair cut 0.06 umbrella 0.06
Shaving 0.05 Accommodation 0.31
Women's hair services 0.31 Hotel room 0.31
Ladies' perm 0.08 Shoe repairs 0.02
Hair relax 0.08 Shoe repairs - women's full sole 0.01
Oil treatment and set 0.08 Shoe repairs - men's shoe full rubber sole 0.01
Hair plaiting 0.08 Pet food 0.12
Toiletries 2.18 Pet food 0.12 Toilet soap 0.47 Driving fees 0.03
Bath soap 0.47 Driving lesson fee 0.03
Toilet roll 0.16 Domestic wages 1.32
Skin cream 0.21 Domestic wages 1.32
Petroleum jelly 0.21 Lottery tickets 0.04
Toothpaste 0.45 State lottery ticket 0.04 Deodorant 0.15 Cotton wool 0.06