Inflation Differentials, Price Differentials, and ... · for non-traded inflation, which is much...
43
Inflation Differentials, Price Differentials, and Convergence in the Eurozone William Braun Faculty Advisor: Prof. Geoffrey Woglom Submitted to the Department of Economics at Amherst College in partial fulfillment of the requirements of the degree of Bachelor of Arts with Honors May 6, 2010
Transcript of Inflation Differentials, Price Differentials, and ... · for non-traded inflation, which is much...
Inflation Differentials, Price Differentials, and
Convergence in the Eurozone
William Braun
Faculty Advisor: Prof. Geoffrey Woglom
Submitted to the Department of Economics at Amherst College in partial
fulfillment of the requirements of the degree of Bachelor of Arts with
Honors
May 6, 2010

Abstract
This thesis addresses the determinants of inflation differentials within monetary
union, focusing on the original 11 Eurozone countries in the decade following the
adoption of the common currency in 1999. Much of the literature suggests that price level
convergence, and thus the overall integration process, may be a significant determinant of
these differentials. Thus, I first construct a dataset of comparative price level indices and
find that overall price levels are indeed converging. Dispersion is much greater in the
nontraded (services) sector than in the traded goods sector, and price level convergence is
much more substantial for traded goods.
I apply a model of inflation differentials based on Honohan and Lane (2004) and
Egert (2007) to overall and sectoral-level inflation and find that price level convergence
does appear to be a determinant of inflation differentials, though the overall magnitude of
this effect is limited. Inflation persistence and the business cycle are also important.
Convergence exerts a much greater effect on traded goods inflation but does not matter
for non-traded inflation, which is much more attributable to inflation inertia and the
business cycle. I also find tentative evidence in support of the Balassa-Samuelson effect,
as productivity growth rate differentials between the manufacturing and nontraded sectors
exerts upward pressure on services prices. However, the overall impact on inflation is
quite small, and is insignificant for the overall inflation rate.
Keywords: Price levels; inflation; economic integration; monetary union; the euro

Acknowledgements
I would first like to thank my thesis advisor, Prof. Geoffrey Woglom, for all of his help
over the past year. He first suggested this topic and, without his insight and helpful
comments, this thesis would not have been written. I know that my fierce independence
was often exasperating and, had I allowed myself to be reined in and focused a little bit
earlier, this would very likely have been a much less painful process.
Many thanks to the rest of the economics department, especially Professors Reyes,
Barbezat, Honig, Westhoff, and Kingston, for my wonderful experiences in all of their
classes. They have made me love economics, and this past year has made me greatly
appreciate the time and effort that goes into their research. I want to thank Prof. Reyes in
particular for her patience and dedication as my major advisor, for her encouragement in
the days leading up to the completion of this project, and for all of the general chats and
advice throughout the past several years. Those kinds of relationships are the reasons one
comes to Amherst, and I hope that future students can appreciate everything she does for
us. And many thanks to Jeanne Reinle, whose plentiful supply of free coffee and good
cheer made all of those long hours in the computer lab much more bearable.
I am especially grateful to my parents, Jan and Steve Braun, for all of their love. The
sacrifices that they have made for my sister and me are astounding, and I am grateful for
their positive example for doing things the right way. I hope that I can one day be half as
good of a parent as they have been to me. Meredith, I hope that you seize every
opportunity and take risks to improve yourself intellectually and socially as you prepare
to go to college yourself. The times that I have done so have been my most rewarding in
the last four years, and my only regret is that I have not done it enough.
For all of my friends, thanks for your support. I’m especially grateful to Peter Tang for
four years of Sunday brunch with the New York Times, and to Philip Spencer for his
succor and assistance. And AGonz, I think that what we’ve done the past four years and
with our senior theses has done Central Catholic proud.
And most of all, thank you to Haley for always being there for me. I do not think that I
could have made it through this process without her love and constant presence, and I
know that she is probably happier than I am that this thesis is complete.

1
Table of Contents
I. Introduction ......................................................................................................................... 2
The Policy Challenge ..................................................................................................................... 7
Possible Explanations.................................................................................................................... 9
II. Price Level Data ............................................................................................................... 12
III. A Model of the Inflation-Price Level Nexus .......................................................... 18
The Determinants of Inflation Differentials ............................................................................ 19
IV. Empirical Framework .................................................................................................. 23
Econometric Specification .......................................................................................................... 24
Results ............................................................................................................................................. 26
V. Conclusion ......................................................................................................................... 28
Appendix A: Data ............................................................................................................................. 31
Appendix B: Price Level Dispersion, Euro-11, 1996-2009 ..................................................... 34
Appendix C: Price Level Dispersion, 7-Country Subsample, 1991-2007 ............................ 36
Bibliography....................................................................................................................................... 39
2
I. Introduction
The process of European integration and the establishment of the single market
culminated with the introduction of the Euro in 1999, nearly fifty years after the
establishment of the European Coal and Steel Community in 1951. Supplementing the
elimination of non-tariff barriers achieved with the fulfillment of the Single Market
Program in 1992 (Bottasso and Sembenelli 2001), the Euro was expected to lead to
further market integration throughout the Eurozone by increasing price transparency and
eliminating exchange rate risk, transaction costs, and border effects. With the removal of
these barriers and freer movement of goods, labor, and capital, convergence in price
levels was expected, especially for traded goods. In addition, convergence in inflation
rates was expected to occur under the common monetary policy set by the European
Central Bank. Such convergence is a prerequisite for the appropriateness of the common
monetary policy among Euro-area countries. In addition, price and inflation
developments are crucial determinants of the long-run viability of a currency union.
Nitsch (2005), for example, examines a series of sustained and dissolved monetary
unions and finds that large and persistent inflation differentials are a leading cause of
currency dissolution, although Eurozone inflation differentials do not appear to be large
enough for this to occur.1 Moreover, during the ongoing process of Eurozone expansion,
price and inflation dynamics within the accession countries are an area of significant
interest to policymakers (Cihak and Holub 2005).
1 Nitsch finds the average inflation differential immediately prior to exit from a currency union to be
approximately 11 percent, compared to 4.5 percent during periods of stability. By comparison, inflation
differentials among the original 11 Eurozone countries (the “Euro-11”) were 2.3 percent in 2008 and 3.3
percent in 2009, when a handful of countries actually saw decreases in their overall price level, presumably
due to the financial crisis in that year.
3
One common method of examining price level developments within the literature
is what Fischer (2007) has dubbed the “Relative Purchasing Power Parity (PPP)”
method.2 In this approach, price indices are calculated based upon a given base year in
which the price level is counterfactually assumed to be equal for all countries and all
product categories. This method allows for an easy comparison of price changes among
countries in the sample. Figure 1.1 shows price indices calculated on the basis of year-
over-year changes in the overall Harmonized Index of Consumer Prices3 within the Euro-
11 countries (i.e. the original 11 members of the Eurozone)4 since 1999, with the price
level in base year 1999 equal to 100 for all countries. Changes in this index range from
18 percent in Germany to as much as 40 percent in Ireland, resulting in differentials of
relative price changes of more than 18% since 1999. Moreover, these differentials are not
driven by outliers; rather, they are almost uniformly distributed. For this and for all other
figures in which legends are included, countries are listed in descending order of the
value of the variable being examined in the final year.
2 These indices are also often referred to as “relative price levels” in the literature. Thus, within the context
of this paper the term “relative price” refers not to the ratio of the price levels of two different goods, but to
the price index of a good (or category of goods) in a given year relative to a base year; that is, the
cumulative change in the price of the good relative to the base year. 3 The Harmonized Index of Consumer Prices (HICP) is the official price index measure that is compiled by
Eurostat, the official statistical agency of the European Union, and is broadly similar to traditional
Consumer Price Index measures. See Appendix A for a more thorough discussion of these indices. 4 Austria, Belgium, Finland, France, Germany, Ireland, Italy, Luxembourg, the Netherlands, Portugal, and
Spain.

4
Source: Author’s calculations, based on HICP data from Eurostat New Cronos database
As these indices are calculated on the basis of changes in the overall price index,
these differentials reflect persistent differentials in inflation rates, but not necessarily in
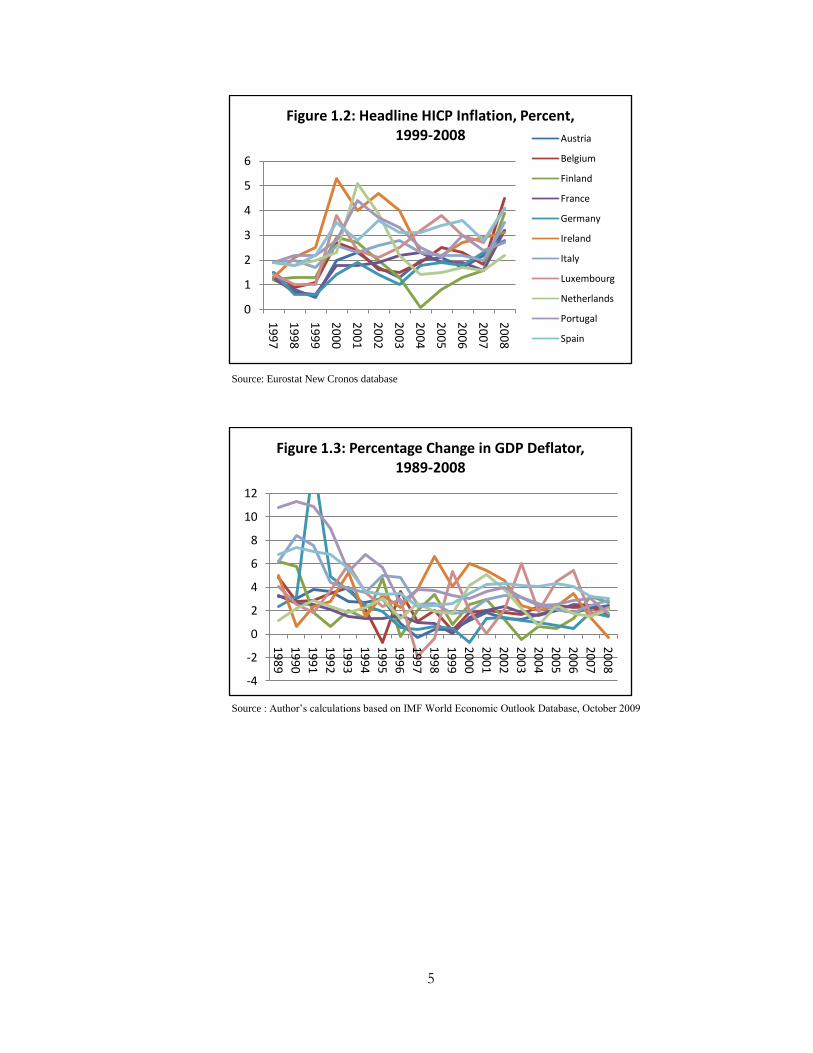
levels of actual prices.5 Figure 1.2 shows headline HICP inflation rates from 1996-2009
for the Euro-11 sample, while Figure 1.3 shows the year-over-year changes in the GDP
deflator and figure 1.4 shows the coefficient of variation6 (a measure of overall dispersion
of the inflation rate) for both samples (excluding Germany, as the absorption of the East
German economy upon reunification in 1991 was a very significant shock that led to a
large temporary increase in inflation in that year). Both samples are included because
year-over-year changes in the HICP provide a more accurate measure of the behavior of
consumer prices than do changes in the GDP deflator.
5 Similarly, the differentials for more disaggregated product categories thus represent differentials in the
cumulative price level changes for these categories of goods alone. 6 The coefficient of variation for a given year is defined as the standard deviation of the cross-sectional
inflation series divided by the mean. While the standard deviation also provides a measure of dispersion,
the coefficient of variation is a “unit-free” measure of dispersion that allows for the comparison of
dispersion of variables that are denominated in different units. Although this distinction is not as important
for examining inflation rates, it will be especially important in discussing price level dispersion. As overall
price levels increase over the sample period, the standard deviations may rise even when price levels
themselves are converging.
100
105
110
115
120
125
130
135
140
145
19
99
20
00
20
01
20
02
20
03
20
04
20
05
20
06
20
07
20
08
20
09
Figure 1.1 Relative Price Levels, 1999=100
Ireland
Spain
Portugal
Luxembourg
Italy
Netherlands
Belgium
France
Austria
Finland
Germany
5
Source: Eurostat New Cronos database
Source : Author’s calculations based on IMF World Economic Outlook Database, October 2009
0
1
2
3
4
5
6
19
97
19
98
19
99
20
00
20
01
20
02
20
03
20
04
20
05
20
06
20
07
20
08
Figure 1.2: Headline HICP Inflation, Percent, 1999-2008 Austria
Belgium
Finland
France
Germany
Ireland
Italy
Luxembourg
Netherlands
Portugal
Spain
-4
-2
0
2
4
6
8
10
12
19
89
19
90
19
91
19
92
19
93
19
94
19
95
19
96
19
97
19
98
19
99
20
00
20
01
20
02
20
03
20
04
20
05
20
06
20
07
20
08
Figure 1.3: Percentage Change in GDP Deflator, 1989-2008

6
Sources: Change in GDP Deflator: Author’s calculations based on IMF World Economic
Outlook Database; HICP inflation: Eurostat New Cronos Database
While dispersion in inflation based upon the GDP deflator is much higher than that based
upon the HICP, the longer sample suggests that inflation rates converged during the early
1990’s, and both measures show divergence in the years immediately preceding Euro
adoption. Inflation rates continued to converge steadily from 1999 to 2008 (before
diverging greatly in 2009). Examining the longer time series, rates appeared to converge
rapidly from approximately 1990 to 1993, before diverging slightly during the next three
years and more rapidly during the years immediately preceding the introduction of the
Euro. Rates have converged since then, with a transitory increase in dispersion in 2002
(possibly due to the introduction of Euro notes and coins in that year), but this
convergence largely appears to be a reversion to the prevailing levels before the Euro.
However, it is important to note that rather significant inflation differentials do still exist
despite this convergence behavior, as the 2.9% rate of HICP inflation seen in Ireland in
2007 is nearly twice the 1.6% seen in Finland, France, and the Netherlands.
0
0.2
0.4
0.6
0.8
1
1.2
19
89
19
91
19
93
19
95
19
97
19
99
20
01
20
03
20
05
20
07
Figure 1.4: Coefficient of Variation for Euro-11 Inflation Rates, 1989-2008
1989-2007, % Change in GDP Deflator
1997-2009, HICP Inflation

7
The Policy Challenge
Taken alone, such inflation differentials (especially if they persist) are of great
concern to policymakers, national central bankers, and the European Central Bank (ECB)
because the associated misalignments of real interest rates and real exchange rates
question the appropriateness of the common monetary policy for all countries at all times.
Turning first to the real interest rate channel, with a common interest rate i across
financial markets in all Euro countries, high-inflation countries see lower real interest
rates, and lower-inflation countries see higher real interest rates. Thus, the common
monetary policy set by the ECB may be too tight for countries with low inflation rates
and too expansionary for countries with high inflation. In addition, inflation differentials
can cause countries to accumulate significant changes in competitiveness over time. The
bilateral real exchange rate is defined as the product of the nominal exchange rate e and
the ratio of the domestic price level P to the foreign price level Pf:
𝑅𝐸𝑅 = 𝑒 𝑃
𝑃𝑓
The nominal exchange rate among countries in a monetary union is simply equal to one,
so that the real exchange rate is entirely determined by the price ratio. Figure 1.2 shows
real exchange rate (RER) developments of the Euro-11 countries in my sample since the
introduction of the common currency in 1999, with the RER defined as the ratio of the
national price level (in the relative PPP terms previously defined) to the weighted average
of the price levels in the other ten countries. Because the price level in 1999 is equal to
100 for all countries, the price ratio (and therefore the RER itself) is equal to one for all
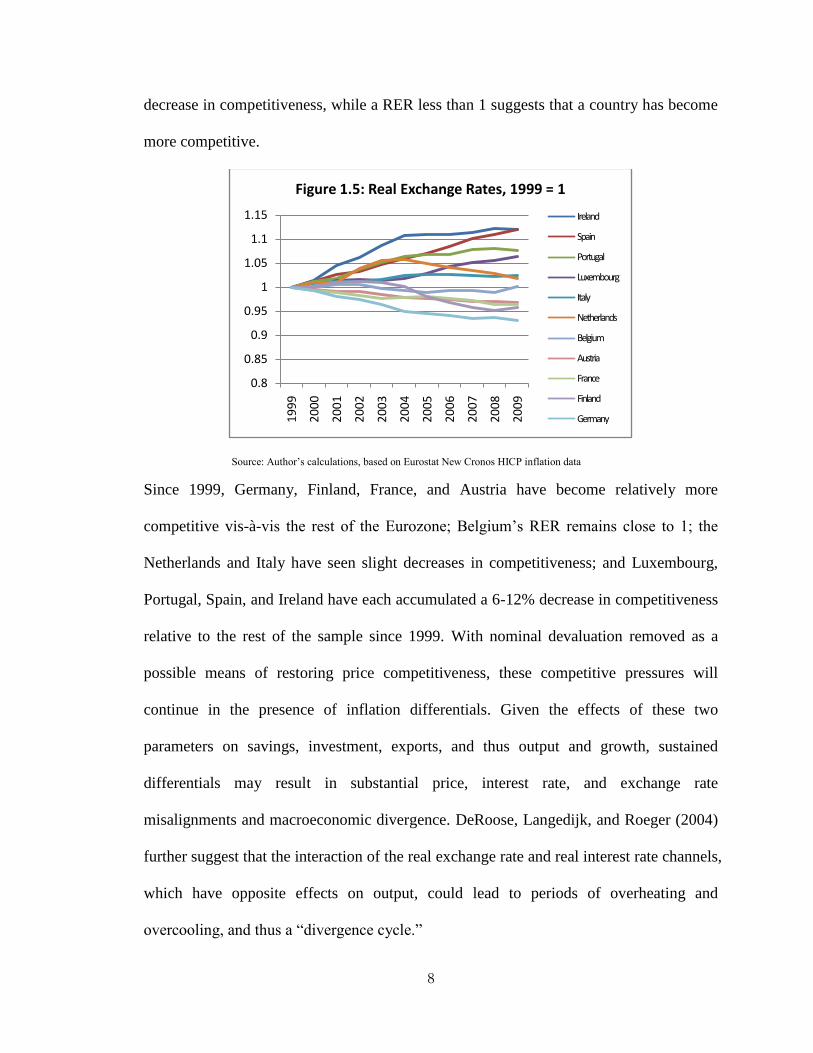
countries in 1999. Given this definition, a RER greater than 1 indicates a relative
8
decrease in competitiveness, while a RER less than 1 suggests that a country has become
more competitive.
Source: Author’s calculations, based on Eurostat New Cronos HICP inflation data
Since 1999, Germany, Finland, France, and Austria have become relatively more
competitive vis-à-vis the rest of the Eurozone; Belgium’s RER remains close to 1; the
Netherlands and Italy have seen slight decreases in competitiveness; and Luxembourg,
Portugal, Spain, and Ireland have each accumulated a 6-12% decrease in competitiveness
relative to the rest of the sample since 1999. With nominal devaluation removed as a
possible means of restoring price competitiveness, these competitive pressures will
continue in the presence of inflation differentials. Given the effects of these two
parameters on savings, investment, exports, and thus output and growth, sustained
differentials may result in substantial price, interest rate, and exchange rate
misalignments and macroeconomic divergence. DeRoose, Langedijk, and Roeger (2004)
further suggest that the interaction of the real exchange rate and real interest rate channels,
which have opposite effects on output, could lead to periods of overheating and
overcooling, and thus a “divergence cycle.”
0.8
0.85
0.9
0.95
1
1.05
1.1
1.15
19
99
20
00
20
01
20
02
20
03
20
04
20
05
20
06
20
07
20
08
20
09
Figure 1.5: Real Exchange Rates, 1999 = 1
Ireland
Spain
Portugal
Luxembourg
Italy
Netherlands
Belgium
Austria
France
Finland
Germany
9
Possible Explanations
These inflation and relative price level differentials have two possible
explanations, each offering a profoundly different conclusion regarding the broader
process of European integration and convergence. If these changes in relative PPP
measures are accompanied by similar divergence in price levels and macroeconomic
factors, the aforementioned monetary policy issues will be salient issues in the long run
and the European currency union will appear to have failed in one important respect, at
least in the immediate sense. Alternatively, if countries with lower price levels are seeing
higher inflation rates as they catch up to countries with higher prices, then the inflation
and relative price level differentials will not represent an equilibrium condition. Instead
of being an area of significant concern, they will be a welcome and necessary indication
of the convergence process (if less than optimal in the short term). As has been explained
at length in the literature, if countries with lower price levels are converging to countries
with higher prices, higher rates of inflation will be necessary during the adjustment
period. The Balassa-Samuelson effect, which explains inflation rates as the result of
differentials in productivity between the traded and nontraded sectors, is a commonly
discussed component of this convergence framework that will be discussed more
thoroughly in section III. Both of these possible explanations (pure price level
convergence and the Balassa-Samuelson productivity approach) suggest that inflation
differentials may be a transitory phenomenon that should diminish over time. Rogers,
Hufbauer, and Wada (2001) posit an interesting extension of this framework and raise the
possibility of currency misalignments during the process of euro adoption. Namely, if the
currency conversion rates that were irrevocably fixed in 1999 before the introduction of

10
Euro notes and coins in 2002 did not adequately calibrate price levels across the euro
zone, then further convergence is to be expected thereafter. In countries with low initial
price levels, higher inflation will exist during this convergence process. Thus, while price
and inflation differentials may be a concern in the short- and medium-term, they will be
much less significant in the very long run.
The impossibility of distinguishing between these two hypotheses within the
relative PPP context has been discussed in great detail by Fischer (2007). Constructed
price indices like those shown above are interesting in and of themselves and are often
necessary due to the paucity of absolute price level data. However, the reliance on this
measure is recognized to be a significant shortcoming of the existing literature because
the setting of the base year is entirely arbitrary and precludes a thorough discussion of
comparative price levels (Engel and Rogers 2004). That is, the cost of a given good in a
country like Ireland, that has seen the largest increase in the price of a given good or
category of good, could still be lower than in a country like Germany. Several authors,
including Rogers (2007), Engel and Rogers (2004), and Rogers, Hufbauer, and Wada
(2001) use a unique dataset compiled by the Economist Intelligence Unit (EIU) that
contains actual prices of hundreds of very specific goods and services such as “dry
cleaning, ladies’ dress,” “batteries (two for flashlight/radio use),” “one drink at bar of
first-class hotel,” and “lipstick for women (deluxe type) collected in 100 cities worldwide.
Due to the inaccessibility and cost of this data, as well as its urban bias, section 2
explains how Faber and Stokman’s (2004) method for combining purchasing power
parity (PPP) observations with constructed price indices like those shown above were

11
used to construct a dataset of estimates of comparative price levels among the Euro-11
countries.
This paper examines developments price levels and inflation for the aggregate
Eurozone, along with indices for consumer goods and consumer services in order to
proxy for the differences between tradable and nontradable goods, for each of the decades
preceding and following the introduction of the common currency in 1999. General
trends in disaggregated price indices at the single-digit product level7 are examined. First,
I examine the Euro-11 sample from 1996-2009, as HICP data is only available from 1996
for all countries. As will be seen, significant differentials in actual prices exist and, while
they do appear to be converging, they are doing so quite slowly. While the traded goods
sector has seen some convergence as expected, convergence among services is slight.
However, much existing work in this area suggests that convergence does not appear to
be due to the common currency itself. Rather, the convergence of prices and inflation
rates throughout the 1990’s has been well documented, and appears to have been
influenced by both the implementation of the Single Market Program and the pursuit of a
tighter monetary policy by national central banks in order to fulfill the Maastricht criteria
for Euro adoption.8 Moreover, Faber and Stokman (2009) find evidence that price levels
7 That is, for the 12 broadest categories of goods for which Eurostat compiles HICP indices and PPP data. It
is important to note that each of these 12 categories contains both goods and services components, so I also
examine indices for “all consumer goods” and “all consumer services” separately. It would be ideal to use
more disaggregated data, but Eurostat only releases absolute price level data for these 12 categories and a
very limited number of more specific categories. 8 In addition to strict limitations on annual government budget deficits (not to exceed 3% of GDP) and
gross government debt (not to exceed 60% of GDP), countries were required to bring their inflation rates to
within 1.5% of the average of the three best-performing European Union Member States (i.e. the three with
the lowest inflation rates); join the Exchange Rate Mechanism of the European Monetary System for at
least two consecutive years prior to Euro adoption; were not allowed to devalue their currency during this
period; and were required to have a nominal long-term interest rate within 2% of the three lowest-inflation
member states.

12
have been converging throughout most of the European integration process (that is, for
the last 50 years).
Thus, in order to examine general trends in price levels over a longer period, price
indices were also constructed from 1991-2007 for a subsample of countries for which a
longer time series of data is available.9 For both samples, the general trends in price and
inflation differentials and convergence within the Eurozone will be discussed. However,
the main aim of this paper is to identify the main determinants of inflation differentials
and establish whether they are attributable to the convergence process, focusing on the
Euro-11 sample from 1999-2009.
II. Price Level Data
In order to compile data on price levels that are comparable across countries, I
follow Faber and Stokman’s (2009) method for “scaling” Harmonized Index of
Consumer Prices (HICP) price indices, which they derived from Chen and Devereux’s
(2003) study of price level differentials among US cities. Eurostat publishes HICP price
index data from 1996 (with base year 2005) for 165 categories of goods of varying
specificity, as well as for a handful of special aggregates (e.g. “All prices excluding
energy”). PPP data, which provides comparative price levels for each country relative to
its eurozone peers, is only available for the 12 broadest (“one-digit”) categories of goods
and services and very limited number of more specific categories and special
aggregates.10
In compiling these price indices, I first re-calculate the indices so that they
have a base year 1999, and this relative price index for each year is scaled by the PPP
9 Austria, Finland, France, Germany, Ireland, Italy, and the Netherlands.
10 Within the currency union, PPP differentials reflect differentials in the purchasing power of a euro in the
different countries.
13
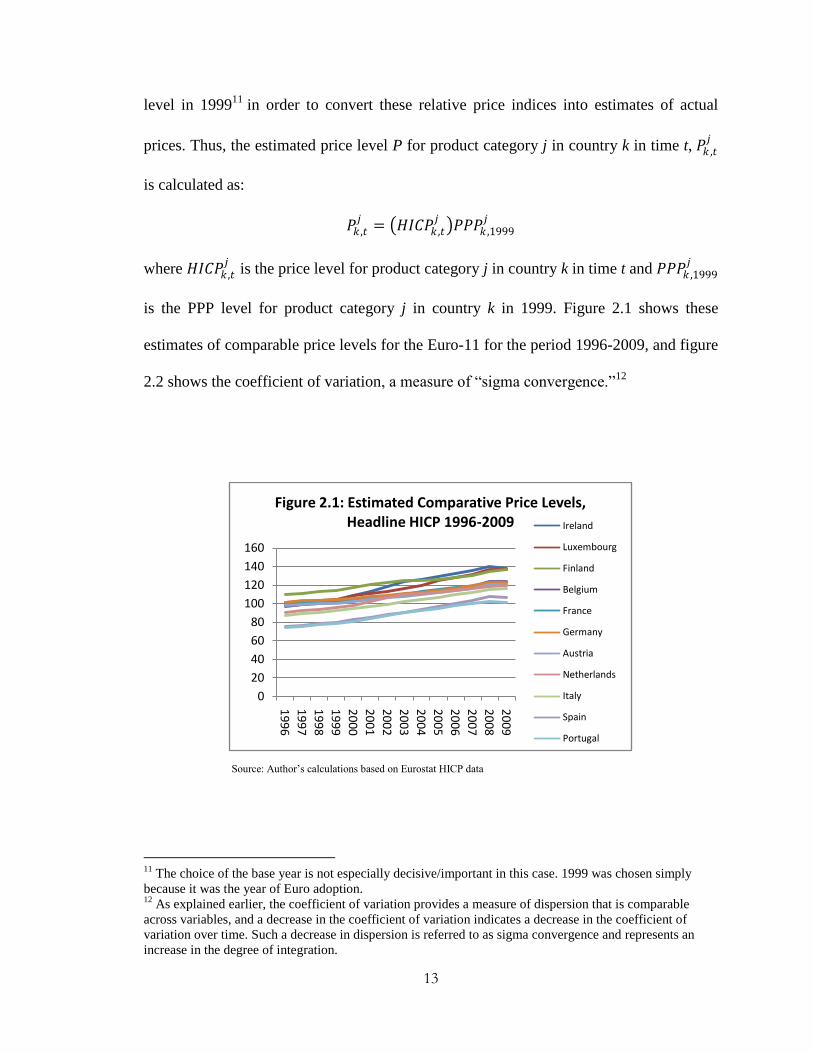
level in 199911
in order to convert these relative price indices into estimates of actual
prices. Thus, the estimated price level P for product category j in country k in time t, 𝑃𝑘 ,𝑡𝑗
is calculated as:
𝑃𝑘 ,𝑡𝑗
= 𝐻𝐼𝐶𝑃𝑘 ,𝑡𝑗
𝑃𝑃𝑃𝑘 ,1999𝑗
where 𝐻𝐼𝐶𝑃𝑘 ,𝑡𝑗
is the price level for product category j in country k in time t and 𝑃𝑃𝑃𝑘 ,1999𝑗
is the PPP level for product category j in country k in 1999. Figure 2.1 shows these
estimates of comparable price levels for the Euro-11 for the period 1996-2009, and figure
2.2 shows the coefficient of variation, a measure of “sigma convergence.”12
Source: Author’s calculations based on Eurostat HICP data
11
The choice of the base year is not especially decisive/important in this case. 1999 was chosen simply
because it was the year of Euro adoption. 12
As explained earlier, the coefficient of variation provides a measure of dispersion that is comparable
across variables, and a decrease in the coefficient of variation indicates a decrease in the coefficient of
variation over time. Such a decrease in dispersion is referred to as sigma convergence and represents an
increase in the degree of integration.
0
20
40
60
80
100
120
140
160
19
96
19
97
19
98
19
99
20
00
20
01
20
02
20
03
20
04
20
05
20
06
20
07
20
08
20
09
Figure 2.1: Estimated Comparative Price Levels, Headline HICP 1996-2009 Ireland
Luxembourg
Finland
Belgium
France
Germany
Austria
Netherlands
Italy
Spain
Portugal

14
Source: Author’s calculations based on Eurostat HICP data
As can be seen above, there exist differentials in comparative price levels on the order of
nearly 40% between the most expensive and cheapest countries in the Eurozone. At the
same time, the price dispersion of the entire sample has declined by approximately 18 %
across the sample period. However, this convergence does not appear to be limited to the
period after the introduction of the Euro; the coefficient of variation declined by 7.6%
between 1996 and 1999, and a further 12% from 1999 to 2009, with an uptick in
dispersion in 1999 and a leveling off and slight decrease post-1999. In addition, the
annual rate of decrease (a crude measure of the speed of convergence) was faster in the
pre-Euro period.
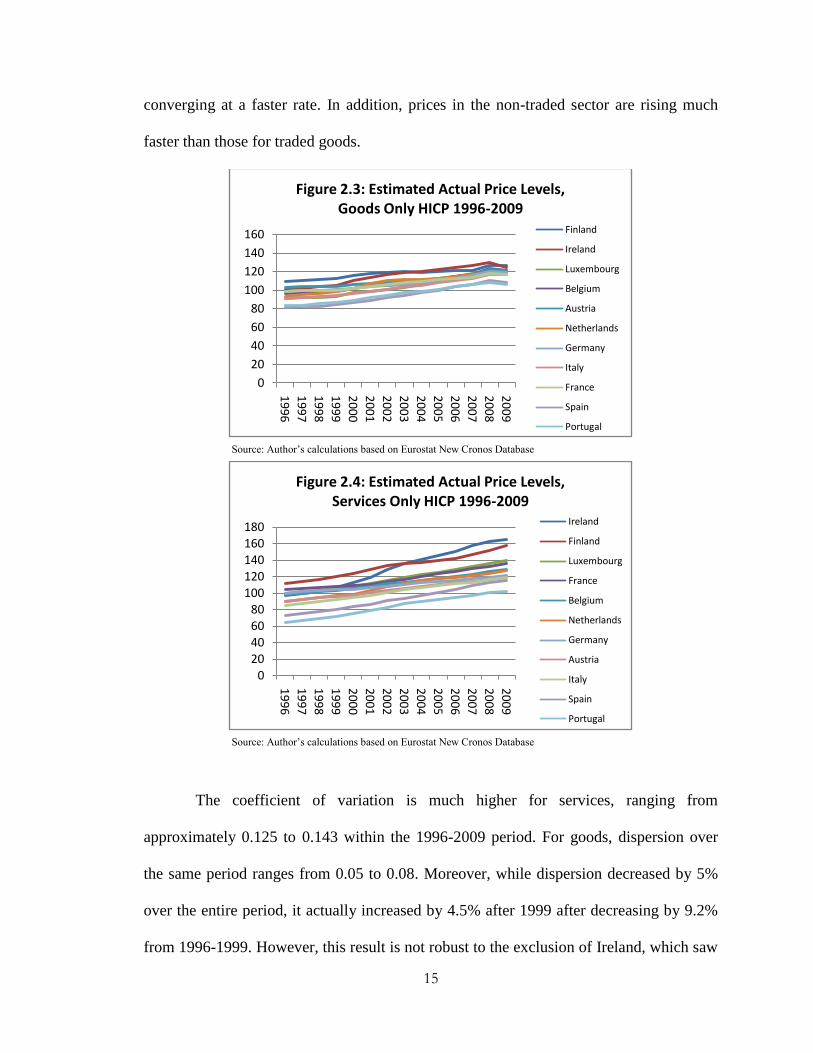
Turning to the differences between goods and services, which proxies for the
differences between traded and non-traded prices, there is a large disparity between the
two categories for the full Euro-11 sample. Figures 2.3 and 2.4 show these estimates of
comparative price levels from 1996-2009 for goods only and services only, respectively.
Although price levels for both categories appear to be rising steadily throughout the
Euro-11 sample, price levels of goods are much more tightly distributed and are
0.08
0.085
0.09
0.095
0.1
0.105
0.11
0.115
19
96
19
97
19
98
19
99
20
00
20
01
20
02
20
03
20
04
20
05
20
06
20
07
20
08
20
09
Figure 2.2: Coefficient of Variation, Headline HICP 1996-2009
15
converging at a faster rate. In addition, prices in the non-traded sector are rising much
faster than those for traded goods.
Source: Author’s calculations based on Eurostat New Cronos Database
Source: Author’s calculations based on Eurostat New Cronos Database
The coefficient of variation is much higher for services, ranging from
approximately 0.125 to 0.143 within the 1996-2009 period. For goods, dispersion over
the same period ranges from 0.05 to 0.08. Moreover, while dispersion decreased by 5%
over the entire period, it actually increased by 4.5% after 1999 after decreasing by 9.2%
from 1996-1999. However, this result is not robust to the exclusion of Ireland, which saw
0
20
40
60
80
100
120
140
160
19
96
19
97
19
98
19
99
20
00
20
01
20
02
20
03
20
04
20
05
20
06
20
07
20
08
20
09
Figure 2.3: Estimated Actual Price Levels, Goods Only HICP 1996-2009
Finland
Ireland
Luxembourg
Belgium
Austria
Netherlands
Germany
Italy
France
Spain
Portugal
020406080
100120140160180
19
96
19
97
19
98
19
99
20
00
20
01
20
02
20
03
20
04
20
05
20
06
20
07
20
08
20
09
Figure 2.4: Estimated Actual Price Levels, Services Only HICP 1996-2009
Ireland
Finland
Luxembourg
France
Belgium
Netherlands
Germany
Austria
Italy
Spain
Portugal

16
a rate of increase far outpacing all countries in the rest of the sample. When Ireland is
excluded, the coefficient of variation decreases by 10% between 1996-1999 period and a
further 15.4% decrease for the ensuing decade, with a total decrease of 24% between
1996 and 2009. These decreases are still smaller than those for goods only, as the
dispersion of goods decreased by 7.1% from 1996 to 1999 and by 35.6% from 1999 to
2009, with a cumulative decrease of 40.14% from 1996 to 2009. Figure 2.5 shows the
dispersion of price levels from 1996 to 2009 for services only for all 11 countries, for
services only excluding the outlier Ireland, and for goods only for the entire sample.
Source: Author’s calculations based on Eurostat New Cronos Database
Turning to the relative dispersion of the individual product categories, figure 2.6 shows
the coefficient of variation for each of the twelve broadest categories of goods in the
HICP. Consistent with the goods/services breakdown provided above, the four groups
with the highest dispersion at the end of the sample period (communications, education,
housing, and health) are categories that mainly comprise non-traded goods, although it is
important to note that alcohol, tobacco, and narcotics showed a high degree of initial
dispersion before decreasing rapidly. Moreover, the remainder of the categories are
0
0.02
0.04
0.06
0.08
0.1
0.12
0.14
0.16
19
96
19
97
19
98
19
99
20
00
20
01
20
02
20
03
20
04
20
05
20
06
20
07
20
08
20
09
Figure 2.5: Coefficient of Variation, Goods Only and Services Only HICP 1996-2009
Services Only, Full Sample
Services Only, Ex. Outlier (IE)
Goods Only, Full Sample

17
tightly distributed around a CV of approximately 0.1 and are predominantly categories
that contain a larger amount of traded goods (with the exception of transportation and
restaurants and hotels).
Source: Author’s calculations based on Eurostat New Cronos Database
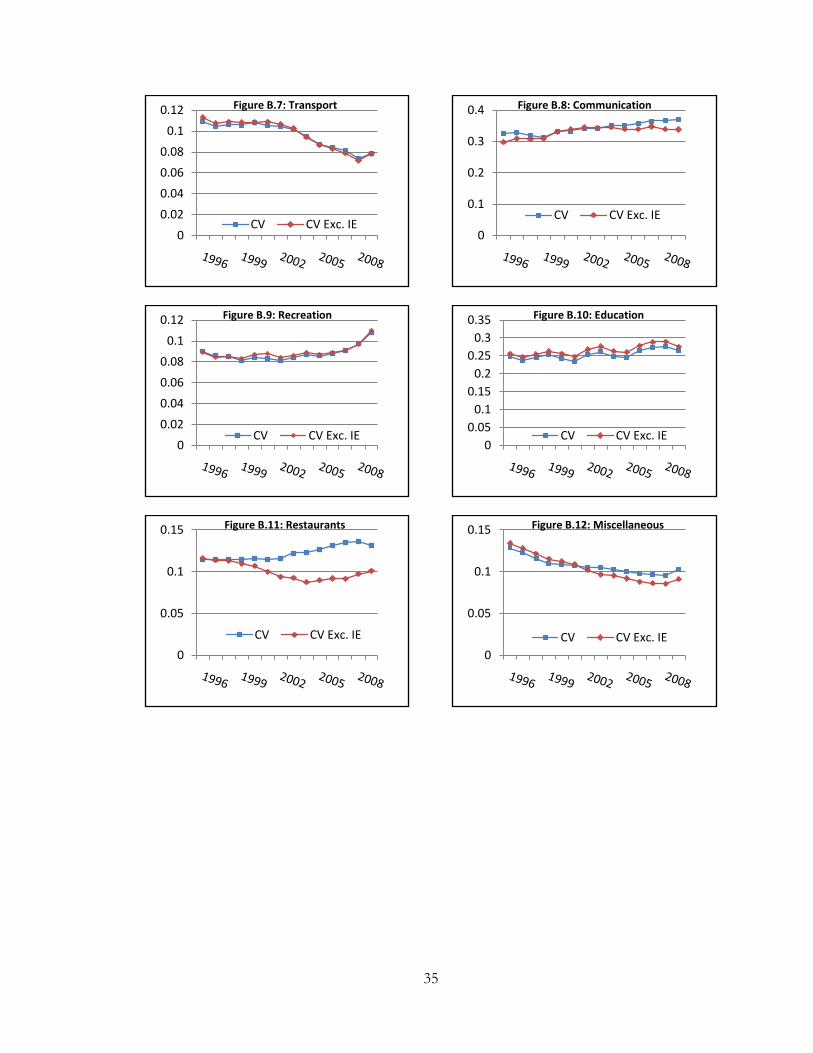
Appendix B offers a more thorough breakdown of the dispersion measures for individual
categories, while Appendix C offers the same for the 1991-2007 7-country sample. For
both samples, the scales shown in the appendices for disaggregated data are set
independently for each category in order to facilitate an easier identification of the
disaggregate trends than can be seen in Figure 2.6. While a detailed accounting of these
trends will not be given here, a few observations are in order. Decreases in dispersion
have been observed for food, alcohol and tobacco, furnishings, transport, and even the
non-tradeable restaurants and hotels category. However, dispersion in clothing and
footwear, health, and recreation was relatively steady until 2008, when dispersion
increased greatly for many categories (again, presumably due to the financial crisis).
Moreover, it is clear that, for reasons that will not be discussed here, the Irish economy
has been a significant enough outlier in many of these disaggregated categories to greatly
0
0.05
0.1
0.15
0.2
0.25
0.3
0.35
0.4
19
96
19
97
19
98
19
99
20
00
20
01
20
02
20
03
20
04
20
05
20
06
20
07
20
08
20
09
Figure 2.6: Coefficient of Variation 1996-1999, Excluding Ireland Communication
Education
Housing
Health
Alc/Tobacco
Recreation
Rest/Hotels
Cloth/Footwear
Food
Misc
Transport
Furnishings
18
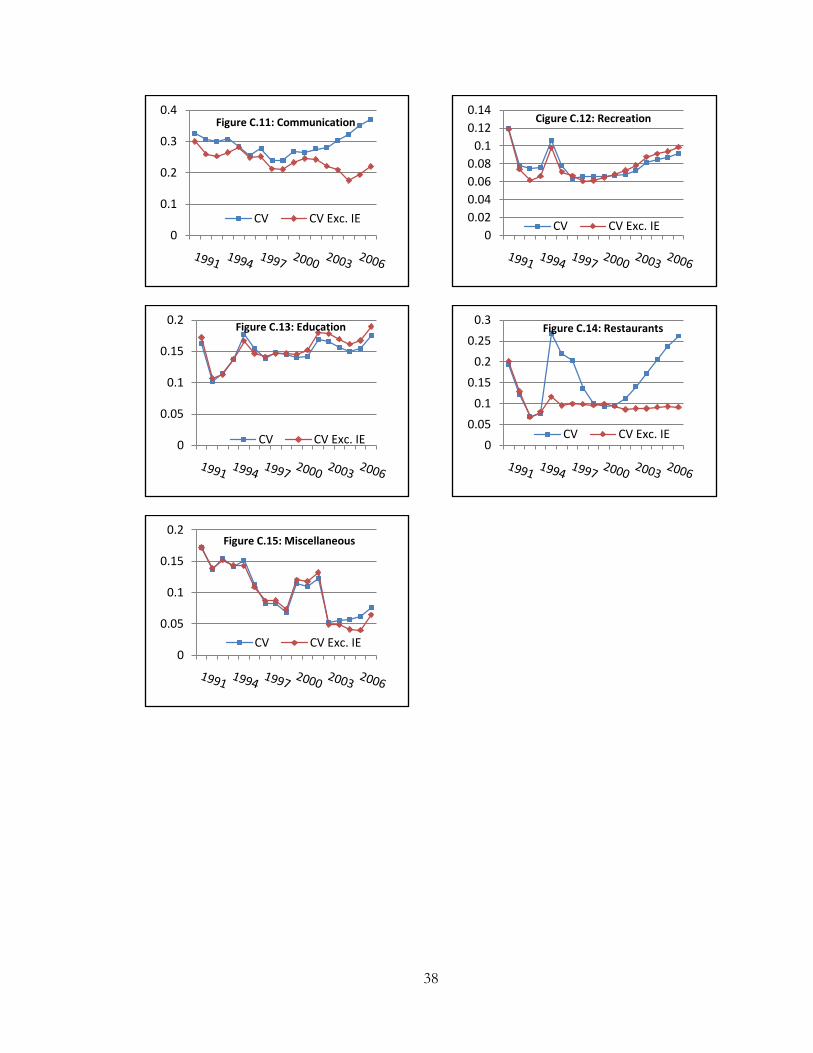
influence the final estimates of convergence. Turning to the longer time-series, after the
shock of German reunification, most categories have seen a fairly steady decrease
through 2007, with an increase in dispersion in the mid-1990’s that peaked in 1999.
Broadly speaking, it is notable that convergence behavior has been observed for many
categories since well before the introduction of the Euro, and prices for many categories
even appear to have diverged since then.
III. A Model of the Inflation-Price Level Nexus
A substantial strand of the literature addresses price adjustment as a crucial factor
in explaining inflation differentials within monetary union (See Egert 2007; Berk and
Swank 2002; Cihak and Holub 2005; and Rogers, Huffbauer, and Wada 2001 for
examples). In this literature, countries with lower price levels are found to exhibit higher
inflation rates, and two mechanisms are proposed to explain this phenomenon. The first
explanation is the previously-mentioned “inflation catch-up”; that is, if price levels are
converging among countries, countries with an initially low price level would see an
inflation during the catching-up phase. The second, and more complicated, mechanism is
the Balassa-Samuelson effect. This mechanism has itself been the focus of a large
literature, and pinpoints developments in labor productivity as key drivers of inflation.
The basic theoretical argument is as follows: poor countries will initially have lower price
levels, and economic integration leads to convergence in productivity for traded goods
(Lommatzsch-Tober 2006) while productivity in the nontraded goods sector converges
much more slowly. Assuming that both sectors pay the same wages, the productivity
increase in the traded sector will spill over into wages in the non-traded sector, thus
19
exerting upward pressure on prices (Lommatzsch-Tober (2006); Hofmann and
Remsperger (2005)). However, the literature on the existence and the magnitude of the
Balassa-Samuelson effect is not conclusive. Most work in this area focuses on the
Central- and Eastern European euro-accession countries instead of the established Euro-
11, with most authors finding that it did have a substantial impact (accounting for 4-5%
inflation each year) as productivity levels converged to Eurozone levels. (Dreger,
Kholodilin, Lommatzsch, Slacalek, and Wozniak 2007; Egert 2003). Egert (2003)
confirms the existence of the B-S effect in Estonia from the period 1993-2002, but has
found it to have decreasing explanatory power over time: while productivity
developments explained inflation of 4-5% in 1994, productivity-driven inflation was only
0.3-1% in 2001. Mihalkek and Klau (2004) found that productivity differentials only
explained 0.2-2% of inflation differentials vis-à-vis the Euro area, which ranged from 2.9%
in Croatia to 13.9% in Hungary.
The Determinants of Inflation Differentials
The model presented here synthesizes the previous work of Honohan and Lane’s
(2004) paper on inflation differentials in the first three years of the common currency and
Egert’s (2007) discussion of inflation rates across the entire European Union. The
empirical analysis extends this framework to the “core” Euro-11 sample, a longer time
period of data, and disaggregated inflation data for goods and services (to proxy for the
differences between the traded and nontraded sectors). I start with Honohan and Lane’s
basic specification of the inflation differential relative to the Eurozone defined as a
function of the lagged price differential; the lagged inflation differential; the differential
in the output gap; and the differential in changes in the standard rate of the Value Added

20
Tax and supplement it with Egert (2007)’s method for accounting for the Balassa-
Samuelson Effect. The theoretical arguments for each of the determinants are given
below.
Lagged Price Differential
The lagged price differential tests the convergence hypothesis as a key
determinant of inflation rates: a negative coefficient on this parameter would suggest that
countries with prices that are low relative to the Eurozone mean are seeing higher
inflation as they catch up to more expensive countries.
Lagged Inflation Differential
This parameter captures the effect of inflation persistence, or inertia in inflation
rates, as a determinant of inflation rates: countries with higher inflation relative to the rest
of the Eurozone in one year should see higher inflation in the next,13
so that the expected
coefficient on this parameter is positive. While a thorough discussion of the causes of
inflation persistence in the Eurozone will not be undertaken here, the literature identifies
several causes of such inflation persistence such as the conduct of monetary policy and
the inflation expectations of price-setters (Batini 2002).
Output Gap
The relationship between the output gap and inflation is well-known and is based
on the simple idea that, if real output is greater than potential real output (i.e. if aggregate
demand is greater than aggregate supply), then the resultant pressure on production costs
(especially wages) will feed into higher prices and, therefore, inflation (Kasriel 2004).
Thus, the expected coefficient of this parameter is positive as well.
13
In addition, I often refer to this as the “structural” dimension of inflation.

21
Changes in the Value Added Tax (VAT) Rate
Although the European Union as a whole is currently undergoing a process of tax
harmonization, the VAT rate is not hypothesized to affect inflation rates in and of itself.
Rather, changes in this parameter can be expected to feed into inflation during the year of
the policy change.
The Balassa-Samuelson Effect
Egert (2007) derives a simple accounting method that accounts for the Balassa-
Samuelson effect, the conceptual theory of which was described above. He begins by
assuming an economy with two sectors, traded and nontraded, and makes a number of
simplifying assumptions:
Prices in the traded sector are assumed to be determined exogenously (i.e. the
Law of One Price holds for traded goods).
Wages in the nontraded sector are connected to the level of productivity in the
traded goods sector.
Wages are assumed to be equal in both sectors.
Prices in the nontraded (“sheltered”) sector depend on wages; that is, on unit labor
cost instead of productivity.
Given these assumptions, the Balassa-Samuelson theory provides an explanatory
framework for the general observation that price levels tend to be lower in poorer
countries: as poorer countries tend to be less productive, the wage rate will be lower
(given the fourth simplifying assumption) so that the price of services (i.e. the nontraded
sector) will be lower, which leads to a lower overall price level. This basic framework
22
also provides an explanation for inflation as a function of productivity growth rate
differentials.
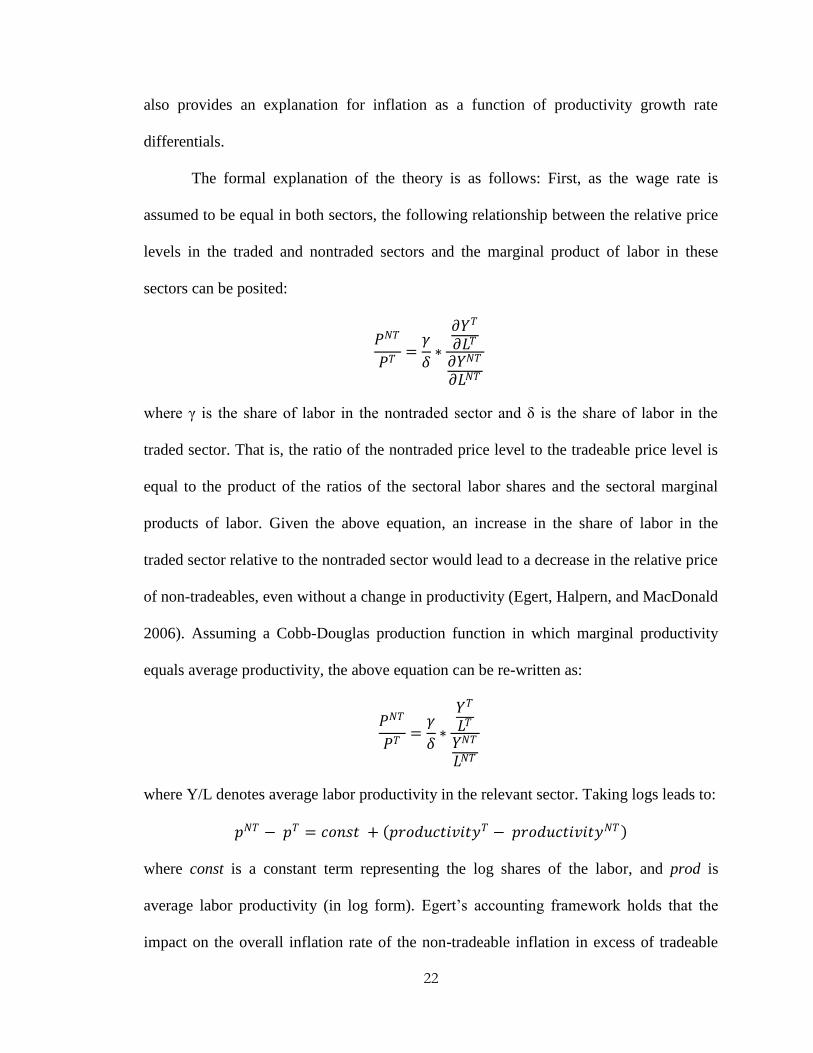
The formal explanation of the theory is as follows: First, as the wage rate is
assumed to be equal in both sectors, the following relationship between the relative price
levels in the traded and nontraded sectors and the marginal product of labor in these
sectors can be posited:
𝑃𝑁𝑇
𝑃𝑇=
𝛾
𝛿∗
𝜕𝑌𝑇
𝜕𝐿𝑇
𝜕𝑌𝑁𝑇
𝜕𝐿𝑁𝑇
where γ is the share of labor in the nontraded sector and δ is the share of labor in the
traded sector. That is, the ratio of the nontraded price level to the tradeable price level is
equal to the product of the ratios of the sectoral labor shares and the sectoral marginal
products of labor. Given the above equation, an increase in the share of labor in the
traded sector relative to the nontraded sector would lead to a decrease in the relative price
of non-tradeables, even without a change in productivity (Egert, Halpern, and MacDonald
2006). Assuming a Cobb-Douglas production function in which marginal productivity
equals average productivity, the above equation can be re-written as:
𝑃𝑁𝑇
𝑃𝑇=
𝛾
𝛿∗
𝑌𝑇
𝐿𝑇
𝑌𝑁𝑇
𝐿𝑁𝑇
where Y/L denotes average labor productivity in the relevant sector. Taking logs leads to:
𝑝𝑁𝑇 − 𝑝𝑇 = 𝑐𝑜𝑛𝑠𝑡 + 𝑝𝑟𝑜𝑑𝑢𝑐𝑡𝑖𝑣𝑖𝑡𝑦𝑇 − 𝑝𝑟𝑜𝑑𝑢𝑐𝑡𝑖𝑣𝑖𝑡𝑦𝑁𝑇
where const is a constant term representing the log shares of the labor, and prod is
average labor productivity (in log form). Egert’s accounting framework holds that the
impact on the overall inflation rate of the non-tradeable inflation in excess of tradeable

23
sector inflation is determined by the share of non-tradeables in the consumption basket,
so that ΔP = (1-α)(ΔpNT
– ΔpT), where α represents the share of tradeable goods in the
consumption basket. An increase in the productivity growth rate differential would cause
a proportional increase in the relative price of non-tradeable goods, so that the amount of
inflation attributable to the Balassa-Samuelson effect is given by ΔPBS
= (1-α)(ΔprodT –
ΔprodNT
) where Δ is the annual change.
IV. Empirical Framework
Given the theory of the determinants of inflation differentials as developed above,
the empirical analysis allows for an assessment of the contributions of three major
categories of determinants of the inflation rate: convergence factors; idiosyncratic and
cyclical factors; and a factor that, if significant, will indicate that there is a significant
structural dimension to inflation. Table 4.1 presents these determinants and their expected
effects on Eurozone inflation differentials:
Table 4.1: Determinants of Inflation Differentials
Explanatory Variable Expected Effect on Inflation
Differential
Convergence Factors
Lagged Price Differential -
Productivity Growth Rate
Differential +
Idiosyncratic and
Cyclical Factors
Output Gap +
Change in VAT +
Persistence/Structural
Factors
Lagged Inflation Differential +

24
Econometric Specification
The general econometric model based on the determinants of inflation
differentials discussed above is given by:
𝜋𝑘𝑡 − 𝜋𝐸𝐴𝑡 = 𝛽0 + 𝛽1 𝑃𝑘 ,𝑡−1 − 𝑃𝐸𝐴,𝑡−1
+ 𝛽2([1 − 𝛼](∆ 𝑃𝑟𝑜𝑑𝑘 ,𝑡𝑇 − 𝑃𝑟𝑜𝑑𝑘 ,𝑡
𝑁𝑇)
− 1 − 𝛼 ∆ 𝑃𝑟𝑜𝑑𝐸𝐴,𝑡𝑇 − 𝑃𝑟𝑜𝑑𝐸𝐴,𝑡
𝑁𝑇 ) + 𝛽3 𝜋𝑘 ,𝑡−1 − 𝜋𝐸𝐴,𝑡−1
+ 𝛽4 𝑂𝑢𝑡𝑝𝑢𝑡𝐺𝑎𝑝𝑘 ,𝑡 − 𝑂𝑢𝑡𝑝𝑢𝑡𝐺𝑎𝑝𝐸𝐴,𝑡 + 𝛽5 Δ𝑉𝐴𝑇𝑘 ,𝑡 − Δ𝑉𝐴𝑇𝐸𝐴,𝑡 + 휀
where the k subscript indicates the individual countries; the EA subscript indicates the
Eurozone; the subscript t indicates time period t, the superscript T indicates the traded
sector; and the superscript NT indicates the nontraded sector. The dependent variable
𝜋𝑘𝑡 − 𝜋𝐸𝐴𝑡 is the inflation differential, defined as the difference in inflation from the
prevailing Eurozone inflation rate. 𝑃𝑘 ,𝑡−1 − 𝑃𝐸𝐴,𝑡−1 is the price level differential from the
overall Eurozone price level. The price level measure in this specification is an index
based upon the comparative price level measure constructed in section II in which the
ratio of the domestic price level for each country to the Eurozone mean was multiplied by
100. This construction allows for a simple interpretation of the coefficient estimates that
will be presented: a value in this index of 120, for example, would mean that the country
has a price level 20% above the Eurozone mean. Therefore, the coefficient estimates for
this parameter will represent the impact on the inflation rate of a 1% increase in the price
level relative to the Eurozone mean. The [ 1 − 𝛼](∆ 𝑃𝑟𝑜𝑑𝑘,𝑡𝑇 − 𝑃𝑟𝑜𝑑𝑘 ,𝑡
𝑁𝑇) − 1 −
𝛼 ∆ 𝑃𝑟𝑜𝑑𝐸𝑈 ,𝑡𝑇 − 𝑃𝑟𝑜𝑑𝐸𝑈 ,𝑡
𝑁𝑇 parameter captures the effect of cross-country differences in
the sectoral productivity growth rate differential on inflation differentials. 𝜋𝑘 ,𝑡−1 −
𝜋𝐸𝐴,𝑡−1 is simply the lagged inflation differential, while 𝑂𝑢𝑡𝑝𝑢𝑡𝐺𝑎𝑝𝑘 ,𝑡 − 𝑂𝑢𝑡𝑝𝑢𝑡𝐺𝑎𝑝𝐸𝐴,𝑡 is
25
the differential in the output gap, where the output gap is defined as the difference
between real output and potential real output, denominated as a percentage of total GDP.
Δ𝑉𝐴𝑇𝑘 ,𝑡 − Δ𝑉𝐴𝑇𝐸𝐴,𝑡 is the differential in changes in the standard VAT rate, where the
change in the VAT rate is defined as the standard rate (in percent) minus the previous
year’s rate (for more details on the data, see Appendix A).
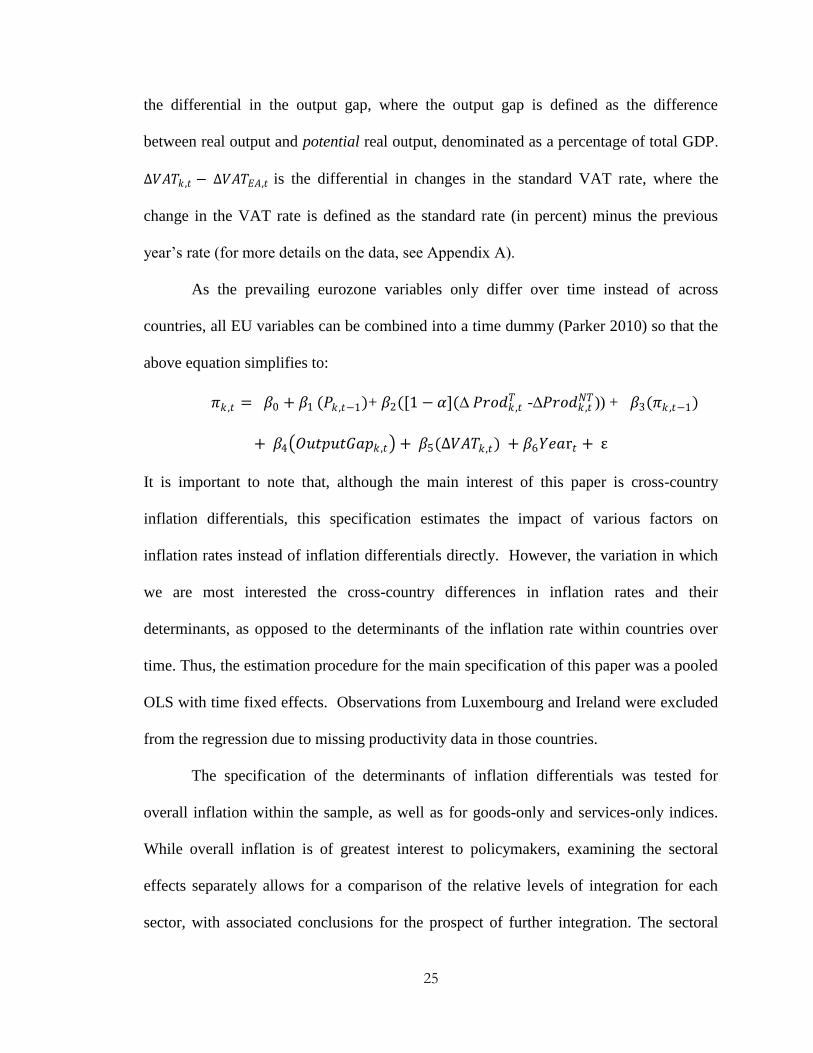
As the prevailing eurozone variables only differ over time instead of across
countries, all EU variables can be combined into a time dummy (Parker 2010) so that the
above equation simplifies to:
𝜋𝑘 ,𝑡 = 𝛽0 + 𝛽1 (𝑃𝑘 ,𝑡−1)+ 𝛽2([1 − 𝛼](∆ 𝑃𝑟𝑜𝑑𝑘 ,𝑡𝑇 -∆𝑃𝑟𝑜𝑑𝑘 ,𝑡
𝑁𝑇)) + 𝛽3(𝜋𝑘 ,𝑡−1)
+ 𝛽4 𝑂𝑢𝑡𝑝𝑢𝑡𝐺𝑎𝑝𝑘 ,𝑡 + 𝛽5(∆𝑉𝐴𝑇𝑘 ,𝑡) + 𝛽6𝑌𝑒𝑎r𝑡 + ε
It is important to note that, although the main interest of this paper is cross-country
inflation differentials, this specification estimates the impact of various factors on
inflation rates instead of inflation differentials directly. However, the variation in which
we are most interested the cross-country differences in inflation rates and their
determinants, as opposed to the determinants of the inflation rate within countries over
time. Thus, the estimation procedure for the main specification of this paper was a pooled
OLS with time fixed effects. Observations from Luxembourg and Ireland were excluded
from the regression due to missing productivity data in those countries.
The specification of the determinants of inflation differentials was tested for
overall inflation within the sample, as well as for goods-only and services-only indices.
While overall inflation is of greatest interest to policymakers, examining the sectoral
effects separately allows for a comparison of the relative levels of integration for each
sector, with associated conclusions for the prospect of further integration. The sectoral
26
regressions are run on the lagged parameters for that sample; that is, goods only inflation
was regressed on the lagged price level and the lagged inflation rate of the goods only
index, as opposed to lags for baseline inflation. As the Balassa-Samuelson effect is
assumed to work on the overall inflation rate through its effect on services prices, the
term representing the weight of services in the consumption basket is removed for the
sectoral-level regressions so that the impact of productivity growth differentials on
services-sector inflation can be interpreted directly.
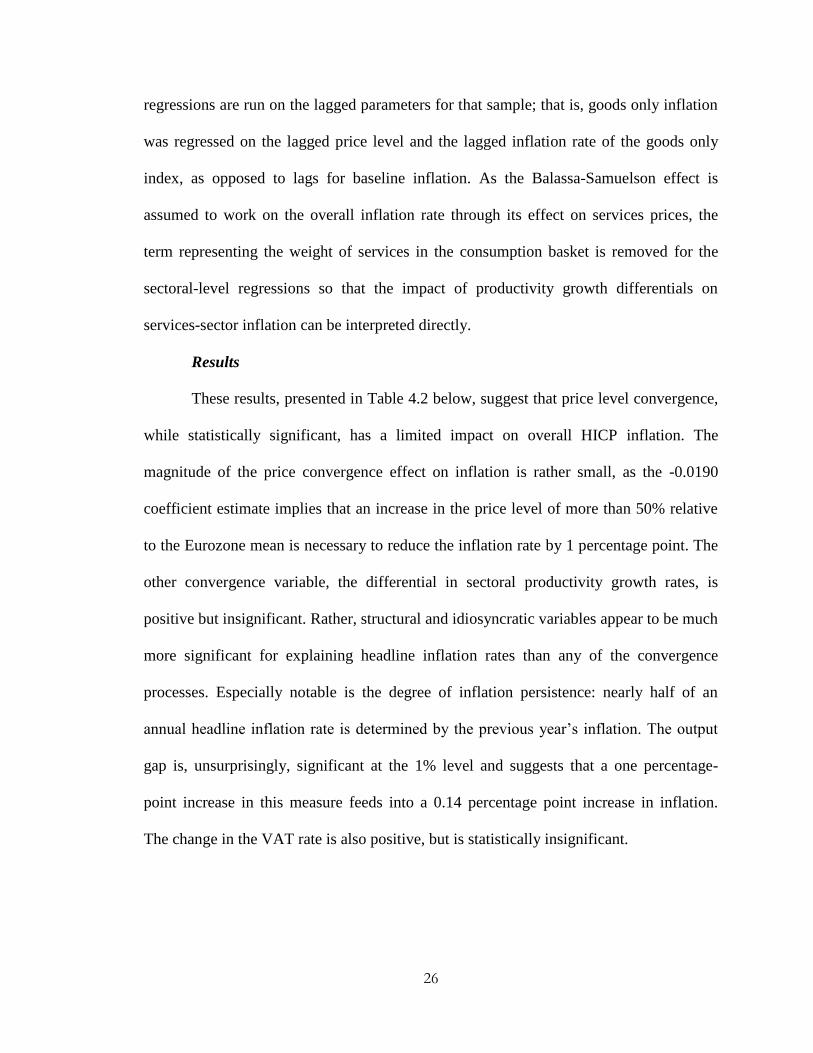
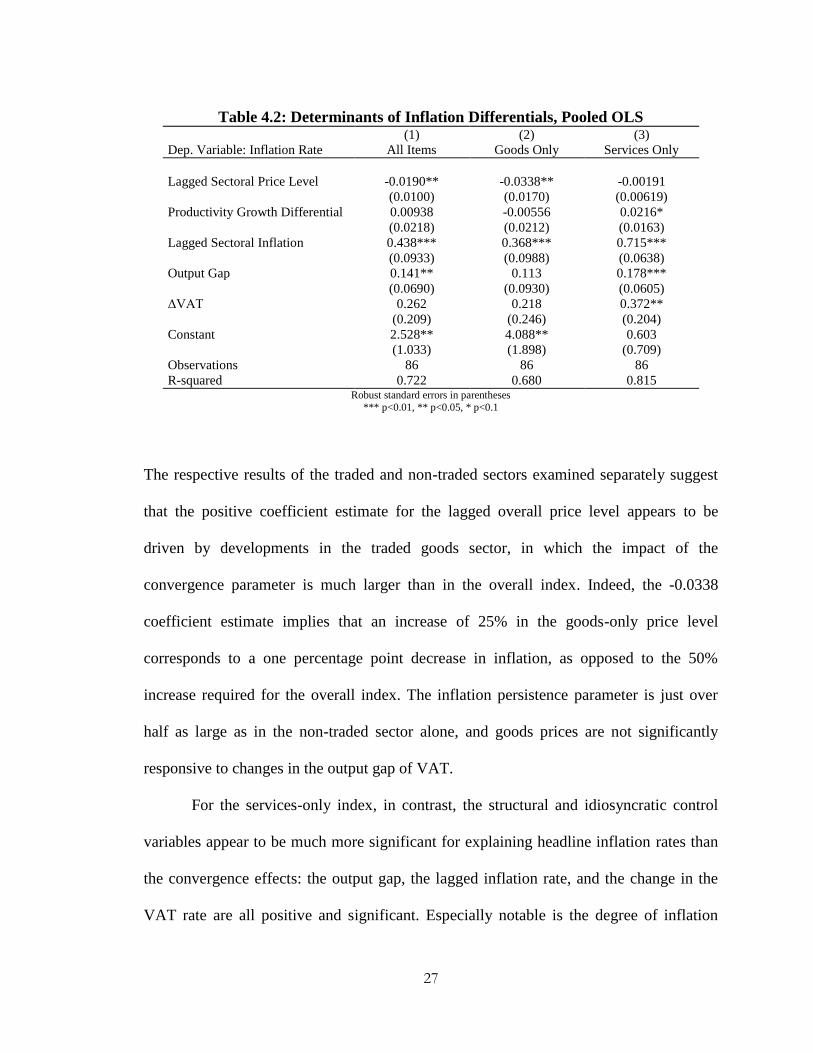
Results
These results, presented in Table 4.2 below, suggest that price level convergence,
while statistically significant, has a limited impact on overall HICP inflation. The
magnitude of the price convergence effect on inflation is rather small, as the -0.0190
coefficient estimate implies that an increase in the price level of more than 50% relative
to the Eurozone mean is necessary to reduce the inflation rate by 1 percentage point. The
other convergence variable, the differential in sectoral productivity growth rates, is
positive but insignificant. Rather, structural and idiosyncratic variables appear to be much
more significant for explaining headline inflation rates than any of the convergence
processes. Especially notable is the degree of inflation persistence: nearly half of an
annual headline inflation rate is determined by the previous year’s inflation. The output
gap is, unsurprisingly, significant at the 1% level and suggests that a one percentage-
point increase in this measure feeds into a 0.14 percentage point increase in inflation.
The change in the VAT rate is also positive, but is statistically insignificant.
27
The respective results of the traded and non-traded sectors examined separately suggest
that the positive coefficient estimate for the lagged overall price level appears to be
driven by developments in the traded goods sector, in which the impact of the
convergence parameter is much larger than in the overall index. Indeed, the -0.0338
coefficient estimate implies that an increase of 25% in the goods-only price level
corresponds to a one percentage point decrease in inflation, as opposed to the 50%
increase required for the overall index. The inflation persistence parameter is just over
half as large as in the non-traded sector alone, and goods prices are not significantly
responsive to changes in the output gap of VAT.
For the services-only index, in contrast, the structural and idiosyncratic control
variables appear to be much more significant for explaining headline inflation rates than
the convergence effects: the output gap, the lagged inflation rate, and the change in the
VAT rate are all positive and significant. Especially notable is the degree of inflation
Table 4.2: Determinants of Inflation Differentials, Pooled OLS (1) (2) (3)
Dep. Variable: Inflation Rate All Items Goods Only Services Only
Lagged Sectoral Price Level -0.0190** -0.0338** -0.00191
(0.0100) (0.0170) (0.00619)
Productivity Growth Differential 0.00938 -0.00556 0.0216*
(0.0218) (0.0212) (0.0163)
Lagged Sectoral Inflation 0.438*** 0.368*** 0.715***
(0.0933) (0.0988) (0.0638)
Output Gap 0.141** 0.113 0.178***
(0.0690) (0.0930) (0.0605)
ΔVAT 0.262 0.218 0.372**
(0.209) (0.246) (0.204)
Constant 2.528** 4.088** 0.603
(1.033) (1.898) (0.709)
Observations 86 86 86
R-squared 0.722 0.680 0.815 Robust standard errors in parentheses
*** p<0.01, ** p<0.05, * p<0.1
28
persistence, as each percentage point of inflation is responsible for more than 0.7 points
of inflation in the following year. The positive and significant coefficient estimate of the
productivity growth differential between the goods and services sectors offers some
evidence that relative productivity growth is indeed reflected in services prices, although
the magnitude of the effect is small: a 1% increase in the productivity growth rate
differential is reflected in a 0.02 percentage point increase in inflation. Considering that
this differential averages approximately 2.25% across the sample, with a maximum of 17%
seen in France in 2004, the effect of this parameter on inflation in the services sector is
negligible.
V. Conclusion
Beginning with the observation that the Euro-11 countries have seen substantial
heterogeneity in inflation rates even since the adoption of the common currency in 1999,
this paper has attempted to identify the causes of these inflation differentials within a
convergence framework. A general discussion of comparative price levels across
countries reveals that, while prices are converging, dispersion remains much higher in the
nontraded goods sector and that convergence has been occurring since well before the
introduction of the Euro. In order to test the hypothesis that the convergence process is
responsible for much of the differences in inflation rates, a model was developed that
explains inflation differentials as a function of price level differentials, inflation
persistence, productivity growth rates, and idiosyncratic shocks. While price convergence
is shown to be a statistically significant determinant of inflation rates, the overall
magnitude of the effect is limited. Instead, inflation rates are predominantly determined
by the degree of structural inflation and idiosyncratic shocks. Moreover, the effects of the
29
respective determinants differ between the traded and non-traded sectors: while inflation
in both categories appears to be governed largely by inflation persistence, the
convergence parameter is only significant for the traded goods sector. On the other hand,
services inflation is highly structural and responsive to idiosyncratic shocks. In addition,
while the Balassa-Samuelson effect is insignificant for the overall sample, the results
presented offer tentative evidence that its basic theoretical assumption holds: sectoral
productivity growth rate differentials do appear to exert upward pressure on price in the
nontraded sector, although the overall magnitude of the effect is limited.
Given the small magnitude of the effect of the convergence parameter on overall
inflation, its insignificance for the nontraded sector, the overall persistence of inflation,
and the role of the business cycle, inflation differentials in the Eurozone do not appear to
be a mere function of convergence. Thus, the results of this study suggest that, in the
absence of convergence in business cycles, the determinants of inflation persistence, or a
significant increase in the rate of price convergence, these misalignments in the real
exchange rate and the real interest rate will likely be a challenge to European
policymakers for some time to come. In addition, while this study has primarily focused
on the determinants of inflation differentials, the overall dispersion in prices remains
significant (especially for the nontrade sector), despite the convergence process. This
dispersion is primarily due to large differentials in per-capita output and productivity, and
these differentials have either been diverging or converging quite slowly (Tsagkanos,
Botsaris, and Koumanakos 2006). While a thorough discussion of these issues is beyond
the scope of this paper, this dispersion in the underlying “real” factors explaining price

30
levels along with the non-convergence factors explaining inflation differentials would be
another area with which to supplement the research presented here.

31
Appendix A: Data
Country Samples: The sample for the baseline analysis of the years 1996-2009 consisted
of the original 11 Eurozone members: Austria, Belgium, Finland, France, Germany,
Ireland, Italy, Luxembourg, the Netherlands, Portugal, and Spain. For the longer time
series (1991-2007), price level data was only available for Austria, Finland, France,
Germany, Ireland, Italy, and the Netherlands.
Price level data: All price level data is extracted from Eurostat’s New Cronos database.
For the 1996-2009 sample, the Harmonized Indices of Consumer Prices (HICPs) are used.
The HICPs are Eurostat’s official price level measure and are Laspeyres-type price
indices. Thus, instead of being a “cost-of-living” index, they are broadly intended to
illustrate the development of a fixed basket of goods over time. However, a caveat to this
definition must be noted. While the list of goods included in the basket is the same across
all countries, no uniform market basket exists due to cross-country differences in
consumption patterns among the included goods. The exact nature of certain goods and
services may differ across countries as well. Within-country weights of each good must
be revised every seven years, but are in practice often updated more frequently in order to
account for the introduction of new goods and services and for significant changes in
consumption patterns (European Commission 2004). The European Commission (2004)
identifies several examples of the differences between the HICPs and the national CPIs:
For subsidized healthcare and education, the HICP includes the net price after
reimbursements to the consumer, while national CPIs often exclude these
purchases from their indices or only account for the gross price.

32
The HICPs exclude imputed prices for owner-occupied housing, while many
national CPIs often include these measures.
For the 7-country subsample, the implicit consumption deflator for each of the twelve
categories is used. As these data are not compiled from direct observations of actual
prices, they are an exceptionally broad index and may be especially vulnerable to
aggregation bias; that is, the overall trends observed in the price indices may be masking
a much greater degree of heterogeneity in the developments of actual prices. To present
an extreme and simplistic example, if the consumption basket for a given country
consisted of two apples and two oranges, and the price of apples increases by 50% and
that of oranges decreases by 50% the overall basket would remain unchanged.
As previously noted in the introduction, disaggregated price indices were
compiled at the single-digit product category in addition to the overall price index, and
many of the twelve disaggregated categories contain both goods and services within each
sample. Special aggregate indices for goods only and services only, as well as the
requisite PPP data, were also available, so the 1996-2009 sample includes both of these
special aggregates. The twelve included disaggregated categories are as follows: food and
non-alcoholic beverages; alcoholic beverages, tobacco and narcotics; clothing and
footwear; housing, water, electricity, gas and other fuels; furnishings, household
equipment and routine maintenance of the house; health; transport; communications;
recreation and culture; education; restaurants and hotels; and miscellaneous goods and
services. With the exception of the food and nonalcoholic beverages and alcoholic
beverages, tobacco, and narcotics categories, which are goods only, and the services-only

33
restaurants and hotels and education categories, these levels of disaggregation contain
both goods and services elements.
Output Gap: Real GDP and output gap data are from the IMF’s World Economic
Outlook Database, October 2009 edition.
Productivity: Aggregate and sectoral-level productivity measures were constructed from
raw Eurostat data. Nominal euro-denominated figures for output in the total economy and
in the manufacturing, construction, and services sectors were converted into 2000 prices
using their respective price deflators, and the real prices divided by their PPP value in
order to make the output data comparable across countries. Each of these output measures
in PPP terms was divided by the sectoral employment, and construction and services
were combined to proxy for productivity in the non-tradeables sector.
Value Added Tax Rates: VAT rate data is compiled from the January 2010 version of
the European Commission’s VAT Rates Applied in the Member States of the European
Union publication. This document provides the current VAT rates that are applied for
each category of VAT rates in the Member States (i.e. the standard VAT rate, the reduced
VAT rate, and a handful of special reduced or increased rate). It also includes information
on which category of VAT rates are applied to very specific goods, but does not address
the evolution of which rates have been applied to different goods over time. Thus, only
the standard rate is included here.

34
Appendix B: Price Level Dispersion, Euro-11, 1996-2009
Measure of Dispersion: Coefficient of Variation
Source for all data: author’s calculations based on Eurostat New Cronos database
0
0.02
0.04
0.06
0.08
0.1 Figure B.1: Food
CV CV Exc. IE0
0.1
0.2
0.3
0.4 Figure B.2: Alcohol and Tobacco
CV CV Exc. IE
0
0.05
0.1
0.15
0.2 Figure B.3: Clothing and Footwear
CV CV Exc. IE
0.15
0.16
0.17
0.18
0.19 Figure B.4: Housing
CV CV Exc. IE
0
0.02
0.04
0.06
0.08
0.1
0.12 Figure B.5: Furnishings
CV CV Exc. IE0
0.05
0.1
0.15
0.2 Figure B.6: Health
CV CV Exc. IE
35
0
0.02
0.04
0.06
0.08
0.1
0.12 Figure B.7: Transport
CV CV Exc. IE0
0.1
0.2
0.3
0.4 Figure B.8: Communication
CV CV Exc. IE
0
0.02
0.04
0.06
0.08
0.1
0.12 Figure B.9: Recreation
CV CV Exc. IE0
0.05
0.1
0.15
0.2
0.25
0.3
0.35 Figure B.10: Education
CV CV Exc. IE
0
0.05
0.1
0.15 Figure B.11: Restaurants
CV CV Exc. IE
0
0.05
0.1
0.15 Figure B.12: Miscellaneous
CV CV Exc. IE

36
Appendix C: Price Level Dispersion, 7-Country Subsample,
1991-2007
Measure of Dispersion: Coefficient of Variation
Source for all data: author’s calculations based on Eurostat New Cronos database
0
0.05
0.1
0.15
0.2
0.25
0.3
0.35
0.4
19
91
19
92
19
93
19
94
19
95
19
96
19
97
19
98
19
99
20
00
20
01
20
02
20
03
20
04
20
05
20
06
20
07
Figure C.1: All Product Categories
Food
Communications
Rest/Hotels
Alc/Tobacoo
Health
Education
Cloth/Footwear
Housing
Recreation
Transport
Misc.
0
0.05
0.1
0.15
0.2
0.25
0.3
0.35
0.41
99
11
99
21
99
31
99
41
99
51
99
61
99
71
99
81
99
92
00
02
00
12
00
22
00
32
00
42
00
52
00
62
00
7
Figure C.2: All Product Categories, Excluding Ireland
Communications
Education
Health
Recreation
Housing
Rest/Hotels
Transport
Alc/Tobacoo
Food
Misc.
Cloth/Footwear
Furnishings

37
0
0.05
0.1
0.15
0.2Figure C.3: All Goods and Services
CV CV Exc. IE
0
0.1
0.2
0.3
0.4Figure C.4: Food
CV CV Exc. IE
0
0.1
0.2
0.3
0.4Figure C.5: Alcohol and Tobacco
CV CV Exc. IE
0
0.05
0.1
0.15Figure C.6: Clothing and Footwear
CV CV Exc. IE
0
0.05
0.1
0.15
0.2Figure C.7: Housing
CV CV Exc. IE
0
0.02
0.04
0.06
0.08
0.1
0.12Figure C.8: Furnishings
CV CV Exc. IE
0
0.05
0.1
0.15
0.2
0.25Figure C.9: Health
CV CV Exc. IE0
0.05
0.1
0.15Figure C.10: Transport
CV CV Exc. IE
38
0
0.1
0.2
0.3
0.4Figure C.11: Communication
CV CV Exc. IE
0
0.02
0.04
0.06
0.08
0.1
0.12
0.14Cigure C.12: Recreation
CV CV Exc. IE
0
0.05
0.1
0.15
0.2Figure C.13: Education
CV CV Exc. IE 0
0.05
0.1
0.15
0.2
0.25
0.3Figure C.14: Restaurants
CV CV Exc. IE
0
0.05
0.1
0.15
0.2Figure C.15: Miscellaneous
CV CV Exc. IE

39
Bibliography
Berk, Jan Marc and Job Swank (2002). “Regional Price Adjustment in a Monetary
Union”. Tinbergen Institute Discussion Papers 02-077/2.
Batini, Nicoletta (2002). “Euro Area Inflation Persistence”. European Central Bank
Working Paper Series No. 201.
Botasso, Anna and Alessandro Sembenelli (2001). “Market power, productivity and the
EU Single Market Program: Evidence from a panel of Italian firms.” European Economic
Review 45 pp. 167-186.
Cihak, Martin and Tomas Holub (2005). “Price Convergence in EU-Accession Countries:
Evidence from the International Comparison”. Economie Internationale 102, p. 5
DeRoose, Servaas, Sven Langedijk, and Werner Roeger (2004). “Reviewing Adjustment
Dynamics in EMU: From Overheating to Overcooling”. European Commission
Directorate-General for Economic and Financial Affairs Economics Paper no. 198.
Dreger, Christian, Konstantin Kholodin, Kirsten Lommatzsch, Jiri Slacalek and
Przemyslaw Wozniak, 2007. “Price Convergence in the Enlarged Internal Market.”
Disucssion Papers of DIW Berlin 730.
Egert, Balasz, Laszlo Halpern, and Ronald MacDonald (2006). “Equilibrium Exchange
rates in Transition Economies: Taking Stock of the Issues”. Journal of Economic Surveys
vol. 20, no.2.
Egert, Balazs (2004), “Nominal and Real Convergence in Estonia: The Balassa-
Samuelson (dis)connection”. William Davidson Institute Working Paper Series 556.
---------------(2007), “Real Convergence, Price Level Convergence, and Inflation in
Europe”. Bruegel Working Paper, 2007/2.
Engel, Charles and John H. Rogers (2004). “European product market integration after
the euro.” Economic Policy 19:39 (July), pp. 347-384 (July).
European Commission Taxation and Customs Union (2010). “VAT Rates Applied in the
Member States of the European Union.” European Commission (2010).
Faber, Riemer and Ad C.J. Stokman (2009). “A Short History of Price Level
Convergence in Europe.” Journal of Money, Credit, and Banking, vol. 41, no. 2-3
(March-April).
Fischer, Christoph (2007). “An assessment of trends in international price
competitiveness among EMU countries”. Deutsche Bundesbank Discussion Paper series
1: Economic Studies no. 08/2007.
40
Hofmann, Boris and Hermann Remsperger (2005). “Inflation Differentials among the
Euro area countries: Potential Causes and Consequences”. Journal of Asian Economics
16., pp. 403-419.
Honohan, Patrick and Philip R. Lane (2004). “Exchange Rates and Inflation under EMU:
An Update”. The Institute for International Integration Studies Discussion Paper Series,
No. 31.
Kasriel, Paul (2004). “The Well-Known Relationship Between the Ouput Gap and
Inflation.” The Northern Trust Company Economic Research Department, Positive
Economic Commentary, April 16.
Klau, Marc and San Sau Fun (2006). “The new BIS effective exchange rate indices”. BIS
Quarterly Review, Bank for International Settlements (March).
Lommatzsch, Kirsten and Silke Tober (2006). „Euro-area Inflation: does the Balassa-
Samuelson Effect Matter?”. International Economics and Economic Policy, Springer, vol.
3(2), pp. 105-136, November.
Mihaljek, Dubravko and Marc Klau (2004). “The Balassa-Samuelson Effect in Central
Europe: A Disaggregated Analysis”. Comparative Economic Studies 46, pp. 63-94.
Nitsch, Volker (2003). “Have a Break, Have A…National Currency: When do Monetary
Unions Fall Apart?”. CESifo Working Paper No. 1113.
Parker, Jeffrey (2010). “Models for Pooled and Panel Data.” Class notes from “Theory
and Practice of Econometrics”, Reed College, Spring 2010.
http://academic.reed.edu/economics/parker/s10/312/index.html (retrieved April 15, 2010).
Rogers, John H. (2007) . “Monetary Union, price level convergence, and inflation: How
close is Europe to the USA?”. Journal of Monetary Economics 54 (2007), pp.785-796.
Rogers, John H., Gary C. Hufbauer, and Erika Wada (2001). “Price Level
Convergence and Inflation in Europe”. Working Paper 01-1, Institute for
International Economics.
Tsagkanos, Athanasios G., Charalampos A. Botsaris, and Evagelos Pet. Koumanakos
(2004). “Exploring Trends of Per-Capita GDP Among EU-15 Members”. International
Research Journal of Finance and Economics Issue 4, pp. 144-153.
Wolszczak-Derlacz, Joanna (2008). “Price convergence in the EU – an aggregate and
disaggregate approach”. International Economics and Economic Policy, vol. 5(1), pp.
25-47.