Inflation and Deflation - Harvey Mudd Collegepages.hmc.edu/evans/e53l5.pdf · · 2014-03-28% vs...
35
Price Price Behavior, Inflation and Behavior, Inflation and Deflation Deflation Problems and solutions Problems and solutions © 2014 Gary R. Evans. May b e used only for non-profit educational purposes without permission of the author.
Transcript of Inflation and Deflation - Harvey Mudd Collegepages.hmc.edu/evans/e53l5.pdf · · 2014-03-28% vs...

Price Price Behavior, Inflation and Behavior, Inflation and DeflationDeflation
Problems and solutionsProblems and solutions
© 2014 Gary R. Evans. May b e used only for non-profit educational purposes without permission of the author.

What is inflation?What is inflation?What is inflation?What is inflation?
•• A general increase in the price level as A general increase in the price level as measured by some index like the CPI ..measured by some index like the CPI ..yy•• 00--2% Traditional/healthy2% Traditional/healthy•• 33--6% Moderate6% Moderate33 6% Moderate6% Moderate•• 77--15% High15% High•• 15+% Runaway15+% Runaway15+% Runaway15+% Runaway•• 50+% Hyper50+% Hyper--inflationinflation

The German inflation of the 1920sThe German inflation of the 1920sDate $1 equals in Marks
J l 1914 4 2July 1914 4.2July 1919 14.0J l 1921 39 5July 1921 39.5July 1922 483.2J l 1923 353 412July 1923 353,412Aug 1923 4,620,455
S t 1923 98 869 000Sept 1923 98,869,000Oct 1923 25,260,208,000N 1923 4 200 000 000 000Nov 1923 4,200,000,000,000

21 April 1910 10,000 Mark Note21 April 1910 10,000 Mark Notep ,p ,

6 February 1920 10 Mark Note6 February 1920 10 Mark Noteyy

The back (10 Mark Note)The back (10 Mark Note)( )( )

1 March 1920 1 Mark Note1 March 1920 1 Mark Note
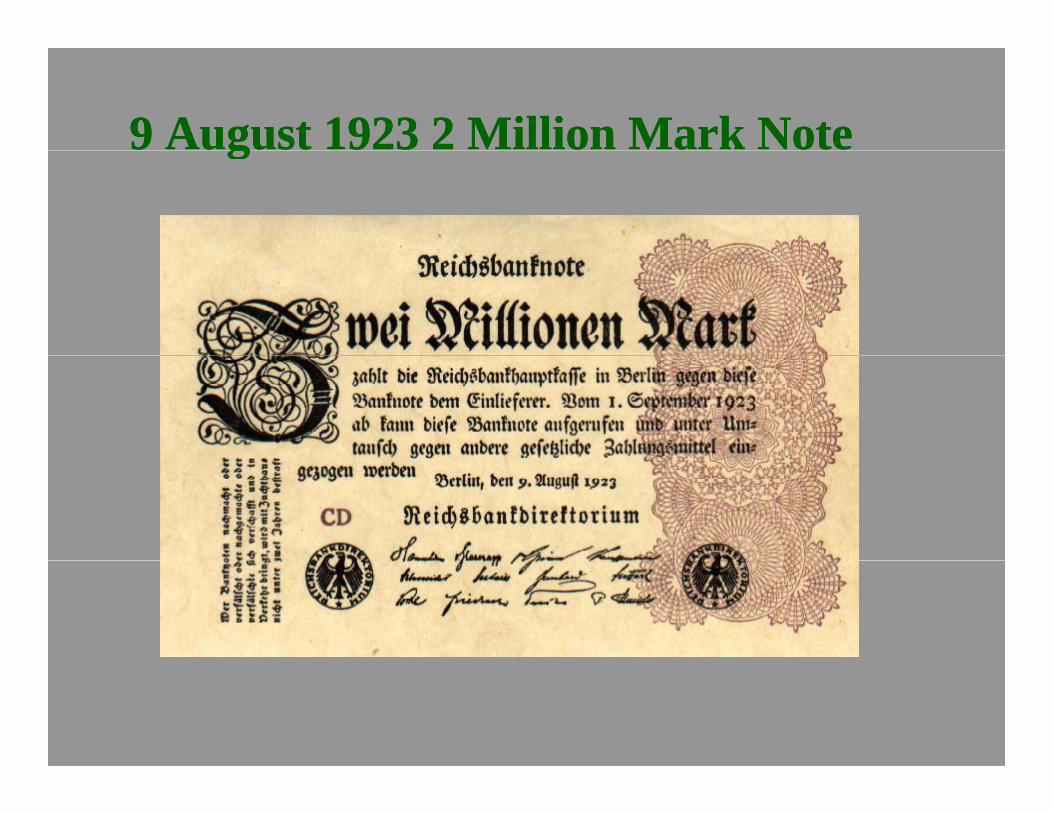
9 August 1923 2 Million Mark Note9 August 1923 2 Million Mark Notegg

1 Sept. 1923 50 Million Mark Note1 Sept. 1923 50 Million Mark Notepp

The Back (50 Million Mark Note)The Back (50 Million Mark Note)( )( )

According the the 2008 CIA Factbook, Zi b b ith l t tZimbabwe, with an unemployment rate of 80% and with 20% of the adult population identified as HIX-positive, had an inflation rate estimated to be 100,000% per year in 2007.

In 2014: In 2014:
from International Business Times, Feb 14, 2014, by Patricia Rey Mallen.
... also Ukraine, Venezuela, Brazil, Turkey, South Africa.

How inflation is measuredHow inflation is measuredHow inflation is measured ..How inflation is measured ..
•• Consumer Price Index (CPI) Consumer Price Index (CPI) ( )( )–– Measures “cost of living” for consumersMeasures “cost of living” for consumers
•• Producer Price Index (PPI)Producer Price Index (PPI)Producer Price Index (PPI) Producer Price Index (PPI) –– Measures input costs for manufacturersMeasures input costs for manufacturers
•• Implicit Price Deflator (IPD)Implicit Price Deflator (IPD)•• Implicit Price Deflator (IPD)Implicit Price Deflator (IPD)–– Used to adjust GDP to real GDP Used to adjust GDP to real GDP
•• Employee Cost IndexEmployee Cost Index–– Used by FRS as early inflation indicator Used by FRS as early inflation indicator

CPI Inflation Rate: 1960CPI Inflation Rate: 1960--20132013Average: 4%
14.00
16.00Annual % change
Double-digitAcceptable
10.00
12.00Double-digit hyperinflation
Acceptable level (about 2.5%)
G li
6.00
8.00Green lines: BC troughs
2.00
4.00
-2.00
0.00
1960 1965 1970 1975 1980 1985 1990 1995 2000 2005 2010
CPI for urban consumers, U.S. city average, all items,NSA. Source: Bureau of Labor Statistics

The The CPICPI•• Prices collected monthly and bimonthly in 85 Prices collected monthly and bimonthly in 85
urban areas from about 45,000 housing units urban areas from about 45,000 housing units and 20,000 retail and 20,000 retail establishments for 80.000 establishments for 80.000 itemsitemsP l i i d l h llP l i i d l h ll•• Personal visits and telephone callsPersonal visits and telephone calls
•• Base year Base year (average of 1982(average of 1982--8484) set to 100) set to 100•• “Market basket” weights are based upon “Market basket” weights are based upon
consumer surveys conducted consumer surveys conducted 20092009--2010, 2010, 7,000 7,000 families keeping diaries of everything theyfamilies keeping diaries of everything theyfamilies keeping diaries of everything they families keeping diaries of everything they bought for 2 bought for 2 weeks, another 7,000 in a more weeks, another 7,000 in a more general survey covering 3 months.general survey covering 3 months.general survey covering 3 months.general survey covering 3 months.
•• The index is a weighted sum.The index is a weighted sum.
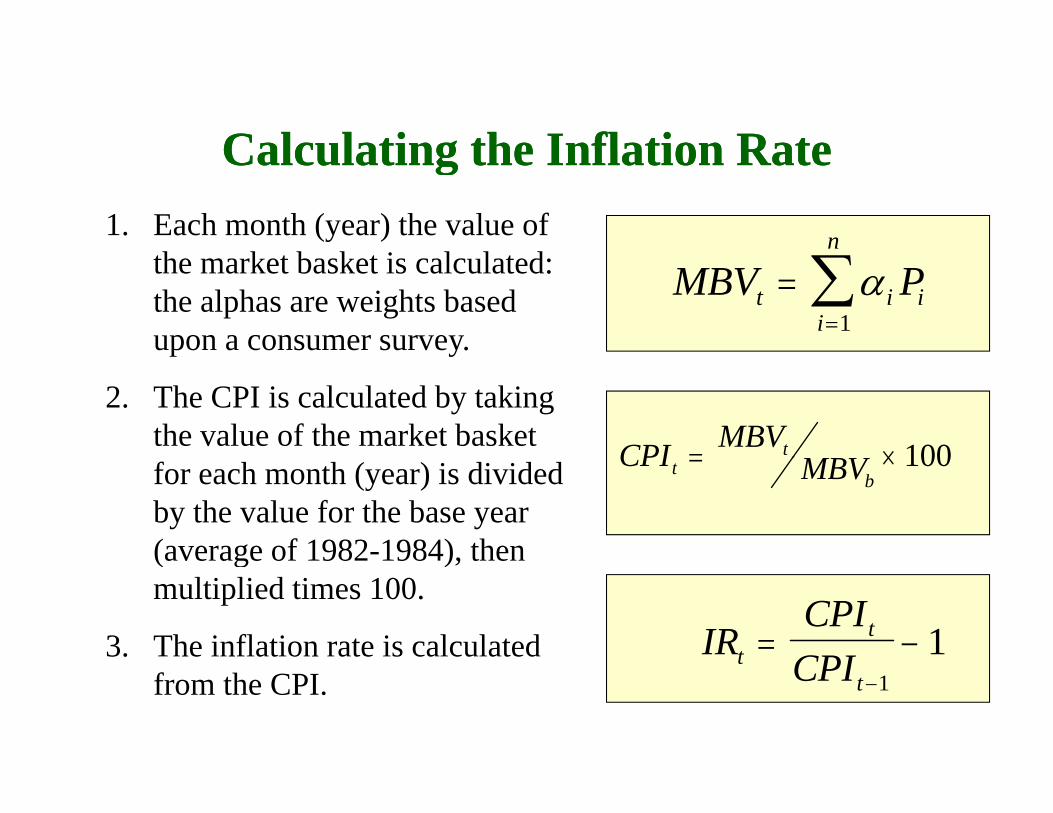
Calculating the Inflation RateCalculating the Inflation RateCalculating the Inflation RateCalculating the Inflation Rate
n1. Each month (year) the value of h k b k i l l d MBV Pt i i
i
1
the market basket is calculated: the alphas are weights based upon a consumer survey.
CPI MBVMBV
t 100
p y
2. The CPI is calculated by taking the value of the market basket CPI MBVt
b 100for each month (year) is divided
by the value for the base year (average of 1982-1984), then
IRCPI
CPItt 1
(average of 1982 1984), then multiplied times 100.
3. The inflation rate is calculated CPItt1from the CPI.

Jan Jan 2014 2014 CPI category weights and valuesCPI category weights and values
The weights are market basket weights Note
Consumer Price Index for All Urban ConsumersCPI-U NSA, January 2014
weights. Note Medical. Other than tobacco, the highest disaggregated
Category Weight Index RateAll times 100 233.9 1.6%Food and Beverage 13.9 238.9 1.1%Housing 32.0 266.8 2.6% disaggregated
category is college tuition.
Current data can
Apparel 3.4 124.3 -0.3%Transportation excl fuel 5.7 280.7 1.2% Gasoline 5.0 286.6 0.1%Medical Care 5.8 459.6 2.5%
Current data can always be found by clicking on the most recent CPI news
Recreation 5.8 115.3 0.4%Education 3.2 228.3 3.0% Tuition, other fees 1.8 636.0 3.5%Communication 3.8 82.6 -2.0%E S i 3 7 197 9 4 5% recent CPI news
release on the front page of the BLS website.
Energy Services 3.7 197.9 4.5%
$0.4281982-84 = 100Purchasing power of the dollar
S BLS E i N R l 2/10/2014 T bl 1 2 d 3
Note: Not all categories are shown, there are small amounts of overlap, and weights do not sum to 100.
Source: BLS Economic News Release, 2/10/2014 Tables 1, 2, and 3.
Bananas: 0.088

The CPI (all items) less food and energy (Core Rate)The CPI (all items) less food and energy (Core Rate)Jan 2007 Jan 2007 -- Jan Jan 2014, 2014, monthly growth rate, NSAmonthly growth rate, NSA
1 50
2.00
,, y g ,y g ,
The core rate excludes food,
% monthly% monthly
0.8%, if sustained, would
0.50
1.00
1.50 excludes food, and energy The core rate is far less
, ,equal 10% inflation annually
-0.50
0.00volatile. Energy and food costs
-1.50
-1.00explain why All Items is higher, then l
... right while the stock market was crashing
-2.00Jan MaySep Jan MaySep Jan MaySep Jan MaySep Jan MaySep Jan MaySep Jan MaySep Jan
All Items Less Food and Energy
lower.
2007200720082008 20102010
2014201420122012
Source: Bureau of Labor Statistics
20082008 20102010 20122012

The Producer Price Index (PPI)The Producer Price Index (PPI)( )( )The Producer Price Index is a family of indexes that measures the average change over time in the selling prices received by domestic producers of
d d i PPI i h f h i f hgoods and services. PPIs measure price change from the perspective of the seller.Over 10,000 PPIs for individual products and groups of products are released
h h i l di fi i h d d di i d i l deach month, including finished goods, commodities, and raw materials and food. PPIs are available for the products of virtually every industry in the mining and manufacturing sectors of the U.S. economy.
Currently, most PPIs have an index base set at 1982 = 100.
The PPI is assembled by and very comprehensive data are available from the U.S. Department of Labor Bureau of Labor Statistics:p f f
http://bls.gov
Note: Original source for this slide, which is mostly quoted, but since modified, was lost. It probably came from the BLS.

Finished Goods and Commodity PPIFinished Goods and Commodity PPIvs CPIvs CPI--U monthly @ annual ratesU monthly @ annual rates 20072007--20142014 NSANSA%
15 0
20.0
vs. CPIvs. CPI U, monthly @ annual rates, U, monthly @ annual rates, 20072007 2014 2014 NSANSA%
10.0
15.0
0.0
5.0 ??
-10.0
-5.0 Note the high volatility of the PPI measures compared to CPI. CPI sometimes acts like a weighted moving average. Monthly numbers of PPI at
-20.0
-15.0
g yrelease are too volatile to have much meaning. But over time ...
2011
Jan MaySep Jan MaySep Jan MaySep Jan MaySep Jan MaySep Jan MaySep Jan MaySep Jan
CPI-U PPI Finished Goods PPI CommoditiesSource: BLS
2007 2014
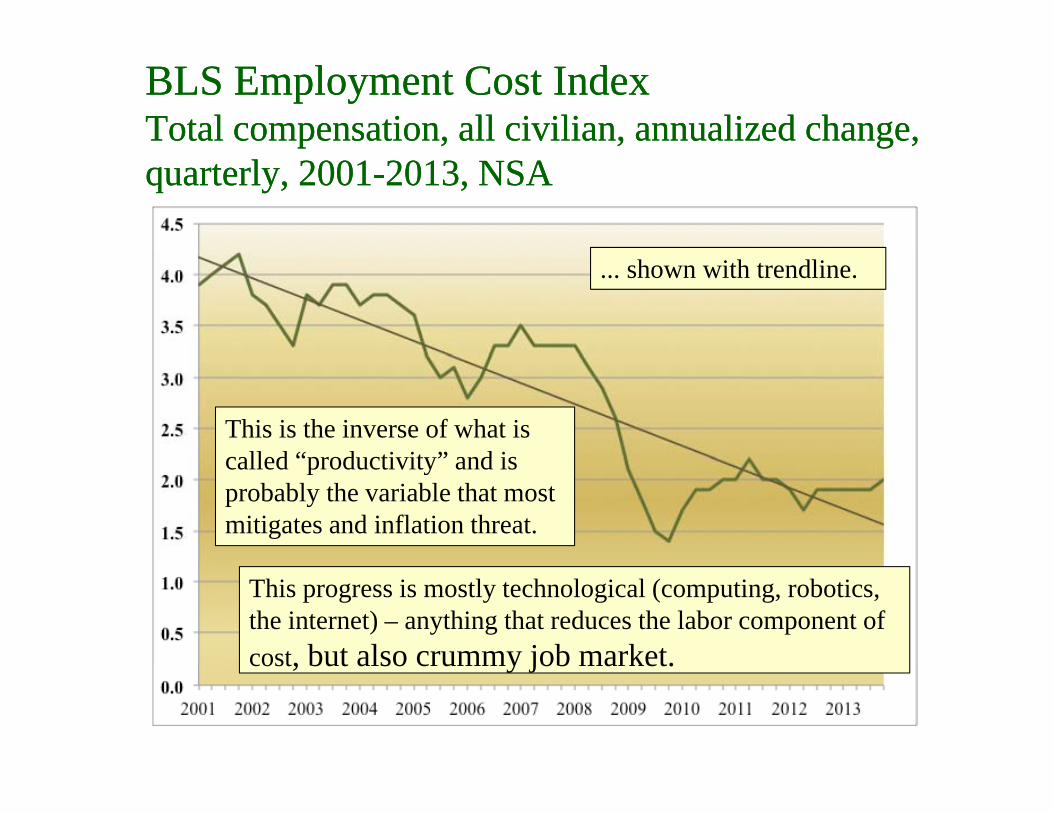
BLS Employment Cost IndexBLS Employment Cost IndexTotal compensation, all civilian, annualized change, Total compensation, all civilian, annualized change, quarterly, 2001quarterly, 2001--2013, NSA2013, NSA
... shown with trendline.
This is the inverse of what is called “productivity” and iscalled “productivity” and is probably the variable that most mitigates and inflation threat.
This progress is mostly technological (computing, robotics, the internet) – anything that reduces the labor component of cost, but also crummy job market.cost, but also crummy job market.

Costs of inflationCosts of inflationCosts of inflationCosts of inflation•• Distributes income and wealth unfairlyDistributes income and wealth unfairly
–– To: owners of real assets, borrowers, those who understand To: owners of real assets, borrowers, those who understand the systemthe system
–– From: renters, savers & lenders, semiFrom: renters, savers & lenders, semi--skilled and unskilledskilled and unskilled
•• Affects financial marketsAffects financial markets–– raises interest ratesraises interest rates
reduces the value of debtreduces the value of debt–– reduces the value of debtreduces the value of debt
•• Tends to lower real incomeTends to lower real income–– nominal income doesn’t keep upnominal income doesn’t keep up
•• Interjects yet more Interjects yet more uncertaintyuncertainty–– which retards economic growthwhich retards economic growth
T d t b lfT d t b lf didi•• Tends to be selfTends to be self--compoundingcompounding

Costs of DeflationCosts of Deflation
•• Effects during Great DepressionEffects during Great DepressionMade loans impossible to payMade loans impossible to pay–– Made loans impossible to payMade loans impossible to pay
–– Destroyed banking structureDestroyed banking structureR lt d i 1933 R lt B ki H lidR lt d i 1933 R lt B ki H lid–– Resulted in 1933 Roosevelt Banking HolidayResulted in 1933 Roosevelt Banking Holiday
•• Generally undermines any economy with Generally undermines any economy with f i if i ilarge levels of debt contracts in nominal large levels of debt contracts in nominal
(nor adjusted for prices) amounts(nor adjusted for prices) amounts•• Today a problem in commodity exporting Today a problem in commodity exporting
nationsnations–– Especially raw materials exportsEspecially raw materials exports

Deflation during the Great DepressionDeflation during the Great Depressiong pg pCPI annualized monthly rates, 1920 to 1940CPI annualized monthly rates, 1920 to 1940
Post WWI The Great Depression, although we were an agricultural economy then.Source: BLS

Theories of inflation (a review)Theories of inflation (a review)Theories of inflation (a review) Theories of inflation (a review)
•• Aggregate Supply/Aggregate DemandAggregate Supply/Aggregate Demand–– Inflation can be demand pull or cost pushInflation can be demand pull or cost pushInflation can be demand pull or cost pushInflation can be demand pull or cost push–– Impact of variables depends upon contextImpact of variables depends upon context–– Inflation tends to get worse automaticallyInflation tends to get worse automaticallyInflation tends to get worse automaticallyInflation tends to get worse automatically
•• LoanableLoanable funds modelfunds modelI fl ti d i t t t l t dI fl ti d i t t t l t d–– Inflation and interest rates are correlatedInflation and interest rates are correlated
–– To cure inflation, interest rates must riseTo cure inflation, interest rates must rise


Inflation Inflation and and Recession!Recession!How to we explain this?
8
10
Inflation
p
4
6
GDP growthIPD i fl ti
Inflation andRecession! .. and again!
2
0
2 IPD inflation
-4
-2
70 72 74 76 78 80 82 84


A tiA ti i fl ti li ii fl ti li iAntiAnti--inflation policiesinflation policies
•• Monetary policy approachMonetary policy approach•• Monetary policy approachMonetary policy approach–– Tighten up credit conditionsTighten up credit conditions
R i i t t tR i i t t t–– Raise interest ratesRaise interest rates•• Price controls don’t workPrice controls don’t work
–– Causes acute shortagesCauses acute shortages–– Encourages black marketEncourages black market–– Easy to circumvent in nonEasy to circumvent in non--commodity commodity
economy with “new product design”economy with “new product design”

The last FRS tightening 2005The last FRS tightening 2005--20062006g gg gContinued through 2006.
rSF2004
SF2005The FRS tightens while …
g
… consumer borrowing continues to grow stronglyr2004
r2005
a
b
DF2005
continues to grow stronglya
Volume of Credit
DF2004
The last FRS anti-inflation policy was Volume of Creditp yduring this period. When QE3 stops, this might happen again. To what effect??

Quantitative Easing Programs Quantitative Easing Programs (2007(2007--2013)2013)U i ll d titi i (QE1 QE3)Using programs called quantitive easing (QE1 - QE3), the FRS is severely cutting target interest rates to ease a credit crunch and prevent a serious recession.
SF1
SF2rrGovt expansion
DF1,2,3
Govt expansion
Consumer and business demand for credit fell, and lenders curtailed
Private collapse
certain types of lending (like mortgages), but U.S. Government demand for credit has hugely risen (to finance stimulus package). Hence DF1,2,3.

2014: Tapering of QE32014: Tapering of QE3QE3 purchases $45b U.S. Treasuries and $40b mortgages monthly. The first taper reduces that by $5b each monthly, the second taper by another 5 ...
SF2014
SF2013rQualify this ...
rGovt expansion??
DF1,2,3
Govt expansion
The government demand for funds is falling sharply (smaller deficits)
Private collapse
and consumer and business demand for funds is stable but could grow some or shrink some, so the effect upon interest rates is unclear,

Federal Funds Target RateFederal Funds Target Rate
6.00
Federal Funds Target RatesMarch 2003 - February 2013 Actual target
in Feb 2013 is 0.0 - 0.25%
4.00
5.00
anti-inflation
anti-recession and aversion of
2.00
3.00credit crisis
Nowhere l ft t
0.00
1.00
left to go here.
a general tightening after June 25 2003 to forestall inflation and curb low… a general tightening after June 25, 2003, to forestall inflation and curb low interest speculation, followed by recent severe reductions to combat credit crisis and prevent recession, finally dropping rate to 0-0.25% in Dec 2008.