Inferring Unusual Crowd Events From Mobile Phone Call ...
34
© 2015 IBM Corporation Inferring Unusual Crowd Events From Mobile Phone Call Detail Records Yuxiao Dong, Fabio Pinelli, Yiannis Gkoufas, Zubair Nabi, Francesco Calabrese, Nitesh V. Chawla IBM Research, Dublin, Ireland University of Notre Dame, USA
Transcript of Inferring Unusual Crowd Events From Mobile Phone Call ...
© 2015 IBM Corporation
Inferring Unusual Crowd Events From Mobile Phone Call Detail Records
Yuxiao Dong, Fabio Pinelli, Yiannis Gkoufas, Zubair Nabi, Francesco Calabrese, Nitesh V. Chawla
IBM Research, Dublin, Ireland University of Notre Dame, USA
© 2015 IBM Corporation 1. http://bansteadathletic.co.uk/?p=32 2. https://www.spriza.com/contest/213 3. http://gaymarriage.procon.org/
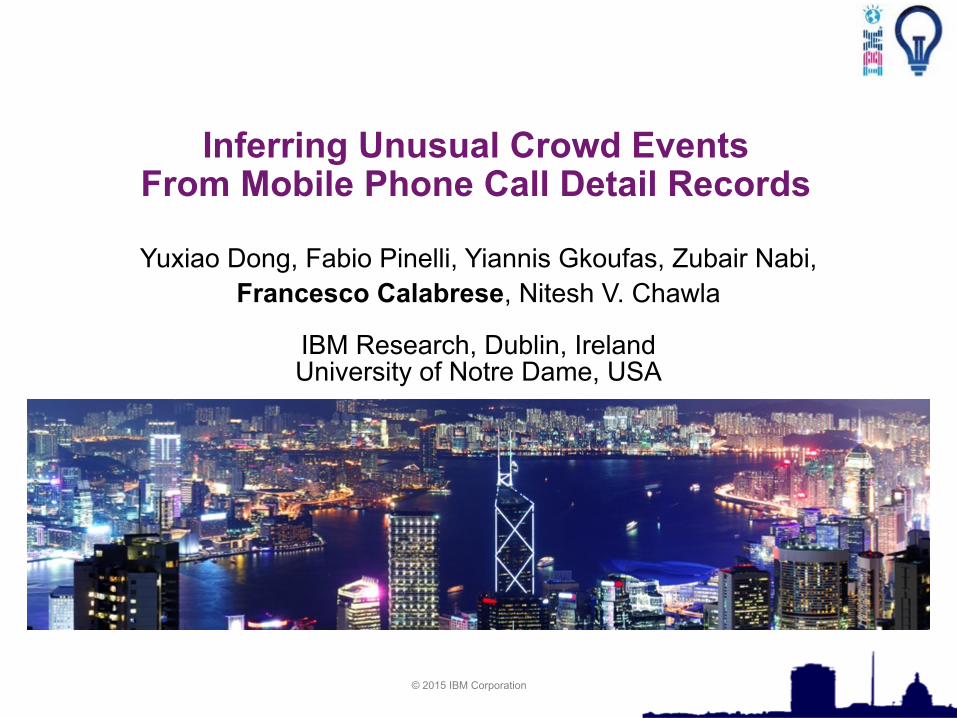
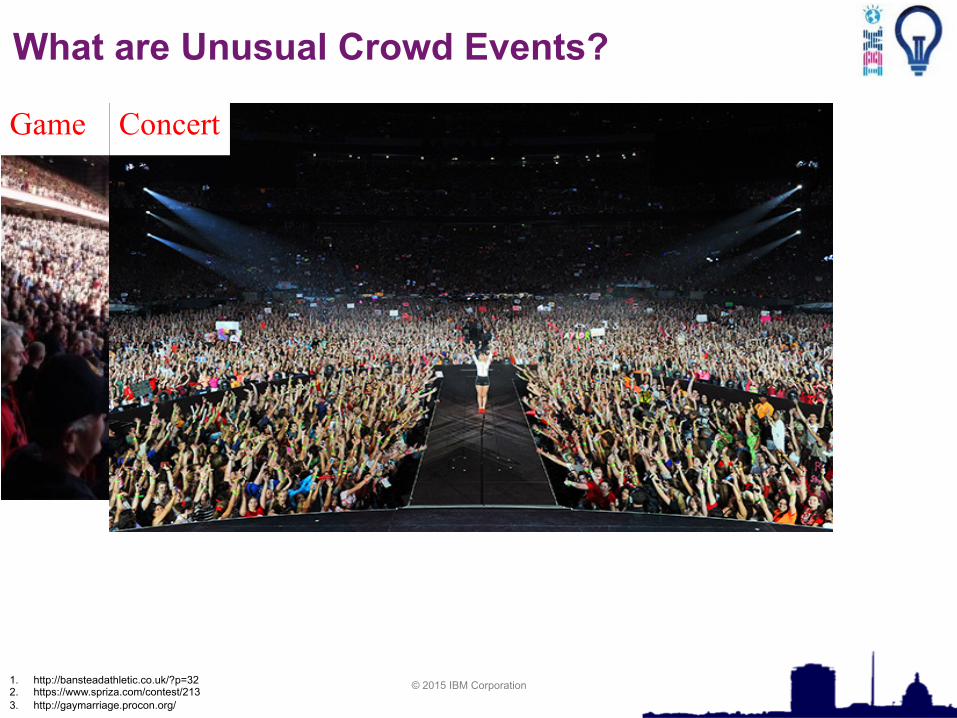
What are Unusual Crowd Events?
Game
© 2015 IBM Corporation 1. http://bansteadathletic.co.uk/?p=32 2. https://www.spriza.com/contest/213 3. http://gaymarriage.procon.org/
What are Unusual Crowd Events?
Game Concert
© 2015 IBM Corporation 1. http://bansteadathletic.co.uk/?p=32 2. https://www.spriza.com/contest/213 3. http://gaymarriage.procon.org/
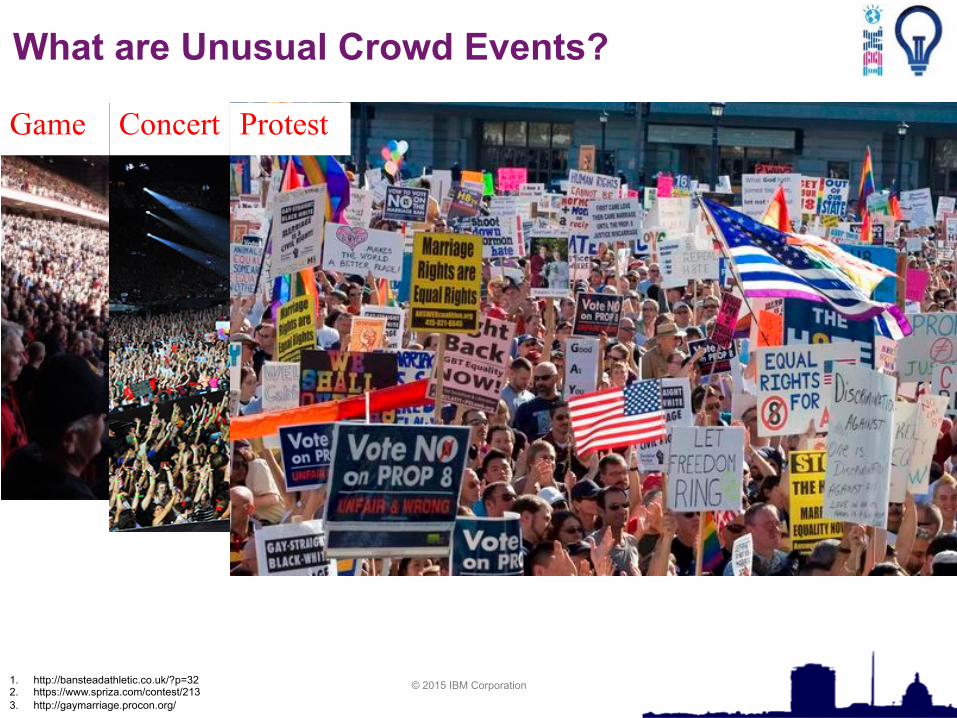
What are Unusual Crowd Events?
Game Concert Protest
© 2015 IBM Corporation 1. http://bansteadathletic.co.uk/?p=32 2. https://www.spriza.com/contest/213 3. http://gaymarriage.procon.org/
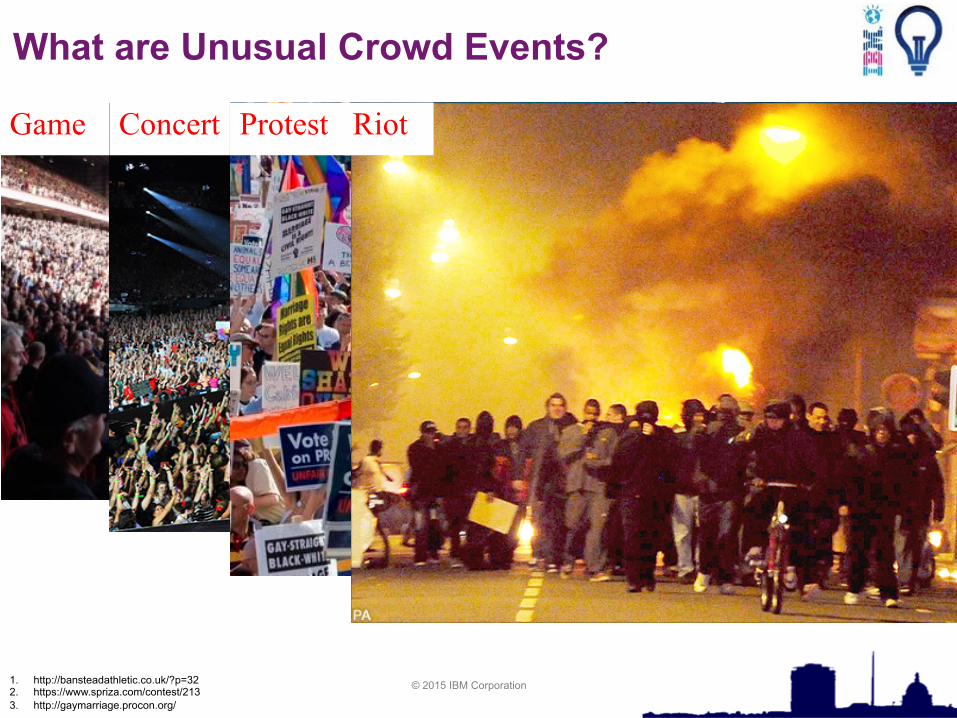
What are Unusual Crowd Events?
Game Concert Protest Riot
© 2015 IBM Corporation
Goal
• Help cities better manage such unusual events • Transport • Public safety
• Identify and quantify impact of events
© 2015 IBM Corporation
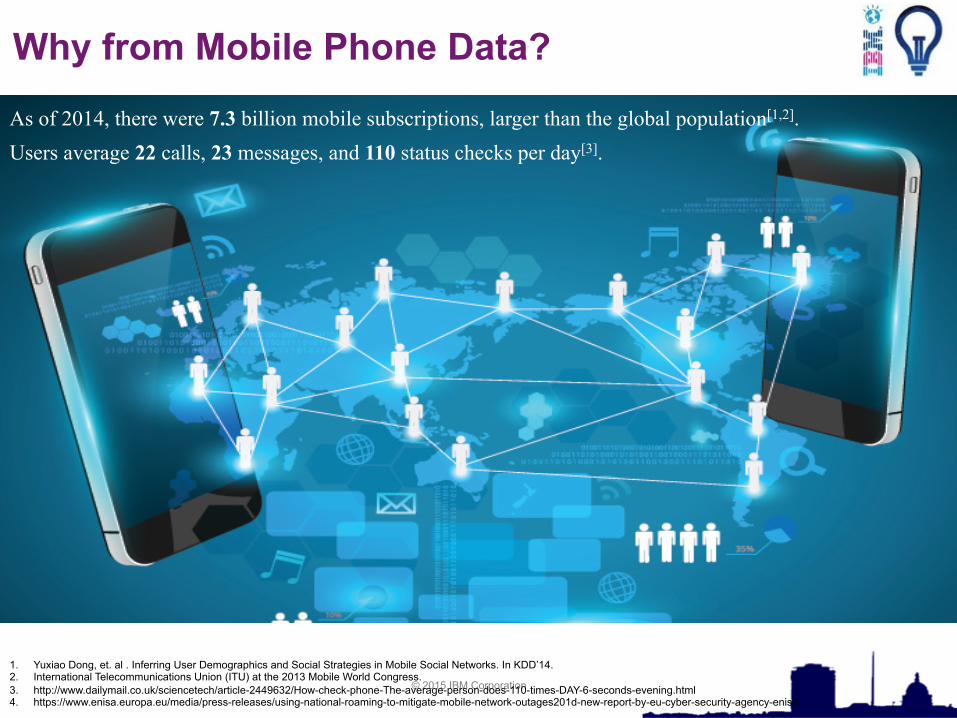
As of 2014, there were 7.3 billion mobile subscriptions, larger than the global population[1,2]. Users average 22 calls, 23 messages, and 110 status checks per day[3].
1. Yuxiao Dong, et. al . Inferring User Demographics and Social Strategies in Mobile Social Networks. In KDD’14. 2. International Telecommunications Union (ITU) at the 2013 Mobile World Congress. 3. http://www.dailymail.co.uk/sciencetech/article-2449632/How-check-phone-The-average-person-does-110-times-DAY-6-seconds-evening.html 4. https://www.enisa.europa.eu/media/press-releases/using-national-roaming-to-mitigate-mobile-network-outages201d-new-report-by-eu-cyber-security-agency-enisa
Why from Mobile Phone Data?
© 2015 IBM Corporation
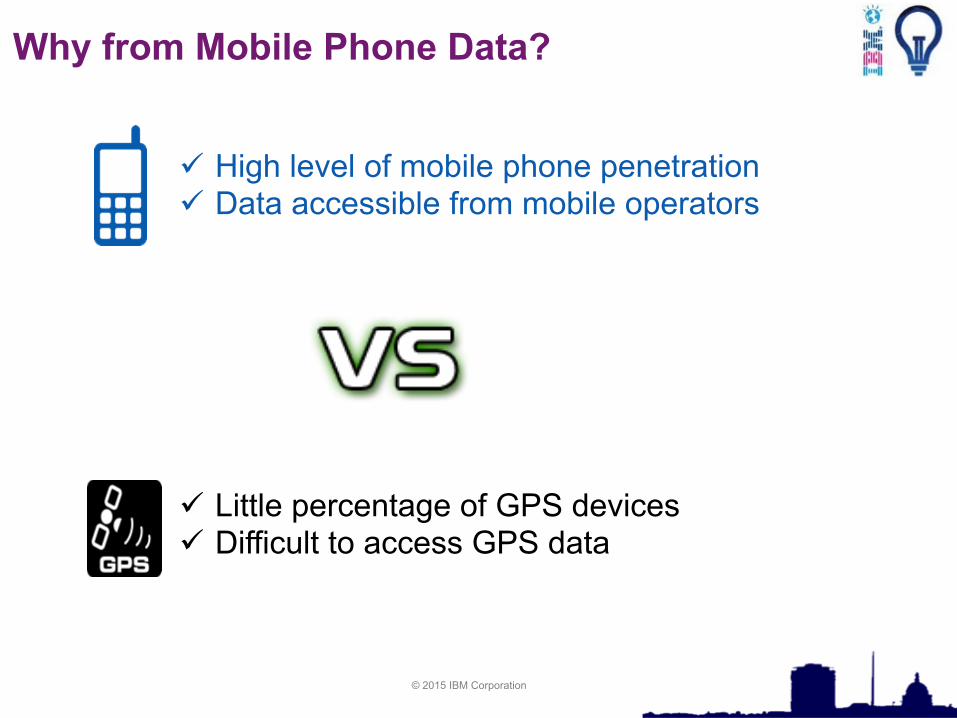
Why from Mobile Phone Data?
ü High level of mobile phone penetration ü Data accessible from mobile operators
ü Little percentage of GPS devices ü Difficult to access GPS data
© 2015 IBM Corporation
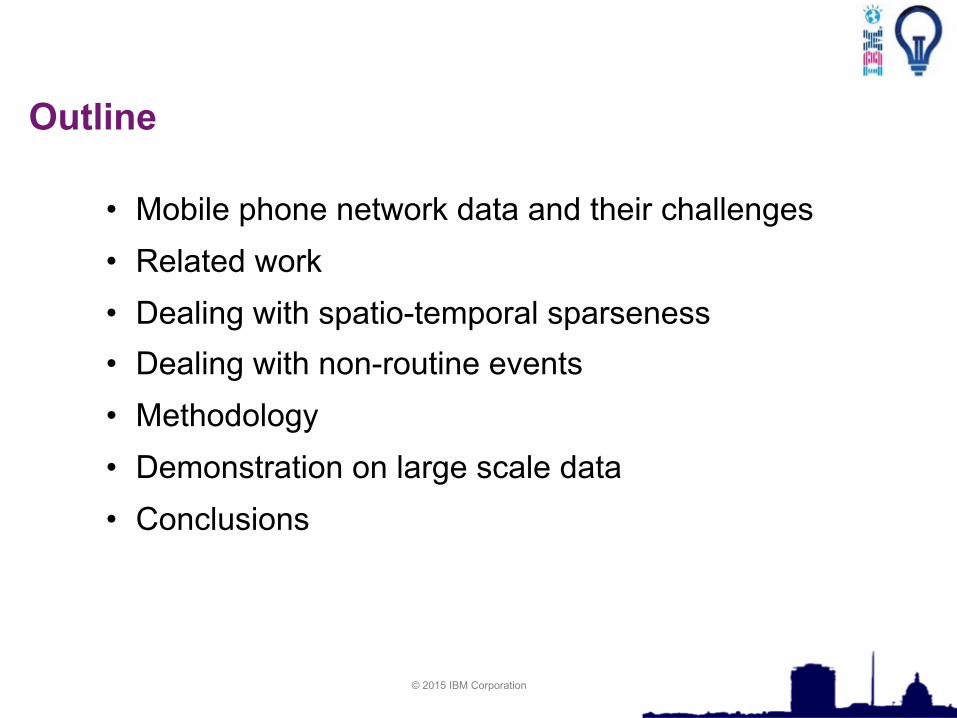
Outline
• Mobile phone network data and their challenges • Related work • Dealing with spatio-temporal sparseness • Dealing with non-routine events • Methodology • Demonstration on large scale data • Conclusions
© 2015 IBM Corporation
As of 2014, there were 7.3 billion mobile subscriptions, larger than the global population[1,2]. Users average 22 calls, 23 messages, and 110 status checks per day[3].
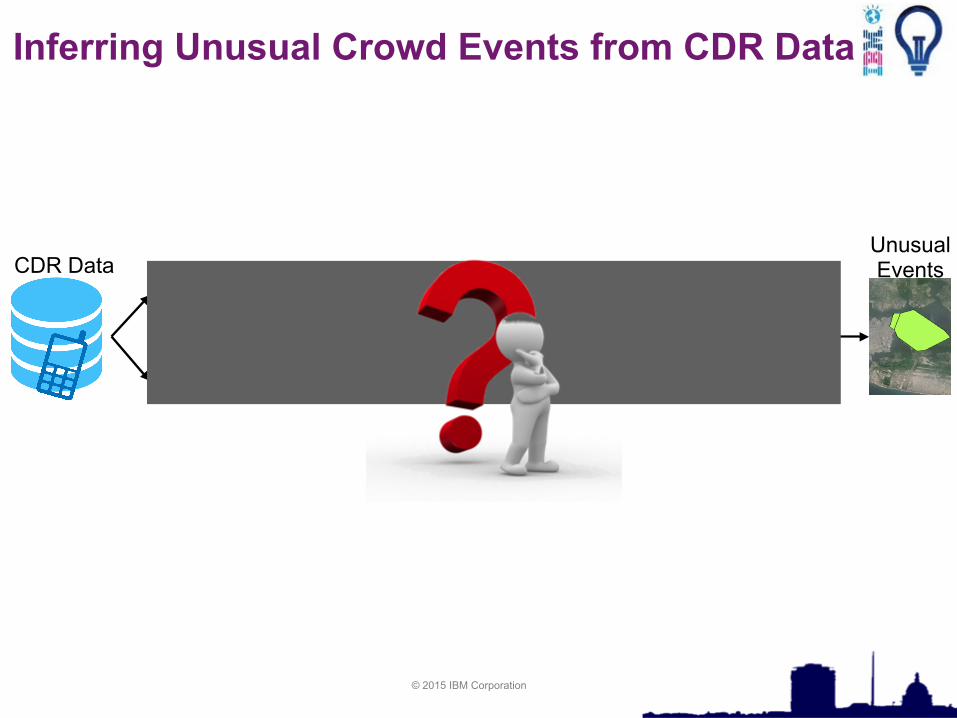
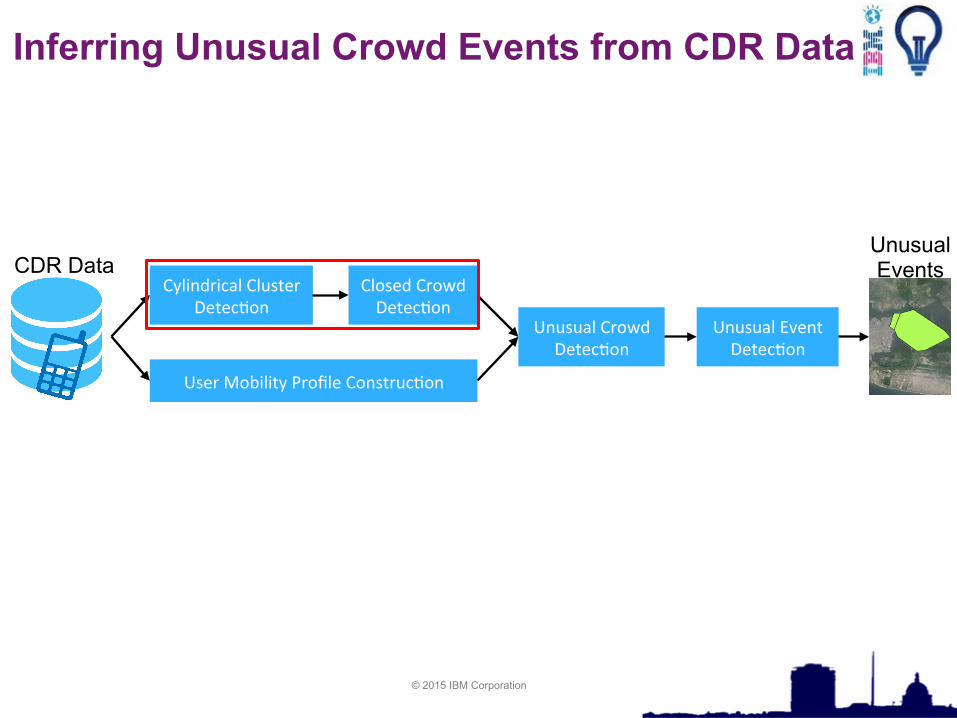
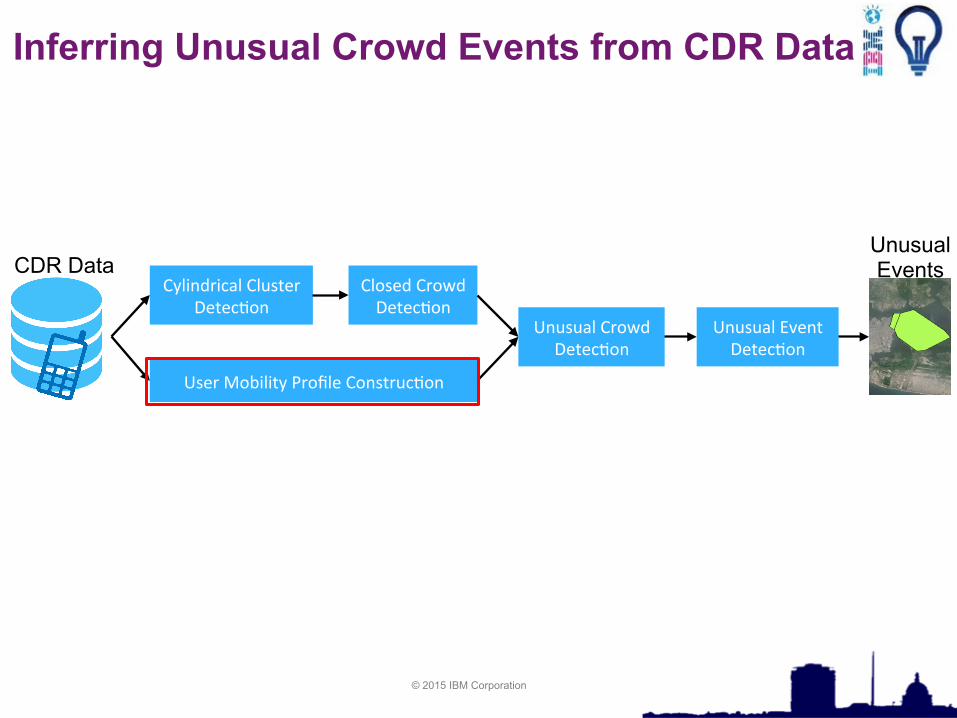
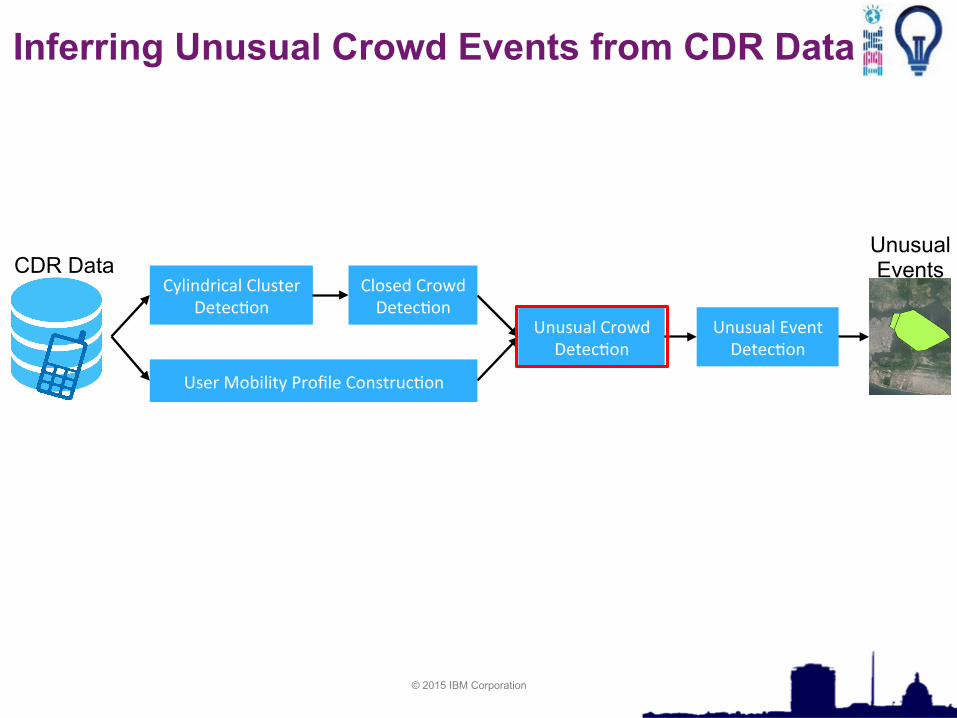
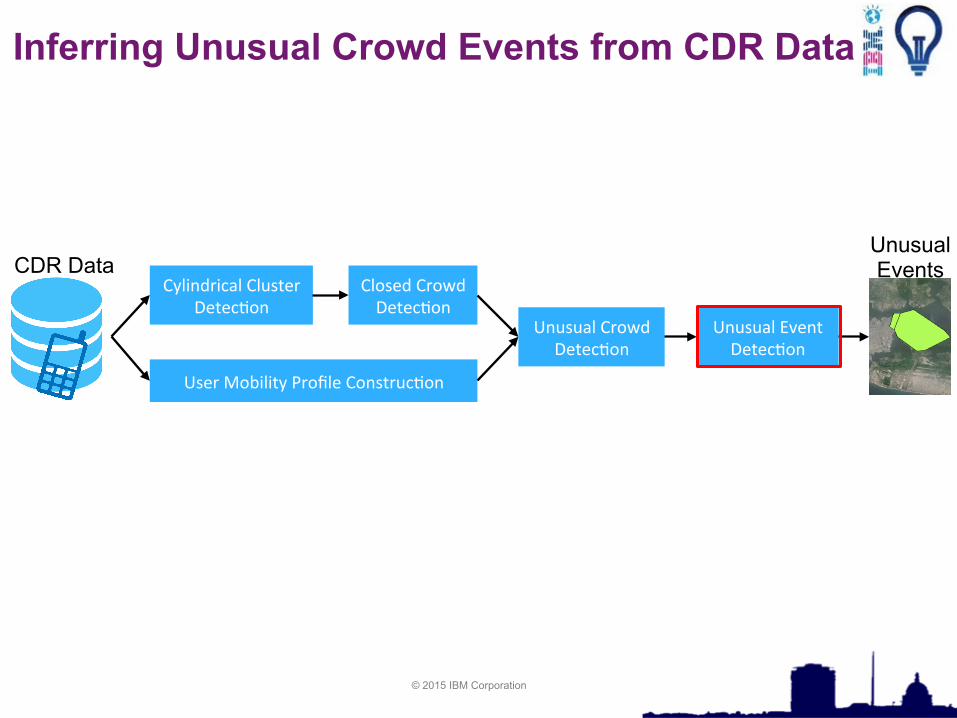
Inferring Unusual Crowd Events from CDR Data
Cylindrical*Cluster*Detec0on*
User*Mobility*Profile*Construc0on*
Closed*Crowd*Detec0on*
Unusual*Crowd*Detec0on*
Unusual*Event*Detec0on*
CDR Data Unusual Events
© 2015 IBM Corporation
As of 2014, there were 7.3 billion mobile subscriptions, larger than the global population[1,2]. Users average 22 calls, 23 messages, and 110 status checks per day[3].
1. http://viewfromll2.com/2015/01/12/serial-the-failure-of-the-prosecutions-cellphone-theory-in-one-simple-chart/
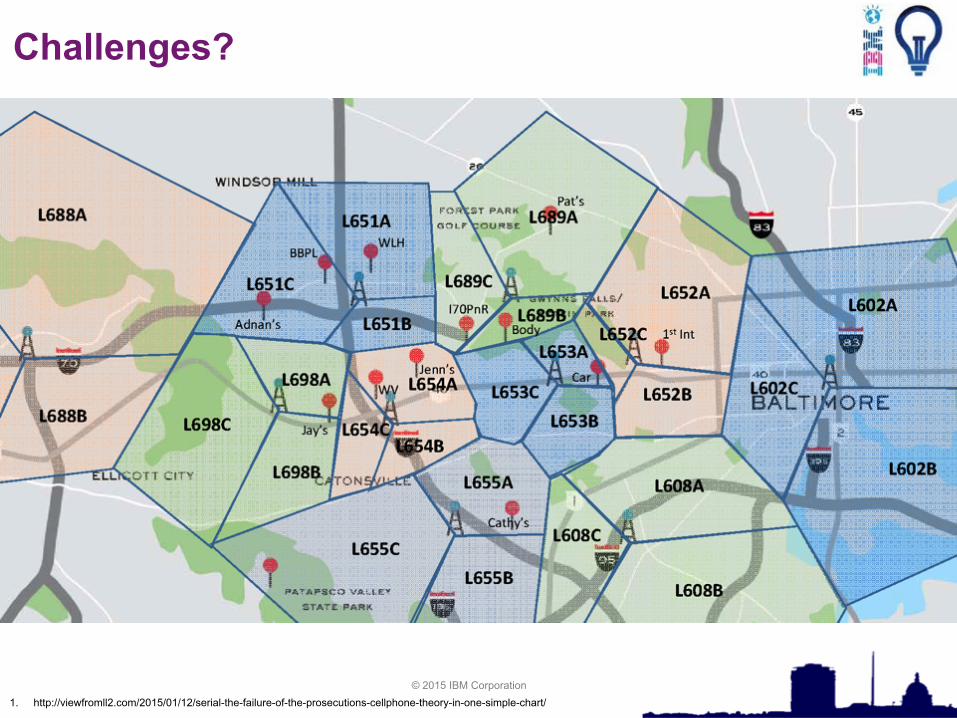
Challenges?
© 2015 IBM Corporation
As of 2014, there were 7.3 billion mobile subscriptions, larger than the global population[1,2]. Users average 22 calls, 23 messages, and 110 status checks per day[3].
1. http://viewfromll2.com/2015/01/12/serial-the-failure-of-the-prosecutions-cellphone-theory-in-one-simple-chart/
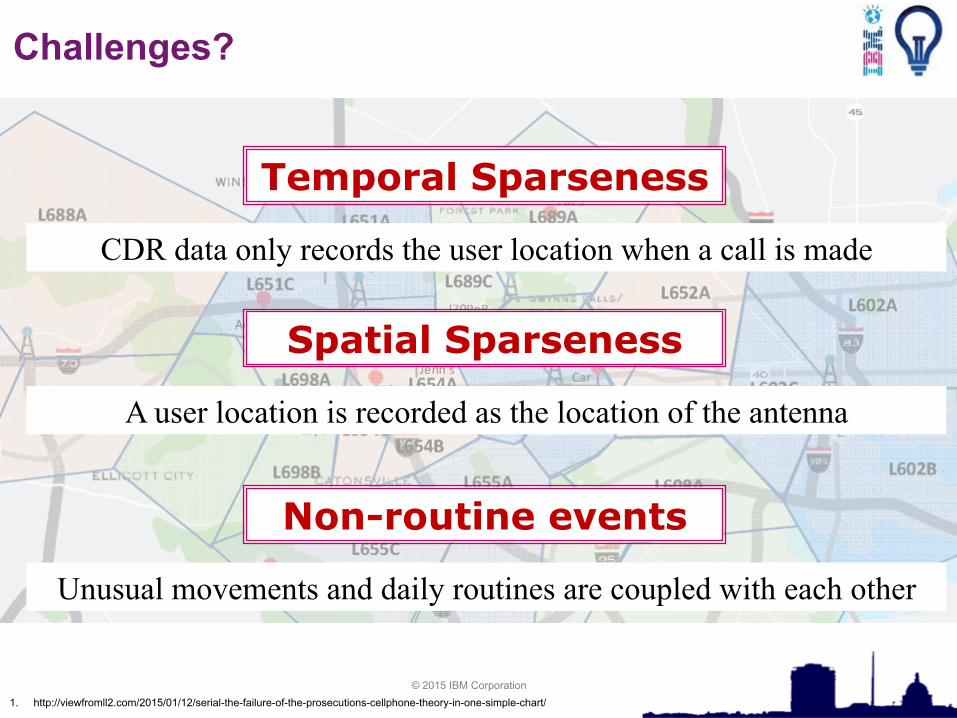
Challenges?
Temporal Sparseness
CDR data only records the user location when a call is made
Spatial Sparseness
A user location is recorded as the location of the antenna
Non-routine events
Unusual movements and daily routines are coupled with each other
© 2015 IBM Corporation
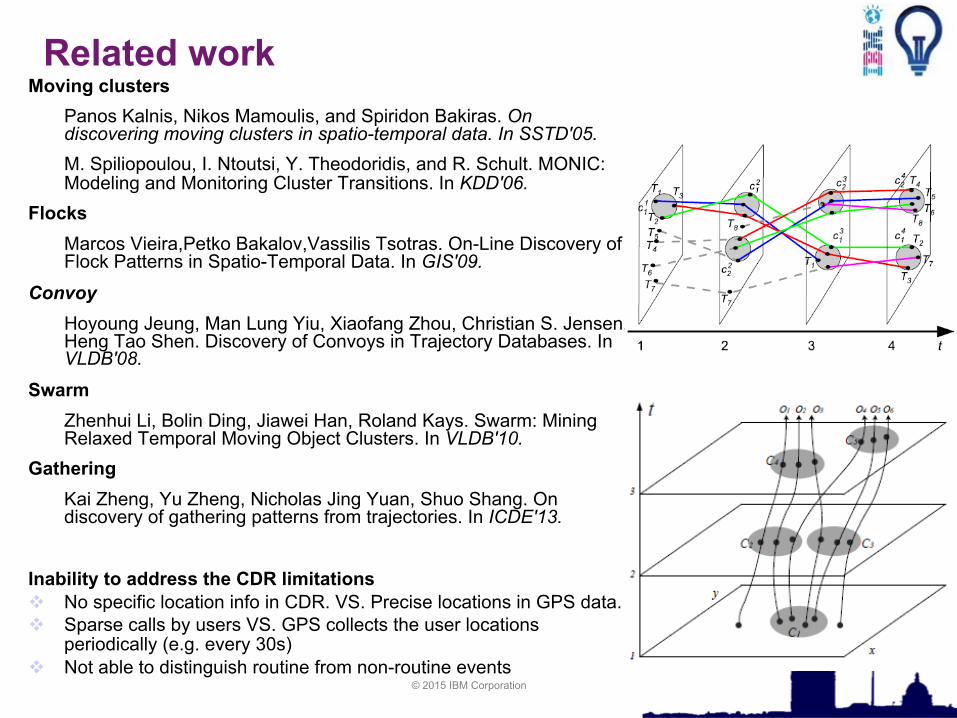
Related work Moving clusters
Panos Kalnis, Nikos Mamoulis, and Spiridon Bakiras. On discovering moving clusters in spatio-temporal data. In SSTD'05. M. Spiliopoulou, I. Ntoutsi, Y. Theodoridis, and R. Schult. MONIC: Modeling and Monitoring Cluster Transitions. In KDD'06.
Flocks Marcos Vieira,Petko Bakalov,Vassilis Tsotras. On-Line Discovery of Flock Patterns in Spatio-Temporal Data. In GIS'09.
Convoy Hoyoung Jeung, Man Lung Yiu, Xiaofang Zhou, Christian S. Jensen, Heng Tao Shen. Discovery of Convoys in Trajectory Databases. In VLDB'08.
Swarm Zhenhui Li, Bolin Ding, Jiawei Han, Roland Kays. Swarm: Mining Relaxed Temporal Moving Object Clusters. In VLDB'10.
Gathering Kai Zheng, Yu Zheng, Nicholas Jing Yuan, Shuo Shang. On discovery of gathering patterns from trajectories. In ICDE'13.
Inability to address the CDR limitations v No specific location info in CDR. VS. Precise locations in GPS data. v Sparse calls by users VS. GPS collects the user locations
periodically (e.g. every 30s) v Not able to distinguish routine from non-routine events
© 2015 IBM Corporation
As of 2014, there were 7.3 billion mobile subscriptions, larger than the global population[1,2]. Users average 22 calls, 23 messages, and 110 status checks per day[3].
Inferring Unusual Crowd Events from CDR Data
Cylindrical*Cluster*Detec0on*
User*Mobility*Profile*Construc0on*
Closed*Crowd*Detec0on*
Unusual*Crowd*Detec0on*
Unusual*Event*Detec0on*
CDR Data Unusual Events
© 2015 IBM Corporation
As of 2014, there were 7.3 billion mobile subscriptions, larger than the global population[1,2]. Users average 22 calls, 23 messages, and 110 status checks per day[3].
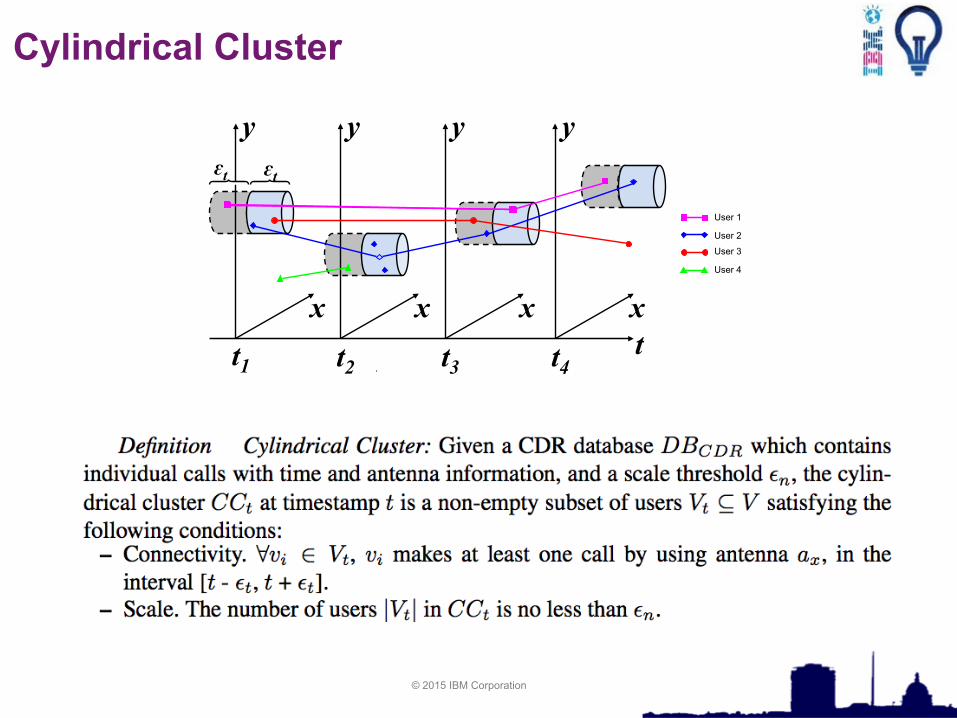
Cylindrical Cluster
x x x x
y y y y
t t1 t2 t3 t4
ɛt ɛt
User 1
User 2
User 3
User 4
© 2015 IBM Corporation
As of 2014, there were 7.3 billion mobile subscriptions, larger than the global population[1,2]. Users average 22 calls, 23 messages, and 110 status checks per day[3].
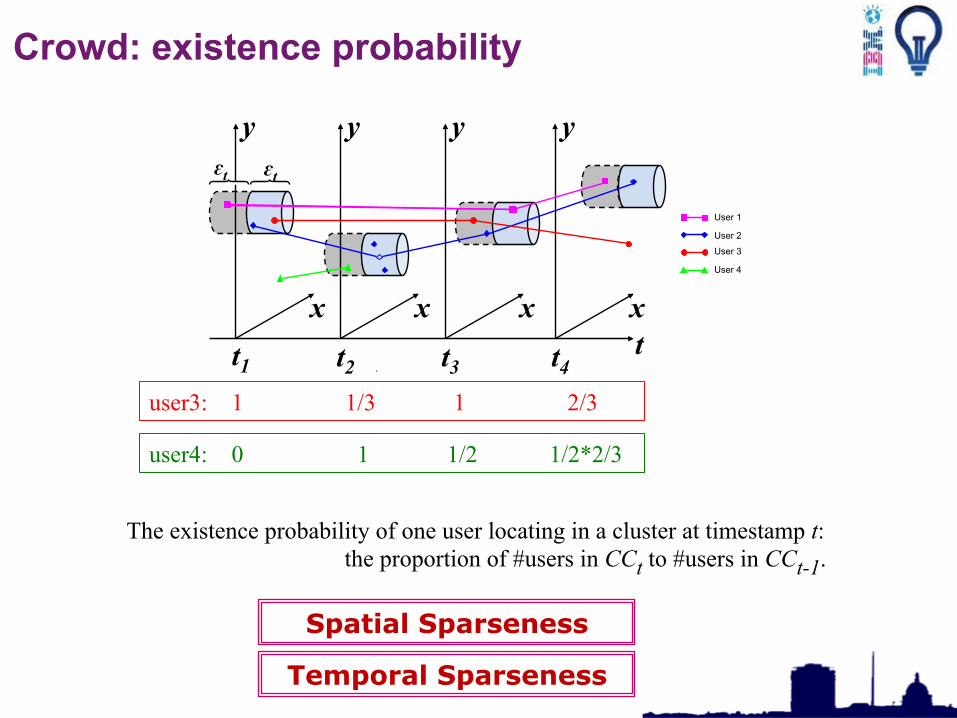
Crowd: existence probability
The existence probability of one user locating in a cluster at timestamp t: the proportion of #users in CCt to #users in CCt-1.
user3: 1 1/3 1 2/3
user4: 0 1 1/2 1/2*2/3
x x x x
y y y y
t t1 t2 t3 t4
ɛt ɛt
User 1
User 2
User 3
User 4
Temporal Sparseness
Spatial Sparseness
© 2015 IBM Corporation
As of 2014, there were 7.3 billion mobile subscriptions, larger than the global population[1,2]. Users average 22 calls, 23 messages, and 110 status checks per day[3].
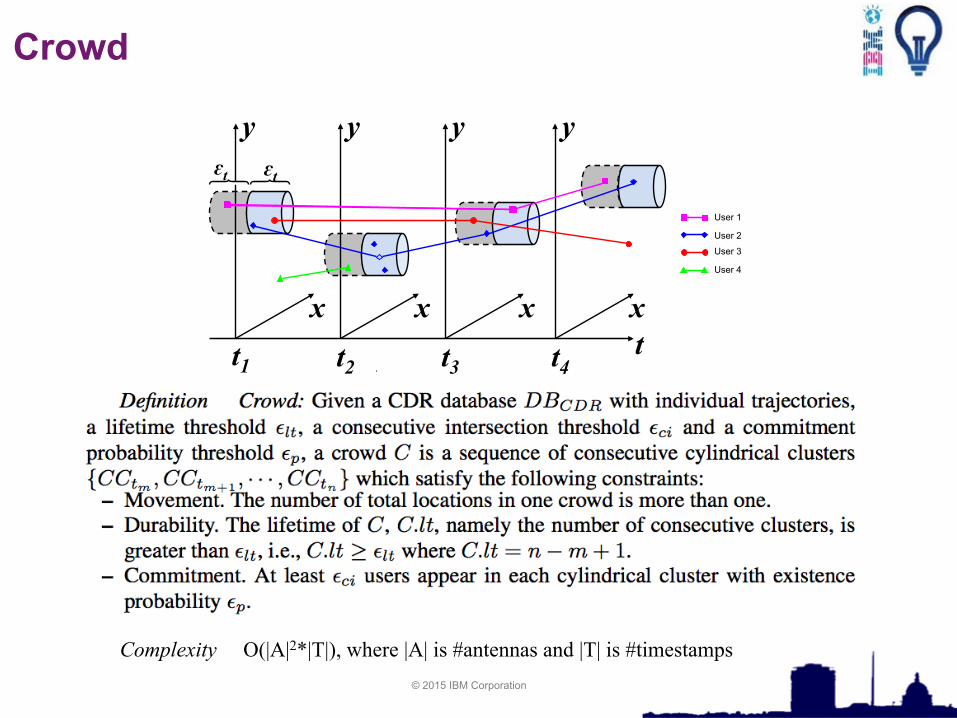
Crowd
x x x x
y y y y
t t1 t2 t3 t4
ɛt ɛt
User 1
User 2
User 3
User 4
Complexity O(|A|2*|T|), where |A| is #antennas and |T| is #timestamps
© 2015 IBM Corporation
As of 2014, there were 7.3 billion mobile subscriptions, larger than the global population[1,2]. Users average 22 calls, 23 messages, and 110 status checks per day[3].
Inferring Unusual Crowd Events from CDR Data
Cylindrical*Cluster*Detec0on*
User*Mobility*Profile*Construc0on*
Closed*Crowd*Detec0on*
Unusual*Crowd*Detec0on*
Unusual*Event*Detec0on*
CDR Data Unusual Events
© 2015 IBM Corporation
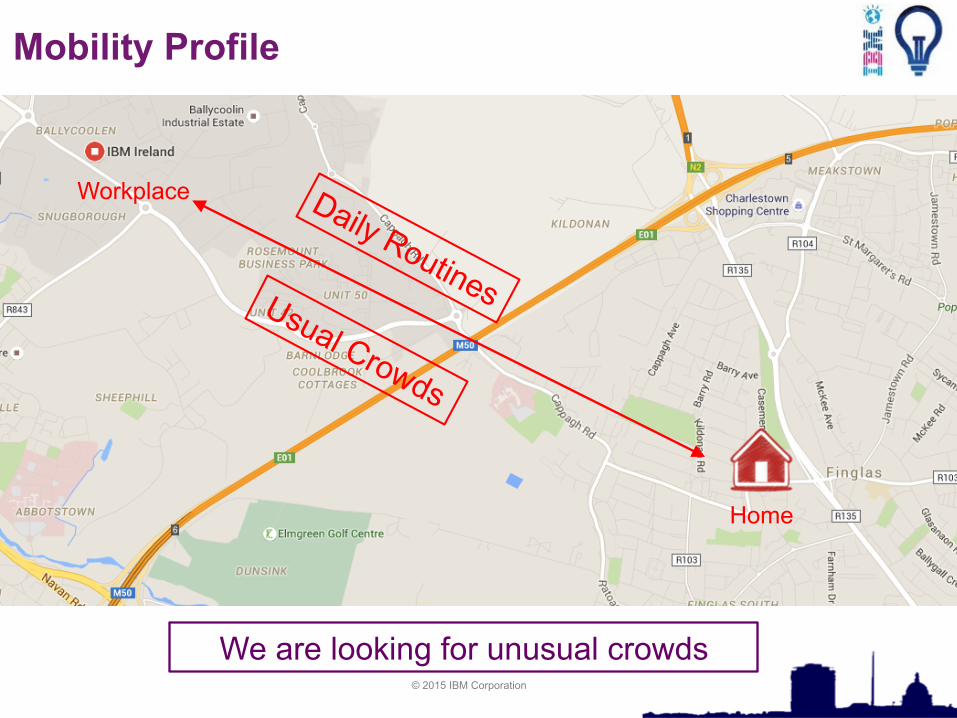
Mobility Profile
Home
Workplace
We are looking for unusual crowds
© 2015 IBM Corporation
Mobility Profile
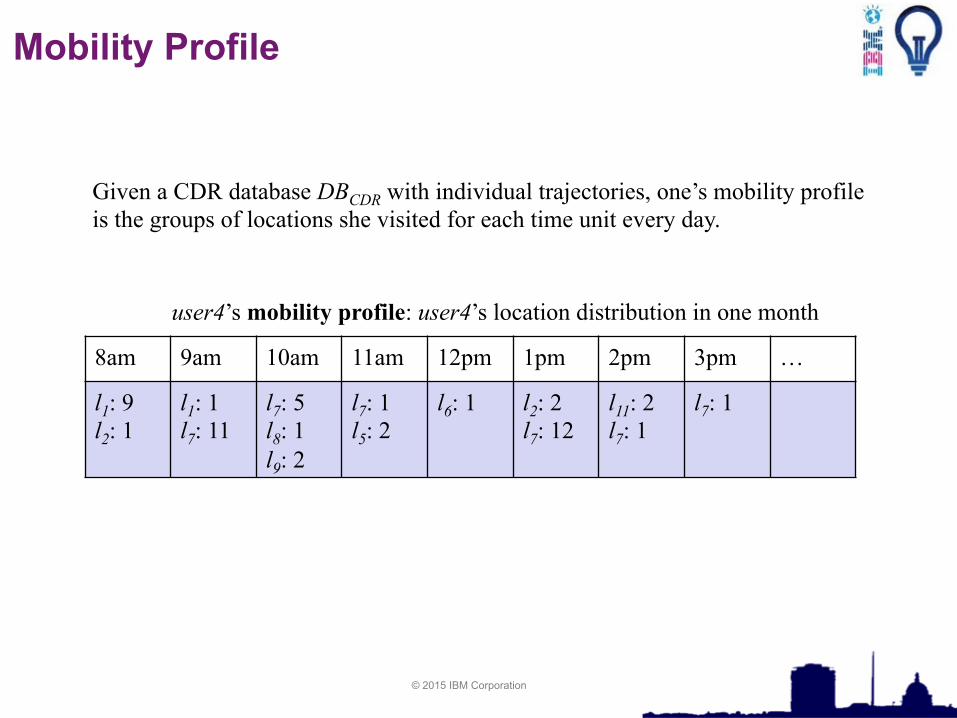
Given a CDR database DBCDR with individual trajectories, one’s mobility profile is the groups of locations she visited for each time unit every day.
8am 9am 10am 11am 12pm 1pm 2pm 3pm …
l1: 9 l2: 1
l1: 1 l7: 11
l7: 5 l8: 1 l9: 2
l7: 1 l5: 2
l6: 1
l2: 2 l7: 12
l11: 2 l7: 1
l7: 1
user4’s mobility profile: user4’s location distribution in one month
© 2015 IBM Corporation
As of 2014, there were 7.3 billion mobile subscriptions, larger than the global population[1,2]. Users average 22 calls, 23 messages, and 110 status checks per day[3].
Inferring Unusual Crowd Events from CDR Data
Cylindrical*Cluster*Detec0on*
User*Mobility*Profile*Construc0on*
Closed*Crowd*Detec0on*
Unusual*Crowd*Detec0on*
Unusual*Event*Detec0on*
CDR Data Unusual Events

© 2015 IBM Corporation
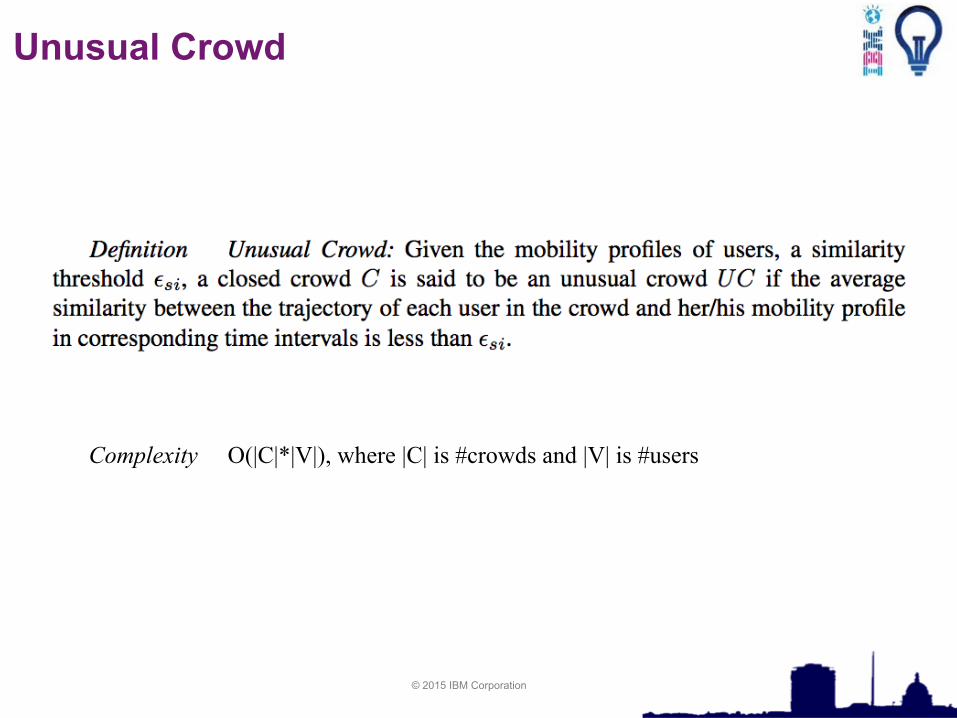
Unusual Crowd
8am 9am 10am 11am 12pm 1pm 2pm 3pm …
l1: 9 l2: 1
l1: 1 l7: 11
l7: 5 l8: 1 l9: 2
l7: 1 l5: 2
l6: 1
l2: 2 l16: 12
l11: 2 l7: 1
l7: 1
user4: 0 1 1/2 1/2*2/3
l8 l13 l14 l16
user4: 1 0 0 12 mobility profile
user4’s mobility profile: user4’s location distribution in one month
crowd
x x x x
y y y y
t t1 t2 t3 t4
ɛt ɛt
User 1
User 2
User 3
User 4
cosine similarity
Non-routine events
l8 l13
l14 l16
© 2015 IBM Corporation
Unusual Crowd
Complexity O(|C|*|V|), where |C| is #crowds and |V| is #users
© 2015 IBM Corporation
As of 2014, there were 7.3 billion mobile subscriptions, larger than the global population[1,2]. Users average 22 calls, 23 messages, and 110 status checks per day[3].
Inferring Unusual Crowd Events from CDR Data
Cylindrical*Cluster*Detec0on*
User*Mobility*Profile*Construc0on*
Closed*Crowd*Detec0on*
Unusual*Crowd*Detec0on*
Unusual*Event*Detec0on*
CDR Data Unusual Events
© 2015 IBM Corporation
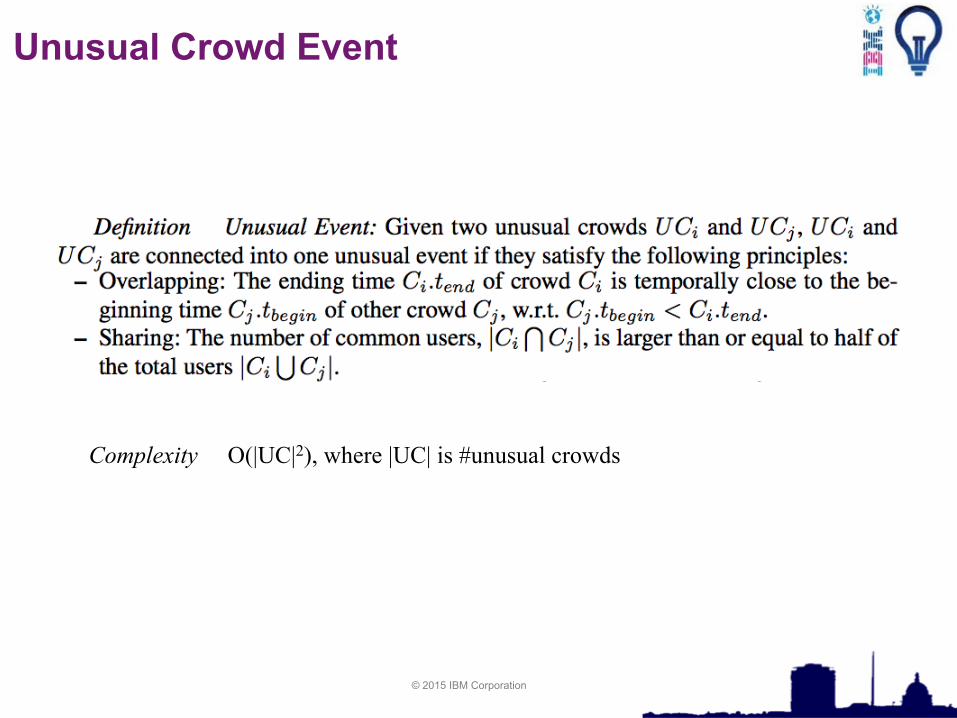
Unusual Crowd Event
Complexity O(|UC|2), where |UC| is #unusual crowds
© 2015 IBM Corporation
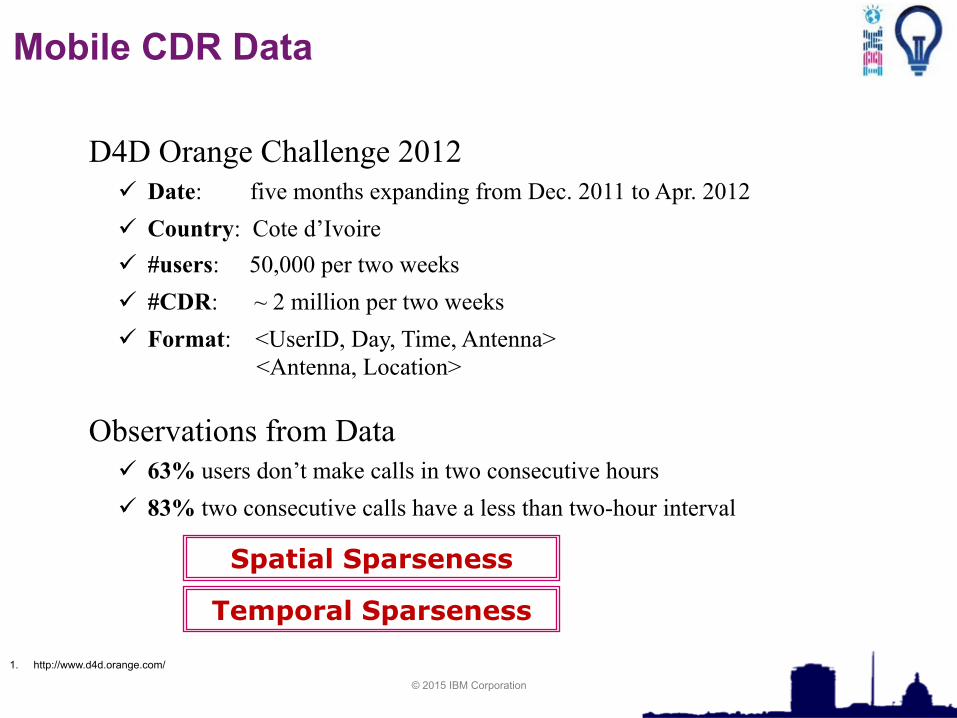
Mobile CDR Data
D4D Orange Challenge 2012 ü Date: five months expanding from Dec. 2011 to Apr. 2012 ü Country: Cote d’Ivoire ü #users: 50,000 per two weeks ü #CDR: ~ 2 million per two weeks ü Format: <UserID, Day, Time, Antenna>
<Antenna, Location> Observations from Data
ü 63% users don’t make calls in two consecutive hours ü 83% two consecutive calls have a less than two-hour interval
1. http://www.d4d.orange.com/
Temporal Sparseness
Spatial Sparseness
© 2015 IBM Corporation
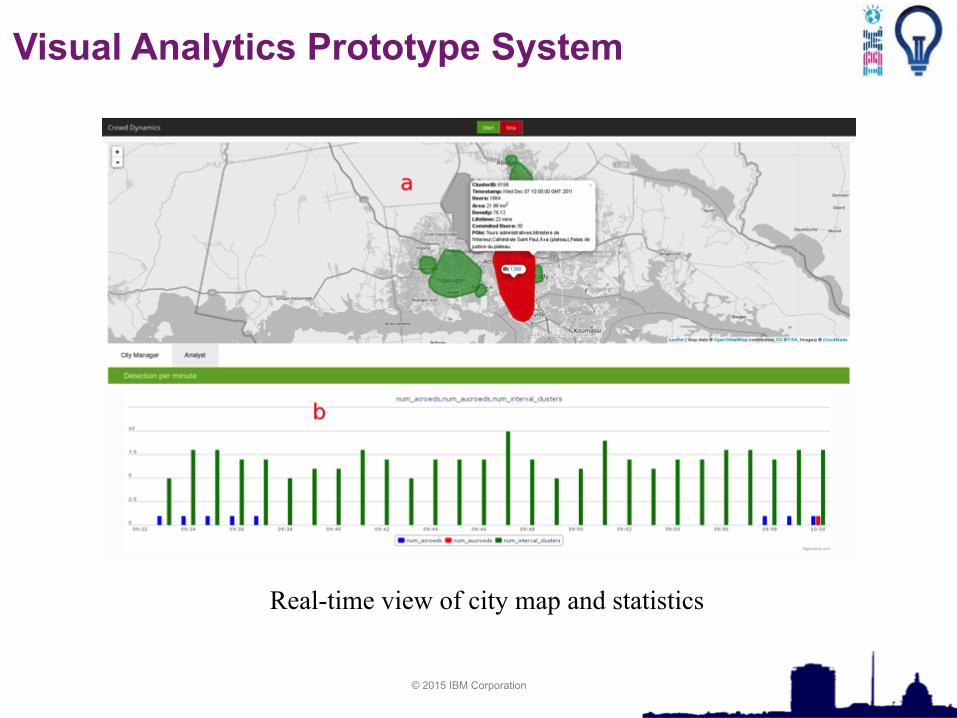
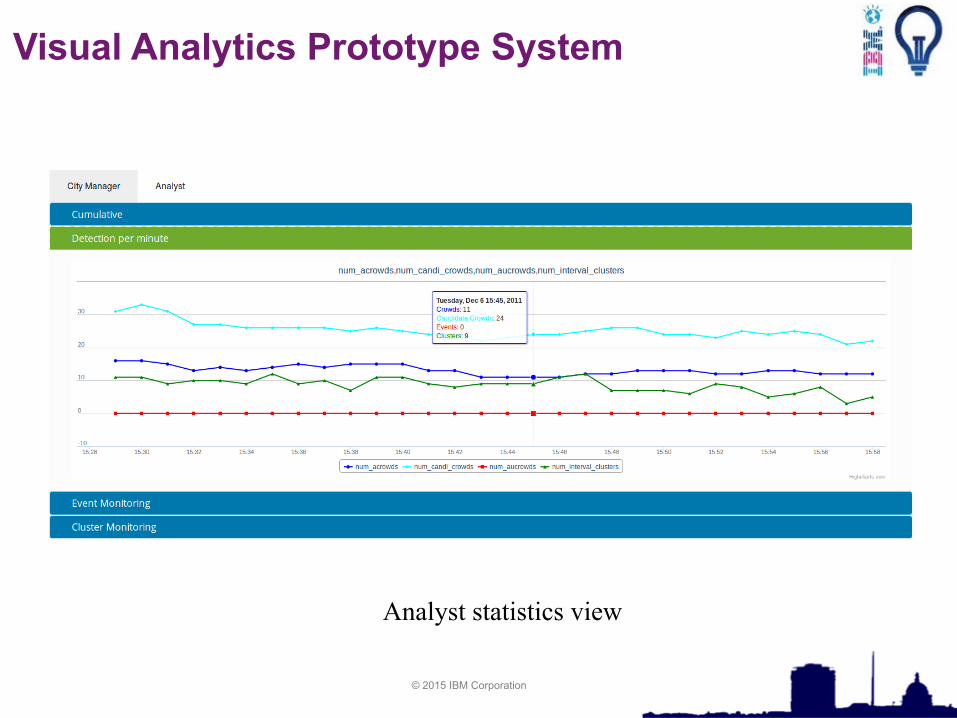
Visual Analytics Prototype System
Real-time view of city map and statistics
© 2015 IBM Corporation
Visual Analytics Prototype System
Analyst statistics view
© 2015 IBM Corporation
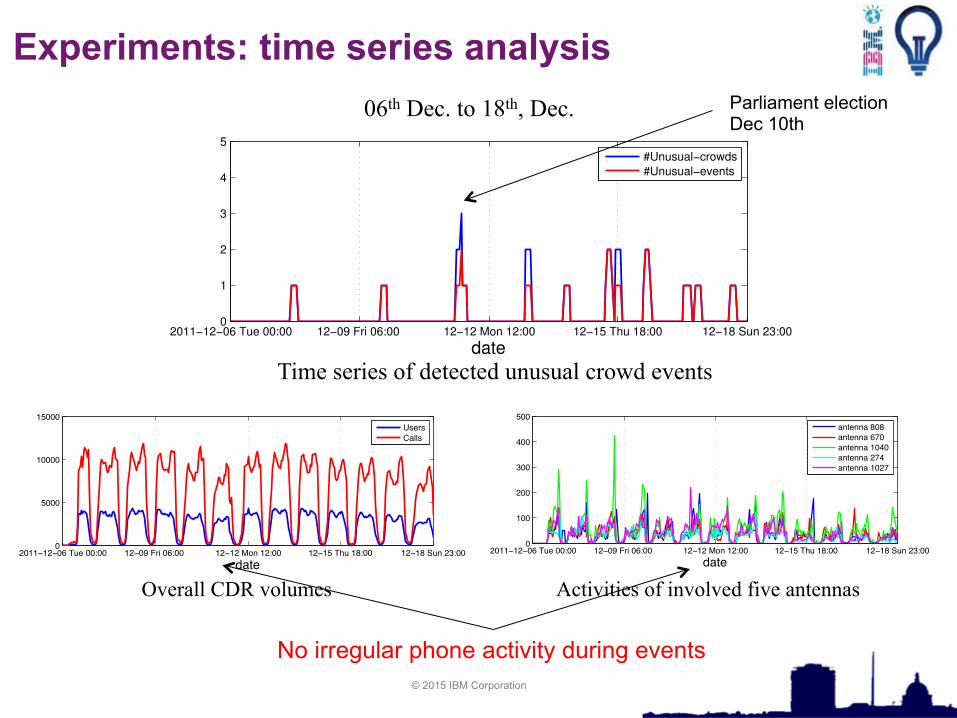
Experiments: time series analysis
2011−12−06 Tue 00:00 12−09 Fri 06:00 12−12 Mon 12:00 12−15 Thu 18:00 12−18 Sun 23:000
1
2
3
4
5
date
#Unusual−crowds
#Unusual−events
Time series of detected unusual crowd events
06th Dec. to 18th, Dec. Parliament election Dec 10th
2011−12−06 Tue 00:00 12−09 Fri 06:00 12−12 Mon 12:00 12−15 Thu 18:00 12−18 Sun 23:000
5000
10000
15000
date
UsersCalls
2011−12−06 Tue 00:00 12−09 Fri 06:00 12−12 Mon 12:00 12−15 Thu 18:00 12−18 Sun 23:000
100
200
300
400
500
date
antenna 808antenna 670antenna 1040antenna 274antenna 1027
Overall CDR volumes Activities of involved five antennas
No irregular phone activity during events
© 2015 IBM Corporation
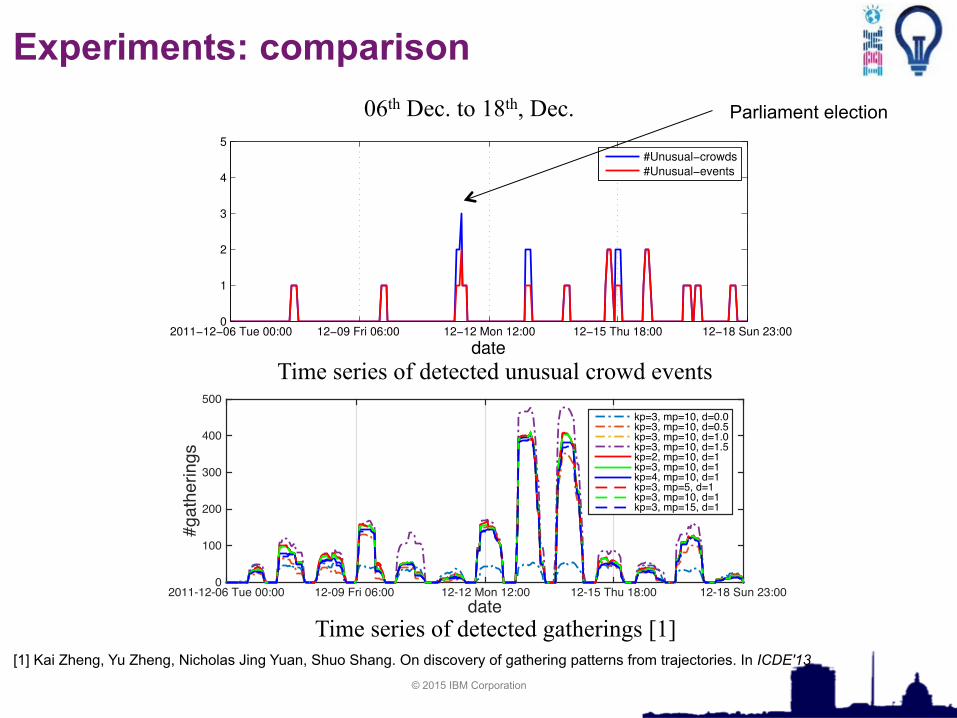
Experiments: comparison
2011−12−06 Tue 00:00 12−09 Fri 06:00 12−12 Mon 12:00 12−15 Thu 18:00 12−18 Sun 23:000
1
2
3
4
5
date
#Unusual−crowds
#Unusual−events
date2011-12-06 Tue 00:00 12-09 Fri 06:00 12-12 Mon 12:00 12-15 Thu 18:00 12-18 Sun 23:00
#gat
herin
gs
0
100
200
300
400
500kp=3, mp=10, d=0.0kp=3, mp=10, d=0.5kp=3, mp=10, d=1.0kp=3, mp=10, d=1.5kp=2, mp=10, d=1kp=3, mp=10, d=1kp=4, mp=10, d=1kp=3, mp=5, d=1kp=3, mp=10, d=1kp=3, mp=15, d=1
Time series of detected unusual crowd events
Time series of detected gatherings [1]
06th Dec. to 18th, Dec. Parliament election
[1] Kai Zheng, Yu Zheng, Nicholas Jing Yuan, Shuo Shang. On discovery of gathering patterns from trajectories. In ICDE'13
© 2015 IBM Corporation
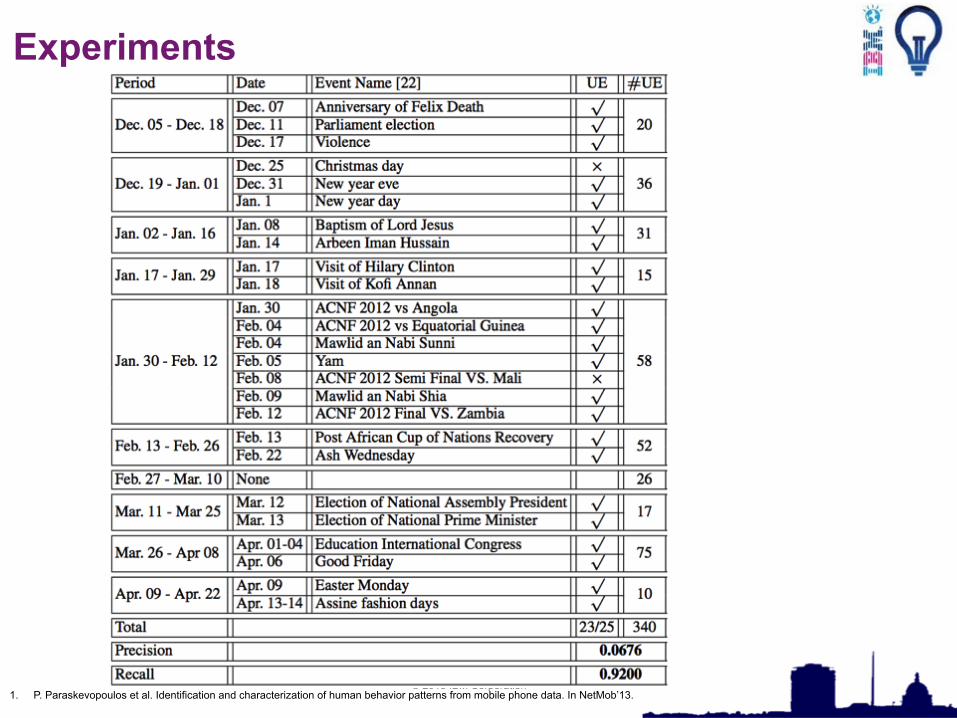
Experiments
1. P. Paraskevopoulos et al. Identification and characterization of human behavior patterns from mobile phone data. In NetMob’13.
© 2015 IBM Corporation
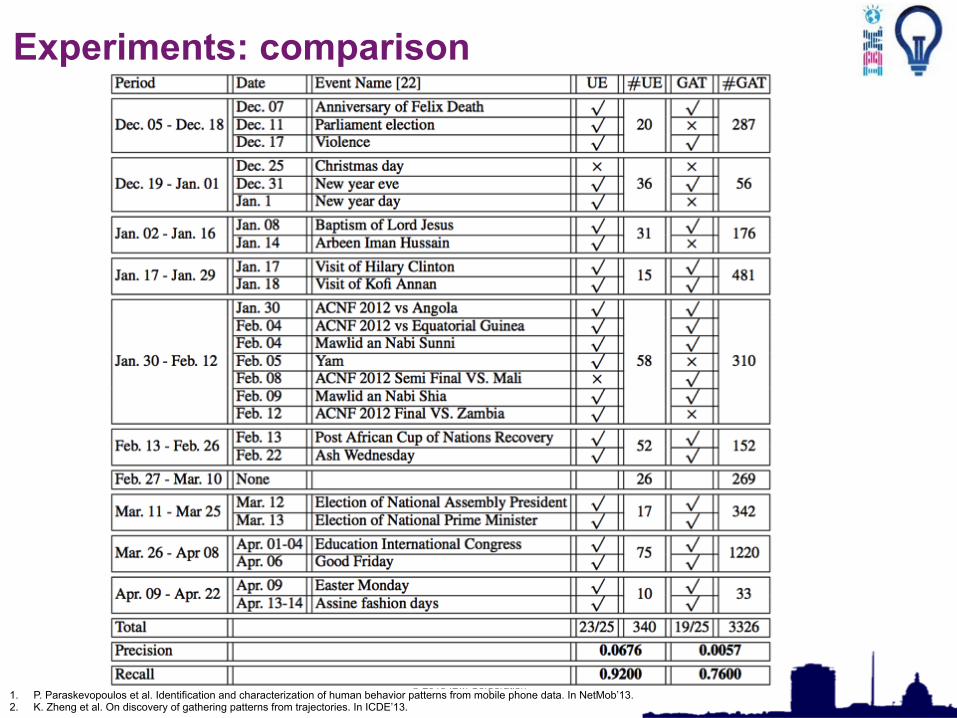
Experiments: comparison
1. P. Paraskevopoulos et al. Identification and characterization of human behavior patterns from mobile phone data. In NetMob’13. 2. K. Zheng et al. On discovery of gathering patterns from trajectories. In ICDE’13.
© 2015 IBM Corporation
ü Problem: Inferring unusual crowd events from CDR data.
ü Framework: effective unusual crowd event detection
ü System: visual analytics prototype tool
ü Parameter setting and optimization
ü Multiple-sources of data for detection, such as social media
ü Real-time unusual event detection
Conclusions
Future Work