Inferential Statistics - Battaly · Inferential Statistics Area under a normal curve Find zscore...
23
Calculator Instructions © Battaly 2012 1 April 30, 2012 Statistics Home Page Instructions for Using the Calculator for Statistics Descriptive Statistics Class Notes ©Gertrude Battaly, 2012 Distributions: Normal, Studentt General Statistics mean, median, stdev, quartiles, etc Five Number Summary Box Plot with Outliers Histogram Inferential Statistics Area under a normal curve Find zscore for a given area Find tscore for a given area and df Normal Probability Plot z Interval t Interval Area under Studentt curve zTest, l mean tTest, l mean Entering Data Pairedt Test ChiSquare GOF ChiSq Independence tTest, pooled tTest, nonpooled Correlation tTest
Transcript of Inferential Statistics - Battaly · Inferential Statistics Area under a normal curve Find zscore...

Calculator Instructions
© Battaly 2012 1
April 30, 2012
Statistics Home Page
Instructions for Using the Calculator for StatisticsDescriptive Statistics
Class Notes©Gertrude Battaly, 2012
Distributions: Normal, Studentt
General Statistics mean, median, stdev, quartiles, etcFive Number Summary
Box Plot with OutliersHistogram
Inferential Statistics
Area under a normal curve
Find zscore for a given areaFind tscore for a given area and df
Normal Probability Plot
z Interval t Interval
Area under Studentt curve
zTest, l mean tTest, l mean
Entering Data
Pairedt Test
ChiSquare GOFChiSq Independence
tTest, pooledtTest, nonpooled
Correlation tTest

Calculator Instructions
© Battaly 2012 2
April 30, 2012
Statistics Home Page Class Notes©Gertrude Battaly, 2012
Entering Data and Formulas into Lists
Instructions for Using the Calculator for StatisticsDescriptive Statistics
STAT / EDIT1. Edit Before entering data into any lists, clear the lists: ∎ Use the arrowup key to move the cursor up into the heading ∎ While in the heading, click CLEAR / ENTER This should delete all entries in that list.2. To enter a formula that uses data from other lists, arrow up to the heading: ∎ While in the heading, enter the operations: eg: Use: L1 L2 for the differences for a pairedt test, where L1 contains Before data and L2 contains After data (Note: Unlike a spreadsheet the formula list does not change if the original data changes. You will need to redo the formula if you change the data it uses.)
Return to TOC

Calculator Instructions
© Battaly 2012 3
April 30, 2012
Statistics Home Page
Instructions for Using the Calculator for StatisticsDescriptive Statistics
Class Notes©Gertrude Battaly, 2012
STAT / EDIT1. EditEnter data into L1 (or other)STAT / CALC1: 1Var StatsReturns: , Ʃx, Ʃx2, s, σ, n, minX, Q1, Med, Q3, maxX
x
General Statistics mean, median, stdev, quartiles, etc
Return to TOC

Calculator Instructions
© Battaly 2012 4
April 30, 2012
# 3.121 The Great Gretzky 5 NUMBER SUMMARY1. Enter data into a list on the calculator. STAT/ EDIT
2. Turn ON STAT PLOT, Plot1 and enter settings for a 5 Number Summary BOX PLOT. Select the 5th graph (line 2, middle) under Type:
Statistics Home Page Class Notes©Gertrude Battaly, 2012
Return to TOC
Calculator Instructions
© Battaly 2012 5
April 30, 2012
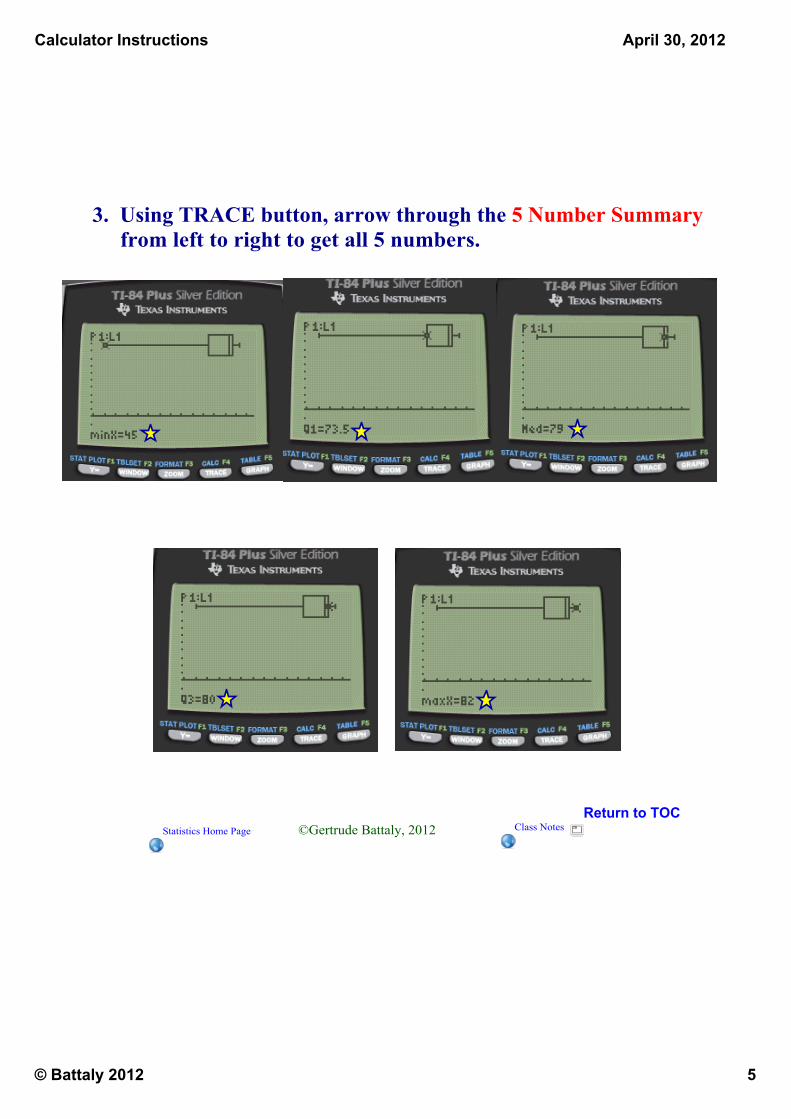
3. Using TRACE button, arrow through the 5 Number Summary from left to right to get all 5 numbers.
Statistics Home Page Class Notes©Gertrude Battaly, 2012Return to TOC

Calculator Instructions
© Battaly 2012 6
April 30, 2012
# 3.121 The Great Gretzky BOX PLOT
1. In STAT PLOT, select the 4th graph (line 2, left) under Type: This is a BOX PLOT w. Outliers
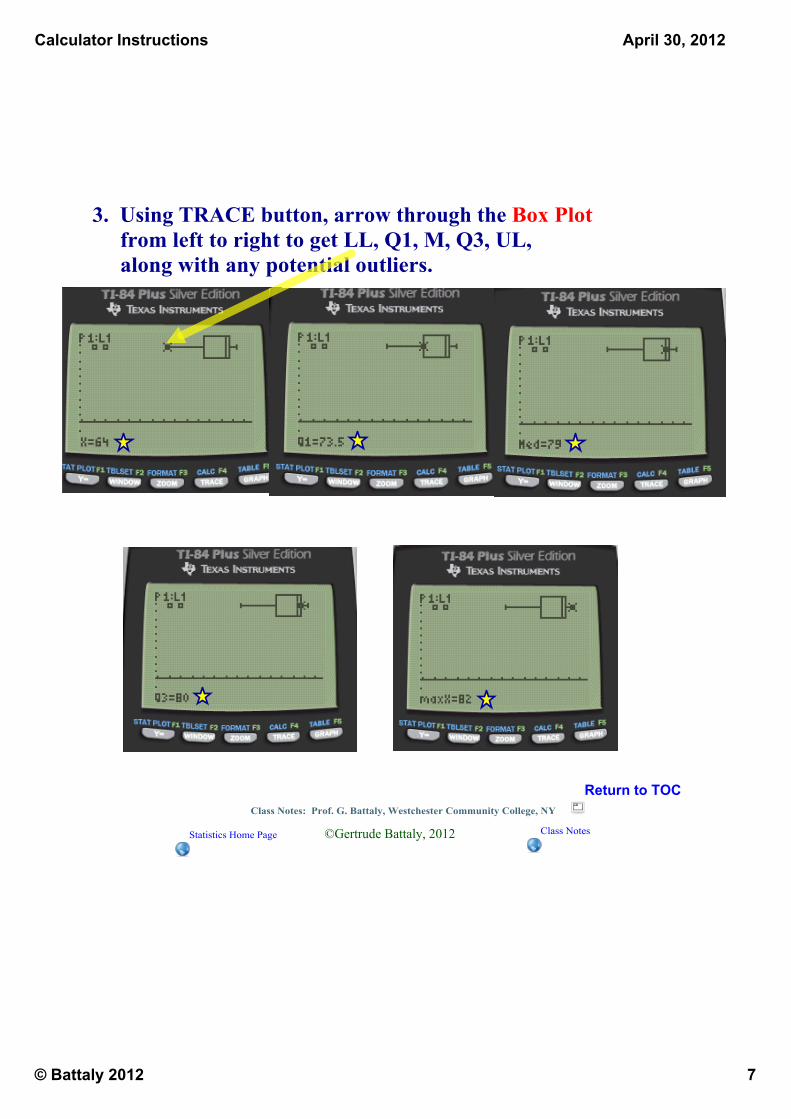
2. Using TRACE button, arrow through the Box Plot from left to right to get LL, Q1, M, Q3, UL, along with any potential outliers.
Statistics Home Page Class Notes©Gertrude Battaly, 2012
Return to TOC
Calculator Instructions
© Battaly 2012 7
April 30, 2012
3. Using TRACE button, arrow through the Box Plot from left to right to get LL, Q1, M, Q3, UL, along with any potential outliers.
Class Notes: Prof. G. Battaly, Westchester Community College, NY
Statistics Home Page Class Notes©Gertrude Battaly, 2012
Return to TOC
Calculator Instructions
© Battaly 2012 8
April 30, 2012
Statistics Home Page
Instructions for Using the Calculator for StatisticsDescriptive Statistics
Class Notes©Gertrude Battaly, 2012
Return to TOC
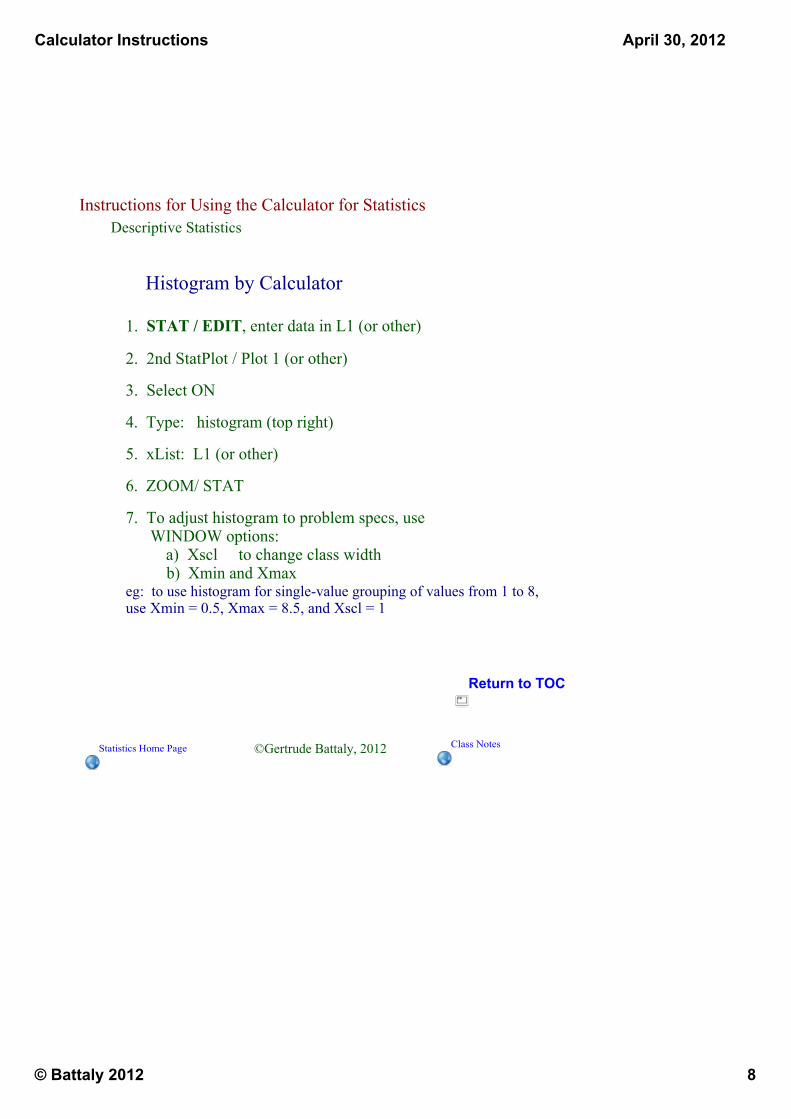
Histogram by Calculator
1. STAT / EDIT, enter data in L1 (or other)
2. 2nd StatPlot / Plot 1 (or other)
3. Select ON
4. Type: histogram (top right)
5. xList: L1 (or other)
6. ZOOM/ STAT
7. To adjust histogram to problem specs, use WINDOW options:
a) Xscl to change class width b) Xmin and Xmaxeg: to use histogram for singlevalue grouping of values from 1 to 8, use Xmin = 0.5, Xmax = 8.5, and Xscl = 1

Calculator Instructions
© Battaly 2012 9
April 30, 2012
Statistics Home Page
Instructions for Using the Calculator for Statistics
Class Notes©Gertrude Battaly, 2012
Return to TOC
Find Area under the Normal Curve
2nd DISTR normalcdf(left, right, mean, standard deviation)
Use this for any normal curve. If using the Standard Normal Curve (SNC), the mean = 0 and the standard deviation = 1
eg: To find the area between z = 1 and z = 1 on the SNC, enter: normalcdf(1,1,0,1) The result is .6827
eg: To find the area between x = 60 and x=85 for a normal distribution with mean=75 and stdev=10, enter: normalcdf(60,85,75,10) The result is .7745
To get areas in the left tail of the SNC, use 9 for the left bound.To get areas in the right tail of the SNC, use +9 for the right bound.
Distributions: Normal, Studentt
Calculator Instructions
© Battaly 2012 10
April 30, 2012
Statistics Home Page
Instructions for Using the Calculator for Statistics
Class Notes©Gertrude Battaly, 2012
Return to TOC
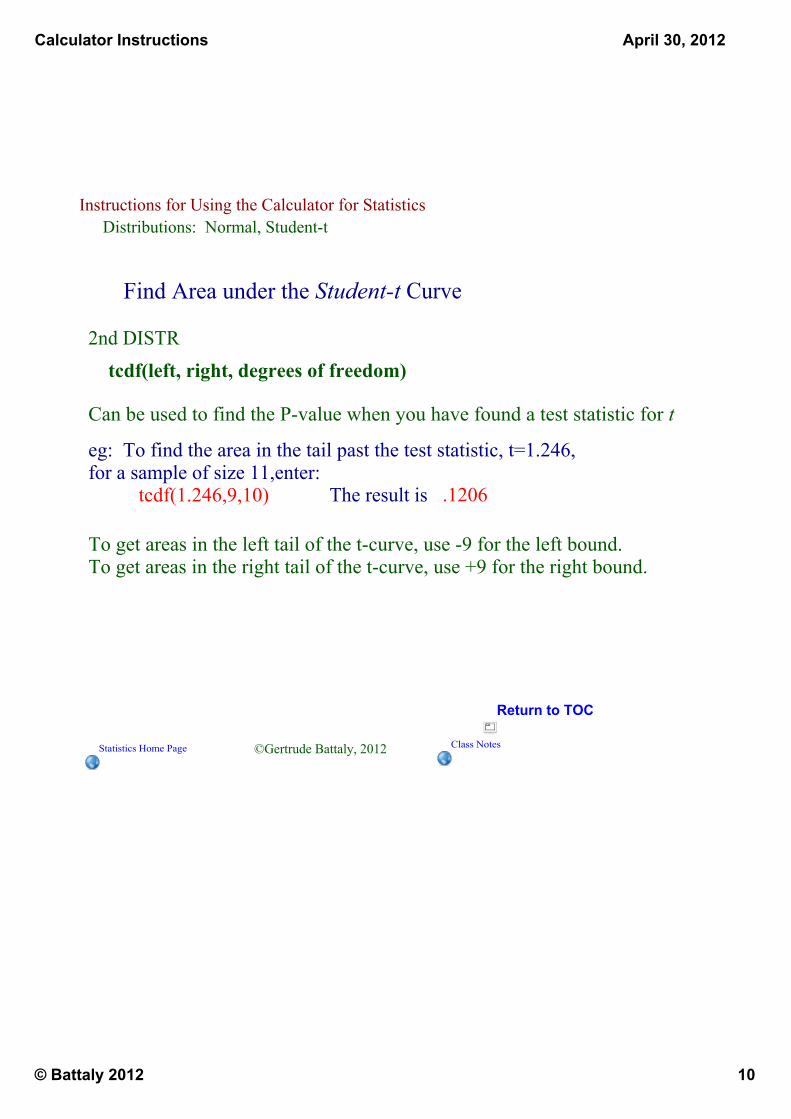
Find Area under the Studentt Curve
2nd DISTR tcdf(left, right, degrees of freedom)
Can be used to find the Pvalue when you have found a test statistic for t
eg: To find the area in the tail past the test statistic, t=1.246, for a sample of size 11,enter: tcdf(1.246,9,10) The result is .1206
To get areas in the left tail of the tcurve, use 9 for the left bound.To get areas in the right tail of the tcurve, use +9 for the right bound.
Distributions: Normal, Studentt

Calculator Instructions
© Battaly 2012 11
April 30, 2012
Statistics Home Page
Instructions for Using the Calculator for Statistics
Class Notes©Gertrude Battaly, 2012
Return to TOC
Distributions: Normal, Studentt
Find a zscore for a Given Area
2nd DISTR invNorm(area to left,mean,standard deviation)
Use this for any normal curve. If using the Standard Normal Curve (SNC), the mean = 0 and the standard deviation = 1
eg: To find the zscore for an area of 0.95 to the left (equivalent to finding a zscore for 0.05 area to its right), enter: invNorm(.95,0,1) The result is 1.6449

Calculator Instructions
© Battaly 2012 12
April 30, 2012
Statistics Home Page
Instructions for Using the Calculator for Statistics
Class Notes©Gertrude Battaly, 2012
Return to TOC
Distributions: Normal, Studentt
Find a tscore for a Given Area and degrees of freedom
2nd DISTRinvT(area to left,df)
Notice that the mean and standard deviation are not required. The degrees of freedom, df, accounts for the correct curve.
eg: For a tcurve with df = 10, to find the tscore for an area of 0.95 to the left (equivalent to finding a tscore for 0.05 area to its right), enter: invT(.95,10) The result is 1.8125

Calculator Instructions
© Battaly 2012 13
April 30, 2012
Statistics Home Page
Instructions for Using the Calculator for Statistics
Class Notes©Gertrude Battaly, 2012
Return to TOC
Distributions: Normal, Studentt
Normal Probability Plot
1. STAT / EDIT, enter data in L1 (or other)
2. 2nd StatPlot / Plot 1 (or other)
3. Select ON
4. Type: Normal Probability Plot (bottom right)Click on this to select it.
5. xList: L1 (or other)
6. ZOOM/ STAT
Calculator Instructions
© Battaly 2012 14
April 30, 2012
Statistics Home Page
Instructions for Using the Calculator for Statistics
Class Notes©Gertrude Battaly, 2012
Return to TOC
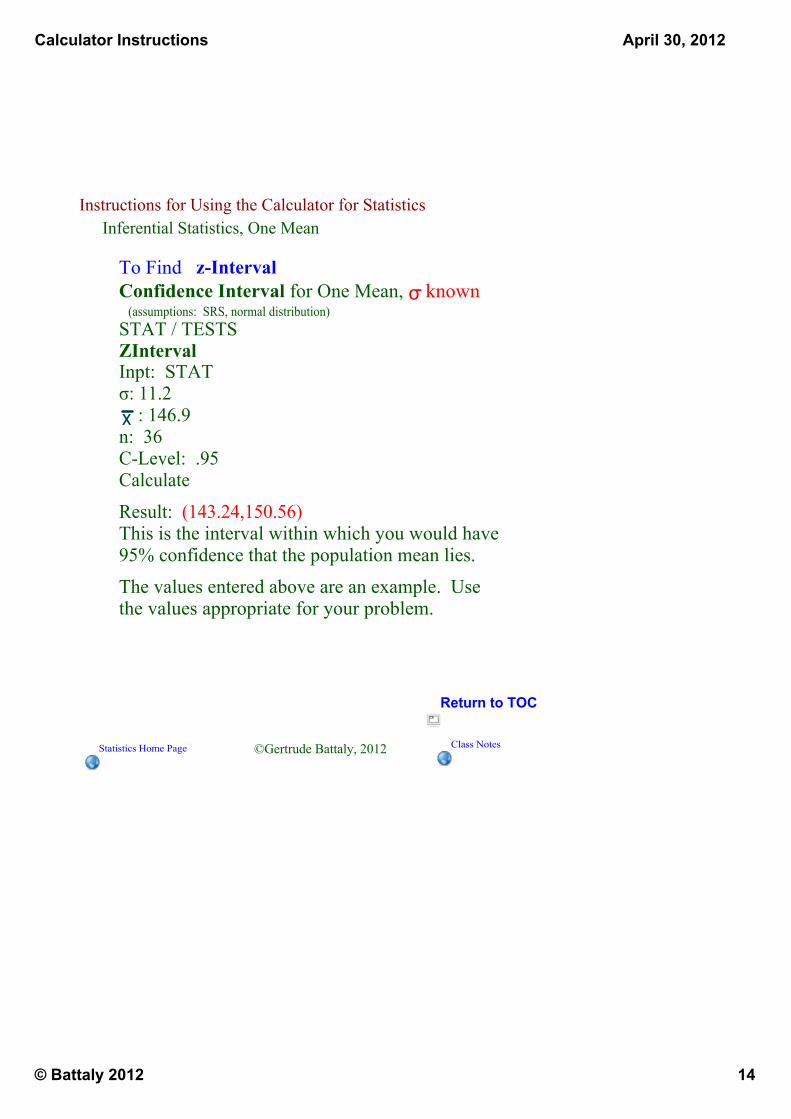
Inferential Statistics, One Mean
To Find zIntervalConfidence Interval for One Mean, σ known (assumptions: SRS, normal distribution)STAT / TESTSZIntervalInpt: STATσ: 11.2 : 146.9n: 36CLevel: .95CalculateResult: (143.24,150.56)This is the interval within which you would have 95% confidence that the population mean lies.The values entered above are an example. Use the values appropriate for your problem.
x

Calculator Instructions
© Battaly 2012 15
April 30, 2012
Statistics Home Page
Instructions for Using the Calculator for Statistics
Class Notes©Gertrude Battaly, 2012
Return to TOC
To Find tIntervalConfidence Interval for One Mean, σ NOT known (assumptions: SRS, normal distribution)STAT / TESTS TIntervalInpt: STAT : 25Sx: 3n: 36CLevel: .95Calculate
x
Result: (23.985,26.015)You can conclude with 95% confidencethat the mean lies within this interval.
Inferential Statistics, One Mean
Calculator Instructions
© Battaly 2012 16
April 30, 2012
Statistics Home Page
Instructions for Using the Calculator for Statistics
Class Notes©Gertrude Battaly, 2012
Return to TOC
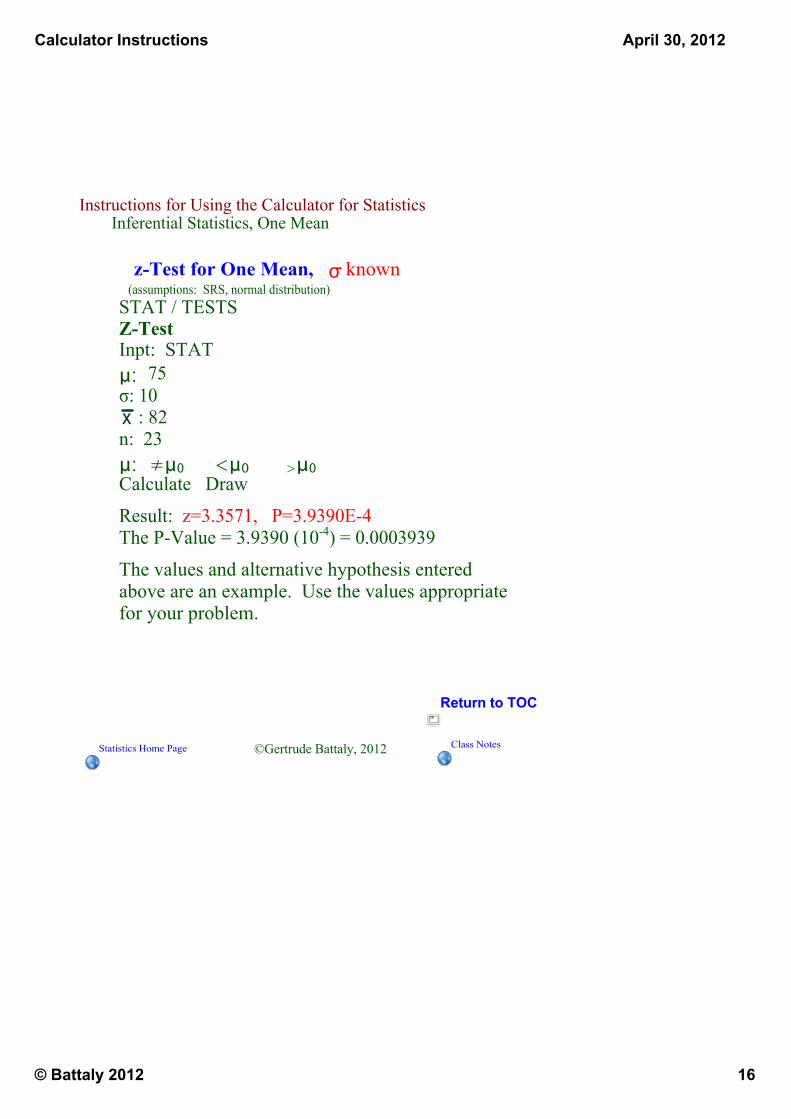
zTest for One Mean, σ known (assumptions: SRS, normal distribution)STAT / TESTSZTestInpt: STATμ: 75σ: 10 : 82n: 23μ: ≠μ0 <μ0 >μ0Calculate DrawResult: z=3.3571, P=3.9390E4The PValue = 3.9390 (104) = 0.0003939The values and alternative hypothesis entered above are an example. Use the values appropriate for your problem.
x
Inferential Statistics, One Mean
Calculator Instructions
© Battaly 2012 17
April 30, 2012
Statistics Home Page
Instructions for Using the Calculator for Statistics
Class Notes©Gertrude Battaly, 2012
Return to TOC
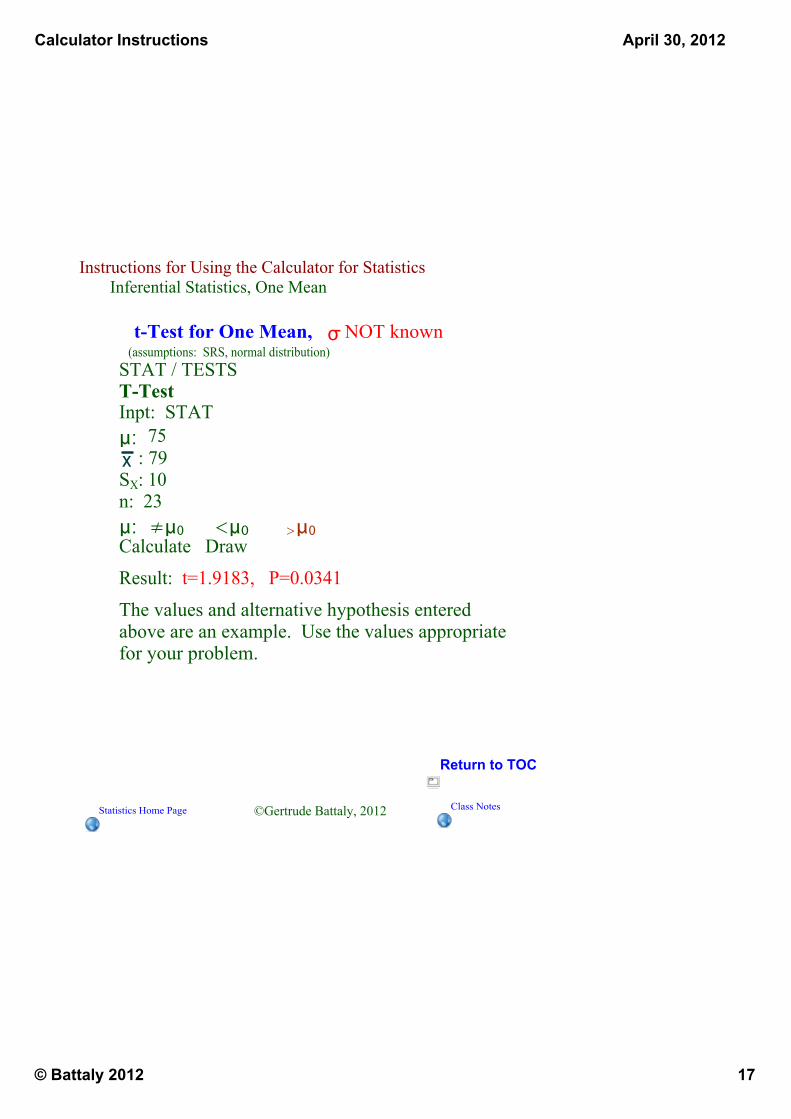
tTest for One Mean, σ NOT known (assumptions: SRS, normal distribution)STAT / TESTSTTestInpt: STATμ: 75 : 79SX: 10n: 23μ: ≠μ0 <μ0 >μ0Calculate DrawResult: t=1.9183, P=0.0341The values and alternative hypothesis entered above are an example. Use the values appropriate for your problem.
x
Inferential Statistics, One Mean

Calculator Instructions
© Battaly 2012 18
April 30, 2012
Statistics Home Page
Instructions for Using the Calculator for Statistics
Class Notes©Gertrude Battaly, 2012
Return to TOC
tTest for Two Means, Pooledσ's EQUAL, but NOT known (assumptions: SRS, normal distribution)STAT / TESTS2SampTTestInpt: STATs 1: 10SX1: 4n1: 15 2: 12SX2: 5n2: 15μ: ≠μ0 <μ0 >μ0Pooled: No YesCalculate DrawResult: t=1.2097, P=0.11825, df=28, pooled S= 4.5277The values and alternative hypothesis entered above are an example. Use the values appropriate for your problem.
x
x
Inferential Statistics, Two Means

Calculator Instructions
© Battaly 2012 19
April 30, 2012
Statistics Home Page
Instructions for Using the Calculator for Statistics
Class Notes©Gertrude Battaly, 2012
Return to TOC
tTest for Two Means, NonPooledσ's NOT equal, but NOT known (assumptions: SRS, normal distribution)STAT / TESTS2SampTTestInpt: STATs 1: 10SX1: 2n1: 15 2: 12SX2: 5.5n2: 15μ: ≠μ0 <μ0 >μ0Pooled: No YesCalculate DrawResult: t = 1.3236, P=0.10127, df=17.639
The values and alternative hypothesis entered above are an example. Use the values appropriate for your problem.
x
Inferential Statistics, Two Means
x

Calculator Instructions
© Battaly 2012 20
April 30, 2012
Statistics Home Page
Instructions for Using the Calculator for Statistics
Class Notes©Gertrude Battaly, 2012
Return to TOC
Paired t Test (assumptions: SRS, normal differences or large sample)1. Enter Before data in L1 and After data in L2.2. In the header for L3, type: L1 L3 / ENTER L3 will fill in with the difference of the L1 and L2 values. If you change any values in L1 or L2, you need to repeat this step.3. STAT / TESTS TTest Inpt: DATA μ: 0 LIST: L3 SX: 10 μ: ≠μ0 <μ0 >μ0 Calculate Use the Alternative Hypothesis appropriate for your problem.
Inferential Statistics, Two Samples

Calculator Instructions
© Battaly 2012 21
April 30, 2012
Statistics Home Page
Instructions for Using the Calculator for Statistics
Class Notes©Gertrude Battaly, 2012
Return to TOC
ChiSquared GoodnessofFit (assumptions: SRS, all expected freq >1, at most 20% of expected <5)
Inferential Statistics, ChiSquared Tests
1. Enter observed data into L1
5. STAT/TESTS/ χ2 GOFTest Observed: L1 Expected: L3 df: #categories 1 CALCULATE
2. Enter expected probabilities into L23. Find Ʃx, the sum of observed values
Calculator: χ2 GOF Test
4. In the header for L3, compute np: L2 x ( Ʃx ) (expected values)
1. Enter observed data into L1
5. In header for L4, compute indiv χ2
(O E)2 / E, or (L1L3)2 /L3 using column headings
2. Enter expected probabilities into L23. Find Ʃx, the sum of observed values4. In the header for L3, compute np: L2 x ( Ʃx ) (expected values)
Calculator: χ2 w/o GOF Test
6. STAT/CALC/1Variable Stats/ L4 Find Ʃx This is the test statistic, χ2
7. Use critical value or find p from table.

Calculator Instructions
© Battaly 2012 22
April 30, 2012
Statistics Home Page
Instructions for Using the Calculator for Statistics
Class Notes©Gertrude Battaly, 2012
Return to TOC
ChiSquared GoodnessofFit (assumptions: SRS, all expected freq >1, at most 20% of expected <5)
Inferential Statistics, ChiSquared Tests
Calculator:1. 2nd Matrix/ Edit / [A]2. Enter # of rows, # columns3. Enter observations the red numbers in the table4. STAT/ TESTS/ Χ2Test5. Hit Enter for [A] and for [B]6. Select Calculate Answer will include test statistic, pvalue, and df. Find expected values in matrix B: 2nd Matrix/ Edit / [B]

Calculator Instructions
© Battaly 2012 23
April 30, 2012
Statistics Home Page
Instructions for Using the Calculator for Statistics
Class Notes©Gertrude Battaly, 2012
Return to TOC
Inferential Statistics, Linear Correlation
Correlation tTest (assumptions: population regr. line, =stdev, normal distribution, independent observations)STAT / TESTSLinRegTTestXlist: L1 (list where entered x values)Ylist: L2 (list where entered y values)β and ρ: ≠ 0 < 0 > 0Calculate
Results include:test t, p, df, a and b for regression equation,s, r, r2