INFERENCES FROM CROSS-LISTED FINANCIAL FIRMS · - 5 - under IFRS is goodwill that arose from the...
43
ACCOUNTING STANDARDS AND INFORMATION: INFERENCES FROM CROSS-LISTED FINANCIAL FIRMS * John Ammer Nathanael Clinton Greg Nini ** Board of Governors of the Federal Reserve System Division of International Finance Washington D.C. 20551 This Version: 26 April 2004 * Paper is to be presented at Accounting, Transparency, and Bank Stability conference hosted by the Basel Committee on Banking Supervision, CEPR, and the Journal of Financial Intermediation, 17-18 May 2004. The views expressed here are those of the authors and do not necessarily coincide with those of the Federal Reserve Board of Governors or any other employees of the Federal Reserve System. ** Ammer: 1-202-452-2349, [email protected] ; Clinton: 1-202-452-3168, [email protected] ; Nini: 1-202-452-2626, [email protected]
Transcript of INFERENCES FROM CROSS-LISTED FINANCIAL FIRMS · - 5 - under IFRS is goodwill that arose from the...

ACCOUNTING STANDARDS AND INFORMATION:
INFERENCES FROM CROSS-LISTED FINANCIAL FIRMS*
John Ammer
Nathanael Clinton
Greg Nini **
Board of Governors of the Federal Reserve System
Division of International Finance
Washington D.C. 20551
This Version: 26 April 2004
* Paper is to be presented at Accounting, Transparency, and Bank Stability conference hosted by the Basel Committee on Banking Supervision, CEPR, and the Journal of Financial Intermediation, 17-18 May 2004. The views expressed here are those of the authors and do not necessarily coincide with those of the Federal Reserve Board of Governors or any other employees of the Federal Reserve System. **Ammer: 1-202-452-2349, [email protected]; Clinton: 1-202-452-3168, [email protected]; Nini: 1-202-452-2626, [email protected]

2
Abstract
Publicly traded financial firms within the European Union will be required to adhere to International Accounting Standards (IAS) in their financial reporting beginning in 2005, which may entail a higher degree of financial disclosure than is currently mandated under national accounting standards. A number of European financial firms have previously subjected themselves to additional disclosure by listing their stock on U.S. exchanges, which obligates them to reconcile their financial accounts to U.S. GAAP. Among national accounting systems, U.S. GAAP is considered to be both among the strictest and the most similar to International Financial Reporting Standards (IFRS). To test whether U.S. GAAP reconciliation effectively enhances disclosure, we examine several measures of transparency for the cross-listed firms, relative both to pre-listing measures and to a control sample of firms that have not cross-listed. Our measures include bid-ask spreads, earnings forecast errors, analyst coverage, dispersion in earnings expectations, and agreement between Moody’s and S&P’s bond ratings. We find evidence that cross-listing increases transparency in at least some cases. Our cross-sectional results also distinguish a handful of European financial firms that had already adopted IFRS before the European Commission announced that IAS would be required in the future.

- 3 -
“Bankers and insurers need to fight so that the ayatollahs of mark to market
[accounting] don’t get their way”, Claude Bebear, chairman AXA SA, as
reported by Bloomberg.com on August 7, 2003.
Introduction
The above quote from the chairman of the French insurer AXA is taken from the annual
shareholder meeting, where the chairman was arguing against the movement towards
International Accounting Standards (IAS), which involves greater use of mark-to-market
accounting principles. Publicly traded firms in European Union countries that are currently
using national accounting standards will be required to use IFRS beginning with their 2005
financial statements.1 For its 2002 fiscal year, AXA reported a net income of €949 million
according to French GAAP and a net loss of €2,588 million according to U.S. GAAP, with
much of the €3.5 billion difference attributable to market value accounting in U.S. GAAP.
Table 1 displays net income for fiscal years 2000-2002 for a sample of nineteen European
banks and insurers that are cross-listed on the New York Stock Exchange (NYSE). Securities
and Exchange Commission (SEC) regulations require that cross-listed firms reconcile
elements of their home country accounting statements to U.S. GAAP in a filing of Form 20-F
within 6 months of the home country filing. Using these publicly available figures, we show
1 A handful of European firms that use U.S. GAAP will be permitted to delay their switch to IFRS until their 2007 accounts.
- 4 -
that the 2002 results from AXA are not unique. Across the other eighteen European
financial firms shown in the table, the absolute value of the difference in net income ranges
from -314 percent to +117 percent for the insurance companies and from -226 percent to +57
percent for the banks. The median difference is -18 percent, with a majority of the firms
reporting lower net income under U.S. GAAP. The tendency for lower figures under U.S.
GAAP appears to arise mainly from the impact of market value accounting in a year in which
stock prices declined on average, rather than factors that would necessarily make the U.S.
GAAP the lower measure every year. Net income under U.S. GAAP can be much different
even for firms like Allianz and UBS that compile their initial accounts under IFRS. One
reason is that IAS 39, the IFRS governing treatment of financial instruments, does not
require changes in the market value of assets that are held outside the trading account to
flow through to net income, although these changes are reflected on the balance sheet.2
Table 2 shows reconciliations to U.S. GAAP for shareholder’s equity, which on average
increases the figures somewhat. To the extent that the firms listed here have tended to hold
assets with more unrealized capital gains than unrealized capital losses, market value
accounting may again be responsible for the average difference. Differences in regulatory
capital under home accounting and U.S. GAAP are not always as large as suggested here. For
example, most of the difference between shareholder’s equity for UBS under U.S. GAAP and
2 Firms using IFRS may choose to include market value changes in net income, however, as an enterprise-wide option.

- 5 -
under IFRS is goodwill that arose from the merger between two large banks that created
UBS, which was treated as one bank acquiring the other (for a price in excess of the book
value of the notionally acquired bank’s net assets). Goodwill is not counted as regulatory
capital by U.S. bank regulators. (Under IFRS, the merger was accounted for as a pooling of
interests, so that no goodwill arose.)
We will use this sample of cross-listed European financial firms to make inferences about
the relative transparency of U.S. GAAP versus European home country GAAP.3 To the
extent possible, we will also distinguish a small group of European financial firms that have
prepared financial statements under IFRS. Note that the reconciliation to U.S. GAAP is not
the only means by which a New York listing can induce transparency – U.S. disclosure
requirements are enforced by the Security and Exchange Commission (SEC), with the
possibility of shareholder class actions suits potentially increasing the cost of concealing or
distorting value-relevant information.4
Over the past few years, IFRS have evolved to become progressively similar to U.S.
GAAP, and the IASB and FASB have an active convergence project that is designed to
promote international consistency in accounting standards on a forward-going basis. For
3 Our sample is too small to identify differences in national accounting standards GAAP among European countries. 4 In a study of price movements before and after earnings announcements, Tribukait (2002 or 2003) finds less indirect evidence of insider trading for Mexican firms that have cross-listed on a U.S. stock exchange.

- 6 -
example, changes proposed this year to both standards that would require equity-based
compensation to be treated as a current expense included some coordination between the
two governing bodies. Accordingly, a comparison of outcomes for U.S. GAAP reporting
versus home-country standards offers insight into the likely effects of the upcoming
migration to IFRS. Sovgyra and Theodore (2004) list several implications they expect for the
financial statements of European banks that would be moving from national standards to
IFRS. Generally, the same differences in treatment also arise in a comparison of European
national standards to U.S. GAAP:
• Under IFRS, banks will likely have to consolidate more subsidiaries and special
purpose vehicles, based on the IFRS definition of de facto control, as opposed to
majority voting power.
• More assets will be measured at fair value, including embedded derivatives.
• Criteria for hedge accounting are stricter.
• Fewer securitizations will be able to be moved off the balance sheet.
• Some capital instruments will be re-classified from equity to debt (although
regulatory capital will not be affected).
• The funding status of defined benefit pension plans will be clearer.
• Rules for reserving for credit losses will change.

- 7 -
• Rules for deferred tax assets will change.
• Mergers will be accounted for as acquisitions, but goodwill will not be amortized
mechanically (this is a recent change in IFRS that follows a similar change in U.S.
GAAP).
We focus on financial firms in this paper for several reasons. First, anecdotal evidence
suggests that the differences in accounting treatment can be quite severe for financial firms.
In particular, differences in treatments of accounting areas such as market versus book value,
financial derivatives, hedging, and “off balance sheet” transactions can have significant
effects on the balance sheets and income statements of leveraged, asset-oriented financial
enterprises. Second, prior research has suggested that financial firms are relatively opaque,
making accounting transparency more important.5 Finally, the significant amount of
regulatory oversight that is applied to financial firms is often justified on the basis of
asymmetric information that reduces the efficacy of market-based discipline. Furthermore,
compared to other regulated industries, financial regulation (particularly capital adequacy
standards), not only is typically couched in terms of accounting concepts, but tends to align
regulators’ interests closely with those of at least some outside investors. Accordingly,
interplay between regulatory oversight and accounting standards and their effects is almost
5 Theory concerning the existence of banks often highlights the production of information which is not easily verifiable to outside investors. Empirically, Morgan (2002) found that rating agencies disagree more often for U.S. financials than a comparable set of non-financials.

- 8 -
inevitable, whether as complements or substitutes.
We construct several measures of “market information” and test for significant
differences between European financials firms that are cross-listed and those that only trade
on home exchanges. Additionally, for a set of firms that recently cross-listed, we test for
changes in our measures around the cross-listing date. We view the cross-sectional tests and
time series tests as complementary since each of these empirical strategies has its own
practical advantages and disadvantages. Furthermore, our relatively small sample size
increases the importance of ensuring that our results are robust to choices among alternative
methodological approaches.
First, we draw on the prior literature using earnings estimates (compiled by IBES) to
construct several measures of information based on equity analyst’s forecasts. We measure
the consensus among analysts prior to the actual earnings release, under the assumption that
larger disagreement reflects larger uncertainty. We find that disagreement tends to increase
after cross-listing and that the level of disagreement is higher among cross-listed firms than
the control group, although statistical significance is questionable. We also measure the
accuracy of the forecasts by comparing actual earnings with consensus forecasts and we
compare errors and biases across the two groups. We find that forecast errors increase after
cross-listing but that the level of earnings forecast errors for cross-listed firms is not
significantly different than a control group of financial firms that are listed only in Europe.

- 9 -
Second, we look at disagreement among credit analysts as reflected in differences in bond
credit ratings from Moody’s and S&P. Morgan (2002) found that, among U.S. industries,
credit rating disagreement was most common for banks and insurance companies, further
arguing that this was evidence of the opacity of bank assets. We do not find significant
differences in the current incidence of so-called “split ratings” between cross-listed firms,
IFRS users, and European national standard users.
Finally, we draw upon the market microstructure literature for a market-based measure
of asymmetric information. Among others, Glosten and Milgrom (1985) and Kyle (1985)
have shown that, all else equal, market makers must quote wider spreads if a portion of their
order flow comes from better-informed traders. We collect bid-ask spreads for cross-listed
firms and find that the level of spreads (in the home market) often drops significantly after
cross-listing, suggesting that the adverse-selection component of the spread is reduced by
cross-listing in the United States. This result is further supported by a cross-sectional
comparison of spreads with our control group, and we also find that IFRS users trade at
tighter bid-ask spreads than national standard users, even when controlling for firm size.
The remainder of the paper is organized as follows. The next section reviews the prior
empirical literature that addresses the role of accounting and information. Section 2
introduces the data and hypotheses, and section 3 discusses the results. Section 4 concludes.
1 Literature Review
- 10 -
1.1 Accounting literature comparing cross-listed firms
The relatively modest number of financial accounts that have been prepared under IAS
limits empirical research that assesses it, and prior work has not typically distinguished
between financial and non-financial firms. One recent example is a comparison by
Ashbaugh and Olsson (2002) of IAS and U.S. GAAP by estimating accounting-based stock
valuation models for a sample of non-U.S. foreign firms that are traded in London and report
under one of the two standards. They find that a residual income model fits prices best for
the U.S. GAAP firms, while an earnings capitalization framework works better for the firms
using IAS. This vaguely suggests that investors interpret financial statements prepared under
the two systems in a different way.
Leuz (2002) examines a sample of firms listed in Germany’s Neuer Markt, a trading forum
that was established in the 1990s with listing requirements that made it more accessible to
newer and smaller firms than established European bourses like the Frankfurt exchange. Its
promoters hoped that it would help channel capital to promising high-technology firms in
Europe and thus play a role similar to that of NASDAQ in the United States. Neuer Markt
firms have been required to produce accounts under either IAS or U.S. GAAP. Leuz finds
that bid-ask spreads and trading volume for Neuer Markt firms are not affected by whether
they choose IAS or U.S. GAAP, suggesting that Neuer Markt investors found the two
accounting systems to be equally informative. (Under conventional market microstructure
theory, an opaque accounting system would impede enforced disclosure and tend to increase

- 11 -
the informational advantage of insiders, making it riskier for other market participants to
trade, and thus reducing market liquidity and raise spreads.) As the author acknowledges,
the sample is too limited in its scope and time frame to draw more than cautious
conclusions.6
In an earlier paper, Leuz and Verecchia (2002) employ similar methodology to Leuz
(2002) to assess the impact of listed German firms that switched from German accounting
standard to either IAS or U.S. GAAP, when this was permitted by the German securities
regulator in the late 1990s. They find that firms that moved to a non-German reporting
regime enjoyed narrower bid-ask spreads and higher trading volume, suggesting that
information asymmetry between insiders and outsiders was mitigated by better disclosure.
A number of other authors assess accounting standards in terms of whether the figures
they produce help explain stock prices or returns. This is an indirect way to test of
accounting standards, in the sense that it determines whether investors perceive the
accounting information as being informative, rather than measuring its information content
directly. The methodology is also limited by strong implicit assumptions about the models
that investors use to value stocks. First, in a sample of Swiss companies, Babalyan (2002)
6 In fact, his sample was drawn from a period during which investors, at least ex post, appear not to have been sufficiently discriminating when evaluating “new economy” firms. Subsequently, several Neuer Markt firms became embroiled in scandals related to disclosure and corporate governance questions. With most of the firms performing poorly and liquidity apparently much reduced, the Neuer Markt was closed in 2003.

- 12 -
finds that U.S. GAAP earnings are more value-relevant than figures produced under Swiss
national standards, but does not find a significant difference between Swiss GAAP and IAS.
Second, in a similarly conceived exercise, Eccher and Healy (2000) find that Chinese
investors appear to react no more strongly to IAS accounting information than to figures
produced under local accounting standards. Third, in a study of U.S.-listed firms from
Australia, Canada, and the United Kingdom, Barth and Clinch (1996) find evidence that
home-country and U.S. GAAP information can be complementary, in the sense that
variables unique to each accounting system appear to be value relevant. Fourth, Harris and
Muller (1999), find that reconciliation of earnings from IAS to U.S. GAAP is value-relevant
(although IAS has already evolved substantially since their sample was collected, including
IAS 39).
Ashbaugh and Pincus (2001) use the absolute value of analysts’ forecast errors as a proxy
measure for (lack of) accounting transparency, arguing that large errors reflect a poor
informational environment.7 For a sample of firms in the early 1990s that had not yet
adopted IAS, they find that analyst forecast errors are increasing in the number of differences
between the corresponding national accounting standard and IAS. In addition, absolute
forecast errors decline on average when companies adopt IAS. Similarly, Lang, Lins, and
7 One could also argue that earnings announcements are conveying less information when forecast errors are small; the logic of this approach would be more convincing if there was more direct evidence that smaller forecast errors were associated more information in the forecasts.

- 13 -
Miller (2002) find that the average magnitude of earnings forecast errors decreases for firms
that list in the United States, suggesting that the information environment has improved for
those firms, perhaps because of the required U.S. GAAP reconciliation.
Bailey, Karolyi, and Salva (2002) examine return volatility and trading volume around
earnings announcements both before and after firms cross-list into the U.S. They find robust
results that volume and volatility reactions are larger after cross-listing. They find this result
surprising since increased volatility and volume suggest that more disagreement exists, which
seems inconsistent with cross-listed firms being more transparent. The effect is strongest for
firms from developed markets with relatively weak disclosure requirements.
1.2 Home bias literature
Several recent papers in the literature on home bias produce results consistent with the
notion that the increased disclosure accompanying cross-listing in the United States increases
the attractiveness of the securities. For example, Doidge, Karolyi, and Stulz (2004) find
evidence that, all else equal, prices are higher for cross-listed stocks. In addition, Ammer,
Holland, Smith, and Warnock (2004), in an analysis of comprehensive survey data, find that
listing status is the single most important variable for explaining relative U.S. holdings of
foreign stocks.
1.3 Opaqueness of financial firms
Two recent papers explore the notion that financial firms may be less transparent than
- 14 -
non-financial firms, using U.S. data. Morgan (2002) found that, among U.S. industries, credit
rating disagreement was most common for banks and insurance companies, further arguing
that this was evidence of the opacity of bank assets. On the other hand, the Flannery, Kwan,
and Nimalendran (2002) study of the market microstructure properties U.S. bank holding
companies finds relatively little difference from non-financial firms, controlling for size.
2 Data and Hypotheses
Our goal is to construct a sample of European financial firms that includes firms using
three different accounting standards: cross-listed firms using U.S. GAAP, IFRS users who
fulfill their home country requirements by filing using IFRS, and firms using only their
home country GAAP. After constructing this sample, we collect various data on analyst
earnings estimates and stock trading patterns of our sample.
2.1 Cross-Listed Firms and Comparison Sample
We begin with the Bloomberg European 500 index as our potential universe of firms and
then restrict our attention to firms with an industry group identified as “Banks” or
“Insurance”.8 Next, we use Bloomberg to identify the subset of these firms that are traded on
any U.S. exchange, which identified 21 firms with ADRs that trade on the New York Stock
Exchange (NYSE) : 14 banks (commercial or money center), 7 insurance companies (multi-
8 Our initial search included industry group “Diversified Financials”, but we found only one cross-listed firm in this group. Therefore, we have excluded this group from our analysis, except for a few instances where we could identify that the firm has banking or insurance as their principal business. These firms are part of the control group.

- 15 -
line, life/health, or reinsurance). Next, use the CUSIP from Bloomberg to match our sample
with Datastream, so that we can obtain the Worldscope indicator of accounting standards
(field “Acctg Standards Followed”). We use this indicator to verify the data from Bloomberg
and to identify firms that are currently using IFRS. Finally, we manually inspected the
annual statements of the identified firms to verify the existence of U.S. GAAP accounts (or a
filed 20-F) or to identify the initial year of IFRS usage.9
This exercise produced a set of 21 cross-listed firms and 11 IFRS users representing 10
different European countries. European financials tended to list in the U.S. in the mid to late
1990s, although some of our sample has been listed since the early 1990s. 9 different
countries have firms that are cross-listed, with Austria being the only country with an IFRS
user but no cross-listed firm. The set of IFRS users tended to switch during 1998, 1999, or
2000. Besides EFG Eurobank, the set of IFRS users are from Austria, Germany, or
Switzerland, reflecting the reporting requirements in these particular countries.
Our control group begins with the set of European financial firms that are not identified
as cross-listed or as a user of IFRS. We assume that these firms are only traded on European
exchanges and only file home country GAAP accounts. We limit this sample to firms from
the 10 countries identified in our cross-listed and IFRS sample and to firms with a market
9 One firm (Depfa Bank) was omitted because it had two unique characteristics: it reports under U.S. GAAP despite not being listed in the United States, and it is incorporated in Ireland, despite having its historical roots and principal stock market listing in Germany.

- 16 -
capitalization at least as large as the smallest cross-listed firm.10 This exercise resulted in a set
of 53 firms that form our control group sample. Table 4 reports a breakdown of our sample
by country, accounting standard, and industry. Most importantly, we find that the group of
local accounting firms is sufficiently large and diverse to provide a benchmark for
comparison to cross-listed and IFRS firms.
2.2 IBES Earnings Forecast Data
We use data from the historical I/B/E/S International database to construct several
measures of analyst activity and earnings forecast accuracy, which others have used to make
relative comparisons about the information environments of firms. We match our set of
firms to the IBES data using the IBES ticker provided by Datastream, which we match by
CUSIP from Bloomberg. We focus on a cross-sectional comparison of cross-listed, IFRS, and
local firms rather than on a time series comparison around a change in accounting. Leuz and
Verrecchia (2000) suggest that increased disclosure likely happens well prior to cross-listing
as the actual event simply represents a commitment to future disclosure. Bradshaw and
Miller (2001) document empirically that firms move gradually towards compliance with U.S.
GAAP. Moreover, we use analyst estimates at an annual frequency with relatively few
observations, limiting our ability to identify the relationship between information and a
change in accounting standard.
10 We limited the sample to firms traded on the same set of home exchanges as the set of cross-listed and IFRS firms, but the restriction made no difference.

- 17 -
Cross-sectional comparisons provide a more informative comparison, but identification
relies on the construction of a control group that is otherwise similar to the group of cross-
listed and IFRS firms. Since cross-listing and IFRS reporting are choices made sophisticated
firms, we suspect that the firms differ in other immeasurable ways. We rely on the
assumption that the unobservable differences are not highly correlated with our measures of
information.11
From the IBES Summary and Actual data, we collect aggregate information on the
distribution of analysts’ one year earnings estimates for fiscal years 1998 through 2002. For
the years subsequent to 1998, we use estimates as of the eleventh month of the fiscal year,
typically four prior to the release of actual earnings.12 Obrien and Bhushan (1990) document
that coverage peaks in the eleventh month of the fiscal year. For 1998, we use estimates as of
the first month following the close of the fiscal year, typically two months prior to the
release of actual earnings. We make this adjustment so that both estimates and actual
earnings are reported after the introduction of the Euro at the beginning of 1999. The data
includes the number of estimates, the sample mean and median of the estimates, the sample
maximum and minimum estimates, as well as the actual reported value of earnings per share.
We collect data from Bloomberg on the firms share price around the release date of actual
earnings and normalize earnings estimates by the average share price for the twenty trading
11 Since the value of increased disclosure is not obvious, we do not conjecture about the possible direction of the bias. 12 Nearly all European firms operate on a fiscal year that coincides with the calendar year.

- 18 -
days prior to the release of earnings. Such normalization is common in the literature since it
gives an economic interpretation to the earnings measure and permits comparisons among
firms.1314
We measure the amount of disagreement among analyst forecasts by the range of
estimates (maximum estimate less minimum estimate), normalized by the firms average stock
price prior to the actual report date. We limit the sample to firm-years with at least 5 analyst
estimates and winsorize the measure at the fifth and ninety-fifth percentiles to minimize the
impact of outliers. We interpret larger measures of disagreement as indicating a more
opaque information environment and test the null hypothesis that disagreement does not
vary with cross-listing status or IFRS usage.
We use the analyst forecast error as the primary measure of the information environment
related to a firm. We use the absolute value of the difference between expected earnings and
actual earnings, again standardized by stock price. For expected earnings, we report results
using the sample mean estimate, although results are qualitatively robust to using the sample
median of estimates. We limit the sample to firm-years with at least 5 analyst estimates and
winsorize the measure at the ninetieth percentile to minimize the impact of outliers. We
interpret larger forecast errors as indicating less publicly available information and test the
null hypothesis that forecast errors are not correlated with cross-listing status or IFRS usage.
13 We chose not to standardize by actual earnings since actual earning are often close to zero or negative. 14 All reported results are robust to normalizing by the share price as of the date of earnings release.

- 19 -
Note that analysts are forecasting earnings reported in the accounting standard used
predominately by the firm; so analysts of cross-listed firms are forecasting home country
GAAP earnings, while analysts of IFRS firms are forecasting earnings reported under IAS.
Consequently, our tests must be interpreted as identifying the relationship between
increased accounting disclosure and the a ability to predict earnings under a different
accounting scheme,
We base our statistical tests on OLS regressions that include two accounting dummy
variables (indicating a cross-listed firm or an IFRS user) and a set of control variables. Our
control variables are selected based on prior research on the accuracy of analysts’ forecasts, as
reported in Lang, Lins, and Miller (2003). Most importantly, cross-listed firms tend to be
larger in size than their control group counterparts, so we control for the size of the firm
since prior literature has identified a positive correlation between size and forecast accuracy.
We use the log of the book value of total assets, converted to U.S. dollars, from the year-end
prior to the forecast year. Second, we control for the variability news surrounding the firm
by including the annualized standard deviation of stock returns, computed using daily data
for the same fiscal year as the earnings estimate. Lang and Ludholm (1996) find a negative
correlation between volatility and analyst coverage, while Lang, Lins, and Miller (2003) find
that volatility reduces forecast accuracy. In the forecast error regressions, we include the
absolute value of the annual percentage change in earnings, taken from IBES. Lang and
Ludholm (1996) suggest that forecast errors are likely a result of the magnitude of

- 20 -
information that is disclosed. Since earnings volatility was substantial during our time
period, we include a specification with this variable. The results of this specification can be
interpreted as the relative to a naïve forecasting model of constant expected earnings. In the
disagreement equation, we control for the number of estimates, since the number of analysts
would affect the range of estimates even if forecasts are randomly chosen. Finally, we
include a dummy variable indicating that the intermediary is predominately involved in
insurance, since insurance companies may have unique forecasting properties.
2.3 Credit Ratings
For the bond rating comparison, we use Moody’s and Standard and Poor’s (S&P) ratings
as reported by Bloomberg as of April 14, 2004. For S&P ratings, we collect the Long-Term
Local Currency Issuer Credit Rating, and for Moody’s we use either the Senior Unsecured
Debt Rating or the Issuer Rating15. Ratings from both agencies were available for 43 of the
firms in our sample. The most common reason for exclusion is that ratings from both
agencies are not available.
2.4 Bid-Ask Spreads
We use Bloomberg to gather data on bid and ask prices for each of our sample firms for
every trading day during 2003. These prices are based on quotes on the firm’s home
exchange as of the end of the day. We compute each stock’s daily effective spread as the
15 Moody’s Senior unsecured Debt Rating and Issuer Rating are similarly defined and always matched when both available in our sample.
- 21 -
difference between the ask and bid prices divided by the average of the two prices and
measure the result in basis points. We then discard observations where the spread is
negative and compute the median and trimmed mean of the sample for each firm.16 We use
these variables as our measure of the spread associated with each firm.
Following Flannery, Kwan, and Nimalendran (2004), we collect additional data to
construct other variables likely to affect spreads. We use 2002 year-end book value of assets
to control for variation in firm size. Firm size is likely to affect the amount or quality of
information available about a firm, affecting the adverse selection component of the firm’s
spread. Firm size may also serve as a proxy for competition among market makers in the
firm’s stock. We also compute the inverse of the daily average closing price, since prior
research has shown a positive relationship between spreads and this variable, likely
reflecting fixed costs of market making or constraints imposed by minimum the minimum
tick size. Finally, we compute continuously compounded daily returns from 2002 price data
and compute the annualized standard deviation of returns for each firm in our sample.
Idiosyncratic risk creates inventory risk for market makers, which may affect spreads. We
use prior year data to minimize the potential endogeneity of this variable.
16 We winsorize the sample at the 90th and 95th percentiles to compute trimmed means. Results are robust to the difference.

- 22 -
3 Empirical Results
3.1 Analyst Forecasts
The top part of Table 5 shows summary statistics for the IBES sample. The first three
columns report sample means by accounting standard. On a univariate basis, cross-listed and
IFRS user firms have lower forecast errors, and IFRS users have substantially lower
disagreement among analysts. These firms also tend to have a larger analyst following,
receiving on average five to seven more estimates per firm-year than firms from the control
group. Cross-listed and IFRS users are also substantially larger and have more volatile stock
returns, which likely affect earnings forecasts independently of accounting differences. We
control for these differences in our OLS regressions.
The last six columns of Table 5 show the sample maximum and minimum values for our
control variables so that we can assess the comparability of the control group to the
treatment groups. Other than for firm size, we find that local accounting firms have
sufficient variation to prove comparable to both cross-listed and IFRS user firms. However,
the largest cross-listed firms and IFRS users are substantially larger than their largest local
accounting peers. Consequently, besides addition to controlling for size in the regressions,
we test the robustness of our results by limiting the sample of treatment groups to smaller
firms.
Table 6 reports the results of our multivariate tests of forecast errors and analyst

- 23 -
disagreement. Most significantly, the dummy variables identifying a cross-listed firm or
IFRS user are significantly negative, indicating that analyst forecast errors have been
significantly smaller than their local accounting peers during this sample period. The sample-
wide average error is roughly 16 percent, so the 8 to 9 percent reduction for cross-listed and
IFRS users is economically significant. Additionally, p-values suggest that such a result is not
likely due to random chance, which wee view as a significant result considering our small
sample size. Results from a Wald test suggest that the effects of cross-listing and IFRS usage
are not different from each other.
In the range of estimates regression, the results suggest that accounting differences do not
significantly affect the level of agreement among analysts. The coefficient on the cross-listed
dummy variable is statistically and economically close to zero; and while the estimated
coefficient on IFRS usage is quite negative, the estimate carries a large standard error and is
not statistically different from zero at conventional confidence levels. The combined
regression results suggests that analysts tend to view available information consistently across
firms (who are large, European banks and insurance companies) with different accounting
standards but that the additional disclosure required under U.S. GAAP and IAS improve
analysts ability to forecast future earnings.
The effect of the control variables in the two regressions is also interesting. Insurance
companies tend to be more opaque than their banking peers, as reflected in more
disagreement among analysts and larger forecast errors. This suggests that insurance

- 24 -
liabilities are potentially more opaque than banking assets, at least after controlling for
information released in accounting statements. Firm specific volatility, as measured by the
standard deviation of stock returns, significantly increases both disagreement and forecast
errors, as we would expect for firms with more earnings uncertainty. The absolute value of
the change in yearly earnings has a significant positive effect on forecast errors, suggesting
that errors are positively related to the amount of news released. Due to the potential
endogeneity of this variable, results are shown excluding this control, and the results are
robust. Finally, firm size has a statistically significant and positive effect on forecast errors,
which is different than typically found in other studies of forecast errors (e.g. Lang, Lins, and
Miller (2003)). We suspect this difference is due to our sample being composed of financial
firms, which may become more opaque as they increase in size. Corroborating evidence is
given by analyst disagreement, which also increases with firm size.
3.2 Bid-Ask Spreads
Table 7 reports average effective bid-ask spreads for a sample of cross-listed firms before
and after the cross-listing. We compute mean spreads for 180 days before and after the date
of cross-listing, excluding the 30 days around cross-listing, resulting in two means each based
on 165 trading days. We exclude the days around cross-listing since the date of initial 20-F
filing is ambiguous and the release of information is likely not a discrete event. We choose a
relatively long window to compute averages to ensure that much of the sample is under each
regime. As a robustness check, we have verified that average spreads do not display a long

- 25 -
term trend that would influence our results.17
The results indicate that cross-listed firms experience a significant decrease in spreads
around the time of cross-listing. The median (mean) decrease in spreads is nearly 7 (14) basis
points, representing a 21 (20) percentage point decrease from pre-cross-listing levels. Many
of these differences are statistically significant, and the sample of p-values appears not to be
drawn from a uniform distribution. Interestingly, two of the three firms using IFRS
accounting (UBS and Allianz) are part of the group of firms that do not experience a decrease
in spreads around cross-listing, suggesting that the difference between IFRS and U.S. GAAP
is small, particularly relative to the difference between U.S. GAAP and home country
accounting standards.
It is conceivable that the decreases in bid-ask spreads that are documented in Table 7 are
driven by some factor other than disclosure that is associated with U.S. cross-listing. In
particular, Weston (2000) notes that rents accruing to market-makers as a result of market
power can potentially affect spreads. It is conceivable that one by-product of cross-listing is
increased competition for European market-makers in our sample of stocks. While not a
formal test, we collect spreads from the U.S. exchange (NYSE) to compare with spreads on
the home market. We collect the spreads as of a particular time, the morning of April 15,
2004, a day chosen at random. The quoted spreads from Bloomberg are reported in Table 8.
17 Although we do not formally control for changes in the spreads of local accounting firms, we checked that they do not display a long term trend. Since our sample of cross-listed firms actually cross-list at different times, only a long term trend would systematically confound the results.

- 26 -
On average, spread on the home exchange are very close to spread quoted in the U.S.
The median difference suggests that the home country spreads are slightly lower by 4 basis
points. Additionally, the daily average volume, taken over the prior 6 months, is very small
in the U.S. compared to the volume traded on home exchanges, with the median ratio of
NYSE volume to home exchange volume under 3 percent. We view this empirical evidence,
combined with the fact that these markets are only open concurrently for a small portion of
each day, as suggesting that the increased competition from NYSE market makers is likely
small and unlikely to explain the large changes in spreads that we observe.
Table 9 shows the results of our cross-sectional comparison of spreads during 2003. We
control for the size of the firm with the log of assets from the prior year and for the inverse
of the average price during 2003. We also include a dummy variable indicating the firm is an
insurance company and include a specification with and without a control for firm specific
volatility in returns.
Focusing on the dummy variables for cross-listed and IFRS firms, we find empirical
evidence that these firms have lower spreads than comparable firms that use only local
accounting. The estimated coefficients suggest that cross-listed firms carry spreads that are
roughly 14 basis points lower than comparable firms, while the difference for IFRS firms is
roughly 23 basis points. A Wald test indicates that the difference between cross-listed firms
and IFRS firms is not statistically significant. The size of the estimated effect is economically
important, representing a nearly 30 percent decrease from spreads on home country only

- 27 -
stocks. Importantly, the estimated cross-sectional impact is quite close to the effect
estimated from the change in spreads around cross-listing. The failure to find a cross-
sectional difference between IFRS firms and cross-listed firms is consistent with the lack of a
significant change for UBS and Allianz around cross-listing.
3.3 Credit Ratings
In a study comparing credit ratings of U.S. corporate bonds assigned by Moody’s and
S&P, Morgan (2002) finds that the two agencies disagree by at least one notch 62.9 percent of
the time for bank bonds, compared to 50.0 percent for issuers from other industry sectors.
(For the insurance industry, the incidence of disagreement is also higher than for non-
financial firms, although there are much fewer insurance bonds in Morgan’s sample.) He
argues that the difference arises from banks having balance sheets that are less transparent to
outsiders. We undertake an analogous comparison of rating disagreement for the 43
European firms in our sample that are rated by both agencies. If cross-listing increases
transparency, then by Morgan’s logic, Moody’s and S&P’s ratings ought to correspond more
closely for the cross-listed firms. For S&P ratings, we collect the Long-Term Local Currency
Issuer Credit Rating, and for Moody’s we use either the Senior Unsecured Debt Rating or the
Issuer Rating18. Using ratings as of April 14, 2004 as reported on Bloomberg, we find “split
18 Moody’s Senior unsecured Debt Rating and Issuer Rating are similarly defined and they always matched when both available in our sample. The exercise relies on a widely accepted notion that there is a one-to-one mapping between Moody’s and S&P’s ratings. In practice, historical default rates on rated have differed somewhat for the corresponding rating levels, although for investment-grade ratings (for which near-term defaults are very rare events) the differences are too small to be statistically reliable. Except for Moody’s rating
- 28 -
ratings” for 11 of 14 cross-listed firms (78.6 percent) and for 22 of 29 that are not cross-listed
(75.9 percent), virtually the same proportions. The proportions are somewhat higher than
Morgan’s figure for U.S. banks, suggesting that European banks are less transparent than U.S.
banks, perhaps because the supervision and regulation of either banks or of issuers of
securities is less effective in Europe than in the United States. However, there are a number
of caveats, including the different sample period.
The estimation results in Table 8 formalize the lack of a cross-listing effect on rating
disagreement. The first two columns report the results of probit models for “split” ratings.
In the second specification, we also test for whether IFRS use affects ratings disagreement
and control for whether the firm focuses on banking or insurance. All of the right-hand side
variables are binary dummies, so we can report them in terms of the percentage impact of a
unit change (starting from a case in which all dummies are zero) in the variable on the
probability of a split rating; the intercept is the estimated probability when all the dummies
are zero. Thus, for example, our point estimates in the first equation reflect the fact that 78.6
percent of our cross-listed firms had split ratings (75.9 percent plus 2.7 percent). Other than
the intercept (where the P-value is for a null hypothesis of 50%), none of the coefficients are
even close to being statistically significant at conventional confidence levels.
The last column reports an ordered probit for the absolute difference in ratings. The
of Scor SA, our sample is investment-grade, and mostly in the A to Aa/AA range.
- 29 -
sample here includes 24 firms where the ratings differ by one notch and 8 firms where the
ratings differ by two notches. Only Scor SA (which is cross-listed) has a difference of more
than two notches (with Moody’s rating it four notches lower than S&P); for practical reasons,
it is excluded from the ordered probit. The first intercept reflects the probability that the
absolute difference is zero, and the second intercept reflects the probability that the
difference is either zero or one. We find no evidence that cross-listing reduces credit rating
differences. Our point estimate suggests that IFRS use reduces rating disagreements, but
with only four IFRS user firms in the sample, the result is a long way from statistical
significance.
4 Conclusions
Overall, we find substantial evidence that the mandatory reconciliation to U.S. GAAP
accompanying a U.S. equity listing has engendered a significant improvement in the
transparency of European financial firms, at least in some cases. Moreover, firms currently
using IFRS appear to have a similar degree of transparency to those firms already cross-listed.
This suggests that Europe’s move toward International Accounting Standards should have a
similar effect on firms that will be converting their financial reporting to IFRS next year.
For European insurance companies, further improvements in disclosure are likely a little
later on. At present, International Accounting Standards offer relatively little guidance for
how to report insurance-specific assets and liabilities (although IAS 39 has covered financial

- 30 -
instruments more generally since 2001). However, the International Accounting Standards
Board is working on a comprehensive insurance standard that it hopes will be finished in
time to be implemented in 2007.

31
5 References
Ammer, John, Sara B. Holland, David C. Smith, and Francis E. Warnock (2004), “Look at me Now: The Role of Cross-Listing in Attracting U.S. Shareholders,” International Finance Discussion Paper, Federal Reserve Board (forthcoming).
Ashbaugh, Hollis and Per Olsson (2002), “An Exploratory Study of the Valuation Properties of Cross-Listed Firms’ IAS and U.S. GAAP,” Accounting Review (January).
Ashbaugh, Hollis and Morton Pincus (2001). “Domestic Accounting Standards, International Accounting Standards, and the Predictability of Earnings,” Journal of Accounting Research 39(3):417-437.
Babalyan, Levon (2002), “Association Between Accounting Earnings and Stock Returns as a Measure of Value Relevance of Accounting Standards: Empirical Evidence from the Swiss Market,” working paper, University of Fribourg.
Bailey, Warren, G. Andrew Karolyi, and Carolina Salva (2002), “The Economic Consequences of Increased Disclosure: Evidence from International Cross-listings,” working paper, version 13 December 2004.
Ball, Ray, Ashok Robin, and Joanna Shuang Wu (2000), “Incentives versus Standards: Properties of Accounting Income in Four East Asian Countries, and Implications for Acceptance of IAS,” Simon School of Business Working Paper FR 00-04, University of Rochester (March).
Barth, Mary E. and Gregory J. Clinch (1996), “International Accounting Differences and their Relation to Share Prices: Evidence from U.K., Australian, and Canadian Firms,” Contemporary Accounting Research 13(1), Spring.
Doidge, C., G.A. Karolyi, and R. Stulz, 2004. Why are foreign firms listed in the U.S. sorth more? Journal of Financial Economics 71, 205-238.
Eccher, Elizabeth A. and Paul M. Healy (2000), “The Role of International Accounting Standards in Transitional Economies: A Study of the People’s Republic of China,” working paper, Massachusetts Institute of Technology.
Exton, Lynn (2004), “Transition and Bridging: The European Insurance Sector Moves towards IFRS,” Moody’s Investor Service, February 2004.
Flannery, Mark J., Simon H. Kwan, and M. Nimalendran (2002), “Market Evidence on the
32
Opaqueness of Banking Firms’ Assets,” Journal of Financial Economics, forthcoming.
Francis, Jere R., Inder K. Khurana, and Raynolde Pereira (2001), “Investor Protection Laws, Accounting, and Auditing Around the World,” working paper, University of Missouri.
Gagnon, Louis and G. Andrew Karolyi (2004), “Multi-Market Trading and Arbitrage,” working paper, Ohio State University (January 25).
Glosten, Lawrence R. and Paul R. Milgrom (1985), “Bid, Ask, and Transaction Prices in a Specialist Market with Heterogeneously Informed Traders,” Journal of Financial Economics 14(1):71-100.
Harris, Mary S. and Karl A. Muller III (1999), “The market valuation of IAS versus US-GAAP accounting measures using Form 20-F reconciliations,” Journal of Accounting and Economics 26:285-312.
Huddart, Steven, John Hughes, and Markus Brunnermeier (1999), “Disclosure requirements and stock exchange listing choice in an international context” Journal of Accounting and Economics 26: 237-269.
Huang, Roger D. and Hans R. Stoll (1997), “The Components of the Bid-Ask Spread: A General Approach,” Review of Financial Studies 10(4):995-1034 (Winter).
Kyle, Albert S. (1985), “Continuous Auctions and Insider Trading,” Econometrica 53(6):1315-1336 (November).
Lang, Mark H., Karl V. Lins, and Darius Miller (2003), “ADRs, analysts, and accuracy: Does cross listing in the U.S. improve a firm’s information environment and increase market value?” The Journal of Accounting Research 41.
Lang, Mark H. and R. Lundholm (1993), “Cross-Sectional Determinants of Analyst Ratings of Corporate Disclosures,” Journal of Accounting Research, 246-271.
Lang, Mark H. and R. Lundholm (1996), “Corporate Disclosure Policy and Analyst Behavior,” The Accounting Review, 467-492.
Leuz, Christian (2002), “IAS versus US GAAP: Information-Asymmetry Based Evidence from Germany’s New Market,” working paper, University of Pennsylvania.
Leuz, Chritsian and Robert Verrecchia (2000), “The economic consequences of increased disclosure” Journal of Accounting Research 38: 91-124.
Morgan, Donald P. (2002), “Rating Banks: Risk and Uncertainty in an Opaque Industry,”

33
American Economic Review 92: 874-888.
O’Brien, P. and R. Bhushan (1990), “Analyst follwing and institutional holding” Journal of Accounting Research, 55-76.
O’Brien, James (2001), “The Use of Bank Internal Rating Systems for Loan Fair Valuation,” working paper, Federal Reserve Board (December).
Sovgyra, Yaroslav and Samuel S. Theodore (2004), “Expected Impact of International Financial Reporting Standards (IFRS) on European Banks,” Moody’s Investor Service, February 2004.
Stickney, Clyde P. (2002), “Recent Changes in Financial Reporting Standards,” working paper, Dartmouth College (June).
Weston, James P. (2000), “Competition on the NASDAQ and the Impact of Recent Market Reforms,” Journal of Finance 55(6):2565-2598 (December).

TABLE 1. NET INCOME UNDER ORIGINAL ACCOUNTING AND UNDER U.S. GAAP
All values are taken from fiscal year 2002 annual reports. Original and U.S. GAAP net income are reported in original currency (millions). The difference ("Diff.") reported for FY2002 is the percentage difference of U.S. GAAP net income from original net income. The "Coef. Of Variation" reports the standard deviation of net income divided by the maximum net income over the three years, reported in percentage terms. Allianz AG and UBS AG use IFRS as original accounting standards.
Intermediary Country Industry Original U.S. Diff. Original U.S. Original U.S. Original U.S.National Bank of Greece SA Greece Banking 213 127 -41 484 205 40 27Allied Irish Bank plc Ireland Banking 1,019 929 -9 730 630 636 571 20 21Bank of Ireland plc Ireland Banking 895 667 -25 731 689 693 628 12 4Sanpaolo IMI SpA Italy Banking 889 -1,120 -226 1,203 571 1,292 1,003 16 100ABN Amro Holding NV Netherlands Banking 2,207 2,110 -4 3,230 1,346 2,498 2,570 16 24Banco Bilbao Vizcaya Argentaria SA Spain Banking 20,255 16,917 -16 15,335 15,620 14,904 9,510 15 23Banco Santander Central Hispano SA Spain Banking 2,786 2,287 -18 3,327 2,177 3,059 2,009 8 6Credit Suisse Group Switzerland Banking -3,309 -4,741 -43 1,587 -446 5,785 4,804 79 100UBS AG* Switzerland Banking 3,535 5,546 57 4,973 3,234 7,792 4,437 28 21Barclays plc U.K. Banking 2,230 2,476 11 2,465 2,695 2,473 2,195 6 9HSBC Holdings plc U.K. Banking 6,239 4,900 -21 4,992 4,911 6,457 6,236 12 12Lloyds TSB Group plc U.K. Banking 1,781 1,751 -2 2,229 1,632 2,654 1,986 16 9Axa SA France Insurance 949 -2,588 -373 520 356 3,904 3,248 47 90Scor SA France Insurance -455 77 117 -278 -365 59 -561 57 58Allianz AG* Germany Insurance -1,229 -1,260 -3 1,585 4,246 3,448 6,519 68 61Aegon NV Netherlands Insurance 1,547 -2,230 -244 2,397 632 2,066 2,588 18 94ING Groep NV Netherlands Insurance 4,500 -9,627 -314 4,577 1,770 11,984 10,925 36 94Prudential plc U.K. Insurance 314 -357 -214 460 -408 591 502 23 102Royal & Sun Alliance Group plc U.K. Insurance -940 -726 23 -889 -280 -86 474 51 84
Mean -71 30 49Median -18 20 27
Fiscal Year 2002 Coef. of VariationFiscal Year 2001 Fiscal Year 2000

TABLE 2. SHAREHOLDERS EQUITY UNDER ORIGINAL ACCOUNTING AND UNDER U.S. GAAP
All values are taken from fiscal year 2002 annual reports. Original and U.S. GAAP shareholders’ equity are reported in original currency (millions). The difference ("Diff.") reported for FY2002 is the percentage difference of U.S. GAAP shareholders’ equity from original shareholders’ equity. The "Coef. Of Variation" reports the standard deviation of shareholders’ equity divided by the maximum shareholders’ equity over the three years, reported in percentage terms. Allianz AG and UBS AG use IFRS as original accounting standards.
Intermediary Country Industry Original U.S. Diff. Original U.S. Original U.S. Original U.S.National Bank of Greece SA Greece Banking 2,584 1,367 -47 2,578 1,358 1,237 0 5Allied Irish Bank plc Ireland Banking 4,408 5,963 35 4,871 5,716 4,734 5,050 5 8Bank of Ireland plc Ireland Banking 4,200 4,280 2 3,830 4,141 3,305 3,727 11 7Sanpaolo IMI SpA Italy Banking 10,537 14,934 42 8,476 11,607 8,050 11,639 13 13ABN Amro Holding NV Netherlands Banking 26,314 19,013 -28 29,451 20,856 27,247 20,222 5 4Banco Bilbao Vizcaya Argentaria SA Spain Banking 236,767 252,466 7 234,785 256,775 235,485 252,466 0 1Banco Santander Central Hispano SA Spain Banking 24,817 23,114 -7 28,047 29,944 27,273 30,929 6 14Credit Suisse Group Switzerland Banking 28,517 34,412 21 35,800 44,896 40,951 49,906 15 16UBS AG* Switzerland Banking 38,991 55,576 43 43,530 59,282 7 4Barclays plc U.K. Banking 15,205 16,015 5 14,485 14,813 3 5HSBC Holdings plc U.K. Banking 52,406 55,831 7 46,388 48,444 8 9Lloyds TSB Group plc U.K. Banking 7,972 10,190 28 10,356 13,533 16 17Axa SA France Insurance 23,711 23,875 1 24,780 29,340 24,322 31,561 2 13Scor SA France Insurance 1,288 1,395 8 1,318 1,310 1,070 1,145 10 9Allianz AG* Germany Insurance 21,673 22,836 5 31,613 31,655 35,592 35,102 20 18Aegon NV Netherlands Insurance 14,231 17,554 23 15,923 20,669 12,844 18,965 10 8ING Groep NV Netherlands Insurance 18,300 25,100 37 21,500 38,800 25,300 42 14 51Prudential plc U.K. Insurance 3,668 4,878 33 3,950 5,964 3,971 6,455 4 13Royal & Sun Alliance Group plc U.K. Insurance 2,918 2,600 -11 4,566 4,377 5,911 5,767 25 28
Mean 11 9 13Median 7 8 9
Fiscal Year 2002 Coef. of VariationFiscal Year 2001 Fiscal Year 2000

TABLE 3. SAMPLE OF CROSS-LISTED AND IFRS EUROPEAN FINANCIAL FIRMS
Cross-listed firms are identified by Bloomberg as being listed on a U.S. exchange. IFRS firms are identified by Thomson Worldscope and confirmed by inspection of annual reports. Country and industry group are from Bloomberg.
Intermediary Country IndustryDate of Cross-Listing
First Year of IFRS
Axa SA France Insurance 25-Jun-1996Scor SA France Insurance 10-Oct-1996Deutsche Bank AG Germany Banking 3-Oct-2001 1995Allianz AG Germany Insurance 3-Nov-2000 1998National Bank of Greece Greece Banking 18-Oct-1999Allied Irish Bank plc Ireland Banking 28-Nov-1990Bank of Ireland plc Ireland Banking 17-Sep-1996Sanpaolo IMI Italy Banking 2-Nov-1998ABN Amro Holding NV Netherlands Banking 21-Apr-1997Aegon NV Netherlands Insurance 5-Nov-1991ING Groep NV Netherlands Insurance 13-Jun-1997Banco Santander Central Hispano SA Spain Banking 30-Jul-1987Banco Bilbao Vizcaya Argentaria SA Spain Banking 14-Dec-1988UBS AG Switzerland Banking 16-May-2000 1998Credit Suisse Group Switzerland Banking 25-Sep-2001Converium Holding AG Switzerland Insurance 11-Dec-2001Barclays plc U.K. Banking 9-Sep-1986HSBC Holdings plc U.K. Banking 16-Jul-1999Lloyds TSB Group plc U.K. Banking 27-Nov-2001Prudential plc U.K. Insurance 28-Jun-2000Royal & Sun Alliance Group U.K. Insurance 24-Oct-2000
Bank Austria Creditanstalt Austria Banking 2000Erste Bank Der Oester Spark Austria Banking 1999Commerzbank AG Germany Banking 1998Bayerische Hypo-Und Vereinsbank AG Germany Banking 1998AMB Generali Holding AG Germany Insurance 1999Muenchener Rueckver Germany Insurance 1999EFG Eurobank Ergasias Greece Banking 2000Julius Baer holding AG Switzerland Banking 1995Baloise Holding Switzerland Insurance 2000Swiss Life Holding Switzerland Insurance 2000Zurich Financial Services Switzerland Insurance 1999

TABLE 4. COMPARISON OF CROSS-LISTED, IFRS, AND CONTROL GROUP SAMPLE
Table reports accounting standard as of year end 2002. Cross-listed and IFRS users are identical to those reported in Table 3. The control group of local accounting standards firms is based on the set of banking and insurance firms from the ten countries in Table 3 that are in the Bloomberg European 500 Index. A few firms in Bloomberg’s “Diversified Financials” industry group were included because the description page indicated their principal business was either banking or insurance.
Country LocalCross-Listed
IFRS User Total Banking Insurance
Austria 1 0 2 3 2 1U.K. 11 5 0 16 10 6France 5 2 0 7 4 3Germany 5 2 4 11 7 4Greece 3 1 1 5 5 0Ireland 1 2 0 3 3 0Italy 21 1 0 22 16 6Netherlands 0 3 0 3 1 2Spain 4 2 0 6 5 1Switzerland 2 3 4 9 4 5
Total 53 21 11 85 57 28
Accounting Standard Industry
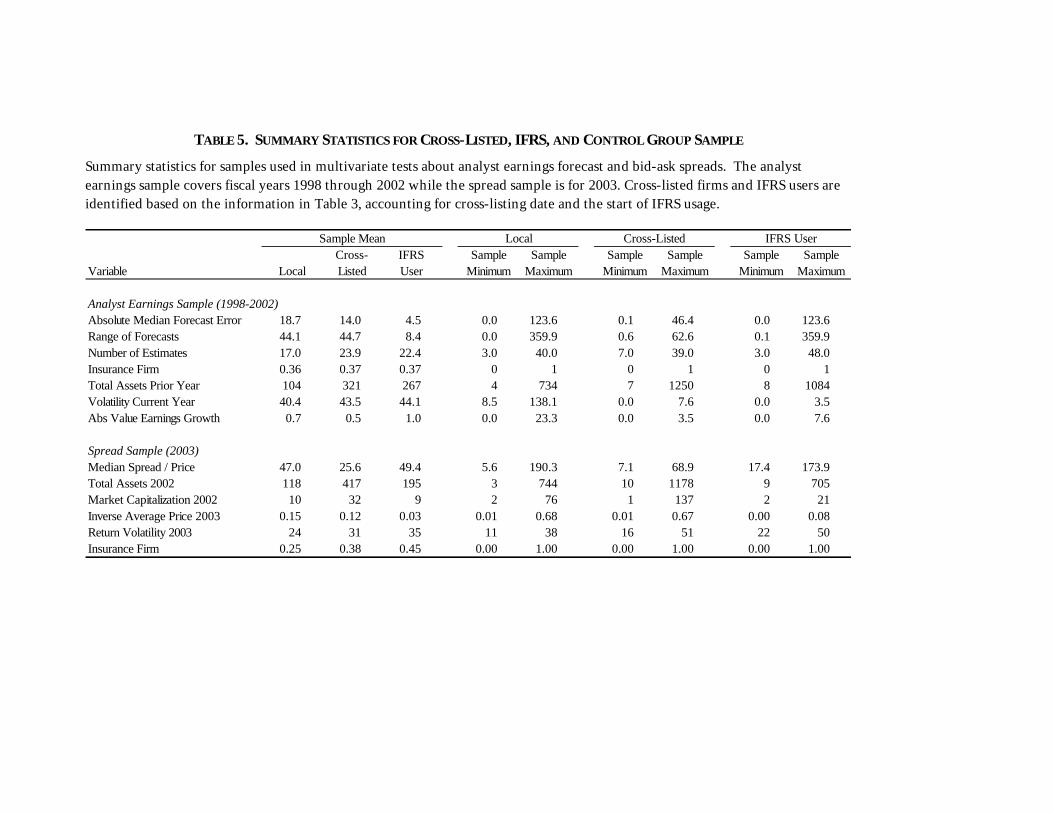
TABLE 5. SUMMARY STATISTICS FOR CROSS-LISTED, IFRS, AND CONTROL GROUP SAMPLE
Summary statistics for samples used in multivariate tests about analyst earnings forecast and bid-ask spreads. The analyst earnings sample covers fiscal years 1998 through 2002 while the spread sample is for 2003. Cross-listed firms and IFRS users are identified based on the information in Table 3, accounting for cross-listing date and the start of IFRS usage.
Variable LocalCross- Listed
IFRS User
Sample Minimum
Sample Maximum
Sample Minimum
Sample Maximum
Sample Minimum
Sample Maximum
Analyst Earnings Sample (1998-2002)Absolute Median Forecast Error 18.7 14.0 4.5 0.0 123.6 0.1 46.4 0.0 123.6Range of Forecasts 44.1 44.7 8.4 0.0 359.9 0.6 62.6 0.1 359.9Number of Estimates 17.0 23.9 22.4 3.0 40.0 7.0 39.0 3.0 48.0Insurance Firm 0.36 0.37 0.37 0 1 0 1 0 1Total Assets Prior Year 104 321 267 4 734 7 1250 8 1084Volatility Current Year 40.4 43.5 44.1 8.5 138.1 0.0 7.6 0.0 3.5Abs Value Earnings Growth 0.7 0.5 1.0 0.0 23.3 0.0 3.5 0.0 7.6
Spread Sample (2003)Median Spread / Price 47.0 25.6 49.4 5.6 190.3 7.1 68.9 17.4 173.9Total Assets 2002 118 417 195 3 744 10 1178 9 705Market Capitalization 2002 10 32 9 2 76 1 137 2 21Inverse Average Price 2003 0.15 0.12 0.03 0.01 0.68 0.01 0.67 0.00 0.08Return Volatility 2003 24 31 35 11 38 16 51 22 50Insurance Firm 0.25 0.38 0.45 0.00 1.00 0.00 1.00 0.00 1.00
Local Cross-Listed IFRS UserSample Mean

TABLE 6. MULTIVARIATE TEST OF EARNINGS FORECAST ERROR AND DISPERSION
The dependent variable is either the absolute value of the difference between the median forecast and actual earnings or the difference between the maximum and minimum forecasts. Both variables are standardized by the average stock price for the 20 trading days prior to the announcement of actual earnings and measured in percentage points. The sample is a set of firm-year observations treated as a pure cross-section. The Cross-Listed and IFRS User variables are dummies indicating accounting standard, and Insurance Firm is dummy indicating the firm is predominately an insurer. Assets are measured in millions and taken from the year prior to the forecast fiscal year. Volatility is the annualized standard deviation of the firm’s stock return during the fiscal year. Earnings Growth is the percentage point change in yearly earnings, and Number of Estimates is the reported sample size from IBES for each firm-year.
OLS:Range of Forecasts
Intercept -0.95 -2.00 12.43(0.81) (0.60) (0.31)
Cross-Listed -8.31 -8.35 -1.76(0.03) (0.02) (0.82)
IFRS User -9.23 -9.23 -14.44(0.07) (0.06) (0.18)
Insurance Firm 5.56 5.84 15.28(0.06) (0.05) (0.02)
Log Assets Prior Year 2.38 1.99 8.69(0.05) (0.09) (0.00)
Volatility Current Year 0.45 0.47 1.24(0.00) (0.00) <.0001
Abs Value Earnings Growth 1.89(0.02)
Number of Estimates -1.23(0.00)
Country Dummy Variables YES YES YES
Adjusted R-Squared 0.488 0.495 0.626
Wald Test: Cross-Listed=IFRS 0.030 0.020 1.130(0.872) (0.876) (0.288)
Observations 335 347 347
Absolute Median Forecast Error OLS:

TABLE 7. CHANGE IN BID-ASK SPREADS AROUND CROSS-LISTING
Spreads are measured as a proportion of the mid-quote price and reported in basis points. The table reports mean values for 180 trading days before and after the cross-listing date, less the 30 trading days surrounding the date itself. The “Prop. Diff.” column reports the percentage difference relative to the befor mean. P-values are based on a two-tailed t distribution.
Firm Before After Difference Prop. Diff. P-ValueABN Amro 103.0 45.1 -57.8 -56.2 0.0Allianz 38.1 36.7 -1.4 -3.6 30.6AXA 23.0 22.0 -1.0 -4.4 32.4Bank of Ireland 84.2 66.5 -17.7 -21.0 0.0Credit Suisse Group 11.5 14.9 3.5 30.3 90.3Deutsche Bank 27.7 21.0 -6.7 -24.2 0.0HSBC 44.7 41.7 -3.0 -6.6 24.3ING 52.3 27.6 -24.7 -47.3 12.2Lloyds Group 24.9 19.5 -5.4 -21.7 2.3National Bank of Greece 46.1 39.2 -6.9 -14.9 6.3Prudential 72.5 36.9 -35.6 -49.1 0.0Royal & Sun Alliance 59.6 37.1 -22.5 -37.7 0.0San Paolo 70.9 59.7 -11.2 -15.8 1.7Scor 64.0 38.8 -25.2 -39.4 0.0UBS 16.2 18.7 2.5 15.3 97.7
Mean 49.2 35.0 -14.2 -19.8 19.9Median 46.1 36.9 -6.9 -21.0 2.3

TABLE 8. TRADING VOLUME SHARES AND BID-ASK SPREADS: HOME MARKET VS. NEW YORK
NYSE spreads are latest National Best Bid & Offer as of 10:11 AM EDT on 4-15-2004. Home spreads are at the 4-15-2004 close. NYSE Volume is the ratio of composite U.S. volume to volume on the home exchange for the period from 10-15-2003 to 4-14-2004 (with U.S. volume figures adjusted for the ADR ratio to reflect the number of underlying shares).
NYSEIntermediary Country Industry NYSE Home Difference VolumeABN Amro Holding NV Netherlands Banking 9 6 4 3.1%Aegon NV Netherlands Insurance 7 9 -2 4.4%Allianz AG Germany Insurance 45 22 23 0.8%Allied Irish Bank PLC Ireland Banking 3 25 -21 6.2%Axa SA France Insurance 5 6 -1 3.7%Banco Bilbao Vizcaya Argentaria SA Spain Banking 22 9 13 0.5%Banco Santander Central Hispano SA Spain Banking 27 11 16 0.6%Bank of Ireland PLC Ireland Banking 4 10 -6 3.2%Barclays PLC U.K. Banking 23 5 17 1.5%Converium Holding AG Switzerland Insurance 81 39 42 1.9%Credit Suisse Group Switzerland Banking 12 12 0 3.1%Deutsche Bank AG Germany Banking 8 40 -32 2.4%HSBC Holdings PLC U.K. Banking 4 12 -8 5.2%ING Groep NV Netherlands Insurance 9 5 4 4.5%Lloyds TSB Group PLC U.K. Banking 10 6 4 0.7%National Bank of Greece Greece Banking 242 44 198 1.2%Prudential PLC U.K. Insurance 31 34 -3 0.3%Royal & Sun Alliance Group U.K. Insurance 88 29 59 0.9%Sanpaolo IMI Italy Banking 30 10 20 1.6%Scor SA France Insurance 117 70 47 12.6%UBS AG Switzerland Banking 5 5 0 11.4%
Mean 37 19 18 3.3%Median 12 11 4 2.4%
Bid-Ask Spread (bps)
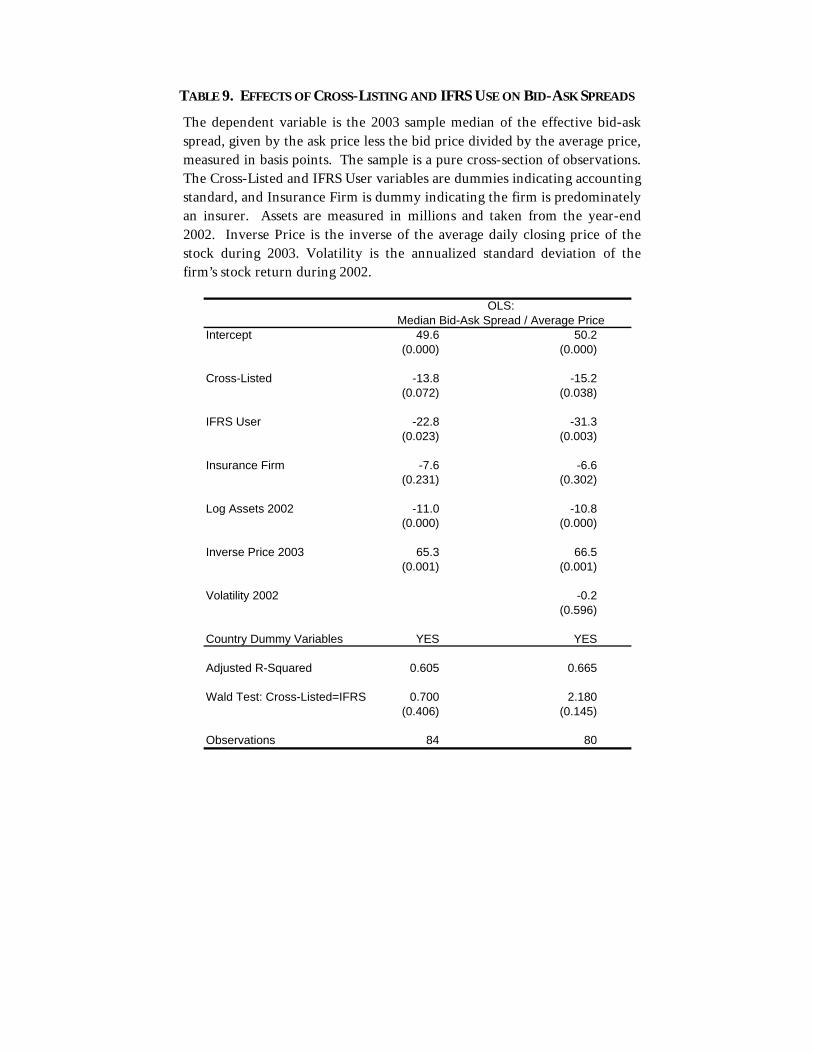
TABLE 9. EFFECTS OF CROSS-LISTING AND IFRS USE ON BID-ASK SPREADS
The dependent variable is the 2003 sample median of the effective bid-ask spread, given by the ask price less the bid price divided by the average price, measured in basis points. The sample is a pure cross-section of observations. The Cross-Listed and IFRS User variables are dummies indicating accounting standard, and Insurance Firm is dummy indicating the firm is predominately an insurer. Assets are measured in millions and taken from the year-end 2002. Inverse Price is the inverse of the average daily closing price of the stock during 2003. Volatility is the annualized standard deviation of the firm’s stock return during 2002.
Intercept 49.6 50.2(0.000) (0.000)
Cross-Listed -13.8 -15.2(0.072) (0.038)
IFRS User -22.8 -31.3(0.023) (0.003)
Insurance Firm -7.6 -6.6(0.231) (0.302)
Log Assets 2002 -11.0 -10.8(0.000) (0.000)
Inverse Price 2003 65.3 66.5(0.001) (0.001)
Volatility 2002 -0.2(0.596)
Country Dummy Variables YES YES
Adjusted R-Squared 0.605 0.665
Wald Test: Cross-Listed=IFRS 0.700 2.180(0.406) (0.145)
Observations 84 80
OLS: Median Bid-Ask Spread / Average Price

TABLE 10. MULTIVARIATE TEST OF RATING AGENCY DISAGREEMENT
For the rating disagreement probits, the unit impact on the probability of disagreement between Moody's and S&P is reported (all variables are binary). The estimated coefficients are reported for ordered probit. P-values are shown in parentheses for a null hypothesis of zero coefficient.
Variable
Ordered Probit: Absolute Rating
Difference
Intercept #1 75.9% 77.2% -0.743(0.006) (0.006) (0.005)
Intercept #2 0.865(0.003)
Cross-Listed 2.7% 4.7% 0.189(0.843) (0.734) (0.641)
IFRS User -2.7% -0.427(0.907) (0.646)
Insurance Firm -7.3% -0.167(0.656) (0.694)
pseudo R2 0.001 0.006
Joint LR Test (Chi2) 0.039 0.251 0.747(0.843) (0.969) (0.862)
Observations 43 43 42
Probit:Rating
Disagreement