Inference (CI / Tests) for Comparing 2 Proportions.
30
Inference (CI / Tests) for Comparing 2 Proportions
-
date post
20-Dec-2015 -
Category
Documents
-
view
227 -
download
0
Transcript of Inference (CI / Tests) for Comparing 2 Proportions.

Inference (CI / Tests) forComparing 2 Proportions

To compare proportions from distinct populations
p1 vs. p2
Conditions
1. Appropriate randomization.Without this, there’s rarely any way to proceed making sensible conclusions; and when there are ways, they are very complex (and often still produced results for which in general conclusions may be easily disputed)

To compare proportions from distinct populations
p1 vs. p2
Conditions
2. For the particular method we will use
Large populations (20 x larger than sample size).
Large enough samples so that all cells of a data summary table are at least 5 (ie, 5 units).
Without either of these, there are methods that still give conclusions similar in scope to our method.

To compare proportions from distinct populations
p1 vs. p2
There are numerous ways to compare two quantities. Here are two (in red – what we will do):
Assess the differenceWhat is the value of p1 – p2 ? (CI)
Is p1 – p2 = 0 or not? (Test)
Assess the ratio:
What is the value of p1 / p2 ? (CI)
Is p1 / p2 = 1 or not? (Test)

Sample proportions (possibly error margins)
Confidence interval for the value of p1 – p2
Point estimate of difference:
Error margin:
If you know the error margin for each, use the Pythagorean Theorem.
11 andˆ Ep 22 andˆ Ep
21 ˆˆ pp
22
21 EEEDIFF

Sample proportions (possibly error margins)
Confidence interval for the value of p1 – p2
Point estimate of difference:
Error margin:
If you don’t know the error margin for each
11 andˆ Ep 22 andˆ Ep
21 ˆˆ pp
2
22
1
112
ˆ1ˆˆ1ˆ
n
pp
n
ppZEDIFF
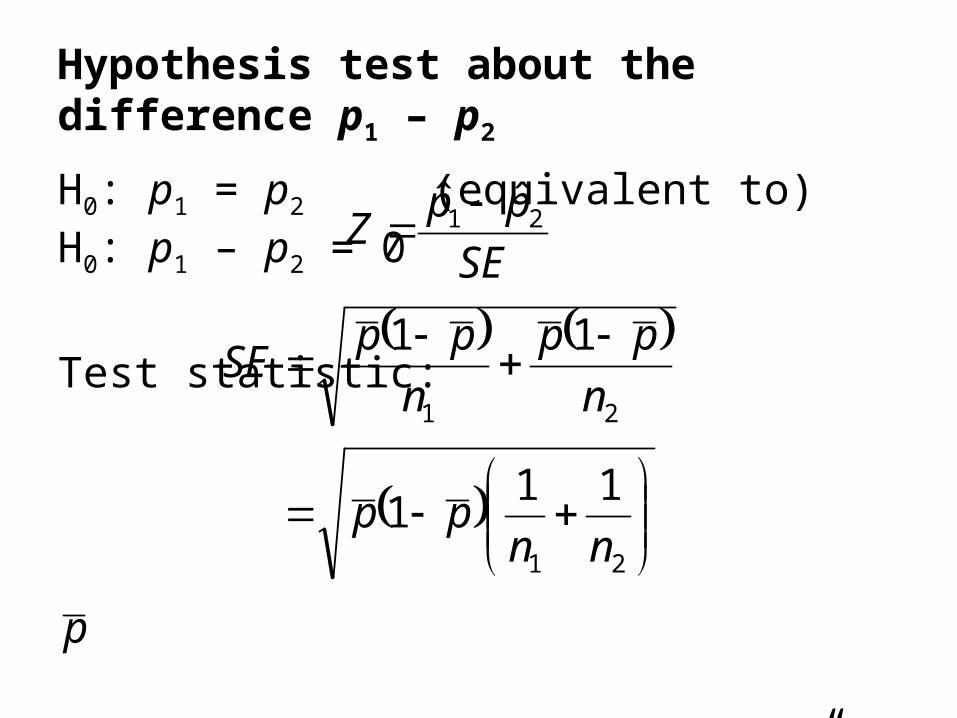
Hypothesis test about the difference p1 – p2
H0: p1 = p2 (equivalent to) H0: p1 – p2 = 0
Test statistic:
is the “pooled proportion” (H0 true)
SE
ppZ 21 ˆˆ
21
21
111
11
nnpp
n
pp
n
ppSE
p

The P-value depends on the direction(s) specified in the alternative hypothesis.
HA: p1 > p2 (equivalent to) H0: p1 – p2 > 0
P-value = probability right of Z
HA: p1 < p2 (equivalent to) H0: p1 – p2 < 0
P-value = probability left of Z
HA: p1 p2 (equivalent to) H0: p1 – p2 0
P-value = probability outside of ±Z
= twice probability outside of Z

Pregnant women with AIDS were involved in a study. Each woman was randomly allocated to either treatment with AZT or a Placebo. Researchers want to know if there is any difference in the proportions of babies born HIV+ for (all) women who might be treated with AZT and (all) women if not treated with AZT.
pAZT = proportion of all babies born to mothers with AIDS using AZT that are HIV+.
pPBO = proportion of all babies born to mothers with AIDS using a placebo that are HIV+.
H0: pAZT = pPBO H1: pAZT pPBO

Of 164 babies of women getting AZT, 13 were HIV+.
Of 160 babies of women getting the Placebo, 40 were HIV+.
Treatment AZT Placebo Total
OutcomeHIV+HIV-
Total

Of 164 babies of women getting AZT, 13 were HIV+.
Of 160 babies of women getting the Placebo, 40 were HIV+.
Treatment AZT Placebo Total
OutcomeHIV+HIV-
Total 164

Of 164 babies of women getting AZT, 13 were HIV+.
Of 160 babies of women getting the Placebo, 40 were HIV+.
Treatment AZT Placebo Total
OutcomeHIV+ 13HIV-
Total 164

Of 164 babies of women getting AZT, 13 were HIV+.
Of 160 babies of women getting the Placebo, 40 were HIV+.
Treatment AZT Placebo Total
OutcomeHIV+ 13 40HIV-
Total 164 160

Of 164 babies of women getting AZT, 13 were HIV+.
Of 160 babies of women getting the Placebo, 40 were HIV+.
Treatment AZT Placebo Total
OutcomeHIV+ 13 40 53HIV-
Total 164 160 324

Of 164 babies of women getting AZT, 13 were HIV+.
Of 160 babies of women getting the Placebo, 40 were HIV+.
Treatment AZT Placebo Total
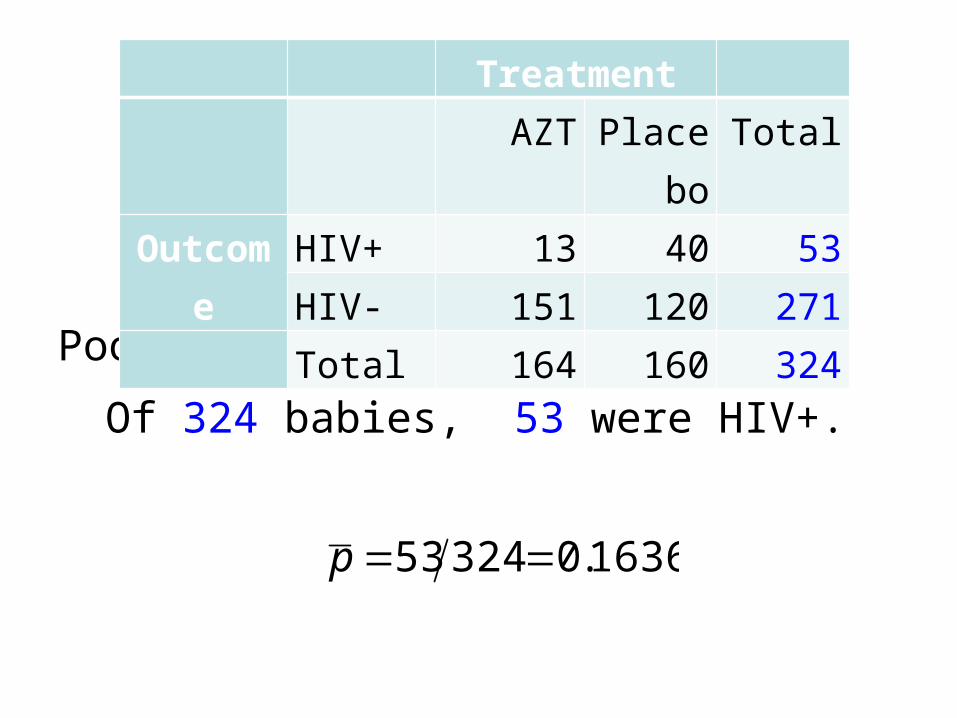
OutcomeHIV+ 13 40 53HIV- 151 120 271
Total 164 160 324
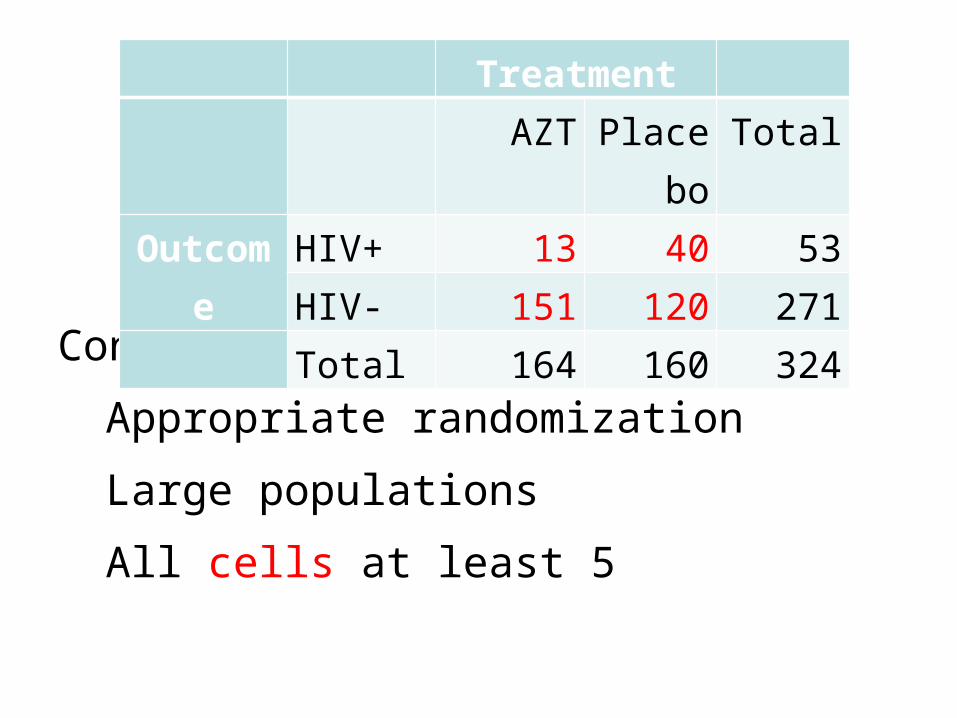
Condition Check:
Appropriate randomization
Large populations
All cells at least 5
Treatment AZT Placebo Total
OutcomeHIV+ 13 40 53HIV- 151 120 271
Total 164 160 324

Of 164 babies of women getting AZT, 13 were HIV+.
Of 160 babies of women getting the Placebo, 40 were HIV+.
Treatment AZT Placebo Total
OutcomeHIV+ 13 40 53HIV- 151 120 271
Total 164 160 324
0793.016413ˆ AZT p
2500.016040ˆ PBO p
Pooled over both conditions:
Of 324 babies, 53 were HIV+.
Treatment AZT Placebo Total
OutcomeHIV+ 13 40 53HIV- 151 120 271
Total 164 160 324
1636.032453 p

Result of hypothesis test:
Z = -4.15 P-value = 0.0000323 1 / 31000
Reject H0. The (population) proportions differ. And in fact the mothers treated with AZT had babies with better outcomes.
There is sufficient evidence in the sample data to conclude that the proportion of HIV+ babies born to mothers treated with AZT is less than that for mothers treated with a Placebo.

Result of hypothesis test:
Z = -4.15 P-value = 0.0000323 1 / 31000
Suppose AZT and Placebo had the same efficacy (effectiveness):
In only 1 in 31000 studies would the difference in HIV rates between the groups be as large as observed here.
In only 1 in 31000 randomizations would the difference in HIV rates between the groups be as large as observed here.
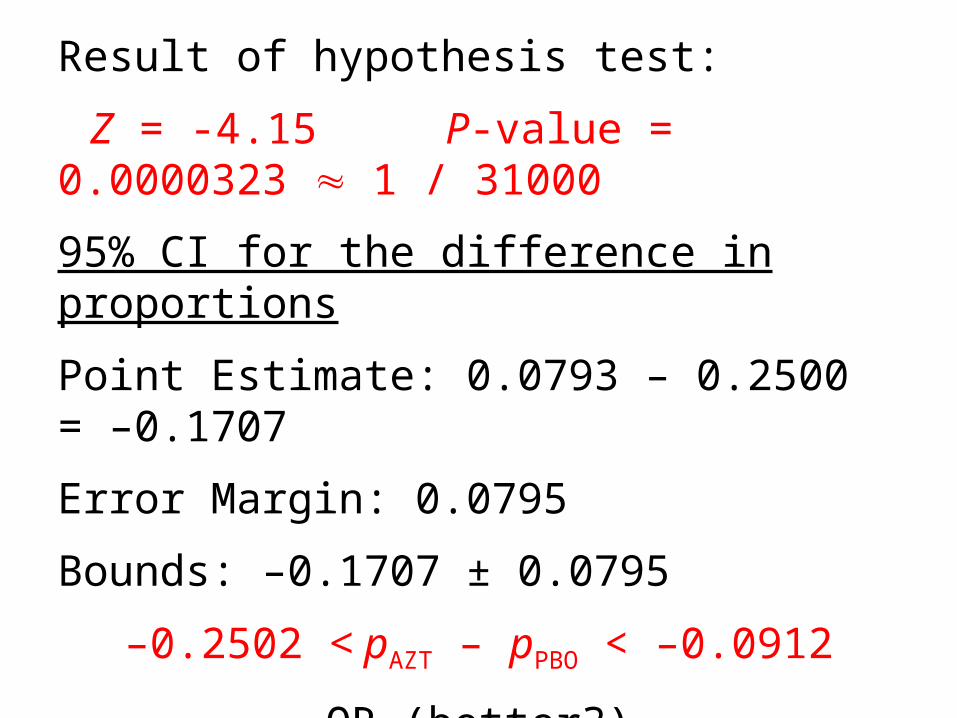
Result of hypothesis test:
Z = -4.15 P-value = 0.0000323 1 / 31000
95% CI for the difference in proportions
Point Estimate: 0.0793 – 0.2500 = –0.1707
Error Margin: 0.0795
Bounds: –0.1707 ± 0.0795
–0.2502 < pAZT – pPBO < –0.0912
OR (better?)
0.0912 < pPBO – pAZT < 0.2502

95% CI for the difference in proportions
– 0.2502 < pAZT – pPBO < – 0.0912
add pPBO to all “3” sides
pPBO – 0.2502 < pAZT < pPBO – 0.0912
We are 95% confident that the proportion of babies born HIV+ is between 0.0912 and 0.2505 lower for mothers treated with AZT.
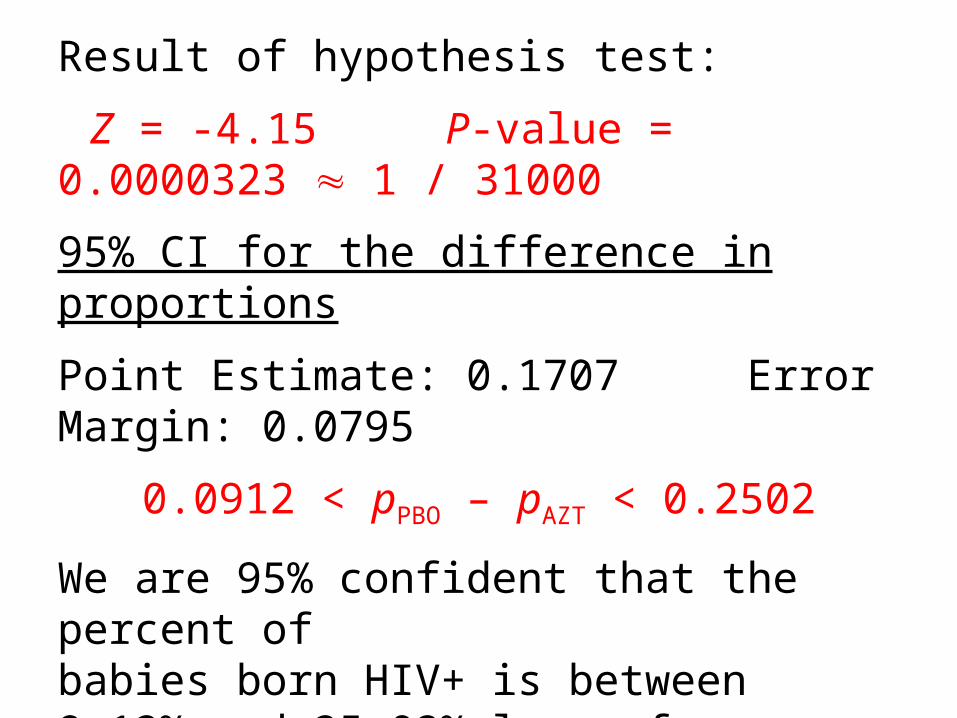
Result of hypothesis test:
Z = -4.15 P-value = 0.0000323 1 / 31000
95% CI for the difference in proportions
Point Estimate: 0.1707 Error Margin: 0.0795
0.0912 < pPBO – pAZT < 0.2502
We are 95% confident that the percent of babies born HIV+ is between 9.12% and 25.02% lower for mothers treated with AZT.

We can be quite sure that it is the AZT that caused the observed reduction in HIV+ rates.
The randomization alone is very unlikely to have been responsible for such a difference. (The P-value quantifies this likelihood.)
The randomization also insures that whatever other variables might be important are similarly distributed among the women in the AZT and Placebo groups.
This is the advantage of an experimental study over an observational one. It allows us to infer causation.

95% CI for the difference in proportions
Point Estimate: 0.1707 Error Margin: 0.0795
0.0912 < pPBO – pAZT < 0.2502
Number Needed to Treat
Estimated NNT =
= = 5.8582
Difference ofEst Pt
1ˆˆ
1
21
pp
1707.0
1

58582 pregnant women with AIDS
If not treated with AZT:
0.2502 58582 = 14657 HIV+ babies
If treated with AZT:
0.0795 58582 = 4657 HIV+ babies
Treating 58582 womenwith AZT results in a reduction of 10000 HIV+ babies
Treating 5.8582 womenresults in 1 fewer HIV+ baby

NNT:
The number of units that must be switched from one level of the explanatory variable (one “group” or “treatment”) to the other in order to result in a change of 1 unit from one level of the response variable to the other.
How many units must be “treated” in order to produce 1 additional favorable outcome.

95% CI for the difference in proportions
Point Estimate: 0.1707 Error Margin: 0.0795
0.0912 < pPBO – pAZT < 0.2502
Number Needed to Treat
Estimated NNT = 5.8582
We estimate that for every 5.8582 women treated with AZT (instead of nothing/placebo) there is one fewer HIV+ baby.

95% CI for the difference in proportions
Point Estimate: 0.1707 Error Margin: 0.0795
0.0912 < pPBO – pAZT < 0.2502
Number Needed to Treat
Estimated NNT = 5.8582
A CI for NNT can be formed by taking reciprocals of the CI for the difference:
1/0.0912 = 10.965 1/0.2502 = 3.9968
4 < NNT (population) < 11

Motorcycle Helmet Color
Percent of accidents resulting in harm…
…among those wearing dark helmets:
190/681 = 0.279 27.9%
…among those wearing light helmets:
116/493 = 0.235 23.5%
Point Estimate of Difference: 4.4% = 0.044
(The P-value also happens to be 0.044!)
Estimated NNT = 1/0.044 = 22.7