INFECTIOUS DISEASE ECOLOGY OVERVIEW
13
TEACHERS’ NOTES 4 Disease Ecology LESSON PLAN INFECTIOUS DISEASE ECOLOGY OVERVIEW Infectious disease ecology is best described as the study of host-parasite interactions within the context of the surrounding environment and evolution (Kilpatrick and Altizer 2010) and can be visualized in the form of a triangle in which the host, parasite, and environment interact to determine disease outcomes (Figure 1). Disease can occur only if all three components of the triangle are present, and modifying any component of the triangle can change disease outcomes. FIGURE 1: Disease triangle model In natural systems, the environment is constantly changing, and host and parasite populations are constantly evolving in response to the selection pressures around them, so disease dynamics are often in constant flux. For example, a seasonal increase in ambient temperature (i.e., a change in environment) may modify the reproductive rate of the parasite or the immune function of the host, thus altering overall disease incidence and outcomes in the system. Disease ecology is, at its core, an integrative field that combines information from the disciplines of parasitology (the study and description of parasites), epidemiology (the statistical patterns of disease for individuals and populations), and medicine (the study of disease cure and prevention). However, the key distinction of disease ecology is that it looks at disease incidence and outcomes as the product of fundamental biological processes rather than from purely statistical terms. In other words, it moves beyond the how of disease and seeks to understand the why of disease. Why does an increase in host diversity decrease disease risk? Why does a parasite prefer one host over another? In this way, disease ecology generates a deeper understanding of the mechanisms driving disease processes, which can help control epidemics and disease outbreaks when they occur. The field of disease ecology has received increasing attention over the past several decades as disease outbreaks in human and wildlife populations have become more common. For example, nearly 1/3 of amphibian species are threatened with extinction, and a fungal pathogen, Batrachochytrium dendrobatidis (Bd), has played a significant role in these massive amphibian declines. Additionally, white-nose syndrome, a disease caused by another fungal pathogen, has devastated bat populations in North America, with some species declining by over 90%. Disease ecologists are hard at work trying to find the causes of and possible solutions to these problems through a combination of observational field studies, experimental studies in the lab, and predictive mathematical models. Although disease ecologists frequently work in wildlife systems, principles from disease ecology have helped solve some of history’s biggest human health issues. For example, the principle of herd immunity – where a large proportion of a population becomes immune to a disease, protecting individuals who are not immune by reducing transmission – played a key role in eradicating poliovirus globally. By identifying key characteristics of the virus, such as transmission rate, scientists were able to pinpoint what percentage of a population needed to be vaccinated in order to halt the disease in its tracks. This same principle is used to inform vaccination practices for other deadly diseases and has helped reduce disease transmission and improve health conditions around the world. At a time when many wildlife populations are imperiled by habitat loss, climate change, and disease, disease ecology is becoming an increasingly important field to teach and understand. As is made clear from the disease triangle (Figure 1), environmental changes as a result of human activity play a key role in determining disease outcomes, and shifts in the environment can be the determining factor in whether a disease becomes an epidemic. Disease ecology provides a more holistic understanding of the three main factors that drive disease (host, parasite, and environment), which will allow wildlife managers, public health specialists, and medical practitioners to better combat these diseases in an efficient and sustainable manner. PARASITE ENVIRONMENT HOST DISEASE OUTCOMES
Transcript of INFECTIOUS DISEASE ECOLOGY OVERVIEW

TEACHERS’ NOTES
4
Disease EcologyLESSON PLAN
INFECTIOUS DISEASE ECOLOGY OVERVIEWInfectious disease ecology is best described as the study of host-parasite interactions within the context of the surrounding environment and evolution (Kilpatrick and Altizer 2010) and can be visualized in the form of a triangle in which the host, parasite, and environment interact to determine disease outcomes (Figure 1). Disease can occur only if all three components of the triangle are present, and modifying any component of the triangle can change disease outcomes.
FIGURE 1: Disease triangle model
In natural systems, the environment is constantly changing, and host and parasite populations are constantly evolving in response to the selection pressures around them, so disease dynamics are often in constant flux. For example, a seasonal increase in ambient temperature (i.e., a change in environment) may modify the reproductive rate of the parasite or the immune function of the host, thus altering overall disease incidence and outcomes in the system.
Disease ecology is, at its core, an integrative field that combines information from the disciplines of parasitology (the study and description of parasites), epidemiology (the statistical patterns of disease for individuals and populations), and medicine (the study of disease cure and prevention). However, the key distinction of disease ecology is that it looks at disease incidence and outcomes as the product of fundamental biological processes rather than from purely statistical terms. In other words, it moves beyond the how of disease and seeks to understand the why of disease. Why does an increase in host diversity decrease disease risk? Why does a parasite prefer one host over another? In this way, disease ecology generates a deeper understanding of the mechanisms driving disease processes, which can help control epidemics and disease outbreaks when they occur.
The field of disease ecology has received increasing attention over the past several decades as disease outbreaks in human and wildlife populations have become more common. For example, nearly 1/3 of amphibian species are threatened with extinction, and a fungal pathogen, Batrachochytrium dendrobatidis (Bd), has played a significant role in these massive amphibian declines. Additionally, white-nose syndrome, a disease caused by another fungal pathogen, has devastated bat populations in North America, with some species declining by over 90%. Disease ecologists are hard at work trying to find the causes of and possible solutions to these problems through a combination of observational field studies, experimental studies in the lab, and predictive mathematical models.
Although disease ecologists frequently work in wildlife systems, principles from disease ecology have helped solve some of history’s biggest human health issues. For example, the principle of herd immunity – where a large proportion of a population becomes immune to a disease, protecting individuals who are not immune by reducing transmission – played a key role in eradicating poliovirus globally. By identifying key characteristics of the virus, such as transmission rate, scientists were able to pinpoint what percentage of a population needed to be vaccinated in order to halt the disease in its tracks. This same principle is used to inform vaccination practices for other deadly diseases and has helped reduce disease transmission and improve health conditions around the world.
At a time when many wildlife populations are imperiled by habitat loss, climate change, and disease, disease ecology is becoming an increasingly important field to teach and understand. As is made clear from the disease triangle (Figure 1), environmental changes as a result of human activity play a key role in determining disease outcomes, and shifts in the environment can be the determining factor in whether a disease becomes an epidemic. Disease ecology provides a more holistic understanding of the three main factors that drive disease (host, parasite, and environment), which will allow wildlife managers, public health specialists, and medical practitioners to better combat these diseases in an efficient and sustainable manner.
PARASITE
ENVIRONMENT
HOST
DISEASEOUTCOMES
FIGURE 1. Disease triangle model

•
•
•
•
Susceptible: individuals in a population that are not infected with a parasite but can become infectedInfected: individuals in a population that are infected with a parasite and can spread it to susceptible individualsRecovered: individuals who were previously infected with a parasite, but have cleared infection and are now immune to future infectionTransmission rate: rate of disease spread from infectious to susceptible individuals
TEACHERS’ NOTES
6
Disease EcologyLESSON PLAN
• Recovery rate: rate at which infected individuals recoverfrom infection
• Interaction rate: rate at which organisms in a populationinteract
• Infection rate: rate at which organisms acquire infectionsfrom interactions with individuals in the population
LESSON 2: MODELING DISEASE TRANSMISSION – BACKGROUNDResearchers are often interested in understanding how diseases spread in a population. This activity will introduce students to a basic disease modeling approach: The Susceptible-Infected-Recovered (SIR) model. The SIR model is a simple mathematical model that predicts disease progression in a fixed population. Students can be intimidated by math, so before jumping into manipulating the mathematical model, the class will conduct a simulation of how disease might progress in an SIR model. After the Modeling Disease Transmission: Class Activity, students will break into groups and be asked to manipulate the parameters of an SIR model in Microsoft Excel or Google Sheets to test how varying different parameters influence disease in a population. It is important to emphasize that because it is difficult to conduct experiments on disease transmission in humans, models are useful tools to conduct many “experiments” very rapidly. After each group has completed each activity, come together as a class to critically discuss the findings of the SIR simulations.
LESSON 2: MODELING DISEASE TRANSMISSION – VOCABULARY

15
Disease EcologyLESSON PLANLESSON 2
LESSON 2: MODELING DISEASE TRANSMISSIONThis lesson teaches students about modeling the disease dynamics of a parasite.
Estimated timeOne class period
Procedure1. Introduce the concept of disease modeling with the information provided in the teachers’ note section for lesson 2.2. Break the class into three groups and conduct the Classroom Disease Spread Simulation (directions below). 3. After each group has plotted their data and answered the discussion questions, briefly discuss the results as a class.4. Next, guide the students through the SIR Computer Simulation activity in their groups.5. As a class, discuss the strengths and limitations of this simulation, such as: • In what ways does the SIR model correctly represent the spread of and recovery from a disease? • In what ways is the SIR model inaccurate? • What could be added to the SIR model to make it more realistic or better represent different diseases?
Teacher directions for Classroom Disease Spread Simulation:The goal of the activity is to visually simulate the progression of a disease in the classroom using an SIR model.
1. Before the activity, label sets of 4 opaque cups as 1-4. Each group of four students will get 4 cups. Sort 25 yellow, red, and blue bingo chips (75 chips total) into three opaque cups per set. Place all the yellow chips in cup 1, the red chips in cup 2, and the blue chips in cup 3. Cup 4 will be empty. 2. Distribute the sets of cups to each group of students. Also provide each group of students with one SIR Disease Spread Graphing Sheet, and one SIR Disease Spread Recording Sheet. 3. Inform the students that yellow bingo chips represent “susceptible” individuals, red bingo chips represent “infectious” individuals, and blue bingo chips represent “recovered” individuals.
4. Have each group set up their simulation in cup 4. This will be the cup that represents the first time period on the SIR Disease Spread recording sheet. Assign each group to set up their simulation cups with one of the following chip ratios: • Group 1: 20 “susceptible” chips and 5 “infected” chips • Group 2: 15 “susceptible” chips and 10 “infected” chips • Group 3: 5 “susceptible” chips and 20 “infected” chips,5. Designate a chip drawer, a chip analyst, a data recorder, and a data plotter in each group.6. Have the groups read through the directions of the SIR Disease spread recording worksheet and complete the activity.
Required Materials• SIR Disease Spread Recording Sheet (1 per group)• SIR modeling Excel Sheets/Google Sheets (electronic resource available at www.purdue.edu/nature)• SIR Model Simulation Discussion Sheet (1 per group)• 4 opaque containers (per group of students)• Yellow, red and blue bingo chips, 25 of each color (Per group of students)• SIR Disease Spread Graphing Sheet (1 per group)• SIR model Simulation Worksheet (1 per group)• Computer (1 per group)• Microsoft Excel or access to Google Sheets• SIR Computer Simulation Worksheet (1 per group)• SIR Computer Simulation Discussion Worksheet (1per group)
ACTIVITY ICONSUse these icons — located at the top of each lesson plan — to indicate the disciplines to which certain activities belong. These disciplines include:
READING WRITING MATH SCIENCE STEM STEAM(science, technology, engineering, math) (science, technology, engineering, art, math)
ACTIVITY ICONSUse these icons — located at the top of each lesson plan — to indicate the disciplines to which certain activities belong. These disciplines include:
READING WRITING MATH SCIENCE STEM STEAM(science, technology, engineering, math) (science, technology, engineering, art, math)
ACTIVITY ICONSUse these icons — located at the top of each lesson plan — to indicate the disciplines to which certain activities belong. These disciplines include:
READING WRITING MATH SCIENCE STEM STEAM(science, technology, engineering, math) (science, technology, engineering, art, math)
ACTIVITY ICONSUse these icons — located at the top of each lesson plan — to indicate the disciplines to which certain activities belong. These disciplines include:
READING WRITING MATH SCIENCE STEM STEAM(science, technology, engineering, math) (science, technology, engineering, art, math)

16
Disease Ecology WORKSHEETLESSON 2
LESSON 2: SIR DISEASE SPREAD RECORDING SHEETGroup number
Introductory informationThe goal of this activity is to simulate the spread of disease with a common model, the Susceptible-Infectious-Recovered (SIR) model. For this activity, bingo chips represent individuals in a population. Each color bingo chip corresponds with a disease status. Yellow chips represent susceptible individuals capable of becoming infected. Red chips represent infectious individuals who are infected with a disease and capable of spreading it to susceptible individuals. Blue chips represent recovered individuals who have cleared an infection and are now immune to the disease. To model the progression of disease through time, you will draw 2 bingo chips from your simulation cup (cup 4) at random.
The two chips you pull represent an interaction between two individuals in the population, and the results of this interaction will depend on the infection status of the two individuals. In this simulation, disease spread occurs ONLY when a “susceptible” chip comes in contact with an “infected” chip, much like disease spread occurs when an infected individual encounters a susceptible individual. No disease spread occurs when 2 “susceptible” chips or 2 “recovered” chips come in contact, as no individuals are infected. Additionally, no disease spread occurs when ANY chip comes in contact with a “recovered” chip because recovered individuals are immune and thus unable to contract the infection. Recovery occurs when an “infected” chip comes into contact with another “infected” chip, or when an “infected” chip comes into contact with a “recovered” chip. This process represents the natural recovery from infection through time.
To begin, designate a chip drawer, a chip analyst, a data recorder, and a data plotter. Then follow the activity directions below!
Directions1. Have the chip recorder record the starting number of susceptible, infected, and recovered individuals in period 1 in the table on page 17. 2. Have the chip drawer randomly draw two chips from the simulation cup (cup 4).
3. Have the chip analyst assess the interaction between the two selected chips: • 2 “susceptible” chips gput both chips back into cup 4 (no new infections) • 2 “infected” chips g Replace one “infected” chip in cup 4 with a “recovered” chip from cup 3 and put the other “infected” chip back in cup 4 (one infected individual clears infection) • 2 “recovered” chips g put both chips back in cup 4 (No new infections) • 1 “susceptible” chip and 1 “infected” chip g put the “infected” chip back in cup 4 and replace the “susceptible” chip from cup 4 with an “infected” chip from cup 2 (one new infection) • 1 “recovered” chip and 1 “infected” chip gReplace the “infected” chip from cup 4 with a “recovered” chip from cup 3 and put the other “recovered” chip back in cup 4 (infected individual clears infection) • 1 “recovered” chip and 1 “susceptible” chip g put both chips back in cup 4 (no new infections)4. Have the data recorder count the number of susceptible, infected, and recovered individuals in the simulation cup after each period and write it down on the SIR Disease Spread recording sheet.5. Have the data plotter plot the number of susceptible, infected, and recovered individuals that the data recorder wrote down at the correct time point on the SIR Disease Spread graphing sheet. For each line, use a marker color that matches its corresponding bingo chip color.6. Stir the simulation cup and repeat steps 1-4 for a total of 20 trials.

17
Disease Ecology WORKSHEETLESSON 2
SIR Disease spread recording sheet
Time Period Number Susceptible Number Infected Number Recovered
1
2
3
4
5
6
7
8
9
10
11
12
13
14
15
16
17
18
19
20

18
Disease Ecology WORKSHEETLESSON 2
LESSON 2: SIR DISEASE SPREAD GRAPHING SHEET

19
Disease Ecology WORKSHEETLESSON 2
LESSON 2: SIR DISEASE SPREAD DISCUSSION SHEET1. How well do the different chip interactions represent disease transmission in real life?
2. In what ways was this simulation an unrealistic demonstration of disease spread?
3. Was there a general trend for how each status (S, I, and R) changed over time?
4. Compare your graph with the other groups. How are they similar? How are they different? What could account for these different outcomes?
5. What would happen to the rate of disease spread if, on each turn, you pulled three chips instead of two?
6. What are the limitations of this activity for modeling disease in larger populations? How could this activity be improved to better represent disease spread?

20
Disease EcologyANSWER KEYLESSON 2
LESSON 2: SIR DISEASE SPREAD DISCUSSION SHEET – ANSWER KEY1. How well do the different chip interactions represent disease transmission in real life?
Disease spread occurs ONLY when a “susceptible” chip comes in contact with an “infected” chip, much like disease spread occurs when an infected individual comes in contact with a susceptible individual. No disease spread occurs when 2 “susceptible” chips or 2 “recovered” chips come in contact, as no individuals are infected. Additionally, no disease spread occurs when ANY chip comes in contact with a “recovered” chip because recovered individuals are immune and thus unable to contract the infection.
2. In what ways was this simulation an unrealistic demonstration of disease spread?
There can be a variety of answers to this, and responses should be evaluated on logic and reasoning. Examples of appropriate answers include: • Only two individuals come into contact at any one time, when in reality there can be interactions of many individuals at once (e.g., in a confined or crowded place).• Recovered individuals stay immune forever, when this is not the case for many diseases.• Infected individuals become immune following an interaction with another infected individual, which is not how disease recovery actually occurs.
3. Was there a general trend for how each status (S, I, and R) changed over time?
Responses will depend on the starting conditions. Below are examples of how the plots might look based on the three suggested starting conditions.
4. Compare your graph with the other groups. How are they similar? How are they different? What could account for these different outcomes?
Answers will vary. Common similarities include the same trends for setup 1 and 2 but with different line slopes Common differences include a decrease in infection in setup 3 that does not occur in setup 1 or 2, as well as a more drastic increase in recovered individuals in setup 3. The different starting conditions account for these differences.
5. What would happen to the rate of disease spread if, on each turn, you pulled three chips instead of two?
The rate of disease spread would increase, as there would be a higher likelihood of infected individuals interacting with
susceptible individuals on any one draw.
6. What are the limitations of this activity for modeling disease in larger populations? How could it be improved to better represent disease spread?
Answers will vary. Acceptable answers include: • It would be difficult to conduct such an activity with a large population because it would take an extremely long time.• Human interactions are much more complicated than the
chip interactions can represent.• Humans typically interact in groups larger than two.

21
Disease EcologyANSWER KEYLESSON 2
22
Disease Ecology WORKSHEETLESSON 2
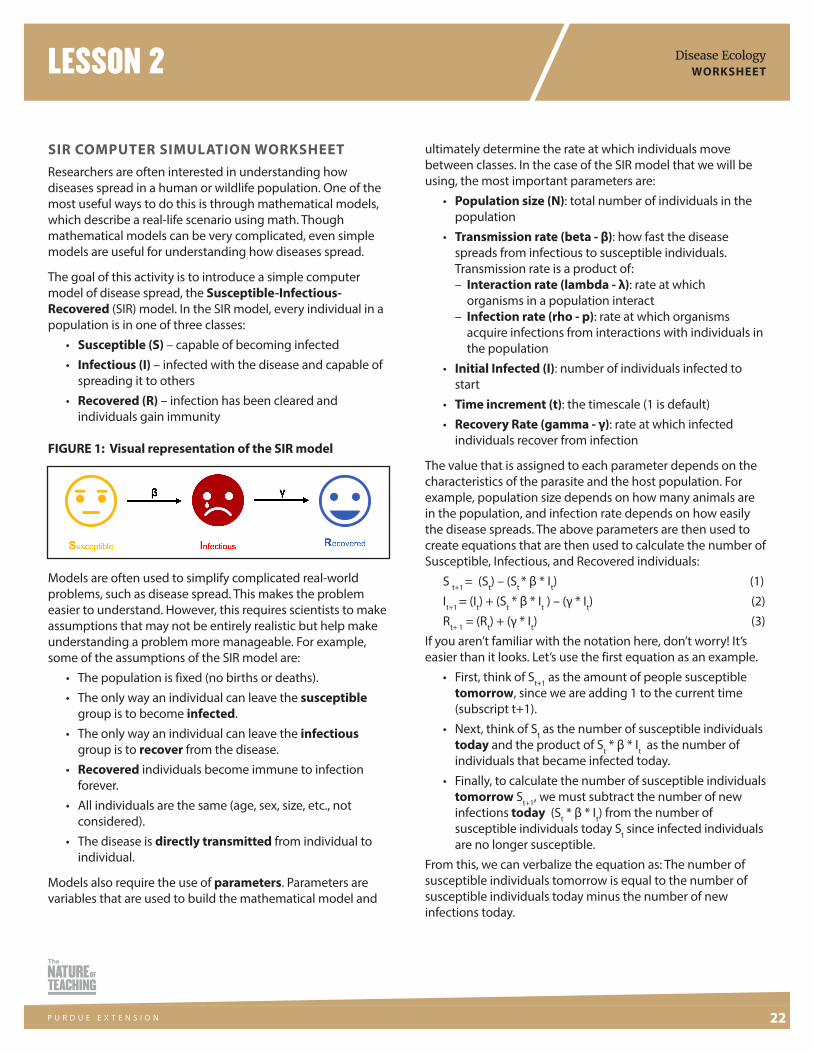
SIR COMPUTER SIMULATION WORKSHEETResearchers are often interested in understanding how diseases spread in a human or wildlife population. One of the most useful ways to do this is through mathematical models, which describe a real-life scenario using math. Though mathematical models can be very complicated, even simple models are useful for understanding how diseases spread.
The goal of this activity is to introduce a simple computer model of disease spread, the Susceptible-Infectious-Recovered (SIR) model. In the SIR model, every individual in a population is in one of three classes: • Susceptible (S) – capable of becoming infected • Infectious (I) – infected with the disease and capable of spreading it to others • Recovered (R) – infection has been cleared and individuals gain immunity
FIGURE 1: Visual representation of the SIR model
Models are often used to simplify complicated real-world problems, such as disease spread. This makes the problem easier to understand. However, this requires scientists to make assumptions that may not be entirely realistic but help make understanding a problem more manageable. For example, some of the assumptions of the SIR model are: • The population is fixed (no births or deaths). • The only way an individual can leave the susceptible group is to become infected. • The only way an individual can leave the infectious group is to recover from the disease. • Recovered individuals become immune to infection forever. • All individuals are the same (age, sex, size, etc., not considered). • The disease is directly transmitted from individual to individual.
Models also require the use of parameters. Parameters are variables that are used to build the mathematical model and
ultimately determine the rate at which individuals move between classes. In the case of the SIR model that we will be using, the most important parameters are: • Population size (N): total number of individuals in the population • Transmission rate (beta - β): how fast the disease spreads from infectious to susceptible individuals. Transmission rate is a product of: – Interaction rate (lambda - λ): rate at which organisms in a population interact – Infection rate (rho - p): rate at which organisms acquire infections from interactions with individuals in the population • Initial Infected (I): number of individuals infected to start • Time increment (t): the timescale (1 is default) • Recovery Rate (gamma - γ): rate at which infected individuals recover from infection
The value that is assigned to each parameter depends on the characteristics of the parasite and the host population. For example, population size depends on how many animals are in the population, and infection rate depends on how easily the disease spreads. The above parameters are then used to create equations that are then used to calculate the number of Susceptible, Infectious, and Recovered individuals: S t+1 = (St) – (St * β * It) (1) It+1 = (It) + (St * β * It ) – (γ * It) (2) Rt+ 1 = (Rt) + (γ * It) (3)If you aren’t familiar with the notation here, don’t worry! It’s easier than it looks. Let’s use the first equation as an example. • First, think of St+1 as the amount of people susceptible tomorrow, since we are adding 1 to the current time (subscript t+1). • Next, think of St as the number of susceptible individuals today and the product of St * β * It as the number of individuals that became infected today. • Finally, to calculate the number of susceptible individuals tomorrow St+1, we must subtract the number of new infections today (St * β * It) from the number of susceptible individuals today St since infected individuals are no longer susceptible.From this, we can verbalize the equation as: The number of susceptible individuals tomorrow is equal to the number of susceptible individuals today minus the number of new infections today.
23
Disease Ecology WORKSHEETLESSON 2
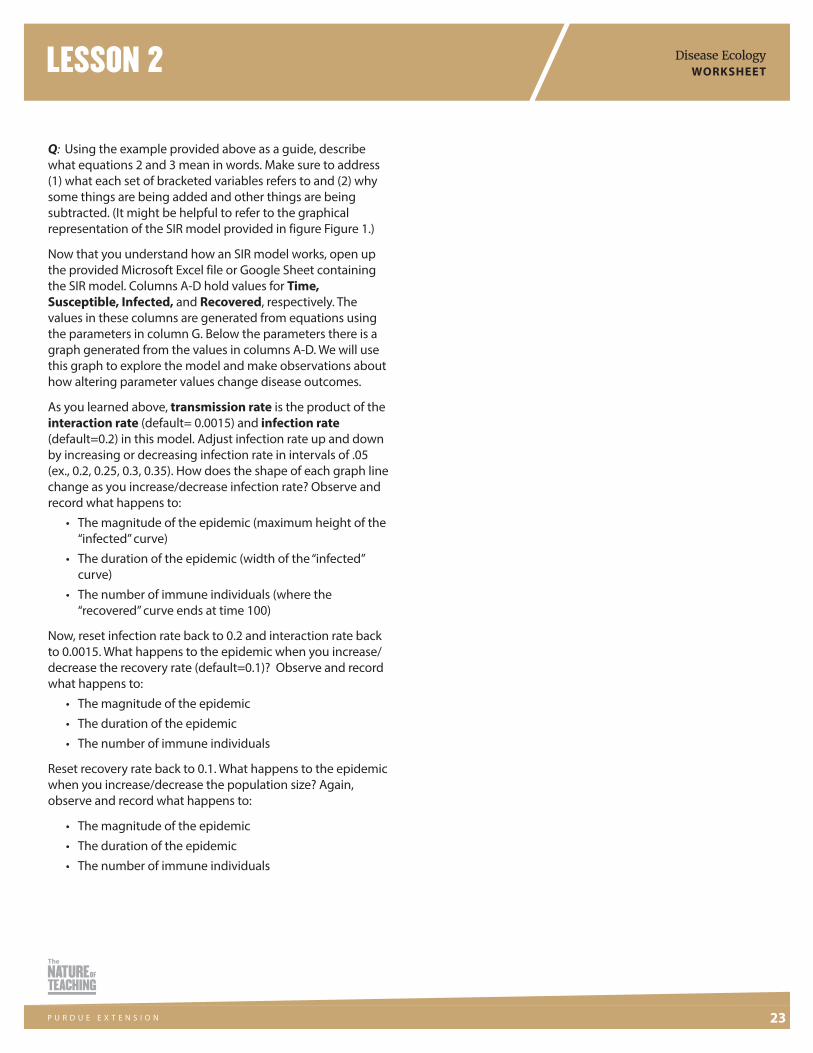
Q: Using the example provided above as a guide, describe what equations 2 and 3 mean in words. Make sure to address (1) what each set of bracketed variables refers to and (2) why some things are being added and other things are being subtracted. (It might be helpful to refer to the graphical representation of the SIR model provided in figure Figure 1.)
Now that you understand how an SIR model works, open up the provided Microsoft Excel file or Google Sheet containing the SIR model. Columns A-D hold values for Time, Susceptible, Infected, and Recovered, respectively. The values in these columns are generated from equations using the parameters in column G. Below the parameters there is a graph generated from the values in columns A-D. We will use this graph to explore the model and make observations about how altering parameter values change disease outcomes.
As you learned above, transmission rate is the product of the interaction rate (default= 0.0015) and infection rate (default=0.2) in this model. Adjust infection rate up and down by increasing or decreasing infection rate in intervals of .05 (ex., 0.2, 0.25, 0.3, 0.35). How does the shape of each graph line change as you increase/decrease infection rate? Observe and record what happens to: • The magnitude of the epidemic (maximum height of the “infected” curve) • The duration of the epidemic (width of the “infected” curve) • The number of immune individuals (where the “recovered” curve ends at time 100)
Now, reset infection rate back to 0.2 and interaction rate back to 0.0015. What happens to the epidemic when you increase/decrease the recovery rate (default=0.1)? Observe and record what happens to: • The magnitude of the epidemic • The duration of the epidemic • The number of immune individuals
Reset recovery rate back to 0.1. What happens to the epidemic when you increase/decrease the population size? Again, observe and record what happens to:
• The magnitude of the epidemic • The duration of the epidemic • The number of immune individuals
24
Disease Ecology WORKSHEETLESSON 2
SIR COMPUTER SIMULATION DISCUSSION WORKSHEET1. List and explain two advantages of the mathematical model over the chip modeling activity.
2. Look back at your observations about how the magnitude of the epidemic, the duration of the epidemic, and the number of immune individuals change when adjusting different parameters. While most of the observations make sense, some of them may seem counterintuitive. a. Why might increasing the infection rate decrease the duration of an epidemic?
b. Why might increasing the recovery rate decrease the number of immune individuals?
c. Why might increasing the population size increase the relative magnitude of an epidemic?
3. In this SIR model, why does the number of susceptible individuals always decrease through time, the number of recovered individuals always increases through time, and the number of infected individuals increase and then decrease through time? Relate your explanation back to Figure 1.
4. Some diseases are better represented by SIR models than others. What is one disease that might be well represented by the SIR model? What is one disease that might not be well represented by this SIR model? Explain. (see Lesson 1: Parasite Printout, for examples.)
5. As you may know, vaccination is one of the most important ways of stopping the spread of infectious diseases. Relate the impact of vaccination back to the SIR model. How does it influence the number of individuals initially in each class (S, I and R)? How might this decrease disease spread overall?

25
Disease EcologyANSWER KEYLESSON 2
SIR COMPUTER SIMULATION WORKSHEET, IN-ACTIVITY QUESTIONS: ANSWER KEYQ: Using the example provided above as a guide, describe what equations 2 and 3 mean in words. Make sure to address (1) what each set of bracketed variables refers to and (2) why some things are being added and other things are being subtracted. (It might be helpful to refer to the graphical representation of an SIR model provided above.)
It+1 = (It) + (St *β * It) – (γ * It)
The number of infected individuals tomorrow is equal to the number of infected individuals today, PLUS the number of new infections today, MINUS the number of individuals that recover today. Rt+1 = (Rt) + (γ * It)
The number of recovered individuals tomorrow is equal to the number of recovered individuals today PLUS the number of individuals that recover today.
SIR COMPUTER SIMULATION DISCUSSION WORKSHEET: ANSWER KEY1. List and explain two advantages of the mathematical model over the chip modeling activity.
Advantages: Much faster, can model a much larger population, can account for more complex interactions
than just two individuals at a time, is much more flexible
2. Look back at your observations about how the magnitude of the epidemic, the duration of the epidemic, and the number of immune individuals change when adjusting different parameters. While most of the observations make sense, some of them may seem counterintuitive. a. Why might increasing the infection rate decrease the duration of an epidemic?
Individuals become infected at a more rapid rate, speeding up the pace and intensity of the epidemic and reducing its length.
b. Why might increasing the recovery rate decrease the number of immune individuals?
If infected individuals recover faster, this means that they are less likely to pass their disease on to others. The only
way for an individual to become immune is to recover. Thus, fewer total infections lead to a lower number of immune individuals.
c. Why might increasing the population size increase the relative magnitude of an epidemic?
More total individuals come into contact with each infected individual since the interaction rate is the same. This effect compounds at each time, leading to a higher number of total infected individuals in a shorter span of time.
3. In this SIR model, why does the number of susceptible individuals always decrease through time, the number of recovered individuals always increases through time, and the number of infected individuals increase and then decrease through time? Relate your explanation back to Figure 1.
The arrows of the SIR model go in only one direction. Once a susceptible individual becomes infected, the only place this model allows an individual to go afterward is to the recovered class.
6. Some diseases are better represented by SIR models than others. What is one disease that might be well represented by the SIR model? What is one disease that might not be well represented by this SIR model? Explain. (see Lesson 1: Parasite Printout, for examples.)
Answers will vary. Diseases that are well represented should be directly transmitted microparasites such as rabies, poorly represented diseases might be things that are vector-borne or not directly transmitted.
4. As you may know, vaccination is one of the most important ways of stopping the spread of infectious diseases. Relate the impact of vaccination back to the SIR model. How might vaccination influence the number of individuals initially in each class (S, I and R)? How might this decrease disease spread overall?
It would reduce the number of susceptible individuals and increase the number of recovered individuals off the bat. This
would, in turn, decrease disease transmission and epidemic magnitude.