Inequality Inequality and Economic Growth: Do Natural Resources Matter? Thorvaldur Gylfason and...
23
Inequality Inequality and Economic Growth: Do Natural Resources Matter? Thorvaldur Gylfason and Gylfi Zoega
-
date post
18-Dec-2015 -
Category
Documents
-
view
220 -
download
0
Transcript of Inequality Inequality and Economic Growth: Do Natural Resources Matter? Thorvaldur Gylfason and...

InequalityInequality and Economic Growth: Do Natural Resources Matter?
Thorvaldur Gylfasonand Gylfi Zoega

Sources of GrowthSources of Growth
In ves tm en t X E d u ca tion
G row th+ +
?
Endogenous growth: X can be almost anything!
Arthur Lewis: X is trade, stable politics, good weather

Sources of Sources of GrowthGrowth
In ves tm en t
In it ia l In com e N atu ra l C ap ita l
X E d u ca tion
G row th+
+
+–– ?
Dutch disease
Rent seeking
––
Natural capital crowds
Natural capital crowds
out out humanhuman and and physicalphysical
capitalcapital
Conditional Conditional
convergence
convergence

Recent LiteratureRecent LiteratureFive main linkages:
1. Dutch disease Adversely affects level, composition, or
volatility of trade and investment
2. Rent seeking Protectionism, corruption
3. Education4. False sense of security
Poor quality of policies and institutions
5. Investment
But Norway is,
so far at least,
an exceptionForeign Foreign
capitalcapital
Social Social
capitalcapital
Human Human
capitalcapital
PhysicaPhysica
l l capitalcapital
Natural capital Natural capital tends to crowd tends to crowd outout

Natural Resource Abundance versus Dependence
Resource poor,resource dependent
(Chad, Mali)
Resource rich,resource dependent
(OPEC)
Resource rich,resource free(Canada, USA)
Resource poor,resource free
(Jordan, Panama)
Reso
urc
e d
ep
en
den
ceR
eso
urc
e d
ep
end
ence
Resource abundanceResource abundance
Dependence hurts growth, even if abundance may help
Hypothesis:

InequalityInequality and Growth and Growth
In ves tm en t
In it ia l In com e N atu ra l C ap ita l
In eq u a lity E d u ca tion
G row th
+
+
+–––
–
–
+–
Inequality and growth are both endogenous, and depend on natural resources
X = inequality

TheoryTheory Two sectors
Primary sector with unequal distribution of earnings
Manufacturing sector with opportunities for learning and innovation
Large primary sector meansGreater inequalitySlower economic growth

Explore relationship between natural resource intensity, inequality, and economic growthinequality, and economic growth across countries since 1965
Hypothesis:Hypothesis: Natural resource Natural resource dependence hurts growthdependence hurts growth through increased inequality, inter alia
Study 87 industrial and developing countries from 1965 to 1998
Empirical AnalysisEmpirical Analysis

0
10
20
30
40
50
60
70
80
90
100
0 10 20 30 40 50 60 70
Gini index for income (various years)
Gin
i in
dex f
or
lan
d (
vari
ou
s y
ears
)
Distribution of Distribution of Income and Land Income and Land
45
Land is less equally distributed than income
r = 0.57
r = rank correlation
50 countries

Inequality and Natural Capital
0
10
20
30
40
50
60
70
0 10 20 30 40 50 60
Share of natural capital in national wealth 1994 (%)
Gin
i in
dex
of
ineq
ual
ity
Increase in natural capital by 3% of national wealth goes along with an increase in Gini by 1 point.
7 African countries where saving is 5% of GDP
and per capita growth is -1% per year
Notice Notice
clustercluster
Increased natural
resource
dependence goes
along with increased
inequality
r = 0.41
75 countries
Inequality of access to education and land: Same pattern
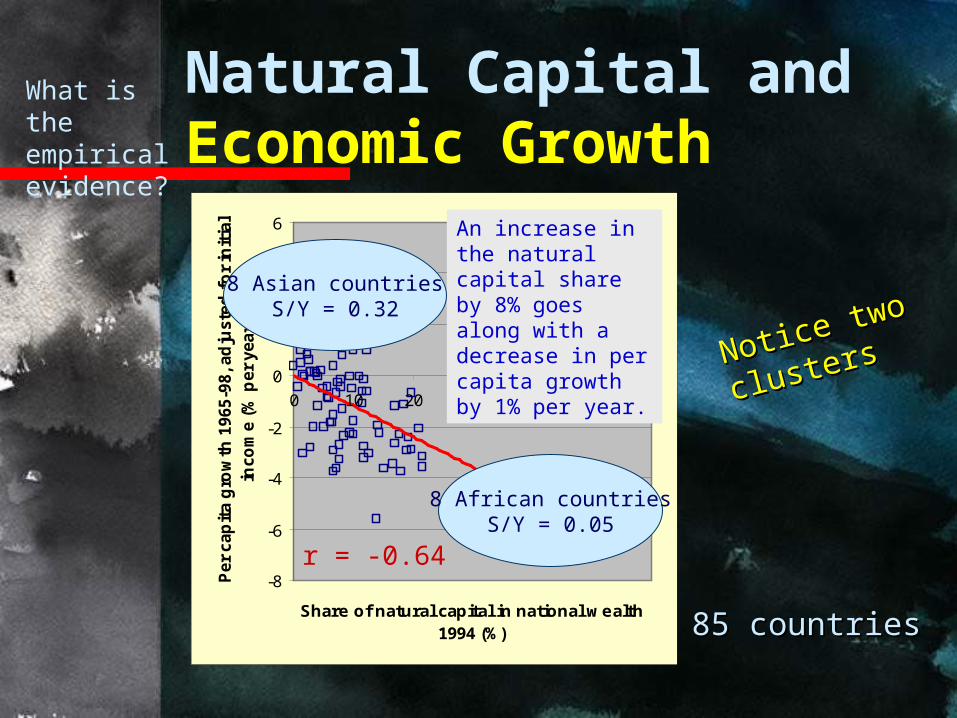
Natural Capital and Economic Growth
85 countries85 countries
What is the empirical evidence?
-8
-6
-4
-2
0
2
4
6
0 10 20 30 40 50 60
Share of natural capital in national wealth 1994 (%)
Per
cap
ita g
row
th 1
965-9
8, ad
juste
d f
or
init
ial
inco
me (
% p
er
year)
An increase in the natural capital share by 8% goes along with a decrease in per capita growth by 1% per year.
r = -0.64
8 African countriesS/Y = 0.05
8 Asian countriesS/Y = 0.32
Notice two Notice two
clustersclusters

-6
-4
-2
0
2
4
6
0 10 20 30 40 50 60 70
Gini index of inequality
Per
cap
ita
gro
wth
196
5-98
, ad
just
ed f
or
init
ial
inco
me
(% p
er y
ear)
An increase in Gini index by 12 points goes along with a decrease in per capita growth by almost 1% per year
r = -0.50
Growth and Inequality, 1965-98
What
do the
data
say?
Sweden South Africa
France
Brazil
No No discernibldiscernible sign e sign that that equality equality stands in stands in the way the way of of economic economic growthgrowth
Korea
75 countries
Sierra Leone

One Possible One Possible InterpretationInterpretation
Inequality
Resources
Growth
Inequality
Growth
+ =Resources

Another Possible Another Possible InterpretationInterpretation
Inequality
Resources
Growth
Resources
Growth
+ =Inequality
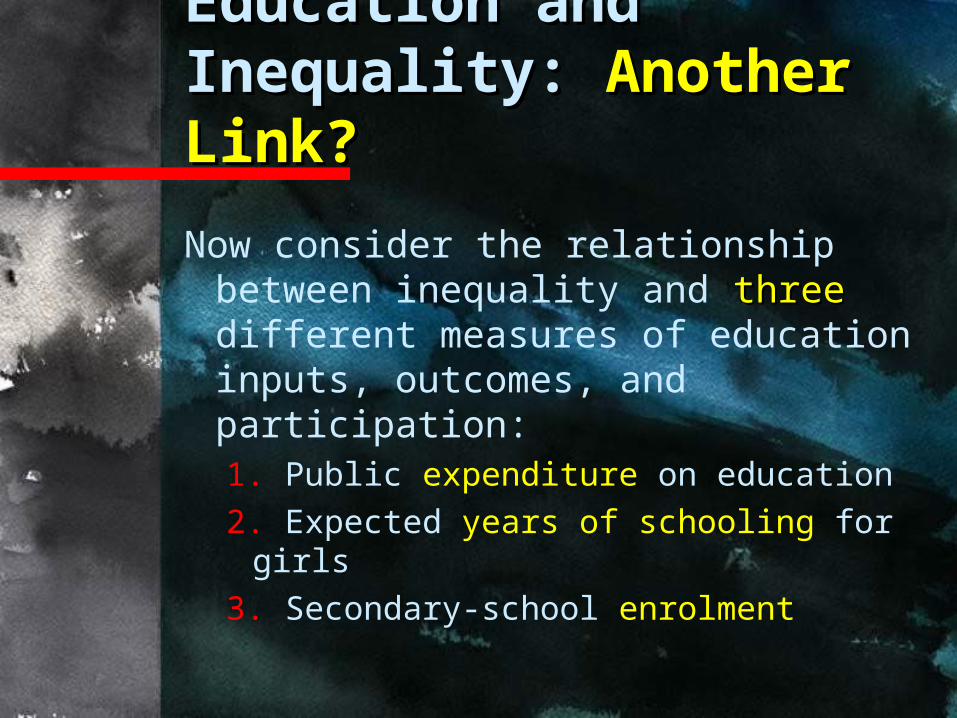
Education and Education and Inequality:Inequality: Another Another Link? Link?
Now consider the relationship between inequality and threethree different measures of education inputs, outcomes, and participation:1. Public expenditure on education2. Expected years of schooling for
girls3. Secondary-school enrolment

Secondary Enrolment and Inequality
75 countries75 countries
0
10
20
30
40
50
60
70
0 20 40 60 80 100 120
Secondary-school enrolment 1980-97 (%)
Gin
i in
dex o
f in
co
me in
eq
uality
An increase in the secondary-school enrolment rate by five percentage point goes along with a decrease of almost one point on the Gini scale.
r = -0.54
Expenditure on education and years of schooling: Same pattern

Secondary Enrolment and Growth
-8
-6
-4
-2
0
2
4
6
0 20 40 60 80 100 120
Secondary-school enrolment 1980-97 (%)
Per
cap
ita
gro
wth
196
5-98
, ad
just
ed f
or
init
ial i
nco
me
(% p
er y
ear)
Positive but diminishing returns to education
An 25 point increase in secondary-school enrolment goes along with an increase in per capita growth by 1% per year.
r = 0.72
87 countries

One Possible One Possible InterpretationInterpretation
Growth
Education
Growth
Inequality
Inequality
+ =Education

Another Possible Another Possible InterpretationInterpretation
Growth
Inequality
Growth
Education
InequalityInequality
Education
+ =

0
5
10
15
20
25
30
35
40
45
0 20 40 60
Share of natural capital in national wealth 1994 (%)
Inve
stm
ent
1965
-98
(% o
f G
DP
)
Investment and Natural Capital
Increased natural resource dependence discourages investment and growth
An increase in natural capital by 5% of national wealth goes along with a reduction in investment by almost 1% of GDP.
r = -0.38
86 countries

-40
-20
0
20
40
60
80
100
120
0 20 40 60
Share of natural capital in national wealth 1994 (%)
Sec
on
dar
y-sc
ho
ol e
nro
lmen
t 19
80-9
7 (%
)
Education and Natural Capital
Increased natural resource dependence discourages education and growth
An increase in natural capital by 10% of national wealth goes along with a reduction in secondary enrolment by almost 15% of cohort.
r = -0.63
87 countries

ConclusionConclusion
DiversificationDiversification away from natural away from natural resources may spur economic resources may spur economic growthgrowth1.1. by increasing and improving by increasing and improving
human capitalhuman capital ... ... 2.2. ... as well as ... as well as social capitalsocial capital, by , by
reducing inequality ...reducing inequality ...3.3. ... and also ... and also real capitalreal capital
This may be one reason why inequality This may be one reason why inequality and growth are inversely related and growth are inversely related across countries: an equilibrium across countries: an equilibrium outcomeoutcome

ConConclusionclusion
The
End
The
EndOther possible reasonsOther possible reasons
1.1. More and better More and better educationeducation reduces reduces inequality and encourages growth inequality and encourages growth
2.2. Excessive inequality triggers Excessive inequality triggers demand for more and better demand for more and better education that reduces inequality education that reduces inequality and speeds up growthand speeds up growth
3.3. Excessive inequality reduces Excessive inequality reduces social social cohesioncohesion, efficiency, and growth , efficiency, and growth
Many possibilities!Many possibilities!
These slides can be viewed on my website: www.hi.is/~gylfason