Inequality, Employment and Public Policy · inequalities, the paper discusses redistribution...
55
WP-2018-003 Inequality, Employment and Public Policy S.Mahendra Dev Indira Gandhi Institute of Development Research, Mumbai January 2018
Transcript of Inequality, Employment and Public Policy · inequalities, the paper discusses redistribution...

WP-2018-003
Inequality, Employment and Public Policy
S.Mahendra Dev
Indira Gandhi Institute of Development Research, MumbaiJanuary 2018
Inequality, Employment and Public Policy
S.Mahendra Dev
Email(corresponding author): [email protected]
AbstractThis paper examines dimensions of inequality including labour market inequalities and discusses public
policies needed for reduction in inequalities. It discusses both inequality of outcomes and inequality of
opportunities. In terms of income, India is the second highest inequality country in the world next to
South Africa. Wealth inequalities are also high in India. Most of the inequalities will have labour market
dimension. Labour market inequalities can be found across sectors, wages and earnings, quality of
work, labour market access and, between organised and unorganised sectors. On public policies and
inequalities, the paper discusses redistribution measures, macro policies, sectoral policies and impact
on employment, social policies such as education, health, hunger and malnutrition, social protection,
corruption, gender disparities and climate change. The paper argues for fundamentals change to human
capital and universal basic services. Investments in social infrastructure, health, education, affirmative
action and provision of public services can lead to the creation of egalitarian society.
Keywords: Inequality of outcomes, inequality of opportunities, consumption, income, wealth,labour market, wage inequality, fiscal policy, monetary policy, trade policy, human capital,health, education, informal sector, inclusive growth, corruption, gender, climate change
JEL Code: D63, E24, J28

1
Inequality, Employment and Public Policy
S.Mahendra Dev
Abstract
This paper examines dimensions of inequality including labour market inequalities and
discusses public policies needed for reduction in inequalities. It discusses both inequality of
outcomes and inequality of opportunities. In terms of income, India is the second highest
inequality country in the world next to South Africa. Wealth inequalities are also high in
India. Most of the inequalities will have labour market dimension. Labour market inequalities
can be found across sectors, wages and earnings, quality of work, labour market access and,
between organised and unorganised sectors. On public policies and inequalities, the paper
discusses redistribution measures, macro policies, sectoral policies and impact on
employment, social policies such as education, health, hunger and malnutrition, social
protection, corruption, gender disparities and climate change. The paper argues for
fundamentals change to human capital and universal basic services. Investments in social
infrastructure, health, education, affirmative action and provision of public services can lead
to the creation of egalitarian society.
Key words: Inequality of outcomes, inequality of opportunities, consumption, income,
wealth, labour market, wage inequality, fiscal policy, monetary policy, trade policy, human
capital, health, education, informal sector, inclusive growth, corruption, gender, climate
change

2
Inequality, Employment and Public Policy1
S.Mahendra Dev
“Inequality is in the forefront of public debate. Much is
written about the 1 per cent and the 99 per cent, and people are
more aware of inequality than even before. ..But if we are serious
about reducing income inequality, what can be done? How can
heightened public awareness be translated into policies and actions
that actually reduce inequality? .. In this book I set out concrete
policy proposals that could, I believe, bring about a genuine shift in
the distribution of income towards less inequality…The future is
very much in our hands” (p.1)
Anthony B. Atkinson (2015), “Inequality: What can be
done?”, Harvard University Press.
1. INTRODUCTION
Development can’t be discussed without talking about inequality. Theories of income
distribution have been in the literature of economics from before Adam Smith to the present
day. Ricardo characterises income distribution as the principal problem of economics
(Sandmo, 2015). Several philosophers and economists have discussed about inequality2. In
recent years, rising income inequality has attracted the attention of IMF, World Bank, OECD
and Davos meetings. Arab Spring and Brexit also brought this issue to the limelight. The
number of billionairs is increasing throughout the world with larger share in income and
wealth. With the release of the book by French economist Thomas Piketty (2014), there has
been more debate on inequality in several parts of the world3. Atkinson (2015) and Milanovic
(2016) discuss global inequality at length4. Recent edited volume by Boushey et al (2017) on
‘After Piketty” provides essays that interrogate Piketty’s arguments.
First time at global level, a goal on inequality is included in sustainable Development Goals
(SDGs). Goal 10 of SDGs is about reduction in inequality within and among countries.
Target 1 of Goal 10 says “ By 2030, progressively achieve and sustain income growth of the
bottom 40 per cent of the population at a rate higher than the national average”. Target 2 tries to
achieve much more ambitious one: “By 2030, empower and promote the social, economic and
1 Presidential Address delivered at the 59th Conference of the Indian Society of Labour Economics,
Thiruvananthapuram, 16-18 December. Some parts of this address were borrowed from my Malcolm Adisesaiah
Lecture. 2 On justice and ethical questions, moral philosophers discussed more as compared to economists although latter
also had their foot on this issue. In recent years see, see Rawls (1971) on justice. Economists from Classical
School (Adam Smith, Karl Marx, J.S. Mill), Neoclassical marginalist approach, non-marginalist approach,
Utilitarians have all discussed about income distribution. See Atkinson and Bourguignon ( 2015) for a collection
of articles on inequality. Kuznets (1957) used statistical approaches for looking at long term trends in
inequality. Also see Atkinson (1975) and Sen (1973). 3 Apart from Piketty, other Euopean economists like Emmanual Saez (French), Gabriel Zucman (French),
Anthony Atkinson (British), Nicholas Bloom (British), Thomas Phillipon (Grench), Branco Milanovic have
written on inequality. 4 Also see Stiglitz (2013) on inequality in the USA. See Basu (2006) and Basu and Stiglitz (2016)

3
political inclusion of all, irrespective of age, sex, disability, race, ethnicity, origin, religion or
economic or other status”5
There are two main arguments for reduction in inequality. One is ethical or philosophical
argument that equity is important for its own sake (intrinsic value). Second one is reduction
in inequality is required for sustainability of growth (instrumental value)6. The related one is
that even if one is concerned only with poverty, inequality can’t be ignored as rise in
inequality would adversely affect poverty reduction.
It is argued that some degree of inequality may not be a problem if it provides incentives for
people to accumulate human capital. Tendulkar (2010) draws a distinction between inequity
and inequality. He examines the path breaking work of Simon Kuznets who indicates that
inequalities rise with economic growth upto a point and then decline. This is the so called
Kuznets inverted ‘U’ shape curve. Tendulkar says that even if measured inequality increases,
there may not be increasing feeling of inequity as people observe high mobility and can
aspire to move upwards like others.
However, Rising inequality can have social costs and lead to reduction in economic growth
apart from the normative dimension to equality. It is also useful to distinguish between
inequality of outcome and inequality of opportunity. Assets, income or expenditure are
generally used for outcomes. Inequality of opportunity is often measured by studying non-
income dimensions such as health, education, access to basic services and human
development. Individual circumstances are important for examining inequalities in
opportunities. The circumstances such as gender, race, ethnicity, or place of birth are outside
the control of an individual. (Kanbur et al, 2014).
Labour market inequalities are high all over the world. Most of the inequalities (economic
and social) will have labour market dimension. Some issues on inequality exclusively deal
with labour market structures, processes, mechanisms and outcomes while some others are
influenced by labour institutions and labour market forces (IHD, 2014). Employment should
be the focus in addressing inequalities.
Economic inequalities co-exist and intersect with many other forms of equally striking social,
political and cultural inequalities. Therefore intersectional inequalities become important
(UNDP, 2015). In the case of India, caste has a peculiar role that separates it out from the rest
of the world (Dreze and Sen, 2013). Therefore, inequalities among caste or social groups
become important. Similarly, gender inequalities are also high in India.
One has to successfully address issues of growing economic and social concerns, such as the
availability of quality jobs and persistent inequality. The problem of inequality has to be
5 See http://www.un.org/sustainabledevelopment/sustainable-development-goals/ 6 For a discussion on this see Atkinson (2015).

4
effectively addressed by public policy. The policies to reduce inequalities will be effective if
historical process through which particular pattern of inequality arise is taken into
consideration (Barbosa et al, 2017). There are both ‘State failures’ and ‘market failures’ in
addressing inequality.
Against this background, in this lecture7, we will address two questions:
(a) What are the dimensions and trends in inequality including labour market inequalities in
India and at global level?
(b) How do we tackle rising inequalities through public policy?
Although we focus more on economic inequality, social and political factors are equally
important for framing public policies. Among other policies, we also focus on the issues
relating to two challenges. The “structural change challenge” is focused on moving resources
from traditional low- productivity activities into modern, more productive industries or
activities. The “fundamentals challenge” relates to development of broad capabilities such as
human capital and infrastructure (Rodrik et al, 2017). In this address, we argue that, among
other things, the ‘fundamentals challenge’ is equally or more important for India’s
development and reduction in inequality.
2. DIMENSIONS OF INEQUALITY AT GLOBAL LEVEL
There are a number of studies by IMF and World Bank on inequality at global level in the lat
few years.
Recent Fiscal Monitor of IMF focuses on tackling inequality (IMF 2017a). The conclusions
of this study are the following8.
(a) Global inequality in per capita GDP in terms of gini coefficient declined from 0.68 in
1988 to 0.62 in 2013. Rise in per capita GDP of some of the emerging economies like China
and India is responsible for this convergence9.
(b) The global picture hides heterogeneities across countries and regions. Inequalities within
countries increased significantly. In the last three decades, 53% of the countries have seen an
increase inequality with some countries showing an increase in gini coefficient exceeding two
points.
(c) Developed countries (e.g. USA, Europe) experienced sizable rise in inequality driven
mainly by the growing income of the top 1 per cent.
(d) Emerging market and developing economies show diverse trends in inequality. For
example, Eastern Europe and Central Asia recorded rise in inequality during the
postcommunist transition years and decline later. Similarly inequality in Latin America rose
7 Some parts of this address are borrowed from Dev (2016) 8 A study by Dabla-Norris et al (2015) from IMF also examines trends in inequality of income and opportunities
at global level. Also see a World Bank study (2016) which examines latest trends in inequalities in
income/consumption across the world. On inequalities in Asia and Pacific countries see Kanbur et al (2014). 9 Grigoli and Robles (2017) show that the relationship between inequality and economic development is non-
linear. In particular, similar to the debt overhang literature, they identify an inequality overhang level at which
the slope of the relationship between income inequality and economic development switches from positive to
negative at a net Gini of about 27 per cent.

5
during 1980s and 1990s before declining sharply afterwards. In Africa and Asia the gini
coeffient increased in some countries while declined in some other countries.
(e)The key source of inequality at global level has been technological change favouring
higher skills. Globalization and commodity cycles also play an important role. In Western
Europe and the USA, technological progress has also translated into reduction of middle class
jobs, a phenomenon known as polarisation.
(f)Country specific factors relate to economic development, stability and domestic policies
including financial integration, redistributive fiscal policies, and liberalisation and
deregulation of labour and product markets also play important determinants of inequality
trends within countries.
(g)Changes in income inequality are reflected in other dimensions like wealth inequality. The
rise of top incomes along with high saving rates led to growing wealth inequality. In the
United States and many other countries, rising concentration of wealth held by 1 per cent of
the population is responsible for increase in wealth inequality.
Inequality and Growth: Kuznets inverted U shape, U shape and Kuznets Waves
The story of inequality and growth can be started from Kuznets inverted U shape which
shows that inequality increases initially and later falls with economic growth. Piketty’s work
on the US and Europe is well known (Piketty, 2014). In contrast to Kuznets inverted U shape
curve, Picketty’s data indicated U shaped curve. From this history, Piketty develops a grand
theory of capital and inequality.
In a recent book, Milanovich (2016) develops the concept of Kuznets wave or cycle to
explain changes in inequality over long period. According to him, Kuznets’s approach cannot
explain the rising inequality that occurred after 1980. On the other hand, Piketty’s theory
does not explain if we extend the data further back, into the 18th and 19th centuries.
Fig 1. The relationship between income inequality and mean income (The Kuznets relationship) for the United
States, 1774-2013

6
Source: Milanovic (2016)
Milanovic explains Kuznets wave for the US in the following way. Inequality in the US rose
between Independence (1774) and the Civil War (1860) and then continued to rise until the
early 20th Century when it reached peak at slightly over 50 Gini points at an income level of
$5000 per capita (in 1990 prices) (Fig 1.). After the great depression, it declined steadily until
the end of World War II. Inequality remained at a historically low of about 35 Gini points
until the trough in 1979. After that it increased steadily, reaching over 40 Gini Points by the
second decade of 21st Century. Kuznet’s hypothesis of inverted ‘U’ shape is consistent upto
1979 but does not explain the rise in inequality in the last 40 years. The concept of Kuznets
waves explains the upsurge of inequality since 1980 (Milanovic, 2016). The rise in inequality
was driven by the second technological revolution.
Global Inequality 1988-2008: Elephant Curve
A study by Lakner and Milanovic (2013) presents a newly compiled and improved database
of national household surveys between 1988 and 2008. The study ranks the world population
from the poorest 10% to the richest 1% in 1988 and again in 2008. It documents the growth
in income between these two years, a period of ‘high globalisation’ from the fall of Berlin
Wall to the fall of Lehman Brothers.
The Elephant Curve in Fig 2 shows that China’s population in 40th to 50th percentile benefited
the most during this period. On the other hand, US middle class from 80th to 90th percentile
lost during 1988-2008. This middle class probably represent the Trump’s constituency.
Richest 1% gained a lot in the 20 year period. Both curves in Fig 2 thus show that China’s
middle classes and the world’s rich have gained more in the era of globalisation.
Fig 2. Elephant Curve: Global Income Distribution, 1988 to 2008.

7
Source: Economist, September 17, 2016
Wage Inequalities at Global Level
Wage inequalities have significant correlation with household inequalities in many countries.
The Global Wage Report 2016/17 (ILO, 2016) examines wage inequalities in both developed
and developing economies. This report provides the following trends
(1) The real wage growth declined in emerging and developing G20 countries from 6.6% in
2012 to 2.5% in 2015. On the other hand, wage growth rose in developed G20 countries from
0.2% in 2012 to 1.7% in 2015.
(2) Labour income share declined in majority of the countries as wage growth lagged behind
growth of labour productivity10 during 2010-15. Some exceptional countries are China,
Germany and the United States. However, the labour share is below peak levels even in these
countries.
(3) Wage inequality rose in many countries of the world in recent decades. Wages climb
gradually across wage distribution but jump sharply for the top 10% and particularly for the
top 1% of the employees. In Europe, the top 10% receive on an average 25.5% of the total
wages paid while it is higher in emerging economies like Brazil (35%), India (43%) and
10 A recent study by IMF (2017) also indicates that labour share in national income has been declining in both
developed and developing countries. According to this study, the labor share declined in 29 of the largest 50
economies between 1991 and 2014. These 29 economies accounted for about two-thirds of world GDP in 2014.
8
South Africa (49%). In India and South Africa, the lowest paid 50% receive respectively 17%
and 12% of all wages paid.
(4) According to the Global Wage Report, wages and wage inequality are not determined
only by the skills-related characteristics like level of education, age or tenure. Several other
factors such as gender, enterprise size, type of contract and the sectors in which workers
work.
(5) The report also says that increasing wage inequality between enterprises has played an
important role in increase in wage inequality the US between 1981 and 2013. On the other
hand, in Brazil, higher minimum wage could be responsible for decline in inequality between
enterprises. Inequality within enterprises also play major role in total inequality. In the US
larger share of total wage inequality could be attributed to inequality within enterprises than
to inequality between enterprises. Wage inequality within enterprises in Europe in 2010
accounted for nearly half of the total wage inequality. Extremely high wages paid to a few
individuals in some enterprises leads to a ‘pyramid’ of highly unequally distributed wages.
(6) The gender pay gap declined from 2002 to 2010 but remains positive. The gap is higher at
the top than at the middle or bottom. Overall hourly gender gap for Europe is about 20%, it
reaches to 45% in the top 1% of wage earners.
3. DIMENSIONS AND TRENDS IN INEQUALITY IN INDIA
The biggest inequality in India has been the slow progress in social indicators and human
development inspite of high economic growth. One example is that nearly 40% of our
children suffer from malnutrition in 2015-16. Quality of employment, health and education is
a major concern.
The approach of growth with equity has been followed since independence11. However, focus
has been more on absolute poverty than inequality. Poverty numbers show that it declined
faster in the post-reform period as compared to preform period. Within the post-reform
period, poverty declined faster during 2004-05 to 2011-12 as compared to the period 1993-94
to 2004-05. However, inequality increased during the post-reform period.
3.1. India is the second highest income inequality country in the world, lower than only
South Africa
In India, consumer expenditure from NSS (National Sample Survey) is generally used to
estimate inequality. As shown in Table 1, consumption gini coefficient is 0.36 in 2011-12
(Fig 3). On the other hand, inequality in income is high with a gini coefficient of 0.55 while
wealth gini coefficient is 0.74 in 2011-12 (Table 1). Income gini is 20 points higher than
consumption gini while wealth gini is nearly 40 points higher than consumption gini.
Thus, inequality in income and wealth is much higher than that of consumption12.
11 On poverty and income distribution in India, see Srinivasan and Bardhan (1974), Banerjee et al (2017a) 12 India has made tax data public recently by releasing it for the year 2011-12 (assessment year 2012-13). But, it
is very small sample to look at overall income inequalities.

9
Inequality in consumption and wealth is lower in rural areas as compared to urban areas.
However, inequality in income is higher in rural than urban areas.
Table 1. Consumption, Income and Wealth Inequality in India: Rural, Urban and Total, 2011-12
Sector Total Rural Urban
Consumption Gini 0.359 0.287 0.377
Income Gini 0.553 0.541 0.506
Wealth Gini * 0.740 0.670 0.770
*Refers to 2012
Sources: Himanshu (2015) for Consumption Gini; Income gini coefficients are Estimated from the data of
Indian Human Development Survey (IHDS); Anand and Thanpi (2016) for wealth gini coefficients
Fig3. Trends in Inequality in consumption, income and wealth
Source: Same as Table 1
Milanovich (2016a) shows that India has the second highest inequality next to South Africa if
we take income instead of consumption (Fig 4)
Fig 4. Income Inequality in India compared to other countries
Source: Milanovic (2016a)
Many studies have shown that inequality in consumption increased in the post-reform
period13. Most of the studies show that it increased marginally in rural areas while it rose
significantly for urban areas. Table 2 provides trends in inequality in consumption, income
and wealth. It shows consumption and income gini increased marginally between 2004-05
13 For example, see Subramanian and Jayaraj (2016), Radhakrishna (2015), Himanshu (2015), Sripad and
Vakulabharanam (2013), Dev and Ravi (2008) Sen and Himanshu (2004), Srinivasan (2013). On consumption
and income inequality see Dubey (2016).

10
and 2011-12. However, wealth inequality increased significantly from 0.66 to 0.74 - by 8
points during the same period.
Table 2: Trends in Inequality (Rural+Urban)
Sector 1993-94 2004-05 2011-12
Consumption Gini 0.300 0.347 0.359
Income Gini -- 0.548 0.553
Wealth Gini * 0.650 0.660 0.740
*Wealth Gini refers to 1991, 2002, 2012
Source: Same as Table 1
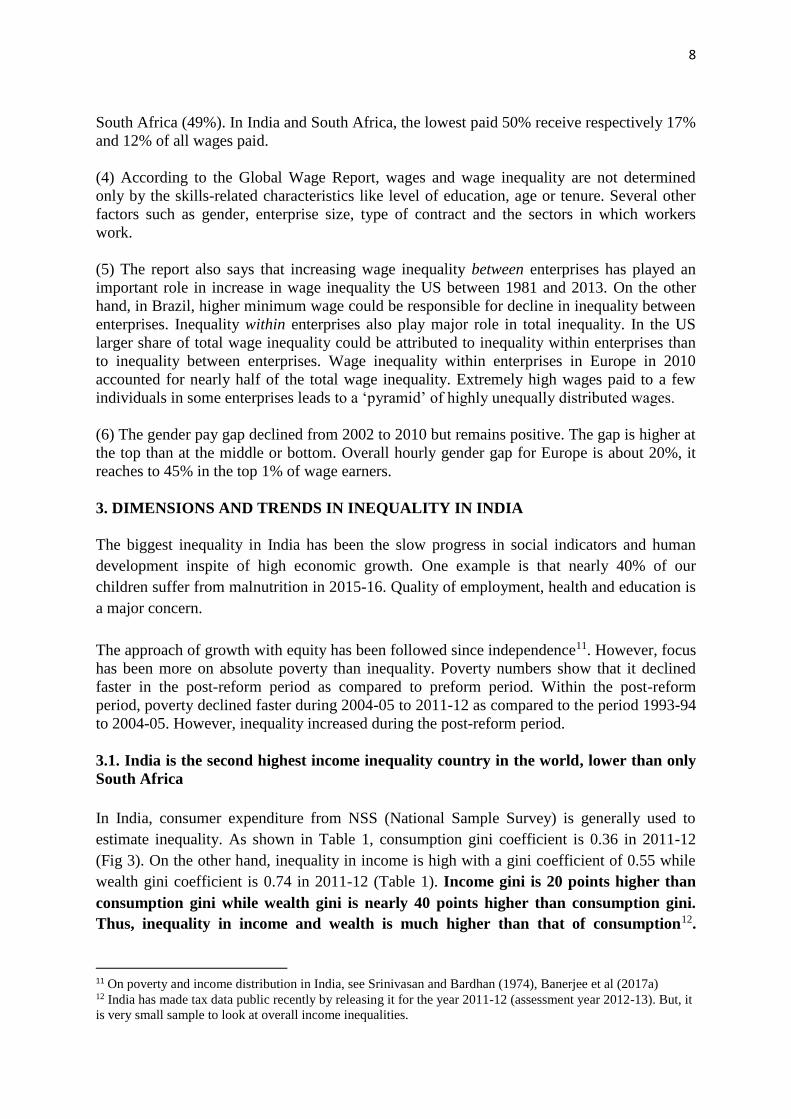
3.2. Regional Inequalities in Income and Wealth
Income and wealth inequalities are high in all the major states of India with significant
regional disparities in levels and trends (Tables 3 and Fig. 5). Income inequality is the highest
in Gujarat (0.61) followed by Chattisgarh (0.60), West Bengal (0.57), Haryana (0.57) and
Madhya Pradesh (0.56) in 2011-12 (Table 3, Fig 5). It is the lowest in Jammu&Kashmir
(0.46) followed by Tamil Nadu (0.47), Kerala (0.47). Income inequality increased
significantly between 2004-05 and 2011-12 in Chattisgarh, West Bengal, Himachal Pradesh
and Punjab. On the other hand, it declined in Southern states (Kerala, Tamil Nadu,
Karnataka) and Jammu& Kashmir.
Inequality in wealth is very high across all the major states ranging from gini coefficient of
0.80 in Maharashtra to 0.55 in Jammu&Kashmir in 2012 (Table 4, Fig 6). Apart from
Maharashtra, wealth inequality is high in Punjab, West Bengal, Madhya Pradesh and Tamil
Nadu. In contrast to income inequality, Southern states (Tamil Nadu, Andhra Pradesh,
Karnataka and Kerala) showed high wealth inequality. Again, unlike income inequality,
wealth inequality increased significantly in almost all the states between 2002 and 2012.
Table 3: Income Inequality (Rural+Urban) based on India Human Development Survey: 2004-05 and 2011-12
States Gini
2004-05
Gini
2011-12
Rank States Gini
2004-05
Gini
2011-12
Rank
Gujarat 0.606 0.606 1 Orissa 0.535 0.520 12
Chattisgarh 0.469 0.604 2 Jharkhand 0.532 0.513 13
West Bengal 0.522 0.567 3 Andhra Pradesh 0.517 0.512 14
Haryana 0.511 0.565 4 Assam 0.521 0.508 15
Madhya
Pradesh
0.549 0.556 5 Uttarakhand 0.473 0.493 16
Karnataka 0.591 0.541 6 Maharashtra 0.504 0.476 17
Himachal
Pradesh
0.476 0.533 7 Kerala 0.568 0.473 18
Punjab 0.483 0.530 8 Tamil Nadu 0.501 0.472 19
Uttar Pradesh 0.546 0.526 9 Jammu&Kashmir 0.511 0.462 20
Bihar 0.509 0.521 10 All India 0.548 0.553
Rajasthan 0.499 0.521 11
Source: Estimated from the data of India Human Development Surveys 2004-05 and 2011-1214.
14 Estimates sent to me by Kartikeya Naraparaju, Faculty, IIM, Indore
11
Fig 5. Income Inequality Across States
Source: IHDS
Table 4: Wealth Inequality (Rural+Urban)
States Gini
2002
Gini
2012
Rank States Gini
2002
Gini
2012
Rank
Maharashtra 0.68 0.80 1 Kerala 0.63 0.64 12
Punjab 0.68 0.75 2 Uttarakhand 0.60 0.64 13
West Bengal 0.64 0.75 3 Chattisgarh 0.61 0.64 14
Madhya Pr 0.60 0.74 4 Uttar Pradesh 0.59 0.63 15
Tamil Nadu 0.71 0.74 5 Rajasthan 0.55 0.63 16
Andhra Pradesh 0.72 0.72 6 Himachal Pradesh 0.54 0.62 17
Haryana 0.68 0.71 7 Jharkhand 0.55 0.61 18
Assam 0.52 0.69 8 Odisha 0.61 0.60 19
Gujarat 0.65 0.69 9 Jammu&Kashmir 0.52 0.55 20
Bihar 0.60 0.67 10 All India 0.66 0.74 --
Karnataka 0.65 0.67 11
Source: Anand and Thanpi (2016
Fig 6. Wealth Inequality Across States
Source: Based on data in Anand and Thampi (2016)

12
Table 5 provides gini coefficients for income, wealth and consumption in high and low
income states. It shows that inequality is high or low in both the category of states. The
inequality differs with regard to the measure viz., income, wealth and consumption used.
Gujarat has high inequality in income and wealth but has relatively lower consumption
inequality. Here income inequality is 30 points high than for consumption. In the case of
Kerala and Maharashtra, wealth inequality is much higher than income and consumption
inequality. In Bihar, consumption inequality is much lower than income and wealth
inequality.
Table 5 Inequaity for High and Low Income States: Rural+Urban, 2011-12 States Income Wealth Consumption
Gujarat O.61 0.65 0.31
Kerala 0.47 0.64 0.38
Mahashtra 0.48 0.80 0.37
Bihar 0.51 0.67 0.23
Chattisgarh 0.60 0.64 0.33
Jharkhand 0.51 0.61 0.30
The annual growth rate of per capita assets show that rich and middle income states (like
Maharashtra, Haryana and Kerala) have high growth while low income states such as Bihar
and Odisha have not improved their per capita assets as rapidly. The growth rates of assets
across social groups indicate that the general category accumulated wealth faster than SCs,
STs and OBCs. The levels of average wealth reveal that historically disadvantaged sections
continue to be behind the other castes (Anand and Thampi, 2016).
A recent study by Chancel and Piketty (2017) entitled “From British Raj to Billionaire Raj’
shows that inequalities in income increased in India. According to this study, the top 1% of
earners in India captured less than 21% of total income in the late 1930s, before dropping to
6% in the early 1980s and rising to 22% in 2014. Credit Suisse report shows that the share of
richest 1% of Indians in total wealth increased from 40.3% in 2010 to 58.4% in 2016.
Comparisons with other countries reveal that India is one of the most unequal countries in the
world. The share of top 10% in total wealth rose from 68.8% to 80.7% during the same
period (Chakravarty, 2016)15.
15 There have been several studies on convergence and divergence of Indian states in per capita income. Many
studies find no evidence of convergence across states. For example, see Ghose et al (2013). This study shows
significant divergence in per capita income across states in the aggregate and sectoral levels for the period
1968/69 to 2008/09. Also see Das et al (2013) which indicates evidence of conditional convergence for Indian
districts but at a rate that is only half of Barro’s “Iron Law”. Inequality in per capita income across states shows
that it was lower during 1980s – coefficient of variation being 0.28 to 0.29. It increased significantly from
around 0.32 in 1990-91 to 0.44 in 2008-09 with some fluctuations. It seems to have stabilised in the last few
years (GOI, 2012).

13
3.2. Inequality in Agriculture
Although the share of agriculture in GDP has declined, it is still the most important sector for
livelihoods. Therefore, inequalities in this sector will have implications of supply and demand
for the non-agricultural sector also.
Table 6: Estimates of Inequality (Gini) in Per Capita Income and MPCE for
Agricultural Households
States Gini Per
capita
income:
2013
Gini MPCE
2011-12
States Gini Per
capita
income:
2013
Gini MPCE
2011-12
Andhra Pradesh 0.60 0.27 Madhya Pradesh 0.49 0.25
Assam 0.52 0.23 Maharashtra 0.57 0.21
Bihar 0.61 0.22 Odisha 0.53 0.24
Chattisgarh 0.43 0.22 Punjab 0.53 0.29
Gujarat 0.43 0.23 Rajasthan 0.50 0.27
Haryana 0.51 0.25 Tamil Nadu 0.59 0.28
Jharkhand 0.53 0.28 Uttar Pradesh 0.58 0.28
Karnataka 0.58 0.23 West Bengal 0.53 0.28
Kerala 0.59 0.31 All India 0.58 0.28
Source: Chakravorty et al (2016)
One can estimate income inequality for agricultural households based on Situation
Assessment Survey of NSS. At the all India level, the income Gini at 0.58 was much higher
than consumption Gini at 0.28 – around 30 points higher (Table 6). The estimates at state
level also show similar results. The income Gini at state level varies from 0.43 in Chattisgarh
and Gujarat to 0.61 in Bihar. The difference between consumption Gini and income Gini for
Bihar is nearly 40 points. The income inequality is higher in South Indian states such as
Kerala, Andhra Pradesh and Tamil Nadu (Table 6). The consumption inequality is the highest
in Kerala.
Village Studies
In-depth village surveys can give a better idea on inequality in income in agriculture. The
project on Agrarian Relations in India (PARI), a project to study village economies in
different agro-ecological regions of India provides estimates of income inequality in 17
villages covering 9 states: Andhra Pradesh, Telangana, Karnataka, Madhya Pradesh,
Maharashtra, Rajasthan, Uttar Pradesh, Punjab and West Bengal16.
The 17 villages were surveyed between 2005 and 201117. These surveys provide two
conclusions. One is that the inequality in income is very high in study villages. It is much
higher than consumption inequality. Second conclusion is that there are significant village-
wise variations in income inequality. The gini coefficients of household income and per
capita income for the 17 villages are given in Table 7. The gini coefficient rages from 0.781
in Gharsondi village of Madhya Pradesh to 0.372 in Amarsinghi village of West Bengal.
16 Himanshu et al (2016) also provide estimates of income inequality in villages using longitudinal research. 17 For details of the project and design of surveys, see www.agrarianstudies.org

14
Table 7. Gini coefficients of household income and per capita income, by study villages
Village State Survey year Gini coefficient
Households Persons
Ananthavaram Andhra Pradesh 2005-06 0.656 0.602
Bukkacherla Andhra Pradesh 2005-06 0.607 0.539
Kothapalle Telangana 2005-06 0.577 0.565
Harevli Uttar Pradesh 2005-06 0.667 0.598
Mahatwar Uttar Pradesh 2005-06 0.527 0.516
Nimshirgaon Maharashtra 2006-07 0.549 0.491
Warwat Khanderao Maharashtra 2006-07 0.586 0.531
25 F Gulabewala Rajasthan 2006-07 0.740 0.686
Rewasi Rajasthan 2009-10 0.541 0.465
Gharsondi Madhya Pradesh 2007-08 0.781 0.721
Alabujanahalli Karnataka 2008-09 0.536 0.467
Siresandra Karnataka 2008-09 0.511 0.453
Zhapur Karnataka 2008-09 0.516 0.485
Amarsinghi West Bengal 2009-10 0.372 0.370
Panahar West Bengal 2009-10 0.664 0.547
Kalmandasguri West Bengal 2009-10 0.387 0.334
Tehang Punjab 2010-11 0.622 0.608
Source: Based on PARI survey data. Estimates for first eight villages are from Swaminathan and Rawal (2011)
using PARI survey data. Table prepared by Tapas Modak.
In an earlier study, Swaminathan and Rawal (2011) show that the Gini coefficient of income
was 0.645 across households for the 8 villages studied. The combined data for these 8
villages also reveal that the top decile received 54% of household incomes and the top
quintile received 68% of household incomes. On the other hand, the lowest decile accounted
for 1% of incomes and the lowest quintile accounted for less than 2% of total incomes.
Agriculture Wages: Agricultural labourers are one of the poorest segments of the society. In
this context, trends in agricultural ages are important. The annual average growth in
agricultural wages was nearly zero or marginally negative growth during 1999-00 to 2007-08
(Table 8)18. The growth rate rose significantly to 7% per annum during the period 2008-09 to
2012-13. However, the period 2013-14 to 2016-17 witnessed a growth rate of around 1% per
annum only. Monthly growth rates of agricultural wages increased in pre-demonitasation
period as well as post-demonetisation period due to revival of monsoon and deflation in
agricultural prices. But, if we take average annual growth rates, it is around 1% in the last
three years.
18 On rural wages, see Jose (2013) and Usami (2012)

15
Table 8. Yearly Growth Rates of Agricultural Real Wages
Year Growth Rates (%) Year Growth Rates(%)
1999-00 0.48 2008-09 4.17
2000-01 -7.33 2009-10 4.09
2001-02 5.37 2010-11 7.66
2002-03 0.01 2011-12 9.39
2003-04 -0.12 2012-13 9.18
2004-05 -1.23
2005-06 1.73
2006-07 -0.52
2007-08 -0.83 Average annual growth
During 2008-09 to 2012-13
6.90
Average annual growth
during 1999-00 to 2007-
08
-0.27 Average annual growth
rate during 2013-14 to
2016-17
1.00
Note: Agricultural wage rate refers to the average of wage rates in ploghing, sowing, weeding, transplanting and
harvesting.
Source: Estimated from Labour Bureau monthly data upto 2012-13; Himanshu (2016) for the period 2013-14 to
2016-17.
A study by Himanshu (2016) provides real wages for agricultural and non-agricultural
workers for the period 1998 to 2017. Fig 6 gives real wages of unskilled workers for the
period 1998 to 2016. The trends in unskilled labour in Fig 6 are similar to that of trends for
agricultural wages in Table 8.
Fig 6. Real wages of Unskilled workers: 1998 to 2016.
Source: Himanshu (2016)
Das and Usami (2017) examine trends in rural wages for the period 1998-99 to 2016-17.
Their study also shows that the first sub-period 1998-99 to 2006-07 was a period of
stagnation while the second sub-period from 2007-08 to 2014-15 was a period of high growth
in real wage rates. The study also shows that the steady growth in wage rates of major
occupations in rural areas ended in 2015-16 but recovered marginally in 2016-17.

16
3.3. Labour Market Inequalities19
Most of the inequalities (economic and social) will have labour market dimension. Some
issues on inequality exclusively deal with labour market structures, processes, mechanisms
and outcomes while some others are influenced by labour institutions and labour market
forces (IHD, 2014a).
Similar to some of the developing countries, Indian labour market has the characteristics of
high dependence on agriculture, domination of informal sector, virtual absence of
unemployment insurance or social wage, the problem of ‘working poor’, large share of self
employed, gender bias and seasonal migration. Another peculiar characteristic is that caste,
tribe, kinship etc. remain important determinant of access to quality employment.
Inequalities can be found across sectors, wages and earnings, quality of work, labour market
access and, between organized and unorganized sector. Labour market segmentation is
another important issue regarding inequalities. Wage differentials can’t be explained by
economic factors alone inspite of increasing occupational and geographical mobility.
Segmentation based on occupational skills and consequently industry and sectors is well
known.
Employment growth: Employment growth declined from about 1.84% per annum during
1993-94 to 2004-05 to 0.45% per annum during 2004-05 to 2011-12 (IHD, 2014). We do not
have recent numbers on employment from NSS. Using Employment-unemployment surveys
of Labour Bureau, Abraham (2017) examines employment trends during the period 2012-
2016. This study shows that employment growth stagnated across all sectors and
unemployment increased. There seems to be absolute decline in employment between 2013-
14 and 2015-16. Sectors such as construction, manufacturing and information
technology/business process outsourcing sectors fared the worst over this period. Estimates
by CMIE show that employment declined by 1.5 million after demonetisation in November
2016.
Functional Distribution of Income: Shares of wages and profits in national income provide
some idea of inequality. In the organised sector, the share of wages was 30% in the early
1980s, declined to 20% by the end of the 1990s and further declined to only around 10% by
the end of last decade (2009-10). There was only slight increase in recent years due to rise in
real wages. In contrast, the share of profits in net value added increased from less than 20%
in the 1980s to more than 50% in the last decade. It may be noted that while the share of
profits was lower than that of wages until the early 1990s, it is now almost six times that of
wages (Himanshu, 2015)20.
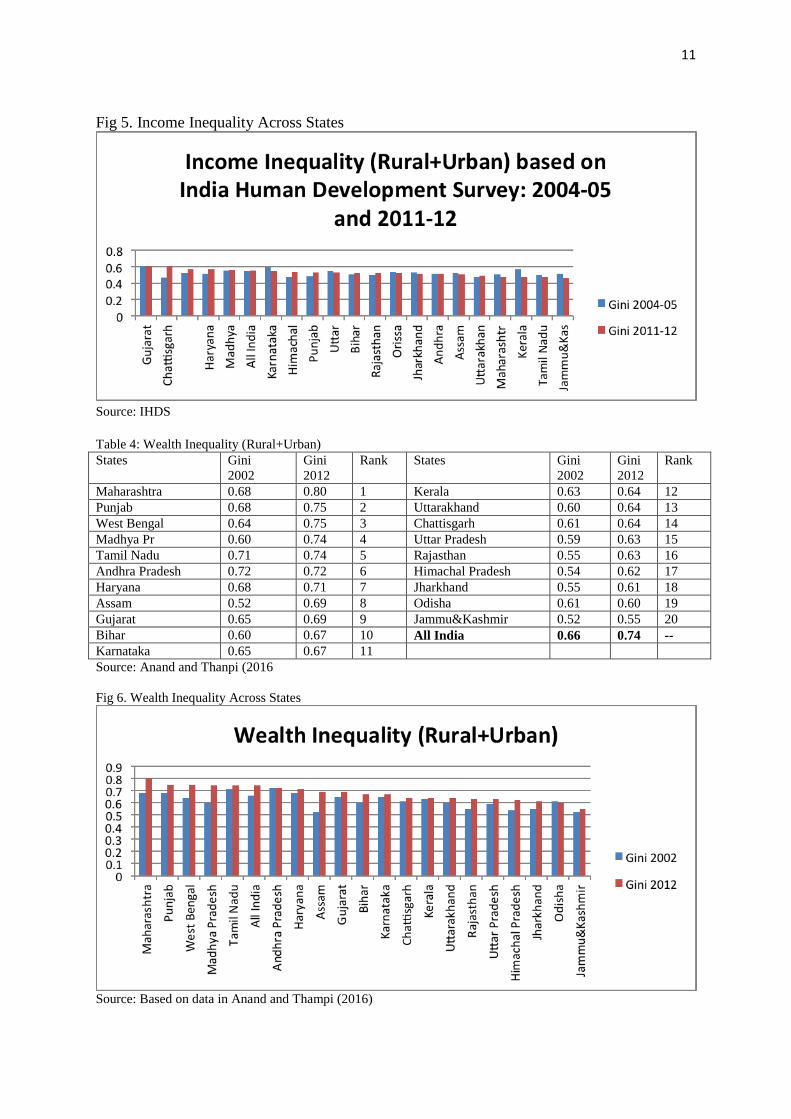
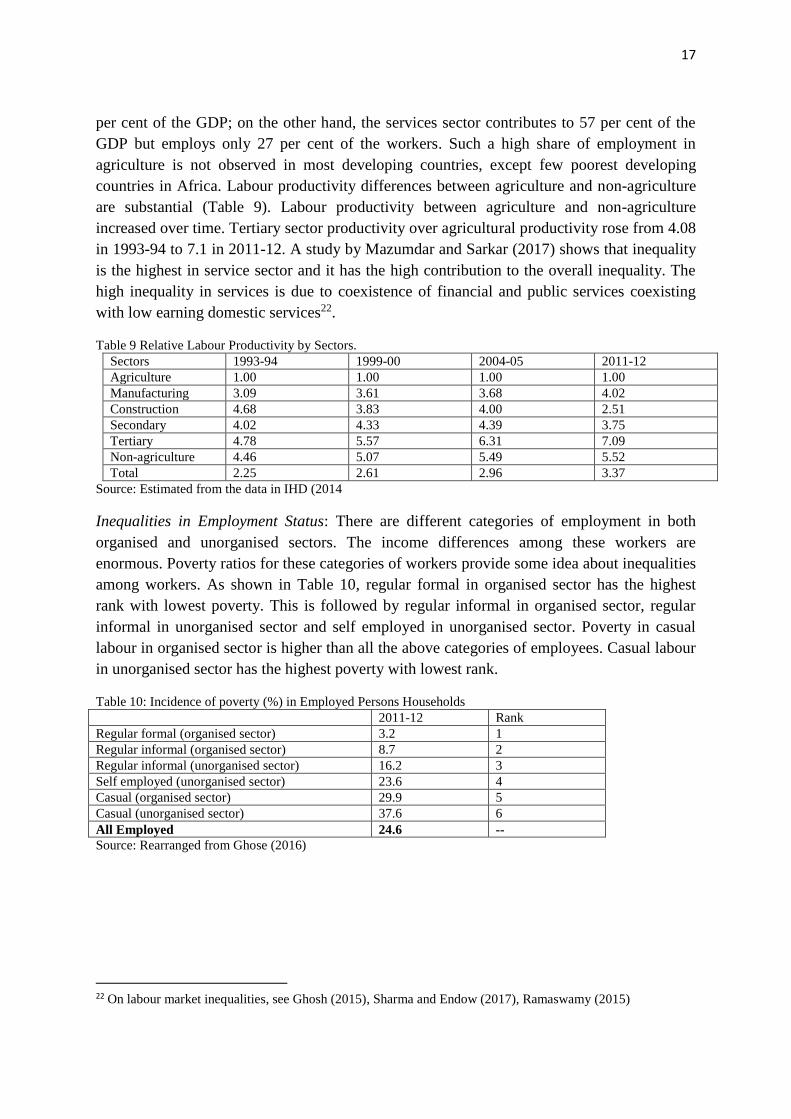
Sectoral Inequality: If we look at the shares of GDP and employment, there are significant
inequalities across sectors Viz., agriculture, industry and services21. While 49 per cent of the
workers are engaged in agriculture and the allied sectors, agriculture contributes to only 17
19 Some parts of this sub-section are borrowed from Dev (2015) 20 Also see Barbosa et al (2017) on the decline in share of wages in India’s organised sector 21 On rural livelihoods see Unni (2014)
17
per cent of the GDP; on the other hand, the services sector contributes to 57 per cent of the
GDP but employs only 27 per cent of the workers. Such a high share of employment in
agriculture is not observed in most developing countries, except few poorest developing
countries in Africa. Labour productivity differences between agriculture and non-agriculture
are substantial (Table 9). Labour productivity between agriculture and non-agriculture
increased over time. Tertiary sector productivity over agricultural productivity rose from 4.08
in 1993-94 to 7.1 in 2011-12. A study by Mazumdar and Sarkar (2017) shows that inequality
is the highest in service sector and it has the high contribution to the overall inequality. The
high inequality in services is due to coexistence of financial and public services coexisting
with low earning domestic services22.
Table 9 Relative Labour Productivity by Sectors.
Sectors 1993-94 1999-00 2004-05 2011-12
Agriculture 1.00 1.00 1.00 1.00
Manufacturing 3.09 3.61 3.68 4.02
Construction 4.68 3.83 4.00 2.51
Secondary 4.02 4.33 4.39 3.75
Tertiary 4.78 5.57 6.31 7.09
Non-agriculture 4.46 5.07 5.49 5.52
Total 2.25 2.61 2.96 3.37
Source: Estimated from the data in IHD (2014
Inequalities in Employment Status: There are different categories of employment in both
organised and unorganised sectors. The income differences among these workers are
enormous. Poverty ratios for these categories of workers provide some idea about inequalities
among workers. As shown in Table 10, regular formal in organised sector has the highest
rank with lowest poverty. This is followed by regular informal in organised sector, regular
informal in unorganised sector and self employed in unorganised sector. Poverty in casual
labour in organised sector is higher than all the above categories of employees. Casual labour
in unorganised sector has the highest poverty with lowest rank.
Table 10: Incidence of poverty (%) in Employed Persons Households
2011-12 Rank
Regular formal (organised sector) 3.2 1
Regular informal (organised sector) 8.7 2
Regular informal (unorganised sector) 16.2 3
Self employed (unorganised sector) 23.6 4
Casual (organised sector) 29.9 5
Casual (unorganised sector) 37.6 6
All Employed 24.6 --
Source: Rearranged from Ghose (2016)
22 On labour market inequalities, see Ghosh (2015), Sharma and Endow (2017), Ramaswamy (2015)

18
Table 11. Income Diversification Dynamics in Rural Areas
Sources of income 2004-05
(%)
2011-12
(%)
Changes
(%)
Agriculture 32.9 29.6 -3.2
Agri.Labour 22.1 16.0 -6.1
Casual Labourer 17.0 20.1 3.1
Salary 11.6 11.3 -0.3
Business 9.8 8.0 -1.8
Remittance 2.8 7.7 4.9
Other 3.9 7.2 3.3
Total 100.0 100.0 --
Source: Ranganathan et al (2016) using data from India Human Development Survey
Table 11 shows that agriculture is the dominant source of income in both periods. However,
there seems to be diversification from agriculture, agricultural labour and business to casual
labour and remittances. In fact, income from casual labourers became the second highest
source in rural areas. Rural income by quintiles shows that inequality (the ratio of
Qunitile5/Quintile1) increased from 19.3% in 2004-05 to 25.1% in 2011-12 (Ranganathan et
al, 2016).
High share of Informal Sector: The shares of informal sector and informal employment in
total employment respectively were 85% and 93% in 2011-12 (Ghose, 2016a). Similarly, the
share of informal employment in the formal sector employment was 56% in the same year.
There have been significant inequalities between formal and informal sectors. There are two
views on changes in informal and formal sectors. One view is that rapid growth in the
informal sector has been accompanied by very significant structural change and this sector
has witnessed increasing productivity over time (Ghose, 2016, 2016a). Another view is that
informal employment is increasing in both informal and formal sector. There is a need to
provide decent work for the informal sector workers. The need of appropriate policies to
improve incomes and conditions of work for informal sector is articulated in NCEUS (2009)
and Kannan (2014).
Small size of establishments and ‘Missing Middle’: The structure of non-agricultural
establishments shows that 98.6% of establishments have less than 10 workers. Own account
workers constitute 66.4% of the total establishments (GOI, 2016). India’s non-householdsub-
sector of manufacturing has bi-model structure with 40% of the workers in the directory
manufacturing establishments (DME) size class of 6-9 while 25% of the workers were in the
499+ employment size class. Mazumdar and Sarkar (2017) say that the ‘missing middle’ is
reponsible for slow growth of manufacturing and unequal growth of service sector.
Wage Inequalities: Inequality in wages in India shows that the ratio of regular workers wages
over casual workers was 2.1 and 2.6 times respectively in rural and urban areas in 2011-12.
The trends in earnings inequality of total wage workers show that inequality increased
significantly over the period 1983 to 2011-12 although it slightly declined between 2004-05
to 2011-12 (Table 12). The inequality among regular workers is consistently much higher
than casual workers.

19
Table 12. Trends in Earning Inequality of Wage Workers in India: Gini Coefficient
Period Total Wage
workers
Regular wage
workers
Casual wage
workers
1983 0.483 0.419 0.329
1993-94 0.506 0.400 0.288
2004-05 0.542 0.484 0.282
2011-12 0.510 0.501 0.303
Source: IHD (2014)
Higher inequality among regular wage workers is due to greater variation in skills and
qualifications while casual labourers are mostly unskilled workers. Inequalities in regular
workers rose as skilled workers wages have increased compared to less skilled workers.
If one looks at wages by education in India, the importance of skill premium come out
significantly. As compared to non-literates, workers with primary, middle, secondary and
tertiary get respectively 1.1, 1.3, 2.1 and 4.1 times higher wages in 2011-1223.
The gap in the wage salary of government employees and other regular and rural casual
workers has been widened over 1983 to 2011-12. The disparity between income from wages
and salaries and income from other sources increased sharply during the same period.
However, there seems to be some convergence in the wages between males and females, rural
and urban and, regular and casula workers (Himanshu, 2016).
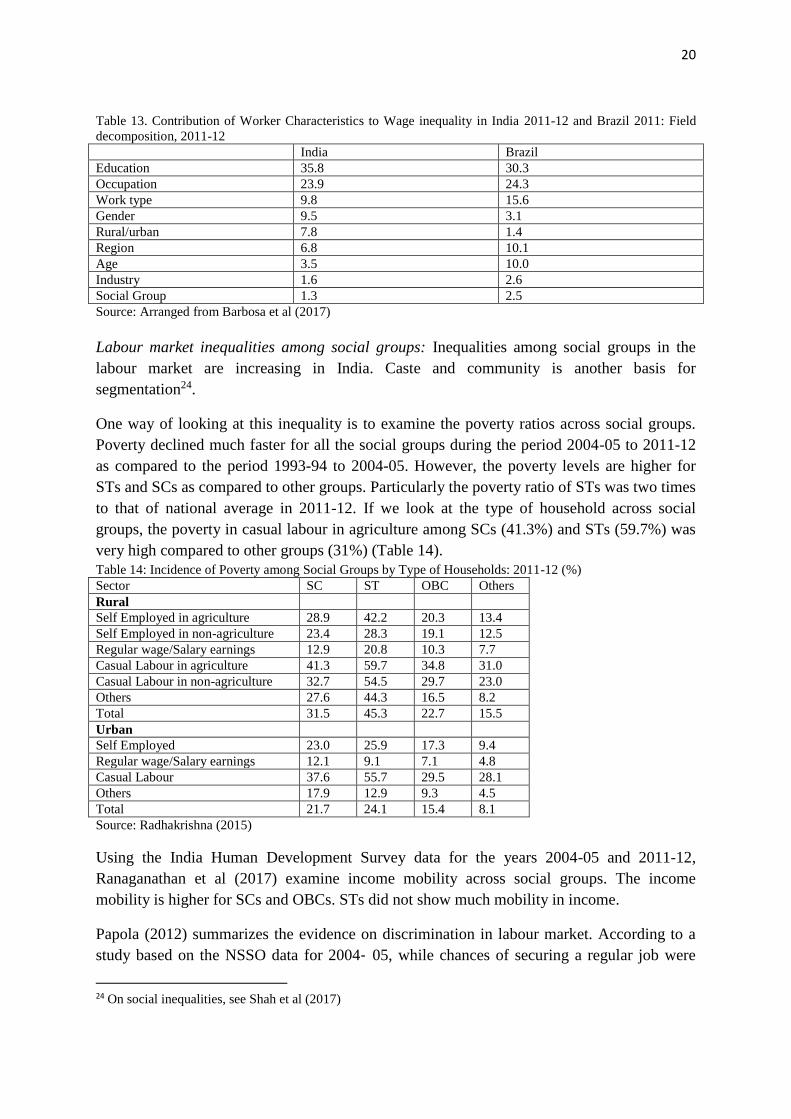
Contribution of different factors for wage inequality: Using Fields decomposition of wages,
Barbosa et al (2017) examine the contribution of each of various worker chateristics to the
overall observed wage inequality in India and Brazil. Education is the largest contribution to
wage inequality in both the countries (Table 13). In India, Education contributes 36% to wage
inequality. Second largest factor is occupation (24% in both countries). Industry differences
are less important than occupation in both the countries. Rural/urban disparities are more
important in India than Brazil. Regional and work type contributions are lower in India than
in Brazil. Gender is much more important (9.5%) in India than Brazil (3.1%). It shows more
disadvantage for women in India than Brazil. Barbosa et al (2017) study says that the larger
surprise relates to the contribution of social group particularly for India. This is contrary to
expectations. The study says that the ‘discrimination against social groups in India operates
more at the point of entry to employment than in wage differences among those in work…It
suggests that the influence of social group on wage inequality comes not directly as wage
discrimination but through discriminationin access to education and occupation” (p.295,
Barbosa et al, 2017).
23 On wage inequalities in India, see Rodgers and Soundararajan (2016), Majumdar and Sarkar (2017a) and
Barbosa et al (2017)
20
Table 13. Contribution of Worker Characteristics to Wage inequality in India 2011-12 and Brazil 2011: Field
decomposition, 2011-12
India Brazil
Education 35.8 30.3
Occupation 23.9 24.3
Work type 9.8 15.6
Gender 9.5 3.1
Rural/urban 7.8 1.4
Region 6.8 10.1
Age 3.5 10.0
Industry 1.6 2.6
Social Group 1.3 2.5
Source: Arranged from Barbosa et al (2017)
Labour market inequalities among social groups: Inequalities among social groups in the
labour market are increasing in India. Caste and community is another basis for
segmentation24.
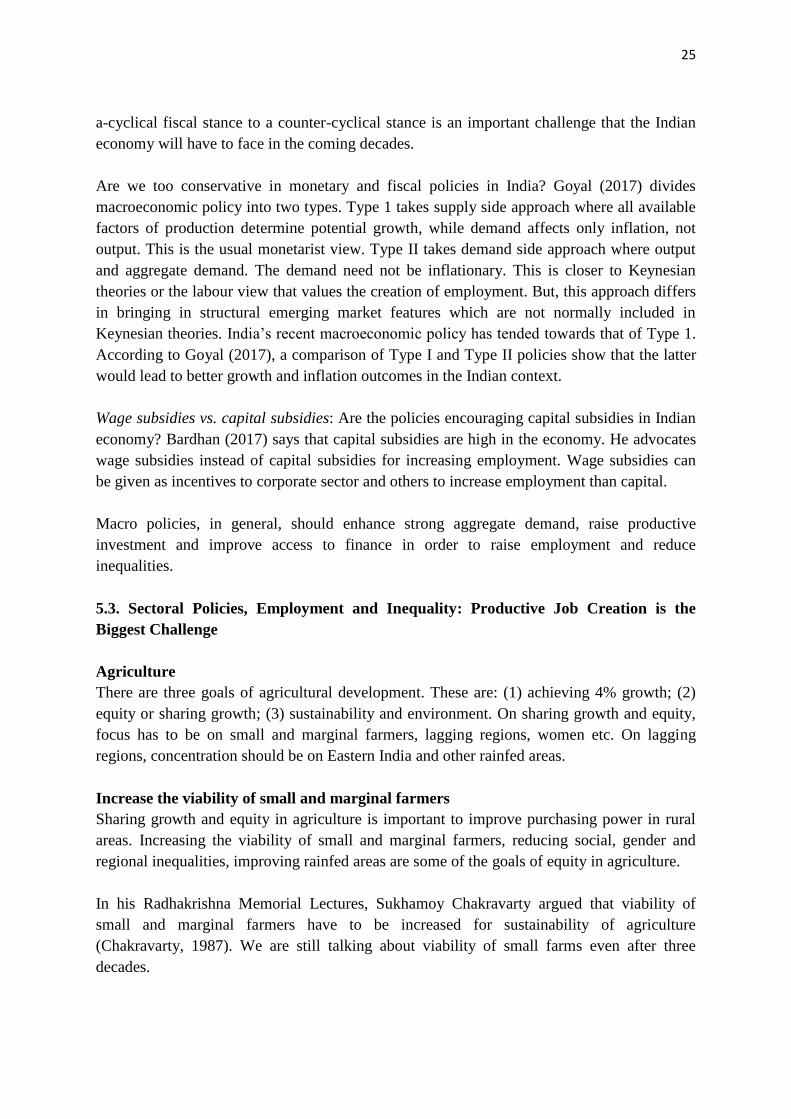
One way of looking at this inequality is to examine the poverty ratios across social groups.
Poverty declined much faster for all the social groups during the period 2004-05 to 2011-12
as compared to the period 1993-94 to 2004-05. However, the poverty levels are higher for
STs and SCs as compared to other groups. Particularly the poverty ratio of STs was two times
to that of national average in 2011-12. If we look at the type of household across social
groups, the poverty in casual labour in agriculture among SCs (41.3%) and STs (59.7%) was
very high compared to other groups (31%) (Table 14).
Table 14: Incidence of Poverty among Social Groups by Type of Households: 2011-12 (%)
Sector SC ST OBC Others
Rural
Self Employed in agriculture 28.9 42.2 20.3 13.4
Self Employed in non-agriculture 23.4 28.3 19.1 12.5
Regular wage/Salary earnings 12.9 20.8 10.3 7.7
Casual Labour in agriculture 41.3 59.7 34.8 31.0
Casual Labour in non-agriculture 32.7 54.5 29.7 23.0
Others 27.6 44.3 16.5 8.2
Total 31.5 45.3 22.7 15.5
Urban
Self Employed 23.0 25.9 17.3 9.4
Regular wage/Salary earnings 12.1 9.1 7.1 4.8
Casual Labour 37.6 55.7 29.5 28.1
Others 17.9 12.9 9.3 4.5
Total 21.7 24.1 15.4 8.1
Source: Radhakrishna (2015)
Using the India Human Development Survey data for the years 2004-05 and 2011-12,
Ranaganathan et al (2017) examine income mobility across social groups. The income
mobility is higher for SCs and OBCs. STs did not show much mobility in income.
Papola (2012) summarizes the evidence on discrimination in labour market. According to a
study based on the NSSO data for 2004‐ 05, while chances of securing a regular job were
24 On social inequalities, see Shah et al (2017)

21
21.5 per cent in the case of caste Hindus, they were only 6.7 per cent in the case of Scheduled
Tribe and 12.4 per cent in the case of those belonging to Scheduled Castes25.
Asset distribution also shows that the share of SCs and STs is low in the total assets.
Landlessness is high among SC households. Discrimination in labour market and business is
also found in some of the studies26. Lack of basic necessities such as housing, sanitation,
education and health is another problem for these groups27. However, income inequality is
only one aspect of disparities between upper castes and disadvantaged sections.
Discrimination, humiliation and violence against dalits and adivasis are examples of
inequalities in non-economic factors.
Migrant Labour: Internal migrants and international migrants are discriminated in the labour
market. The short term internal migration is generally distressed one. India ans other South
Asian countries to gulf region contributed bulk of the South-South migration. As ILO (2014)
says that the increase in South-South migration has coincided with the increased incidence of
abuse and exploitation of low skilled workers particularly in the gulf countries. Asian migrant
workers in the gulf are vulnerable to exploitation and face significant abuse of workers'
rights, including forced overtime, delayed wages, poor working and living conditions, and
limited access to health care.
Gender inequalities in Employment: There seems to be substantial decline in gender
inequality in employment over the period 1999-00 to 2011-12 (Ghose, 2016). Gender
inequalities declined in structure of employment, quality of most types of employment,
underemployment, real wages per day of work and real wage per earnings employed. Inspite
of these improvements gender inequality in employment is high (Ghose, 2016). Women’s
share in organised sector is still much lower than men. The quality of employment in
unorganised sector for women is lower than men. Underemployment is high for women.
Gender Wage gap is still higher in wages.
3.4. Inequality of Opportunity
Equality of opportunity is important for reducing many other forms of inequalities. The two
primary factors adversely affect India’s human development are its poor health attainments
and education. They are worse than many other developing countries including neighbouring
South Asian countries. They are critical for reduction in inequalities. Poor education can
block the mobility to quality employment while poor health can give significant shoclks to
households which can lead to long term instability.
Access to education is an important indicator of equality of opportunity. Recent NSS 71st
Round conducted in 2014 provides net attendance ratios (NAR) by quintiles, social groups
and religion. The inequalities in primary education are not high. But inequality increases over
the education ladder: secondary, higher secondary and above higher secondary level.
25 See Bordia-Das, 2010. Also see Thorat and Attwell (2010) and Madheswaran (2010) 26 See Deshpande (2013) on the discrimination in small business 27 The problem of exclusion in terms of access to basic services also applies to minorities like Muslims.

22
It is known that returns to education are more at higher levels. Around 66 per cent of kids of
higher secondary going age of the richest quintile of the population attend school in urban
areas (53% for rural) while the proportion drops to 23% for the poorest quintile for urban
(18% for rural). In the case of above higher secondary level, only 6% of young people from
the bottom quintile of the population attend in urban areas but the proportion is five times
higher at 31% for the young people from the richest quintile of the population.
Net Attendance Ratio by social group shows that in the case of above higher secondary level,
only 6 to 8% of females from ST and SC population attend but the proportion is 11% for
OBCs and 16% for other castes. Similarly, NAR by religion indicates that only 6% of
females from Muslims attend above higher secondary level as compared to 12% for Hindus
and 18% for Christians. The data shows that inequalities in NAR among quintiles, social
groups and religious groups increases with rise in education levels from primary to
secondary, higher secondary and above higher secondary.
Similar to education, there is significant regional, gender, social and religious disparities in
access to health. The inequality of opportunity is higher for disadvantaged sections like SCs,
STs, minorities, females and less developed states. Even some of the states like Gujarat, the
social development is lower than economic growth.
Inequality and Human Development: Higher inequality can lead to lower human
development. A study by Suryanarana (2013) estimates both Human Development Index
(HDI) and inequality adjusted HDI for all India and States (Table 15).
Table 15. Human Development Index (HDI) and Inequality Adjusted Human Development
Index (IHDI) and Loss
States HDI IHDI Loss (%) Rank HDI Rank IHDI
A.P. 0.485 0.332 31.6 19 20
Bihar 0.447 0.303 32.1 26 24
Chattisgarh 0.458 0.297 35.1 24 25
Gujarat 0.514 0.363 29.5 15 13
Jharkhand 0.470 0.312 33.7 21 21
Karnataka 0.508 0.353 30.5 18 18
Kerala 0.625 0.520 16.8 1 1
M.P. 0.451 0.290 35.7 25 27
Maharashtra 0.549 0.397 27.8 7 8
Odisha 0.442 0.296 33.1 27 26
Punjab 0.569 0.410 28.0 4 4
Rajasthan 0.468 0.308 34.0 23 22
Tamil Nadu 0.544 0.396 27.3 9 9
U.P. 0.468 0.307 34.5 22 23
West Beng. 0.509 0.360 29.3 17 14
All India 0.504 0.343 32.0 -- --
Source: Suryanarayana (2013)
The rank of Madhya Pradesh for inequality adjusted HDI is the lowest while Kerala has the
highest rank (Table 15). The average loss in HDI due to inequality at the All-India level is
32%. It is the highest for Madhya Pradesh (36%) and Chhattisgarh (35%) and the lowest for

23
Kerala (17%). The loss due to inequality is the highest with respect to education dimension
(43%), followed by health (34%) and income (16%). It shows that inequalities in non-income
indicators like education and health are higher than that of income. The analysis also shows
that with lower inequalities, HDI would have been much higher.
4. PUBLIC POLICY AND INEQUALITY: GLOBAL LEVEL
Studies at global level have shown that measures such as fiscal policy, education policy,
financial inclusion, well designed labour market and institutions can reduce inequality
(Dabla-Norris et al, 2015). Similarly, fiscal redistribution can improve the share of the poor
and middle class. However, there is no-one size fits all policies for tackling inequality. In
developed countries, more reliance on wealth and property taxes, progressive income
taxation, better targeting of social benefits are needed. In emerging market countries, better
access to education and health services, well targeted conditional transfers can reduce
inequality (Bastagli et al, 2012).
World Bank (2016) provides some lessons from the experiences of countries such as Brazil,
Cambodia, Peru and Tanzania which are best performers in reducing inequalities during
2004-14 and Mali during 2001-10. In Brazil, labour market dynamics including a rising
minimum wage and expansion of social policies helped in raising incomes of the poor. Some
of the lessons for the success of these five countries are prudent macro economic policies,
strong growth, functioning labour markets and coherent domestic policies focusing on safety
nets, human capital, and infrastructure. The report also cautions that universal prescriptions
are useful but we need country specific solutions.
Atkinson (2015) recommends ambitious new policies in five areas: technology, employment,
social security, the sharing of capital and taxation. He defends the five areas against common
arguments for inaction such as intervention will shrink the economy, that globalisation makes
action not possible and countries cannot afford distribution policies. He gives importance to
public policy including distributional issues, minimum wages, progressive tax rate structure
etc. Although the recommendations refer to United Kingdom, they are widely applicable28.
The recent Fiscal Monitor of IMF (2017a), discusses how fiscal policies can help
redistributive objectives. It focuses on three important policies: (a) tax rates at the top of the
income distribution; (b) introduction of a universal basic income; (c) public spending on
education and health. Progressive taxation and transfers are considered as instruments for
efficient redistribution.
28 On taxation and reduction in wealth disparities, see Piketty (2014). See Nayyar (2013, 2013a) on
macroeconomics and human development and catch up of countries.

24
5. PUBLIC POLICY AND INEQUALITY: INDIA
There is a need for several policies for reduction in inequality in India. We concentrate on
few policies in this address.
5.1. Redistribution Measures
There has been a debate on India for a long time on redistribution of assets in favour of the
poor to reduce poverty and inequality. Some of the earlier studies have questioned the
government’s strategy of helping the poor in terms of ad-hoc anti-poverty programmes29.
Land reform in the sense of distribution of land in favour of the poor is largely a failure.
Efforts towards redistribution of land and non-land assets have not been successful. Land is
only one source of inequalities. Corporate capital in non-agriculture is an equally or more
important source in recent years. There can be several public policies like public spending,
taxation on the rich etc which are discussed below.
5.2. Macro Policies, Employment and Inequality
Appropriate macro policies such as trade, fiscal and monetary policies should promote
employment by providing appropriate policies and institutions30. Monetary stimulus in
advanced countries helped preventing worse outcomes. In response to the global crisis
developed countries reduced short term lending rates. These measures prevented a larger fall
in employment. However, the extended period of low interest rates and unconventional
monetary policy measures seem to have adverse effects on employment by encouraging
capital intensive industries (ILO, 2014). In other words, monetary policies might have
indirectly contributed to observed weaknesses in labour market and increased inequality.
Fiscal Policy: Redistribution in favour of poor can be made through fiscal policies. Taxes,
expenditures and subsidies are the major instruments of fiscal policy. Some advocate
measures such as redistribution of assets and wealth in favour of the poor via higher tax rates
for the rich. In order to reduce inequalities, richer sections have to pay much more taxes. The
tax/GDP ratio has to be raised with a wider tax base and removing exemptions for corporates.
One of the distortions in India is that the share of direct taxes is much lower than that of
indirect taxes. It is known that indirect taxation is regressive in nature. Fiscal instruments like
public investment in physical and social infrastructure can be used to reduce inequality.
Generally developed countries use counter-cyclical and developing countries follow pro-
cyclical. Using the data for the period 1950-51 to 2007-08 Krishnan and Vaidya (2013)
examined whether Indian fiscal policy is pro-cyclical or counter-cyclical. The results show
that fiscal policy has been generally a-cyclical over the period of study. Graduating from an
29 See Kurien, 1986. Also see Herring and Edwards (1983) for comments on Employment Guarantee Scheme
(EGS) in Maharashtra. They say that there are vested interests in continuing EGS in the state in order to avoid
redistributive measures like land reforms. 30 On macro policies and employment, see Chandrasekhar (2017), Islam (2017), on economic reforms and
working poor see Patnaik (2016).See Nayyar (2017) on the crucial role of employment for reducing inequalities.
25
a-cyclical fiscal stance to a counter-cyclical stance is an important challenge that the Indian
economy will have to face in the coming decades.
Are we too conservative in monetary and fiscal policies in India? Goyal (2017) divides
macroeconomic policy into two types. Type 1 takes supply side approach where all available
factors of production determine potential growth, while demand affects only inflation, not
output. This is the usual monetarist view. Type II takes demand side approach where output
and aggregate demand. The demand need not be inflationary. This is closer to Keynesian
theories or the labour view that values the creation of employment. But, this approach differs
in bringing in structural emerging market features which are not normally included in
Keynesian theories. India’s recent macroeconomic policy has tended towards that of Type 1.
According to Goyal (2017), a comparison of Type I and Type II policies show that the latter
would lead to better growth and inflation outcomes in the Indian context.
Wage subsidies vs. capital subsidies: Are the policies encouraging capital subsidies in Indian
economy? Bardhan (2017) says that capital subsidies are high in the economy. He advocates
wage subsidies instead of capital subsidies for increasing employment. Wage subsidies can
be given as incentives to corporate sector and others to increase employment than capital.
Macro policies, in general, should enhance strong aggregate demand, raise productive
investment and improve access to finance in order to raise employment and reduce
inequalities.
5.3. Sectoral Policies, Employment and Inequality: Productive Job Creation is the
Biggest Challenge
Agriculture
There are three goals of agricultural development. These are: (1) achieving 4% growth; (2)
equity or sharing growth; (3) sustainability and environment. On sharing growth and equity,
focus has to be on small and marginal farmers, lagging regions, women etc. On lagging
regions, concentration should be on Eastern India and other rainfed areas.
Increase the viability of small and marginal farmers
Sharing growth and equity in agriculture is important to improve purchasing power in rural
areas. Increasing the viability of small and marginal farmers, reducing social, gender and
regional inequalities, improving rainfed areas are some of the goals of equity in agriculture.
In his Radhakrishna Memorial Lectures, Sukhamoy Chakravarty argued that viability of
small and marginal farmers have to be increased for sustainability of agriculture
(Chakravarty, 1987). We are still talking about viability of small farms even after three
decades.

26
Table 16 shows that the income of the marginal and small farmers from all sources is only
around 1/10 th of those of large farmers. The income from agriculture is very low for small
farmers. Even if we add the other sources of income, it is not enough to take care of daily
consumption and they have to borrow to survive. Small holding farmers have to get part of
income from rural non-farm activities. Therefore, promotion of rural non-farm sector is
essential for generating incomes for small farmers. Simultaneously, we have to improve the
viability of small holdings.
Table 16. Monthly Income and Consumption of Agricultural Households : 2013 (Rs.)
Land size
(ha.)
Cultivat
Income
Animals
Income
Wage
Income
Non-farm
business
Total Income Total
Consumption
<0.01 31 1223 3019 469 4742 5139
0.01-0.40 712 645 2557 482 4396 5402
0.41-1.00 2177 645 2072 477 5371 5979
1.01-2.00 4237 825 1744 599 7405 6430
2.01-4.00 7433 1180 1681 556 10849 7798
4.01-10.00 15547 1501 2067 880 19995 10115
>10.00 35713 2616 1311 1771 41412 14445
All Classes 3194 784 2146 528 6653 6229
Source: NSS Situation Assessment Survey 2013
Small farmers face several challenges in the access to inputs and marketing31. They need a
level playing field with large farms in terms of accessing land, water, inputs, credit,
technology and markets. Small holdings also face new challenges on integration of value
chains, liberalization and globalization effects, market volatility and other risks and
vulnerability, adaptation of climate change etc. (Thapa and Gaiha (2011). There are many
technological and institutional innovations which can enable marginal and small farmers to
raise agricultural productivity and increase incomes through diversification and high value
agriculture32. A number of innovative institutional models are emerging and there are many
opportunities for small and marginal farmers in India.
A study by Thorat and Sabharwal (2013) indicates that there is discrimination of Scheduled
Caste farmers in both input and output markets. As a result, they affect the access of the low-
caste farmers to various rural markets in purchase of agricultural land, leasing land, buying
various inputs and services necessary in production process and also in sale of goods. For
example, the access with differential treatment involves condition under which SC farmers
are required to pay higher prices for inputs and lower price for their farm outputs.
Aggreage demand for other sectors will increase if inequalities in agriculture are reduced.
Linkages between agriculture and non-agriculture have to be strengthened for raising
incomes of farmers.The government is planning to double the income of farmers by 2022.
Estimates on changes in farmers’ income (farm and non-farm) for 2003 to 2013 show that it
tripled in nominal terms. But, in real terms, the total income increased only 32% in 10 years.
31 On small farmers, see Swaminathan and Bakshi (2017), Himanshu et al (2015) on small farmers based on
village surveys. On agrarian crisis, see Reddy and Mishra (2010) 32 See Vaidyanathan (2009) for efficiency in investments. See Vyas (2016) for changing role of government in
agriculture. See Alagh (2013) for a discussion on future of Indian agriculture.

27
Doubling the income is a difficult task. Apart from farmers’ income, the wages of the
agricultural labourers have to be increased. It is known that agricultural labouers have the
highest poverty among all types of workers in the country. Studies have shown that there is a
positive impact of wages on agricultural growth (Rao, 2016).
Another issue is increasing role of women in agriculture. Nearly 75% of rural women work in
agriculture as compared to 59% of rural men in agriculture in 2011-12. Agricultural policies
should correct the gender bias in the functioning of institutions and support systems including
property rights for women33.
Rural non-farm Sector
At the all India level, the share of non-farm sector in rural areas increased from around 19%
in 1983 to 36% in 2011-12. What is the quality of employment in rural non-farm sector?
Construction, transport and communication have low productivity. The share of casual
workers increased while those of self employed declined. It is understandable because most
of the construction workers are casual labourers. Scheduled castes have benefited from rise in
rural non-farm employment. However, inequalities increased in rural sector.
Village studies also have shown rise in rural non-farm sector (Himanshu et al, 2015). It is true
that pattern of non-farm varies across village studies. However, some generalizations can be
made (Himanshu, 2014). First, share of non-farm employment and income in villages has
increased. Second, most of the rural non-employment created was in self employment and
casual. Most of the jobs are in small trade, services and construction with poor working
conditions and low productivity. Third, disadvantaged sections like SCs have benefited from
the growth in the non-farm sector. Lastly, most of the village studies also showed declining
role of agriculture in both income and employment. The growth of non-farm opportunities in
nearby towns and cities has been one of the drivers of non-farm activities. Increasing
communication and connectivity also led to access of non-farm employment outside village.
There is a need for more productive jobs in rural non-farm sector to reduce inequalities.
Manufacturing and Services
Quality of employment improves with changes in structure of employment from low
productive to high productive occupations and sectors. Quality increases with shift from
casual workers in informal sector to formal sector regular workers. Productive employment
rises if workers in agriculture are shifted to manufacturing sector.
In this context, ‘Make in India’ campaign is in the right direction. The aim is to create 100
million jobs by 2022. As shown by Ghosh, (2016) labour intensive manufacturing is
important for quality job creation particularly increase in organized sector34. However, there
33 On gender and land rights, see Agarwal (1994) 34 On manufacturing in South Asia, see Verick (2015)
28
are two related issues: (a) Can employment rise with manufacturing GDP growth? (b) What
about services with 60% share in GDP?
It is important to examine the prospects of manufacturing particularly in job creation in the
light of East Asian experience and in the present context of global stagnation. It is argued
here that one has to include services also in ‘Make in India’ program for creation of
employment.
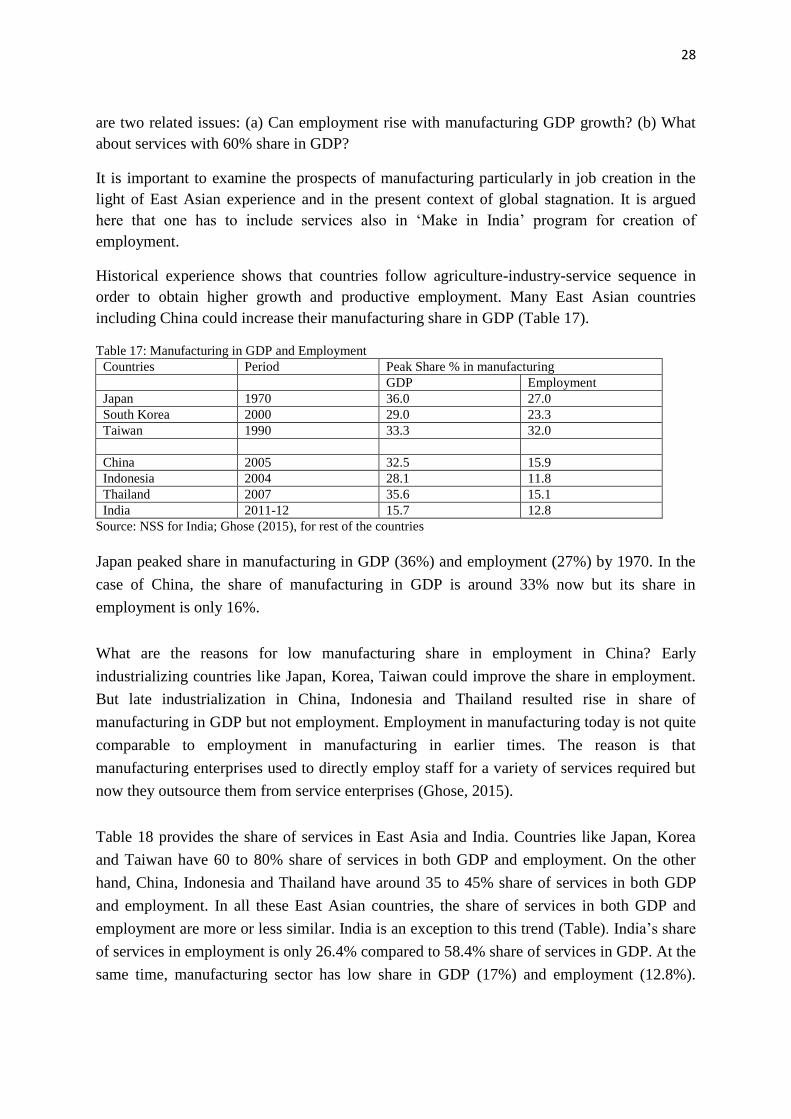
Historical experience shows that countries follow agriculture-industry-service sequence in
order to obtain higher growth and productive employment. Many East Asian countries
including China could increase their manufacturing share in GDP (Table 17).
Table 17: Manufacturing in GDP and Employment
Countries Period Peak Share % in manufacturing
GDP Employment
Japan 1970 36.0 27.0
South Korea 2000 29.0 23.3
Taiwan 1990 33.3 32.0
China 2005 32.5 15.9
Indonesia 2004 28.1 11.8
Thailand 2007 35.6 15.1
India 2011-12 15.7 12.8
Source: NSS for India; Ghose (2015), for rest of the countries
Japan peaked share in manufacturing in GDP (36%) and employment (27%) by 1970. In the
case of China, the share of manufacturing in GDP is around 33% now but its share in
employment is only 16%.
What are the reasons for low manufacturing share in employment in China? Early
industrializing countries like Japan, Korea, Taiwan could improve the share in employment.
But late industrialization in China, Indonesia and Thailand resulted rise in share of
manufacturing in GDP but not employment. Employment in manufacturing today is not quite
comparable to employment in manufacturing in earlier times. The reason is that
manufacturing enterprises used to directly employ staff for a variety of services required but
now they outsource them from service enterprises (Ghose, 2015).
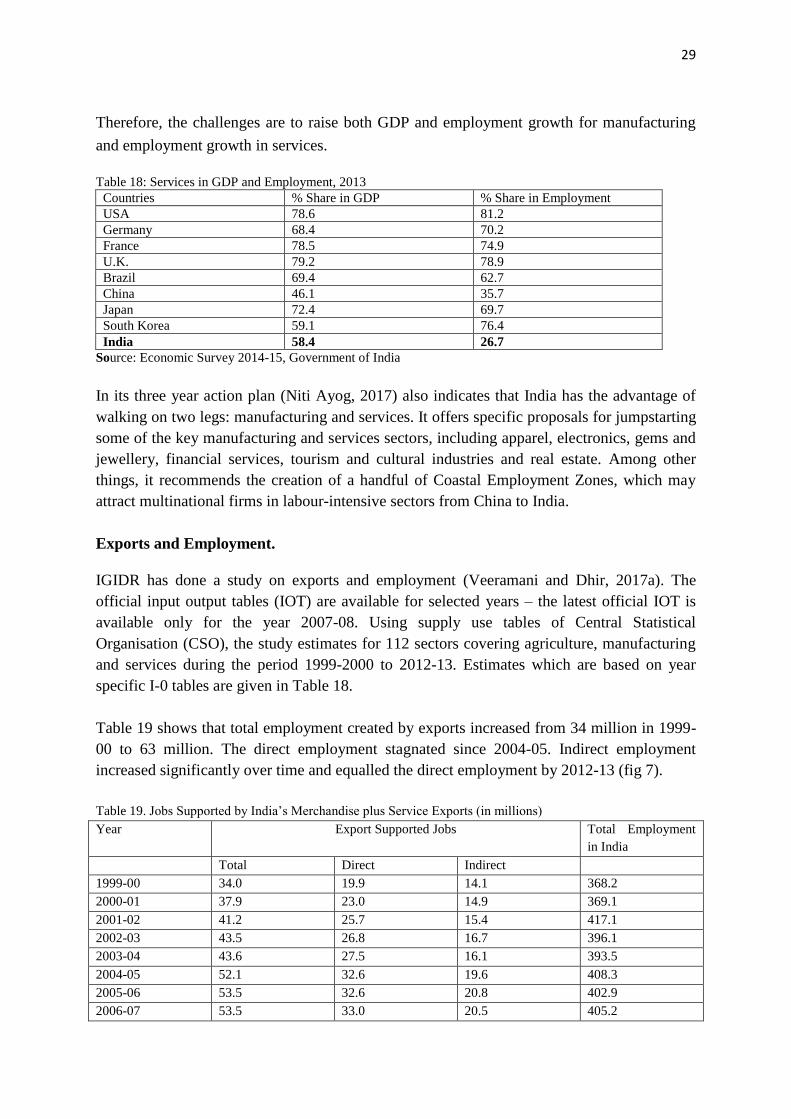
Table 18 provides the share of services in East Asia and India. Countries like Japan, Korea
and Taiwan have 60 to 80% share of services in both GDP and employment. On the other
hand, China, Indonesia and Thailand have around 35 to 45% share of services in both GDP
and employment. In all these East Asian countries, the share of services in both GDP and
employment are more or less similar. India is an exception to this trend (Table). India’s share
of services in employment is only 26.4% compared to 58.4% share of services in GDP. At the
same time, manufacturing sector has low share in GDP (17%) and employment (12.8%).
29
Therefore, the challenges are to raise both GDP and employment growth for manufacturing
and employment growth in services.
Table 18: Services in GDP and Employment, 2013
Countries % Share in GDP % Share in Employment
USA 78.6 81.2
Germany 68.4 70.2
France 78.5 74.9
U.K. 79.2 78.9
Brazil 69.4 62.7
China 46.1 35.7
Japan 72.4 69.7
South Korea 59.1 76.4
India 58.4 26.7
Source: Economic Survey 2014-15, Government of India
In its three year action plan (Niti Ayog, 2017) also indicates that India has the advantage of
walking on two legs: manufacturing and services. It offers specific proposals for jumpstarting
some of the key manufacturing and services sectors, including apparel, electronics, gems and
jewellery, financial services, tourism and cultural industries and real estate. Among other
things, it recommends the creation of a handful of Coastal Employment Zones, which may
attract multinational firms in labour-intensive sectors from China to India.
Exports and Employment.
IGIDR has done a study on exports and employment (Veeramani and Dhir, 2017a). The
official input output tables (IOT) are available for selected years – the latest official IOT is
available only for the year 2007-08. Using supply use tables of Central Statistical
Organisation (CSO), the study estimates for 112 sectors covering agriculture, manufacturing
and services during the period 1999-2000 to 2012-13. Estimates which are based on year
specific I-0 tables are given in Table 18.
Table 19 shows that total employment created by exports increased from 34 million in 1999-
00 to 63 million. The direct employment stagnated since 2004-05. Indirect employment
increased significantly over time and equalled the direct employment by 2012-13 (fig 7).
Table 19. Jobs Supported by India’s Merchandise plus Service Exports (in millions)
Year Export Supported Jobs Total Employment
in India
Total Direct Indirect
1999-00 34.0 19.9 14.1 368.2
2000-01 37.9 23.0 14.9 369.1
2001-02 41.2 25.7 15.4 417.1
2002-03 43.5 26.8 16.7 396.1
2003-04 43.6 27.5 16.1 393.5
2004-05 52.1 32.6 19.6 408.3
2005-06 53.5 32.6 20.8 402.9
2006-07 53.5 33.0 20.5 405.2

30
2007-08 49.0 30.6 18.5 407.5
2008-09 54.1 31.1 23.0 403.8
2009-10 44.5 23.2 21.3 400.0
2010-11 49.3 23.6 25.7 410.2
2011-12 58.0 29.0 28.9 420.5
2011-13 62.6 31.4 31.2 430.7
Source: Veeramani and Dhir (2017a)
Fig7. Number of Jobs supported by exports as a share of total employment in the country (%)
Source: Same as Table 19
The growth rates of jobs due to exports is much higher than that of total employment (Table
20). Indirect employment growth is much higher than direct employment growth. The share
of indirect employment in total export jobs increased from 40% in 1999-00 to around 50% in
2012-13.
There are interesting conclusions on direct and indirect employment across sectors (Table
21). The manufacturing sector accounts for 73% to 85% of total direct export linked jobs. In
contrast, the share of indirect employment is high for both agriculture and services.
Agriculture total export jobs have 20% direct employment and 80% indirect employment
which is due to manufacturing linkages. Services total export jobs have 48% direct
employment and 52% indirect employment which has linkages with manufacturing
Table 20. Growth Rates of Export Jobs and Total Employment (%)
Period Jobs supported by exports (growth rates%) Total
Employment in
the country
Dollar value of
Total Direct Indirect
1999-00 to
2012-13
3.4 1.6 5.8 0.8 20.1
1999-00 to
2005-06
7.6 8.4 6.5 1.5 20.5

31
2006-07 to
2012-13
2.6 -1.9 8.4 0.9 14.5
Source: Same as Table
Table 21. Jobs Supported by Indian Exports (million)
Year Agri &Allied and Mining Manufacturing Services
Direct Indirect Total Direct Indirect Total Direct Indirect Total
1999-00 8.0 7.9 16.0 7.0 1.9 8.9 4.8 4.3 9.1
2000-01 8.8 8.1 16.9 9.0 2.2 11.2 5.3 4.6 9.8
2001-02 10.4 8.6 19.0 10.1 2.0 12.1 5.2 4.8 10.0
2002-03 10.6 9.0 19.6 10.4 2.3 12.7 5.8 5.4 11.3
2003-04 11.6 7.7 19.3 10.2 2.9 13.0 5.8 5.5 11.2
2004-05 13.3 10.2 23.6 11.3 2.7 14.0 7.9 6.7 14.6
2005-06 14.0 10.4 24.5 8.3 2.7 11.0 10.3 7.7 18.0
2006-07 13.2 9.9 23.0 7.4 2.7 10.1 12.5 8.0 20.4
2007-08 11.3 8.4 19.6 5.9 2.6 8.6 13.4 7.5 20.9
2008-09 10.9 11.8 22.7 7.8 2.7 10.6 12.4 8.5 20.9
2009-10 7.2 11.9 19.1 7.9 2.4 10.3 8.2 7.0 15.1
2010-11 5.8 16.4 22.2 11.2 2.7 13.9 6.5 6.6 13.2
2011-12 4.2 19.9 24.1 19.2 3.4 22.6 5.6 5.7 11.4
2012-13 5.4 21.2 26.6 20.3 3.9 24.1 5.7 6.1 11.9
Source: Veeramani and Dhir (2017a)
India Development Report (2017) examines issues in manufacturing and trade and addresses
some pertinent questions: (i) what are the industries which hold the greatest potential for
growth and employment generation? (ii) where in India will things be made under the new
policy direction? (iii) what type of linkages exist between manufacturing and services
sectors? (iv) what type of institutions and policies should be created as preconditions for
manufacturing growth?
Veeramani and Dhir (2017) argue that there are two groups of industries that hold the greatest
potential for exports and employment. These are: (i) traditional unskilled labor-intensive
industries (textiles, clothing, footwear, toys etc); (ii) Assembly activities in industries
(particularly, electronics and electrical machinery) where manufacturing process is
internationally fragmented and global production networks are strong35. This study identifies
a number of specific product categories for which India can emerge as a major hub for final
assembly-related activities. A study by Chanda (2017) deals with the interdependence
between services and manufacturing and argues that a vibrant service sector should be seen as
an enabler for the manufacturing sector and not as a competitor to manufacturing. Value-
added contribution of the service sector to India’s gross exports was close to 50% in 2011,
significantly greater than the share of services exports in total exports based on balance of
payments data. Contribution of the service sector to manufacturing exports is dominated by
traditional services. Modern services such as IT, R&D and business services are not
significantly contributing to manufacturing exports.
35 on labour in global value chains see Nathan et al (2016)

32
5.4. Other Employment Issues and Policies
Skill Development
It is known that with demographic dividend, there will be large numbers joining labour force.
India will be the world’s youngest country by 2020 with an average age of 29 years. This
“demographic dividend” comes at a time when the rest of the world is ageing. Some
estimates show that only 2.3% of India’s workforce has undergone formal skill training
compared to United Kingdom’s (UK) 68%, Germany’s 75%, USA’s 52%, Japan’s 80% and
South Korea’s 96% (Niti Ayog, 2017). In order to have structural change from agriculture to
non-agriculture and from unorganised to organised, education and skill improvement are
needed. Government initiatives on skill development has so far yielded in slow progress.
More innovative methods may be required to improve skills faster. It may be noted that
general education is equally important (Ghose, 2016).
Micro, Small and Medium Enterprises (MSMEs) and Informal Sector
MSMEs as a whole form a major chunk of manufacturing in India and plays an important
role in providing large employment and can reduce income, social and reduce regional
disparities. Despite this recognition, many aspects of government policy are at best scale
neutral and do not really favour the MSMEs. This sector does not get adequate, timely and
affordable availability of institutional credit. Economic Survey (2017) shows that the growth
rate of credit has declined for MSME sector during 2013-14 to 2016-17. It is partcularly
negative for Small enterprises in 2016-17. The policies have to give a positive bias towards
MSMEs so that they can be a driver for employment generation. Short and long-term
initiatives are required specifically for the development of MSMEs.
Informal Sector
In order to reduce inequalities in income and wage gaps, policies have to focus on improving
productivity of informal sector and providing decent jobs. Policies generally favour the
organised sector. Labour market policies have to cover informal sector also. The informal
workers suffers from with both absolute capability deprivation (food insecurity, inadequate
employment, low earnings, low health, educational status and contingency type risk and
vulnerabilities such old age, health, accident, death (NCEUS, 2009)36.
Labour institutions
These include issues such as labour policies, minimum wage, worker rights/safety, access to
rule of law/justice, migrant worker policies, human rights issues, urban/informal sector
workers, and other aspects that characterize the wage-worker’s benefits, working conditions,
rights and collective bargaining. These are important for the overall well being and human
development of workers. Labour institutions and labour legislations like minimum wages,
36 On informal sector, see Breman (2013)
33
working hours and collective bargaining would influence the workplace by shaping the
behaviour of firms and conditions of work and employment37.
While most labour laws apply only to the formal sector but they also cover specific groups
within the informal sector. The most important of these is the Minimum Wages Act,
providing the widest eligibility coverage. Minimum wage, which establishes a floor to wages
protects the workers particularly at the bottom of wage distribution. But, effective
implementation is important. Labour flexibility is another issue regarding inequalities. This
does not seem to be a constraint for the formal sector38.
In general, there has been weakening of the traditional trade unions and collective bargaining
for the formal sector. Although there are organisations for informal sector workers but their
presence is limited except few like SEWA (Self Employed Women’s Association).
Youth Unemployment and Social Tensions: It is known that youth unemployment in India
is three times to that of general unemployment. One of the main problems for the agitations
by the people like the Marathas in Maharashtra, Patidars in Gujarat, Jats in Haryana and
Kapus in Andhra Pradesh relates to youth unemployment and aspirations of these castes to
move to quality employment. Central and State governments have to be sensitive to youth
employment problem.
Technology, Employment and Inequality
We have to be ready to approach a fourth industrial revolution which includes advanced
manufacturing, quantum engineering, 3D printing and robotics. It may lead to some
disruption in the established sectors and may lead to some inequalities. This challenging
question has taken a much more serious dimension with likelihood of automation’ and
‘digitization’ and other new technologies based on Artificial Intelligence (AI) taking away
the routine jobs outsourced to labor abundant economies like India39. World robotics are
growing at the rate 15% per annum since 2008. Five markets (China, South Korea, Japan,
USA and Germany) have 74% of the supply. China has the number with 87000 robotics.
Accroding to the assessment of World Bank President, 69% of jobs in India and 77% of
China’s jobs are under threat due to automation40.
Although presently robotics and other technological problems are more in developed
countries, India should be ready for facing the impact of robotics and AI on employment.
Optimists say that net employment may rise with fourth industrial revolution including
37 More on labour institutions in India, see IHD (2014), Babosa et al (2017), Srivastava (2015) 38 On labour market flexibility see Srivastava (2015) 39 “Moreover, not only agricultural and manufacturing employment appears at risk, but employees in services –
including cognitive skills - are no longer protected: see for instance how IBM Watson may displace the majority
of legal advices, how Uber (just a software tool) is fully crowding out taxi companies and how Airbnb is
becoming the biggest “hotel company” in the world” (Piva and Vivarelli, 2017, p.2) 40 https://timesofindia.indiatimes.com/business/india-business/Automation-a-threat-to-69-jobs-in-India-World-
Bank/articleshow/54705307.cms
34
robotics. For example, Satya Nadella says that artificial intelligence can be made more
inclusive and inequalities can be reduced.
5.5. Social Policy: Fundamentals Change to Human capital and Universal Basic Services
We have discussed earlier structural changes from low productive sector to high productive
sectors. But, this is not enough. Fundamentals change in terms of growth in human capital is
eqally or more important for reduction in inequalities. We should also ensure universal basic
services. In social policy, we discuss (a) Education and health (b) malnutrition (c) social
protection41.
Education, health: Equity in quality
Reduction in inequality of opportunity is important for promoting equity. “The distinction
between inequality of opportunity and inequality of outcome can be particularly useful in guiding
public policy. Equality of opportunity is not only intrinsically important but also a critical condition
for a prosperous society. Public policy must be put in place to reduce or eliminate inequality of
opportunity. Governments must work hard to promote equality of opportunity and to ensure that
everybody has equal opportunity to participate in the growth process and benefit from its fruits. To the
extent that inequality of parents’ income leads to inequality of opportunity for children, this inequality
needs to be overcome by interventions to assure equal access to public services and to markets for all
in society.” (Kanbur et al, 2014).
There are six issues in India’s social sector in general and health and education in particular.
These are: (a) low levels of human development indicators; (b) slow progress in these
indicators; (c) significant regional, social and gender disparities; (d) slow growth in public
expenditures in social sector (only 1.2% of GDP spent on health) (e) poor quality delivery
systems in both health and education; (f) issues in privatization of health and education
services.
As Dreze and Sen (2013) say the nature of Indian inequality can be distinguished from some
of the other countries like China. Aggregate inequality may be similar between India and
China. However, the poor in India can’t afford even basic necessities. Also access and quality
public services in education, health care etc. are missing for the poor. “For both these reasons,
inequality in India takes the terrible form of a massive disparity between the privileged and the rest,
with a huge deficiency of the basic requirements for a minimally acceptable life for the underdogs of
society. The basic facilities of usable school, an accessible hospital, a toilet at home, or two square
meals a day, are missing for a huge proportion of the Indian population in a way they are not in, say,
China” (p.280, Dreze and Sen, 2013).
Equality of opportunity can reduce the intensity of Kuznets curve. How do you flatten
kuznets curve? Endogenous growth models and capabilities approach or investing in human
capital may have some answers. This can reduce the intensity of Kuznets curve. This can be
shown in the contrast between East Asia and India/South Asia.
41 On social policy see Ghosh (2002), Dreze (2017), Barbosa et al (2017). Also see Mundle (2016) on
employment and education

35
Recently, the Deputy Prime Minister of Singapore cautioned about school education in India.
He says “schools are the biggest crisis in India today and have been for a long time. Schools
are the biggest gap between India and East Asia. And it is a crisis that cannot be justified”42.
Equity in quality education is the key for raising human development and reduction in
inequalities in labour market. A study by Cain et al (2014) on India shows that increase in
returns to education account for a large part of the increase in urban inequality during 1993-
94 to 2004-05. Increase in returns to education has been particularly higher in education
intensive services (such as communications, finance, insurance, real estate and other business
services) and education intensive occupations (professional/technical,
managerial/administrative, and clerical occupations). A lack of focus on quality of education
and health will create further exclusion of disadvantaged sections like SCs, STs, minorities
and women.
Is Government bad in running schools and hospitals?
One major issue relates to roles of public and private sectors in education and health. It is true
that the quality of public institutions have to be improved. However, the World Development
Report 2018 shows that their research on education across 40 countries does not find any
difference in the learning outcomes of children with similar family backgrounds in both
private and public schools. This, the World Bank challenges the perception in India that
private schools deliver better outcomes than public schools. Several research studies on
education have shown strong impact of remedial instruction programs on learning
outcomes43. A lack of focus on the quality of education and health will create further
exclusion for hitherto excluded groups.
Kerala’s experience shows that public schools and hospitals are not inferior to those of
private sector. The State is trying to strengthen the public health and education further. In
fact, good quality public schools and healthcare can also raise the quality of private sector.
Niti Ayog is thinking of advocating universal health insurance. But, this will not solve the
problem in health as we need universal health care.
5.6. Hunger and Malnutrition
Hunger has three major dimensions. These are : calorie deprivation, protein deprivation and
micro-nutrients deprivation. Achieving zero hunger by 2030 is a challenge. Globally, one in
nine people in the world today (794 million) are undernourished. Around 2 billion people
experience micronutrient malnutrition. 1.9 billion adults are overweight or obese. India has
many people with the above deficiencies. IFPRI (International Food Policy Research
Institute) brings out Global hunger Index report every year. The recent report (IFPRI, 2017)
42 First Lecture of Niti Ayog’s ‘Transforming India” initiative, August 26, 2016 43 See Banerjee et al (2017)
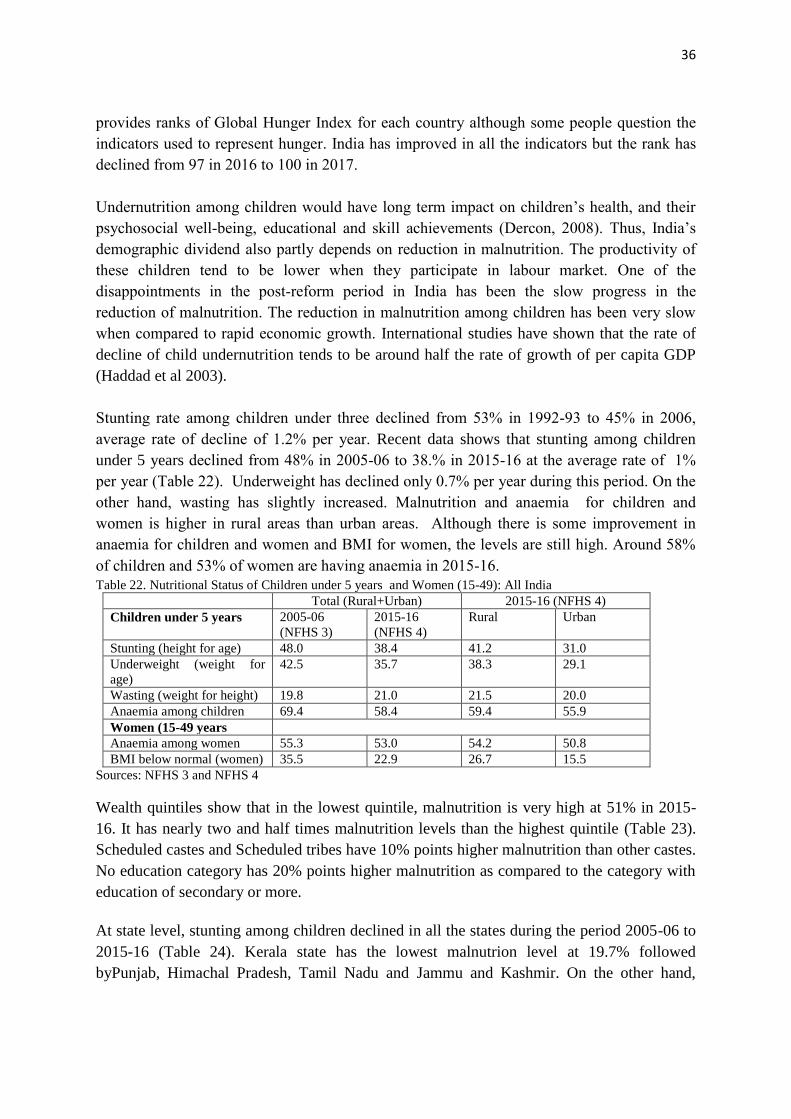
36
provides ranks of Global Hunger Index for each country although some people question the
indicators used to represent hunger. India has improved in all the indicators but the rank has
declined from 97 in 2016 to 100 in 2017.
Undernutrition among children would have long term impact on children’s health, and their
psychosocial well-being, educational and skill achievements (Dercon, 2008). Thus, India’s
demographic dividend also partly depends on reduction in malnutrition. The productivity of
these children tend to be lower when they participate in labour market. One of the
disappointments in the post-reform period in India has been the slow progress in the
reduction of malnutrition. The reduction in malnutrition among children has been very slow
when compared to rapid economic growth. International studies have shown that the rate of
decline of child undernutrition tends to be around half the rate of growth of per capita GDP
(Haddad et al 2003).
Stunting rate among children under three declined from 53% in 1992-93 to 45% in 2006,
average rate of decline of 1.2% per year. Recent data shows that stunting among children
under 5 years declined from 48% in 2005-06 to 38.% in 2015-16 at the average rate of 1%
per year (Table 22). Underweight has declined only 0.7% per year during this period. On the
other hand, wasting has slightly increased. Malnutrition and anaemia for children and
women is higher in rural areas than urban areas. Although there is some improvement in
anaemia for children and women and BMI for women, the levels are still high. Around 58%
of children and 53% of women are having anaemia in 2015-16.
Table 22. Nutritional Status of Children under 5 years and Women (15-49): All India
Total (Rural+Urban) 2015-16 (NFHS 4)
Children under 5 years 2005-06
(NFHS 3)
2015-16
(NFHS 4)
Rural Urban
Stunting (height for age) 48.0 38.4 41.2 31.0
Underweight (weight for
age)
42.5 35.7 38.3 29.1
Wasting (weight for height) 19.8 21.0 21.5 20.0
Anaemia among children 69.4 58.4 59.4 55.9
Women (15-49 years
Anaemia among women 55.3 53.0 54.2 50.8
BMI below normal (women) 35.5 22.9 26.7 15.5
Sources: NFHS 3 and NFHS 4
Wealth quintiles show that in the lowest quintile, malnutrition is very high at 51% in 2015-
16. It has nearly two and half times malnutrition levels than the highest quintile (Table 23).
Scheduled castes and Scheduled tribes have 10% points higher malnutrition than other castes.
No education category has 20% points higher malnutrition as compared to the category with
education of secondary or more.
At state level, stunting among children declined in all the states during the period 2005-06 to
2015-16 (Table 24). Kerala state has the lowest malnutrion level at 19.7% followed
byPunjab, Himachal Pradesh, Tamil Nadu and Jammu and Kashmir. On the other hand,

37
Bihar, Jharkhand, Utar Pradesh and Madhya Pradesh have high levels of malnutrition (above
40%). Gujarat has malnutrition levels closer to that of all India.
Table 23. Nutrition Status of Children under 5 years, Stunting (height for age) : All India, 2015-16
Wealth Quintile Stunting (%) Social Groups Stunting(%) Education Stuntin
g (%)
Lowest 51 Scheduled
Caste
43 No education 51
Second 44 Scheduled Tribe 44 Primary complete 44
Middle 36 OBCs 39 Secondary or more
complete
31
Fourth 29 None of them 31
Highest 22
Source: NFHS 4
Table 24. Stunting Among Children under 5 years Across States : 2005-06 (NFHS 3) and 2015-06 (NFHS 4)
States Stunting (%) Stunting (%)
2005-06 2015-16 2005-06 2015-16
Andhra Pradesh 38.1* 31.4 Madhya Pradesh 50.0 42.0
Assam 46.5 36.4 Maharashtra 46.3 34.4
Bihar 55.6 48.3 Odisha 45.1 34.1
Chattisgarh 52.9 37.6 Punjab 36.7 25.7
Gujarat 51.7 38.5 Rajasthan 43.7 39.1
Haryana 45.7 34.0 Tamil Nadu 30.9 27.1
Himachal Pradesh 38.6 26.3 Telangana 38.1* 28.1
Jammu&Kashmir 35.0 27.4 Uttar Pradesh 56.8 45.3
Jharkhand 49.8 45.3 West Bengal 44.6 32.5
Karnataka 43.7 36.2 All India 48.0 38.4
Kerala 24.5 19.7
*Combined Andhra Pradesh
Source: NFHS 3 and NFHS 4
Table 25 provides a breakup of the bottom 100 districts with high stunting levels among
children under 5 years. It shows that states like Uttar Pradesh, Bihar and Madhya Pradesh
have large number of districts among the bottom 100 districts. Even a state like Gujarat is
having 5 of its districts in this list. Stunting levels are high in these five districts viz.,
Sabarkanta (50.6%), Bhavnagar (48.4%), Anand (48.2%), The Dangs (48.1%) and Narmada
(47.4%).
Table 25. Bottom 100 districts with High Malnutrition (Stunting) Levels
States No. of districts States No. of districts
Uttar Pradesh 29 Meghalaya 4
Bihar 25 Chattisgarh 3
Madhya Pradesh 13 Maharashtra 2
Jharkhand 6 Haryana 1
Gujarat 5 Odisha 1
Rajasthan 5 Assam 1
Karnataka 5 Total 100
Source: NIN (2017)
There has been some improvement in nutrition indicators. This decline could be due to
expansion and improvement of several programmes like Integrated Child Development

38
Services (ICDS), National Rural Health Mission (NRHM), MGNREGA, reforms in several
states in PDS, targeted efforts like Maharashtra Nutrition mission. It is known that a
reduction in malnutrition needs the application of a multi-pronged strategy. The determinants
of malnutrition are agriculture, health, women’s empowerment including maternal and child
care practices, ensuring sanitation, enabling safe drinking water, and activating social
protection programmes and nutrition education apart from economic growth, as mentioned
earlier. The importance of sanitation and safe drinking water in reducing malnutrition is well
known. Therefore, ensuring improvements in sanitation is urgently needed as it is a big
predictor of malnutrition.
The evidence so far shows that malnutrition can be reduced by enhancing women’s health,
promoting gender equality and ensuring the empowerment of women including female
education. Gender equality and the well-being of children go hand in hand. The rights of
women and children are mutually reinforcing. In recent years, there has been emphasis on
linkages between agriculture and malnutrition.
In conclusion, it has to be recognised that ignoring hunger and malnutrition will have
significant costs to any country’s development. Nutrition improvement has both intrinsic and
instrumental value. Some estimates indicate that there is a 2 to 3 per cent GDP loss due to
low productivity. The returns to investments in food and nutrition are quite high. Every dollar
spent on interventions to reduce stunting is estimated to generate about $20-$30 in economic
returns.
5.7. Social Protection
The recent theory and evidence “offers a new perspective on social protection policies in poor
countries, suggesting that there is a scope for using these policies to compensate for the
market failures that perpetuate poverty, particularly in high-inequality settings” (Ravallion,
2003). Recent research has shown risk and vulnerability justification should be added since
the poor do not have formal instruments for risk mitigation and coping. Risks and
vulnerability are high as more than 90% workers are informal workers in India. Social
protection thus deals with both absolute deprivation and risk and vulnerabilities. The policies
on social protection play a critical role in realizing (a) the human right to social security for
all, (b) reducing poverty and inequality, (c)and supporting inclusive growth - by boosting
human capital and productivity,(d) supporting domestic demand and facilitating structural
transformation of national economies" (ILO, 2014).
India has social protection programmes at different levels: (a) (1) Universal Capability
Enhancing Programmes (e.g. health and education)44; (2) Targeted programmes for the poor
and vulnerable to provide socio-economic security. (3) Infrastructure ( Rural Housing, Rural
Drinking Water, Swatch Bharat Mission (Sanitation); 4. Social protection for the
Unorganized/informal workers.
44 See Rangarajan and Dev (2016) for a discussion on public expenditure on health and education on the poor.

39
The approaches of earlier UPA government and that of present NDA government on social
protection are different. UPA relied mostly on rights based framework: Right to education,
right to employment, right to food, right to information. However, rights approach alone
can’t deliver social protection. We need appropriate institutions to implement effectively. The
present government is not talking about rights approach but is focusing on some programs by
using approaches like political accountability and good governance. Programmes like Swatch
Bharat Abhiyan, focus on housing, financial inclusion (Jan Dhan Yojana) and direct benefit
transfers are part of the present strategy on social protection.
Social protection for the unorganised sector is important for reduction in inequalities. Suggestions are made to have the following as minimum social security or social protection floor
particularly for informal workers. (a) Extending the non-contributory old age pension schemes at a reasonable level to the old age
population, including the physically disadvantaged and windows.
(b) Providing access to health services to the poor, either through public provision or through a social
health insurance scheme such Rashtriya Swastya Bima Yojana (RSBY) in which all workers in the
unorganized sector belonging to the BPL (Below poverty line) category and their families are covered
and
(c) Expanding within a specified period of time the Unorganized Sectors workers Social Security Act,
2008, in order to ensure that it guarantees statutory and universal provision of national minimum
social security (IHD, 2014)45.
Food vs. Cash transfers: There has been a debate whether we should continue with food
transfers like the PDS or shift towards cash transfers. A recent book by Alderman et al (2018)
shows that 1.5 billion are covered globally by food or voucher programmes which provide an
important life line for the poor and vulnerable population. The analysis in the book highlights
how food and voucher programmes remain relevant, and in most circumstances, have
improved over time. It also examines the improvements made in India’s PDS with different
policies.
Should we move towards Universal Basic Income?Some argue for conditional (CCTs) and
unconditional cash transfers (CTs). It is advocated that we should move towards direct
benefits transfer in place of present social protection programmes. There has been a lot of
discussion on universal basic income (UBI) in both developed and developing countries46.
One view is that the idea of basic income seems to have originated in developed countries
where opportunities for job creation are limited. In a country like India we have plenty of
opportunities for employment creation. If the country has that kind of money to provide UBI,
it could as well spend them on creating employment by paying decent wages. This would add
to productive capacity of the economy while giving jobs to unskilled labour47. Rangarajan
45 Also see NCEUS (2009) and Kannan (2014), Kannan and Breman (2013), for a comprehensive view on
socio-economic security, see Saith (2008), Dev (2008). on Kerala experience, see Ramachandran (1997). 46 On this see Banerjee (2016), Bardhan (2016), Ray (2016), Srinivasan (2016) 47 Atul Sarma, Institute for Human Development, personal correspondence

40
and Dev (2017) say introducing Universal Basic Income is unrealistic. In fact, the concept of
basic income must be turned essentially into a supplemental income.
Our view is that supplement income can be started with old age population. The number of
elderly population in 2017 is around 11.6 crore. If we provide Rs. 1500 per person, the
annual amount comes to Rs. 18,000. The expenditure needed would be around 1.3% of GDP.
It is true that we already have a scheme on old age pensions (National Social Assistance
Program). But, this can be made near universal and the amount can be enhanced to Rs. 1500
or more.
5.8. Gender Disparities
One of the main drivers of growth and equality is the increased role of women. Inequality
between men and women is an important issue in India. Gender inequality index is the
highest for India among the countries listed in Table 26. The percentage of 25 plus female
population with some secondary education and female participation rates are the lowest
among these countries.
Table 26. Gender Inequality Index and other components for Selected Countries: 2015
Countries Gender Inequality Index MMR 2010
(death per 1
lakh life
birth
25+female
population
With at least
Some
Secondary
Education%
15+ female
labour force
participation
rate
Index Rank
Argentina 0.362 77 52 63.5 48.4
Russian Fed. 0.271 52 25 94.6 56.6
Brazil 0.414 92 44 59.1 56.3
China 0.164 37 27 69.8 63.6
Indonesia 0.467 105 126 42.9 50.9
South Africa 0.394 90 138 73.7 46.2
India 0.530 125 174 35.3 26.8
Source: HDR 2014 quoted in Economic Survey 2014-15, GOI
There are many examples of non-economic factors that discriminate women. Decline in child
sex ratio (female-male ratio 0-6 years) from 927 in 2001 to 914 in 2011 is one example of
‘boy preference’. Rapes and violence against women have been increasing In India. Gender
inequality is a major social disparity in Indian society48.
One of the important disparities in gender relates to education. “A Dalit girl from a poor family
who dreams of becoming a doctor or engineer may have to struggle not only with a lack of adequate
schooling facilities in the neighbourhood and economic penury at home, but also, quite possibly, with
indifferent social attitudes towards her education as well as with gender discrimination in the family
and society” (p.281, Dreze and Sen, 2013).
48 More on gender inequality, see Dreze and Sen (2013)

41
The wages of women workers in India are lower by 20 to 50 per cent to male wages across
different categories and locations. One question is whether education reduces gender gap.
Wage of female worker with no education was 53 per cent of a man’s wage in a regular job in
rural areas. A graduate degree female received 70 per cent of male’s wage in rural areas. In
urban areas, gender gap in wages reduces faster with education. In general, education seems
to have reduced wage gap between men and women as far as regular jobs were concerned
(IHD, 2014).
Ghani et al (2016) examine the patterns of female activity and gender segmentation in Indian
manufacturing and services. According to this study, Women entrepreneurs in India are
mostly concentrated in low-paying industries. This gender concentration in low-wage
industries has increased over time. Despite competitive reforms gender based segmentation
has increased over time. The gender balance in India in labour force participation,
entrepreneurship, and growth remains among the lowest in the world. This study says that
improving this balance is an important first step for India’s development and its achievement
of greater economic growth and gender equality.
As mentioned above, participation rates of women are low and declined in India (Table 27).
Work participation rate for women in India is only 22% compared to 54% for males. In fact
in urban areas, only 15% of women’s participation in work compared to 55% for men. IMF
Chief Christine Lagarde said increase in women’s participation rates would increase 40%
GDP in India. It is true that increase in women’s participation is important to reduce gender
inequalities.
Table 27. Work Participation Rates of Female and Male
Rural Urban Total
Female Male Female Male Female Male
1983 34.0 54.7 15.1 51.2 29.6 53.9
1993-94 32.8 55.3 15.5 52.1 28.6 54.5
2004-05 32.7 54.6 16.6 54.9 28.7 54.7
2011-12 24.8 54.3 14.7 54.6 21.9 54.4
Source: IHD (2014)
But, women’s ‘work’ and ‘non-work’ may be misleading. Time use surveys indicate
women’s unpaid work as home makers and care givers is quite high. Some estimates show
that if we monetize unpaid work of women, it amounts to around 16 lakh crores per annum
(Nandi and Hensman, 2015)49.
Discrimination against females is practiced throughout the life cycle. Legal route is important
to address the problems faced by women. However, Economic and social empowerment of
women is important. Similarly, change in society attitudes and mind set of men are also
essential to stop gender discrimination.
49 On unpaid work, see Hirway (2017), Swaminathan (2012)0. Also see Rustagi et al (2013)

42
5.9. Corruption and Inequality
Good governance is important for promoting equity. Corruption is one of the obstacles for
good governance. There have been studies linking corruption to inequality. IMF (2016)
examines the costs of corruption and mitigating strategies as corruption can seriously
undermine inclusive economic growth. It can adversely affect the determinants of economic
performance that include macro financial stability, investment, human capital accumulation
and total factor productivity. It can also have devastating economic and social consequences
due to vilolence, civil strife and conflict. According to the study, anti-corruption strategy
include transparency, rule of law, reforms to eliminate excessive regulation and effective
institutions. Using cross country regressions for the period 1980-97 Gupta et al (1998) show
that a worsening in the corruption index of a country by one standard deviation is associated
with the same increase in the Gini coefficient as a reduction in average secondary schooling
of 2.3 years. The study says that corruption raises inequality and poverty through lower
economic growth, biased tax system in favour of rich, poor targeting of social programmes,
lobbying the government by the rich for favorable policies which perpetuate inequality in
asset ownership, unequal access in education and lower social spending.
India: Determinants and Root Causes of Corruption
Different Types of Corruption: There are different types of corruption even within the
definition of misusing public office for private gain50. Sridharan (2014) discusses three types
of corruption in India. First one is petty bureaucratic corruption at the level of traffic police,
judicial services, land administration, education, tax, health services. Second one is big ticket
corruption involving politicians, business people, and bureaucrats the so called crony
capitalism involving huge bribes on major government contracts, particularly on large
infrastructure contracts, allocation of natural resources, such as minerals, telecom spectrum.
These are controlled by politicians in certain key economic ministries. A third form of
corruption is directly diverting government funds from development programmes, irrigation
projects, roads, from social and anti-poverty programmes from publicly funded loans to the
poor.
Democracy and Corruption: Liberal democracies with free press tend to have less corruption.
It varies across countries regarding democracy and corruption (Treisman, 2007).
Scandinavian Countries like Denmark, Sweden, Norway etc. have very low corruption. But
some of the low income countries with democracy have high corruption. While democracy is
commonly believed to reduce corruption, there are obvious endogeneity problems in
measuring the impact of democracy on corruption. Of course, there are different types of
democracy. For example, Indian democracy may be different from some other countries. It is
important to ask and identify which features of democracy can reduce corruption and which
50 On different types of corruption, see Bardhan (2005), Basu (2011).

43
features enhance corruption. Some democracies may have features which reduce while some
have which increase corruption.
Elections and Corruption: One of the main root causes for corruption India is election
funding. This is the main cause for big ticket corruption. Most of the party funds are from
corrupt payments in return for contracts or clearances according to politicians across parties
as well as bureaucrats. Real estate developers have reportedly become the single top source
of funds for parties and politicians (Sridharan, 2014). Therefore, election funding is the root
cause of corruption in countries like India.
Women in government and corruption: Women’s participation in government is supposed to
reduce corruption. For example more women in Parliament can improve things. Women’s
participation in local councils like Panchayats seems to have improved the performance
compared to men.
What are the measures needed for reducing corruption in India? First, we have to find out
the solution for the major source of corruption which is party finances for election funding.
Otherwise, the corruption problem in India can’t be solved. Other measures include
transparency, rule of law and economic reforms with rule based than discretions. Addressing
the corruption issue requires effective institutions. Of course administrative, legal reforms
also part of the strategy. As some people argue, Jan Lokpal like the Anna Hazare movement
can solve problems of corruption.
Some scholars like Avinash Dixit and Kaushik Basu also mention that without waiting
actions from the government, the business community, civil society and media can take a lead
on reducing corruption. Dixit (2016) discusses demand and supply sides of corruption . He
shifts the focus to the supply side viz. firms. He proposes that business community itself
could set a norm of ‘no bribes’ and enforce it through ostracism such as ‘not doing business
with those firms who give bribes’. Finally, use of technology can be a game changer for some
forms of corruption. There are many examples in India where use of technology reduced
corruption.
Thus, we need multipronged strategy to reduce corruption in India. Inequalities are expected
to reduce with decline in corruption as it affectes the poor and vulnerable adversely.
5.10. ‘Power’ and Inequality
Unequal distribution of economic and social development is rooted in inequalities of
political, social and economic power. For example, Hossain (2017) examines power in
inequality of hunger and malnutrition. The value chains are increasingly mediated by few
large commodity distributers, retailers, processing and packaging firms. In the case of seed
transactions, there firms - Monsanto, DuPont and Syngenta – dominate at global level.
Another three firms – ADM, Bunge and Cargill – are involved for most of the international
grain trade (Hossain, 2017). The consumption patterns in India also partly dictated by the

44
power of some firms. Similarly, power plays an important role in inequalities other aspects of
social and economic development. Therefore, policies and strategies in reducing inequalities
have to find opportunities and spaces where the power can be challenged and redistributed.
5.11. Climate Change, Jobs and Inequality
Climate change and its impact on jobs and inequality is another important issue. Climate
change is a major challenge for agriculture, food security and rural livelihoods for billions of
people including the poor in India. Agriculture is the sector most vulnerable to climate
change due to its high dependence on climate and weather. Indian agriculture sector is
already facing many problems relating to sustainability. To those already daunting
challenges, climate change adds further pressure on agriculture adversely affecting the poor.
There is a need for effective climate resilient agriculture (CRA) in India. Similarly urban
areas and non-agriculture could also be adversely affected with climate change. Public policy
and other stake holders have to be prepared to face the adverse impact particularly in coastal
areas. Similarly high pollution levels and environmental damage to resources would affect
the poor most. We have look at issues relating to energy, environment and natural resources.
Building resilience can address the livelihood and inequality issues. There is some
improvement in resilience cross countries.
There are two types of inequalities regarding consumption patterns and impact on climate
change. It has implications for overall inequality. First one is the inequality in consumption
patterns between advanced countries and developing countries. The developed countries have
historical responsibilities. Second one is inequalities in consumption patterns between rich
and poor in India. The consumption of the rich in India is more or less equal to the rich of the
advanced countries. The rich in India have to contribute for sustainable development and
climate related issues.
6. Conclusions
Inequalities in income and wages have widened in many deveoped and developing countries
Technological change and globalisation are the main sources. Wage gap is not only due to
skills but many other factors. Atkinson (2015) advocates five areas: technology, employment,
social security, sharing of capital and, taxation for reduction in income inequality. At the
global level, IMF deals with three measures : (a) tax rates at the top; (2) introduction of
universal basic income and (c) public spending in health and education for raising equality.
India is the second highest inequality country among the large countries in the world if we
take income and wealth instead of consunption. Gujarat and Maharashtra respectively in
income and wealth are the highest inequality states in the country. Inequality in agricultural
income is quite high as shown by macro data as well as village studies. After showing high
growth during 2008 to 2013, agricultural and rural wage growth has been stagnant during
2013-14 to 2016-17.

45
Labour market inequalities can be found across sectors, wages and earnings, quality of work,
access between formal and informal sectors. The share of wages declined while that of profits
rose in orgasied sector. Inequalities are much higher in non-income indicators like health and
education than income indicators.
Regarding policies, inequality can not be left to markets. Public policy intervention is
important. Employment creation with quality should be at the heart of the strategies for
reducing inequalities and continued social exclusion experienced by large sections of
society. In India, redistribution measures such land reforms or asset distribution have not
been successful. Macro policies like fiscal policies for raising tax/GDP ratio and raising
expenditures on social sector and infrastructure can be used. Wage subsidies instead of
capital subsidies can help raising employment.
On agriculture, small and marginal farmers, rainfed areas, less developed states, women
and disadvantaged social groups should be kept in mind while framing agricultural policies.
As the India Employment Report (2016) mentions manufacturing should be the focus for
raising quality employment. However, services also have to be promoted as both are
complementary. Exports growth is equally important as they generate more employment if
they relate to labour intensive sectors. Some estimates show that employment growth has
been stagnant in the post-2012 period. Some other issues in employment are: education and
skills, labour institutions (e.g. minimum wages), youth unemployment and preparing to face
technological consequences on employment.
Another important strategy refers to social policy. As Rodrik et al (2017) mention there are
two challenges. One is ‘structural change challenge’ which focuses on shifting resources
from traditional sector to high productive sectors. Second one is ‘fundantals chanllenge’
faced by policy makers in developing countries to develop broad capabilities such as
human capital and infrastructure. Both the challenges are important. But
‘funadamentals challenge’ is crucial for achieving the first challenge also. Investments in
social infrastructure, health, education, affirmative action and provision of public services can
lead to the creation of egalitarian society. Public sector has to play an important role in
providing human development along with private sector. Universal basic services in health
and education should be the agenda for action. Equality of opportunity is important. While
the governments have implemented policies that unleashed the country’s tremendous growth
potential, it should also embark on a process of social transformation that ends discrimination
on the basis of caste, class and gender. More attention has to be paid for providing clean
water, sanitation, access to health care and edication. India has underinvested in human and
social capital. Productive employment and quality education for everyone can reduce
inequalities significantly.
Malnutrition levels among children and women are quite high in India despite progress.
There are significant regional, social and gender disparities in nutrition level. Multi-sector
policies covering agriculture, women , health, drinking water and sanitation have to be put in
46
place to reduce malnutrition. Returns in investing nutrition are high as it would affect
education and productivity in employment later.
Corruption and inequality are interlinked. Corruption hurts the poor most. Election reforms
are crucial to reduce corruption. One area where more research is needed relates to climate
change and its impact on employment and inequality.
In the context of ethics and humanism, equality is important for its own sake. Inequality
reduction is also required for sustainability of growth. If we reduce personal, social, gender,
rural-urban and regional disparities, both the objectives of ethics and growth of equality will
be achieved. Lower inequalities would result in higher demand from bottom deciles,
vulnerable and disadvantaged sections and lead to higher growth. If we define equity in terms
of empowerment and increase in participation of the poor, there is no trade-off between
growth and equity.
Another issue in the context of India is exclusion of SCs, STs, women and minorities. Here
economics alone will not help inclusion. Social and political factors are important apart from
economic factors. Growth with redistribution efforts will not affect social behavior without
social transformation. We need social movements to reduce social exclusion. This happened
partially in South India earlier in Kerala and Tamil Nadu and happening in other parts of the
country now. It is still a long way for major social transformations.
There are limits to economic analysis regarding equity and inclusive approach. Non-
economic factors like norms, culture, and beliefs can also influence the level of inclusion
/exclusion. Inequalities are much more than economic disparities. The idea of citizenship is
one such example. Democratic countries have expanded the domain of citizenship by
institutionalizing universal rights and entitlements in the spheres of education, health care and
housing51. It is true that public policy has a major role but other stake holders like private
sector and civil society and other citizens have equal role in helping to achieve less equal
economy and society.
Politically, for having a stable and democratic society, one needs to have equitable approach.
Large sections of the society can’t be ignored. We have both ‘State failure and ‘market
failure’ in the case of equality and justice. Both these failures have to be corrected. If we do
not have tolerant and inclusive society, it can generate severe social tensions. Thus, there are
strong social, political and economic reasons for reducing inequalities. The cost of neglect of
inequalities is quite high. Employment and education should be the major focus areas in
policies for reduction in inequalities. The agenda of inclusiveness and equality has to be
given highest priority for broad based social and economic development. As Lenin says that
“there are decades when nothing happens but then there are weeks when decades happen”52.
In the case of inequalities in outcome and inequalities in opportunities, slow progress has
happened in decades. Hopefully things will be faster and we will have years if not weeks
51 See Jodhka and Vaid (2015) 52 https://www.goodreads.com/quotes/342783-there-are-decades-where-nothing-happens-and-there-are-weeks

47
when decades happen in having high quality of employment, health and education for the
bottom half of the population and reduction in inequality.
References
Abraham, Vinoj (2017), “Stagnant Employment Growth, Last Three Years May Have Been the
Worst”, Economic and Political Weekly, Vol.52, No.38
Agarwal, Bina (1994), “A Field of one’s own: Gender and Land Rights in South Asia”, Cambridge
University Press.
Alagh, Y.K. (2017), “Planning the Agricultural Vision”, Presidential Address at the 77th Annual
Conference of the Indian Society of Agricultural Economics, Central Agricultural University,
Barapani, 13t October, 2017
Alderman, Harold, Ugo Gentilini and Rustlan Yemstson (2018), “The 1.5 billion People Question,
Food, Vouchers or cash transfers?, World Bank group, The World Bank, Washington DC
Anand, I. and A. Thampi (2016), “Recent Trends in Wealth Inequality in India”, Economic and
Political Weekly, Vol.51, No.50
Atkinson, B. Anthony, (1975) “Economics of Inequality” Clarendon Press, London
--------(2015), “Inequality: What can be done?”, Harvard University Press, London, England.
Atkison, A.B. and F. Bourguignon (2015), “Hand Book of Economics” Vol. 2A and 2B, Elsevier,
North-Holland, U.K.
Banerjee, Abhijit (2016), “The Best way to Welfare”, Indian Express, June 18.
Banerjee,Abhijit, Rukmini Banerji, James Berry, Esther Duflo, Harini Kannan, Shobhini Mukerji,
Marc Shotland, and Michael Walton (2017) “Mainstreaming an Effective Intervention:
Evidence from Randomized Evaluations of “Teaching at the Right Level” in India”, NBER
Working Paper 22746, National Bureau of Economic Research, Cambridge, MA.
Banerjee, Abhijit, P.Bardhan, R. Somanathan and T.N. Srinivasan (2017) “ Poverty and Income
Distribution in India”, Juggernaut books, New Delhi
Bardhan, P.K. (2005), “The Economists Approach to the Problem of Corruption”, World
Development, Vol.34, No.2
-----(2016), “Lack of adequate jobs serious problem… caste war possible”, Interview in Indian
Express, April 14, 2016
-----(2016a), “Basic Income in a Poor Country”, Ideas for India, www.ideasforindia.in
----- (2017), “Defusing the jobs time bomb: Three ideas for how jobs can be created for India’s
surplus of 50 million workers”, Times of India, October 30, 2017
Barbosa, A., Maria C. Cacciamali and Gerry Rodgers (2017), “Growth and Inequality: The
Contrasting Trajectories of India and Brazil”, Cambridge University Press
Bastagli, F.D. Coady, and S. Gupta (2012), “Income Inequality and Fiscal Policy”, IMF Staff
discussion Note 12/08, International Monetary Fund, Washington
Basu, K (2006), “Globalization, Poverty and Inequality: What is the Relationship? What can be
done?, World Development, Vol.34 No.8
------(2011), “Why, for a Class of Bribes, the Act of Giving a Bribe should be Treated as Legal”,
Ministry of Finance, Government of India
Basu, K. and Stiglitz, J. (2016), “Inequality and Growth: Patterns and Policy”, Palgrave Macmillan,
International Economic Association 2016
Baviskar, Amita (2015), “Regional Dimensions of Social Movement in India”, in “India Rural
Development Report 2013/14”, IDFC Rural Development Network, Orient Blackswan
Bordia – Das, Maitreyi (2010), ‘Minority Status and Labour Market, Outcomes: Does India Have
Minority Enclaves?’ in Sukhadeo Thorat and Katherine S. Newman (eds), Blocked by Caste:
Economic Discrimination in Modern India, New Delhi, Oxford University Press.
Boushey, H., J. Bradford Delong, and Marshall Steinbaum (2017, ed.) “ After Piketty: The Agenda
for Economics and Inequality”Harvard University Press, Cambridge, Massachutts

48
Breman, Jan (2013), “At work in the informal economy of India: A Perspective from the Bottom Up”,
Oxford University Press, Paper Back, New Delhi
Cain, J.S., R. Hasan, R.Magsombol and Ajay Tandon (2014), “Accounting for inequality in India:
Evidence from household expenditures”, in Kanbur et al (2014), op.cit.
Chandrasekhar, C.P. (2017), “Macroeconomic Policy, Employment and Decent Work in India”,
Employment working paper no. 205, International Labour Organisation, Geneva
Chancel, Lucas and Thomas Piketty (2017) “Indian Income Inequality 1922-2014: From British Raj
to Billionnair Raj”, WID.world working paper series no. 2017/11, World Wealth&Income
data base, The source for global inequality in India.
Chakravarty, Manas (2016), “The richest 1% of Indian own 58.4% of wealth”, Livemint, November
26, 2017
Chakravarty, Sukhamoy (1987), “Development Planning: Indian Experience”, Oxford, Clarendon
Press.
Chakravorty, S., S. Chandrasekhar and K. Naraparaju (2016), “ Income Inequality in India’s
Agricultural Sector: New Estimates and Explanations”, mimeo, Indira Gandhi Institute of
Development Research, Mumbai.
Chanda, Rupa (2017), “Services for Indian Manufacturing”, In Dev, S.Mahendra (ed., 2017), India
Development Report 2017, Oxford University Press, New Delhi
Dabla-Norris, K.Kocchar, N.Suphaphiphat, F.Ricka, E.Tsounta (2015), “Causes and Consequences of
Income inequality: A Global Perspective”, IMF Staff Discussion Note, IMF, Washington D.C
Das, S. Chetan Ghate and Peter E. Robertson$ “Remoteness and Unbalanced Growth:Understanding
Divergence Across Indian Districts, Working paper no.268, ICRIER, New Delhi
Das, Arindam and Yousifumi Usami (2017), “Wage Rates in Rural India, 1998-99 to 2016-17”,
Review of Agrarian Studies, Vol. 7 No.2
Deshpande, Ashwini (2013), “Entrepreneurship or Survival? Caste and Gender in Small Business in
India”, Vol.48, No.28
Dercon, Stephan, “Children and the Food Price Crisis”, Young Lives Policy Brief 5, Department of
International Development, Queen Elizabeth House, University of Oxford, 2008.
Dev, S.Mahendra (2008), “Inclusive Growth in India: Agriculture, Poverty and Human
Development”, New Delhi, Oxford University Press
-------(2015), “Labour Market Inequalities in South Asia”, paper prepared for UNDP, New Delhi
-------(2016), “The Problem of Inequality”, Malcolm Adiseshiah Memorial Lecture, Chennai,
November 21, 2016
Dev, S.Mahendra and C. Ravi (2008), “Poverty and Inequality: All India and States, 1983-2005”,
Economic and Political Weekly, Vol. 43, No.10
Dev Nathan, Meenu Tewari and Sandip Sarkar (2016), “Labour in Global Valu Chains in Asia”,
Cambridge University Press.
Dixit, Avinash k. (2016), Corruption: Supply side and Demand side Solutions” in S. Mahendra Dev
and P.G. Babu (2016, ed.), “Development in India: Micro and Macro Perspectives”, Springer,
New Delhi.
Dreze, J. and Amartya Sen (2013), “An Uncertain Glory: India and its Contradictions”, Princeton
University Press
Dreze, J. (2017), ‘Sense ans Solidarity: Jholawala Economics for Everyone”, Permanent Black, Delhi
Dubey, Amaresh (2016), “Growth, Poverty and Inequality in India”, power point presentation, GIGA,
Hamburg, Germany
Ghani, Ejaj, Arti Grover Goswami, Sari Kerr and William Kerr (2016) “Will market competition
trump gender discrimination in India?” Policy Research Working Paper Series 7814, World
Bank, Washington DC
Ghosh (2015), “Service-led Growth and Employment in India”, in ‘Labour, Employment and
Economic Growth in India”, in Ramaswamy (Editor) (2015), Labour, Employment and
Economic Growth in India, Cambridge University Press, Delhi
------(2016), India Employment Report 2016, Oxford University Press
------(2016a), “Informality and Development”, Presidential Address, 58th Conference of the Indian
Society of Agricultural Economics, Guwahati, 24-26 November, 2016

49
Ghosh, Jayati (2002), “Social Policy in Indian Development”, Paper prepared for the UNRISD Project
on Social Policy in a Development Context, Geneva, UNRISD
-----(2015), “Growth, Industrialisation and Inequality in India”, Journal of the Asia Pacific Economy,
Vol.20, No.1
Ghosh, M, Ghoshray, A. and Malki, I., 2013 (2013), “Regional divergence and club convergence in
India”, Economic Modelling, 30 (1), pp. 733-742
GOI (2016), “Sixth Economic Census”, Central Statistical Organisation, Government of India
Goyal, Ashima (2017), “Macroeconomic Policy for an India in Transition” Economic and Political
Weekly, Vol.52, No.47
Grigoli Francesco and Adrian Roubles (2017), “Inequality Overhang”, IMF working papers no. 17/76,
International Monetary Fund, Washington, D.C.
Gupta, Sanjiv (1998), “Does Corruption Affect Income Inequality and Poverty” Working paper no.
98/76, International Monetary Fund, Washington, D.C.
Haddad, L., H.Alderman, S.Appleton, L.Song and Y.Yohannes (2003), Reducing Child Malnutrition
How Far Does Income Growth Take Us? World Bank Economic Review, Vol.17, No.1
(2003).
Herring, R.J. and Rex M. Edwards (1983), Guaranteeing Employment to the Rural Poor: Social
Functions and Class Interests in the Employment Guarantee Scheme in Western India” World
Development, Vol.11, No.7, pp. 575-592
Himanshu (2014), “Rural non-farm Employment in India: Trends, Patterns and Regional Dimensions”,
India Rural Development Report 2013/14, Orient Black Swan
Himanshu (2015), “Inequality in India”, Seminar, No. 672, August, 2015
------(2016), “Growth, Structural Change and wages in India: Recent Trends”, Key note paper, 58th
Conference of the Indian Society of Agricultural Economics, Guwahati, 24-26 November,
2016
Himanshu, Praveen Jha and Gerry Rodgers (2016), “The Changing Village in India: Insights from
Longitudinal Research”, Oxford University Press, New DElhi
Hirway, Indira (2017), “Mainstreaming Unpaid Work”, Oxford University Press, New Delhi
Hossain, Naomi (2017), “Inequality, Hunger and Malnutrition: Power Matters”, in IFPRI (2017),
op.cit.
IFPRI (2017), “Global Hunger Index: Inequalities of Hunger”, International Food Policy Research
Institute, Washington D.C.
IHD (2014), “India: Labour and Employment Report 2014”, Institute for Human Development, Delhi
ILO (2014), “Global Employment Trends 2014: Risk of Jobless Recovery”, International Labour
Organization, Geneva
----- (2016)“Global Wage Report 2016/17: Wage Inequality in the Work Place”, International Labour
Organisation, Geneva
IMF (2016), “Corruption: Costs and Mitigating Strategies”, IMF Staff Discussion Note, International
Monetary Fund, Washington D.C.
IMF (2017), World Economic Outlook: Gaining Momentum”, International Monetary Fund,
Washington D.C.
IMF (2017a), ‘Tackling Inequality”, Fiscal Monitor, International Monetary Fund, Washington DC,
October 2017.
Islam, Rizwanul (2017), “Macroeconomic Policy and Employment: A Development Perspective?,
invited paper presented at the 59th conference of the Indian Society of Labour Economics, 16-
18 December, Thiruvanathapuram.
Jain-Chandra, S., T.Kinda, K. Kocchar, S.Piao and J.Schauer (2016), Sharing the Growth Dividend:
Analysis of Inequality in Asia
Jodka and Vaid (2015), “The Problem” Seminar magazine symposium on emerging patterns of social
inequality in India”, Seminar No. 672, New Delhi
Jose, A.V. (2013), “Changes in Wages and Earnings of Rural Labourers”, Economic and Political
50
Weekly, Vol. 48, No. 26&27
Kanbur, R., C. Rhee, and J. Zhuang (2014), “Introduction” in Kanbur et. al (ed., 2014), op.cit. in
Kanbur, R., C. Rhee, and J. Zhuang (2014, Eds.), “Inequality in Asia and the Pacific”, Asian
Development Bank and Routledge
Kannan, K.P. (2014), “Interrogating Inclusive Growth: Poverty and Inequality in India”, Routlege,
New Delhi
Kannan, K.P. and Jan Breman (2013, eds.), “The Long Road to Social Security: Assessing the
Implementation of National Social Security Initiatives for the Working Poor in India”,
Oxford University Press, New Delhi
Krishnana, R. and Rajendra Vaidya (2013), “ Is Fiscal Policy in India Pro-Cyclical?”, in Dev.
S.Mahendra (2013, ed.), India Development Report 2012-13, Oxford University Press, Delhi
Kuznets, S (1955), “Economic growth and income inequality”, American Economic Review, Vol.95,
N0.1.
Kurien, C.T. (1986), ‘Reconciling Growth and Social Justice: Strategies vs. Structure”, in M.L.
Dantwala et.al (eds.), Asian Seminar on Rural Development: The Indian Experience”, New
Delhi: Oxford & IBH Publishing Co Pvt. Ltd.
Lakner, Christoph; Milanovic, Branko. 2013. Global Income Distribution : From the Fall of the Berlin
Wall to the Great Recession. Policy Research Working Paper;No. 6719. World Bank,
Washington, DC.
Madheswaran S., (2010): “Wage and Job Discrimination in the Indian Urban Labour Market” in S.K.
Thorat and Katherine Newman (ed.) “Blocked by Castes”, Oxford University Press,
New Delhi.
Mazumdar, D., S. Sarkar and B.S. Mehta (2017), “Inequality in India -1”, Economic and Political
Weekly, Vol.42, No.30
-------(2017a), “Inequality in India -1I: The Wage Sector”, Economic and Political Weekly, Vol.42,
No.32
Mehta, B. S. and Megha Sree (2017), “Inequality, Gender andSocio-religious groups”, Economic and
Political Weekly, vol.42, No.8
Milanovic, Branko (2016), “Global Inequality: A New Approach for the Age of Globalization”, The
Belknap Press of Harvard University Press
Milanovic, Branko (2016a), “The Question of India’s Inequality”,
http://glineq.blogspot.in/2016/05/the-question-of-indias-inequality.html
Motiram, Sripad and V. Vakulabharanam (2013), ‘Indian Inequality: Patterns and Changes, 1993-
2010”, in Dev, S. Mahendra (ed., 2013), India Development Report 2012-13, Oxford
University Press, New Delhi
Mundle, Sudipto (2016), “Employment, Education and the State”, Radha Kamal Mukherjee Memorial
Lecture, 58th Conference of the Indian Society of Agricultural Economics, Guwahati, 24-26
November, 2016
Muralidharan, Kartik (2013) ““Priorities for Primary education Policy in India’s 12th Five Year Plan”,
India Policy Forum 2013, NCAER-Brookings, New Delhi
Nandy, Amrita and Rohini Hensman (2015), “The Work Women Do”, Indian Express, November 7,
2015.
Nayar, R., P. Gotret, P.Mitra, G.Betcherman, Y.M. Lee, I.Santos, M.Dahal, and M.Shrestha (2012),
“More and Better Jobs in South Asia”, World Bank, Washington, D.C.
Nayyar, Deepak (2013, ed.), “Macroeconomics and Human Development”, Taylor and Francis,
London
------ (2013a), “Catch Up: Developing Countries in the World Economy”, Oxford University Press,
UK.
-----(2017), “Employment, Growth and Development: Essays in a changing world economy”, South
Asia Edition, Routledge, London
NCEUS (2009), “The Challenge of Employment”, National Commission for Enterprises in the
Unorganised sector, Government of India
Niti Ayog (2017), “India Three Year Action Agenda 2017-18 to 2019-20”, Government of India

51
Papola (2012), “Social Exclusion and Discrimination in Labour Market” ISID, 2012/4, Institute for
Studies in Industrial Development, Delhi
Patnaik, Prabhat (2016), “Economic Liberalisation and the Working Poor”, Economic and Political
Weekly, Vol.51, No. 29
Piketty, Thomas (2014), “Capital in the Twenty-First Century” The Belknap Press of Harvard
University Press, London
Piva, Mariachristina and Marco Vivarelli (2017), “Technological Change and Employment: Were
Ricardo and Marx Right?”, IZA DP No. 10471, IZA Institute of Labour Economics, Bonn,
Germany
Radhakrishna, R. (2015), “Well-being, inequality, Poverty and Pathways out of poverty in India”,
Economic and Political Weekly, Vol.50, No.41
Ramachandran, V.K. (1997), ‘On Kerala’s Development Achievements’, in Dreze and Sen (eds)
Indian Development: Selected Regional Perspectives, New Delhi: Oxford University Press
Ramaswamy (Editor) (2015), Labour, Employment and Economic Growth in India, Cambridge
University Press, Delhi
Ranganathan, T, A Tripathi and B Rajoriya (2016):“Changing Sources of Income and Income
Inequality among Indian Rural Households,” Paper presented at National Seminar on
Dynamics of Rural Labour Relations at National Institute of Rural Development and
Panchayati Raj (NIRD & PR), March 10–12, 2016.
Ranganathan, T, A Tripathi, Ghanshyam Pandey (2017), “Income mobility among social groups”,
Economic and Political Weekly, Vol.42, No.41
Rangarajan, C. and S. Mahendra Dev (2016 ), “A Higher Well Being”, Indian Express, April 29, 2016
--------(2017), “Let’s talk about Supplemental Income”, The Hindu, August 7, 2017
Rao, C.H. Hanumantha (2016), “Dynamics of Rural Labour Markets in India: Recent Trends and
Policy Concerns”, Inaugural Lecture at the national seminar on the “Dynamics f Rural Labour
Relations in India” during March 10-12, 2016 at NIRD&PR, Hyderabad
Ravallion(2003), “The Debate on Globalization, Poverty & Inequality: Why Measurement Matters”,
World Bank Policy Research Working Paper 3038
Rawls, John (1971), “A Theory of Justice”, Harvard University Press, Cambridge, MA
Ray, Debraj (2016), “Universal Basic Share”, Ideas for India, www.ideasforindia.in
Reddy, D.N. and Srijit Mishra (2010, eds.), “Agrarian Crisis in India”, Oxford University Press, New
Delhi
Rodrik, Dani Mcmillan, M. and Sepulveda,C. (2017, eds.), “Structural Change, Fundamentals and
Growth: A Framework and Case Studies”, International Food Policy Research Institute,
Washington, D.C.
Rodgers, Gerry and V. Soundararajan (2016), ‘Patterns of Inequality in the Indian Labour Market’,
Institute for Human Development and Academic Foundation, New Delhi
Rustagi, Preet, Dev Nathan, Amrita Datta and Ann George (2013), “Women and work in South Asia:
Changes and Challenges”, working paper WP 01/ 2013, Institute for Human Development,
New Delhi
Sandimo, Agnar (2015), “The Principal Problem in Political Economy: Income Distribution in the
History of Economic Thought”, in Atkinson, A.B. and F. Bourguignon, op.cit.
Saith, Aswani (2008), “Towards Universalizing Socio-economic security: Strategic Elements of a
Policy Agenda”, Indian Journal of Human Development, Vol2, No.1
Shah, Alpa, Jens Lerche, Richard Axelby, Dalel Benbabaali, Brendan Donegan, Jayaseelan Raj
(2017) Ground Down by Growth: Tribe, Caste, Class and Inequality in 21st Century India
(Anthropology, Culture and Society)”,
Sen, Amartya (1973), “On Economic Inequality”, Oxford University Press, Oxford
Sen and Himanshu (2004), “Poverty and Inequality in India”, Economic and Political Weekly, Vo.39,
No.38, 39.

52
Son, H.H. (2014), “Inequality of human opportunities in developing Asia”, in Kanbur et al (2014),
op.cit.
Sharma, Alakh and Tanuka Endow (2017), “Addressing Poverty and Inequality in India for
Sustainable Development”, Paper prepared for the International Symposium on “ No one left
behind”, organised by Shanghai Academy of social Sciences and Friedrich-Ebert-Stiftung,
Shanghai Office, 15-16 November, Shanghai,
Sridharan, Eswaran (2014), “India: Democracy and Corruption”, Democracy Works conference
paper, A project of Legatum Institute, London and Centre for Development and Enterprise,
South Africa Srinivasan and Bardhan (1974), Poverty and Income Distribution in India”, Calcutta: Statistical Publishing
Society
Srinivasan, T. N. (2013) “Planning, Poverty and Political Economy of Reforms: A Tribute to Suresh
Tendulkar, Indian Economic Review (Special Issue on "Perspectives on Economic
Development and Policy',), pp. 167-188, Vol.XLVIII, Number 1.
Srinivasan, T.N. (2016), “Minimum Standard of Living for All Indian”, www.ideasforindia.in
Srivastava, Ravi (2015), “Myth and Reality of Labour Flexibility in India and What is to be done?”,
Presidential Address, 57th Annual Conference of the Indian Society of Labour Economics,
Srinagar, 10-12 October, 2015
Stiglitz, J (2013), “The Price of Inequality: How Today’s Divided Society Endangers Future”,
W.W.Norton & Company, USA.
Subramanian, S. and D. Jayaraj (2016), “The Quintile Income Statistic, Money-metric Poverty, and
Disequalising Growth in India: 1983 to 2011-12”, Economic and Political Weekly, Vol.51,
No.5
Suryanarayana, M.H. (2013), “Promoting Human Development In India”, in Dev, S.Mahendra (ed.,
2013), India Development Report, 2012-13, Oxford University Press, New Delhi
Swaminathan, Padmini (2012), “Women and Work”, Essays from Economic and Political Weekly,
Orient Blakswan,
Swaminathan, Madhura and Vikas Rawal (2011), “Is India Really a Country of Low Income-
Inequality? Observations from Eight Villages” Review of Agrarian Studies, Vol.1, No.1
Swaminathan, Madhura and S. Bakshi (2017), “How Do Small Farmers Fare?: Evidence from Village
Studies in India”, published by Tulika Books
Tendulkar, S.D. (2010), “Inequality and Equity during Rapid Growth Process”, in Acharya, Shankar
and Rakesh Mohan (2010), “Indian Economy: Performances and Challenges, Essays in
Honour of Montek Singh Ahluwalia, Oxford University Press, New Delhi
Thapa, G. and R. Gaiha (2011), “Smallholder farming in Asia and the Pacific: Challenges and
Opportunities”, paper presented at the Conference on new directions for small holder
agriculture, 24-25 January 2011, Rome, IFAD
Thorat, Sukhadeo and Paul Attewell (2010) ‘The Legacy of Social Exclusion: A Correspondence
Study of Job Discrimination in India’s Urban Private Sector’, in Sukhadeo Thorat and
Katherine S. Newman (eds), Blocked by Caste: Economic Discrimination in Modern India,
New Delhi, Oxford University Press.
Thorat, S. and Nidhi S Sabharwal (2013) ‘Farm Productivity, Income and Input Use: Does Caste
Identity Matters?’ Indian Institute of Dalit Studies, Delhi
Triesman, D. (2007), “What have we learned about the causes of corruption from ten years of Cross-
National Empirical Research?”, Annual Review of Political Science, Vol. 10, pp. 211-244
UNDP (2015), “Round Table: Intersectional Inequality, Perspectives from South Asia, Summary of
Discussions”, February 2015, UNDP, New Delhi
Usami, Yosifumi (2012), “Recent Trends in wage Rates in Rural India: An Update”, Review of
Agrarian Studies, Vol.2,No.1
Unni, Jeemol (2014), “Rural Livelihoods: Whither Labour”, Indian Journal of Labour Economics,
Vol.57, Issue No.1.
Veeramani, C. and Garima Dhir (2017), “Make what in India” in Dev, S.Mahendra (ed., 2017), India
Development Report 2017, Oxford University Press, New Delhi

53
Veeramani, C and Dhir, Garima (2017a) "Reaping Gains from Global Production Sharing: Domestic
Value Addition and Job Creation by Indian Exports", Paper to be presented at "IARIW-
ICRIER Conference on Experiences and Challenges in Measuring Income, Inequality, and
Poverty in South Asia,”, November 23-25, 2017, New Delhi.
Vaidynathan, A. (2009), “Role of Technology, Incentives and Institutions”, Oxford University Press
Verick, Sher S. (2015), “Manufacturing and Jobs: Is India Different?” Keynote Paper, 57th Annual
Conference of the Indian Society of Labour Economics, Srinagar, 10-12 October, 2015
Vyas, V.S. (2016), “Changing Role of Government in Indian Agriculture”, L.S. Venkataraman
Lecture, Institute for Social and Economic Change, Bangalore.
World Bank (2016), Taking on Inequality”, Poverty and Shared Poverty 2016, World Bank,
Washington DC.
Zhuang, J. R. Kanbur and C. Rhee (2014), “What drives Asia’s rising inequality?”, in Kanbur et al
(2014), op.cit.