Inequality, Autocracy and Sovereign Funds as determinants ...
49
1 Inequality, Autocracy and Sovereign Funds as determinants of Foreign Portfolio Equity Flows Current draft March 24, 2018 David M. Kemme Fogelman College of Business and Economics, University of Memphis, Memphis, TN, USA E-mail: [email protected] Bhavik Parikh Gerald Schwartz School of Business, St. Francis Xavier University, Antigonish, Nova Scotia, Canada E-mail: [email protected] Tanja Steigner School of Business, Emporia State University, Emporia, KS, USA E-mail: [email protected] Abstract We identify new country characteristics that influence cross border equity flows: income inequality, autocracy and sovereign wealth funds. From a unique panel data set of 158 source countries and 34 OECD host countries for 2002-2013, controlling for previously established determinants of FPI, we find that OECD host countries attract more FPI from source countries with high income inequality and sovereign wealth funds and less FPI from autocracies. Countries with high income inequality invest less in tax havens while autocracies invest more. Source countries with high income inequality that also have a sovereign wealth fund or autocratic regime experience higher FPI outflows. On the other hand, source countries, which have a sovereign wealth fund and are classified as autocratic countries, do not experience higher FPI outflows. Our results are robust across many specifications, the financial crisis, size of host country capital markets, and the exclusion of the US from the OECD host countries. Key words: foreign portfolio equity inflows, cross border equity flows, inequality, sovereign wealth funds, autocracy
Transcript of Inequality, Autocracy and Sovereign Funds as determinants ...

1
Inequality, Autocracy and Sovereign Funds as determinants of Foreign Portfolio Equity
Flows
Current draft March 24, 2018
David M. Kemme Fogelman College of Business and Economics, University of Memphis, Memphis, TN, USA
E-mail: [email protected]
Bhavik Parikh Gerald Schwartz School of Business, St. Francis Xavier University, Antigonish, Nova Scotia,
Canada E-mail: [email protected]
Tanja Steigner
School of Business, Emporia State University, Emporia, KS, USA E-mail: [email protected]
Abstract
We identify new country characteristics that influence cross border equity flows: income inequality, autocracy and sovereign wealth funds. From a unique panel data set of 158 source countries and 34 OECD host countries for 2002-2013, controlling for previously established determinants of FPI, we find that OECD host countries attract more FPI from source countries with high income inequality and sovereign wealth funds and less FPI from autocracies. Countries with high income inequality invest less in tax havens while autocracies invest more. Source countries with high income inequality that also have a sovereign wealth fund or autocratic regime experience higher FPI outflows. On the other hand, source countries, which have a sovereign wealth fund and are classified as autocratic countries, do not experience higher FPI outflows. Our results are robust across many specifications, the financial crisis, size of host country capital markets, and the exclusion of the US from the OECD host countries.
Key words: foreign portfolio equity inflows, cross border equity flows, inequality, sovereign wealth funds, autocracy

2
JEL classifications: G28, F38, F63, H26, I3

3
1. Introduction
Cross-border equity flows, or foreign portfolio investments (FPI), among developed
economies are theoretically determined by investment opportunities (Doukas, 1985), which are
often limited due to information costs (Kho et al., 2009), and yield differentials (Goldstein and
Razin, 2006), inter alia. Market size of source and host countries are reasonable proxies for
investment opportunities (Portes and Rey, 2002). Information costs or asymmetries may be
proxied by a number of variables, but geographic distance has been found to be most relevant.1
While this logic may be extended to developing economies as well (Garg and Dua, 2014; Sun et
al., 2002; Harms, 2002), we ask instead whether there are other country specific characteristics,
economic, political and institutional, among developing countries that may be equally, if not
more important. Although the financial crisis was the most significant event of the mid-2000s,
there have been several subtler changes as well. First, in many developed and developing
countries, there has been an increase in income inequality.2 While average incomes have
increased, the increase in inequality is most pronounced “in the upper parts of the distribution in
most countries” (Jaumotte et al., 2013). Second, perhaps not coincidentally, there has been a
remarkable growth in tax havens and international tax evasion that has attracted serious attention
by governments (e.g., the US Congress), the OECD, and the G-20 industrialized countries
(Gravelle, 2015). Third, many countries, mainly autocracies, do not have well developed
markets or democratic institutions (Olson, 1993). Economic agents in autocratic countries may
behave quite differently than those in developed economies (Adam et al., 2011). Fourth,
resource-based economies, democratic or autocratic, have created sovereign wealth funds that
1 See Portes and Ray (2005) for example. 2 Krusell et al. (2000) demonstrate how efficient technology reduces income for and even replaces unskilled workers in lieu of skilled workers. They observe a significant increase in skill premium since the late 1970s, which corresponds with the increase in income inequality.

4
may invest differently than individual market participants in developed economies (Beck and
Fidora, 2008). It appears that the equities markets may be segmented by differences in buyers. In
fact, we find these individual country characteristics are as significant as the traditional
determinants of cross-border equity flows found in the developed economy literature.
To show this, we construct a data set of FPI flows from 158 source countries to 34 OECD
countries for the period 2002-2013. We combine these with measures of inequality, autocracy,
sovereign wealth fund data, tax haven status and measures reflecting previous findings in the
literature. The model specifications begin with a well-known gravity specification common in
the cross-border equity flows literature.
We find that OECD host countries attract higher equity flows from countries with high
income inequality and countries that have sovereign wealth funds, while less equity flows from
autocratic source countries. Source countries with high income inequality send more FPI if they
also have a sovereign wealth fund or represent an autocracy. On the other hand, source countries
that have a sovereign wealth fund and have an autocratic regime experience lower equity
outflows. Lastly, autocratic source countries invest more in tax havens, countries with high
income inequality invest less in tax havens, and tax haven status has no effect on investment
flows from countries with sovereign wealth funds. Specific rationales underlying these findings
are developed in the hypotheses section below. The results are robust across several
specifications, controlling for the financial crisis, market capitalization of host countries, and
exclusion of the US from the OECD host country sample.
The remainder of the paper proceeds as follows: Section 2 reviews the literature and
develops hypotheses, Section 3 introduces data and methodology, Section 4 discusses the model
and empirical results, and Section 5 concludes.

5
2. Related literature and hypotheses
From the original gravity models of Martin and Rey (2004), Portes et al. (2002) and
Portes and Rey (2005), in which distance was shown to be a strong proxy for information costs
or information asymmetries in international trade, there have been numerous extensions that
include other measures of information costs, in part to explain home bias. For example,
Grinblatt and Kelohaju (2001) argue that language and culture are important as investors desire
“familiarity,” such as local firm recognition or annual reports in their own language. Lucey and
Zhang (2010), Kogut and Singh (1988), and Aggarwal et al. (2012) find that similarity in
religion and culture have positive influences on FPI flows or market correlations. Further, laws
that result in stronger shareholder protection and better accounting standards also have a definite
effect on attracting foreign portfolio flows (Aggarwal et al., 2005), especially when the home
country lacks such protections (Giofré, 2014).
While information costs and various proxies are established determinants of FPI flows,
recent research has started to focus on tax evasion strategies and the role of tax havens. Hanlon et
al. (2015), Kemme et al. (2017), and Johannesen and Zucman (2014), inter alia, find evidence of
source-host tax differentials as a determinant of FPI flowing through tax havens for purposes of
tax evasion. Importantly, tax evaders prefer destinations that are quite different from those
preferred by typical investors. Specifically, they prefer countries with obstacles to the flow of
information; tax havens without tax information exchange agreements and with different legal
systems; but low levels of corruption.

6
2.1 Inequality
An important extension within the tax evasion stream highlights income inequality
(Alstadsaeter et al., 2017a, 2017b). Most research on income inequality and tax evasion focuses
on under-reporting (Bloomquist, 2003a, 2003b). Independent of tax evasion, Acemoglu and
Robinson (2002) theorize that inequality increases with capital industrialization. This process,
however, also leads to a different political policy of greater redistribution, which, hence, results
ultimately in less inequality. This argument can explain the development of many European
countries during the past two centuries. However, to the extent that inequality prevails, it may
lead to greater FPI. Therefore, in this paper we ask whether income inequality, per se, is a
determinant of FPI flows in general. Investing abroad rather than locally is a sophisticated
adventure. Typically, those engaged in foreign investment are more educated and of substantial
means (Graham et al., 2009), and we would expect wealthier countries overall (as measured by
GDP per capita) to have higher FPI flows. However, if income and wealth are heavily
concentrated, there may be a group of individuals more likely to participate in foreign
investment. Therefore, FPI flows might be greater if the total income of the country is more
concentrated or income inequality is greater. If this is true, then by using the Gini index as the
measure of income inequality, we expect it to be positively correlated with FPI, all else equal.
Thus, our first hypothesis is:
H1: The relationship between a source country’s Gini index, a measure of income
inequality, and FPI is positive.
7
2.2. Autocracy
The concept of equality is closely related to democracy. Specifically, democracies are
countries where people “should be treated equally in certain specific political respects” (Saward,
1994). The impact of political systems on equity flows, and vice versa, has long been a topic of
debate. On the one hand, developing autocratic countries, where one individual holds unlimited
power, might attract more inflows because investors can directly negotiate beneficial terms and
conditions with the key policy maker(s) who is (are) less concerned about public opinion (Wolf,
1951; O’Donnell, 1988). Ledyaeva et al. (2013) find evidence of this behavior, especially for
investors from more autocratic and corrupt source countries. On the other hand, greater levels of
autocracy lower financial openness, measured as a country’s total capital inflows and outflows
relative to the country’s GDP (Aizenman and Noy, 2009). Similarly, Jensen (2003) examines the
relationship between political regimes and investment flows on a dataset of 114 countries and
finds that up to 70% more FDI flows into democratic countries than autocratic countries. For
outflows, Brada et al. (2011) conclude that “government repression and regulation . . . [are]
more effective in combating capital flight” in the Commonwealth of Independent States (CIS)
countries; which is in line with Ghosh (2016) who suggests that autocratic regimes use capital
controls to deter money from leaving.
To provide new guidance among mixed prior results, we extend the current literature by
asking if autocratic source countries generate less FPI flows into the OECD than otherwise
similar countries. If the autocracy posts strict capital controls on its equity outflows to prevent
capital flight, we expect a negative relationship between autocracy and FPI flows. To test this
hypothesis, we construct a source country autocracy dummy variable based on autocracy

8
measures provided by the Center for Systemic Peace (discussed in the Data and Methodology
section below). Thus, our second hypothesis is:
H2: The relationship between a source country’s autocracy dummy, a measure of state
and political control, and FPI is negative.
Of course, the relationship may be more complicated than what is expressed in just this
one hypothesis alone. Ben-Nasr et al. (2012) examine 236 privatized companies and find that
state-owned firms experience higher cost of equity. This effect is even stronger when the firm
operates in an autocratic country. Further, Acemoglu et al. (2002) argue that elites and
politicians in autocratic countries exploit society via macro- and microeconomic policies that
result in poor economic performance and high volatility. Hence, country differences in volatility
do not depend per se on differences in macroeconomic factors but rather by the country’s
institutional regime. Moreover, based upon newly published BIS bi-lateral bank deposit data,
Alstadstaeter et al. (2017) find that autocracies (e.g., Saudi Arabia and Russia) and countries
with a recent autocratic history (e.g., Argentina and Greece) have very high levels of wealth held
abroad. One explanation is that if investors belong to the kleptocratic elite, they would be better
able to exploit society and invest those funds overseas the more autocratic their country is (Brada
et al., 2011). However, to generalize this idea we argue that much wealth would have to be
concentrated in the upper echelon of society; hence, these countries would also have greater
inequality as reflected in a higher Gini index.3 We therefore isolate autocracies with high income
inequality and test if an interaction term, the product of a country’s Gini index and the autocracy
dummy, is positively related to FPI. Our third hypothesis is:
3 It is important to point out that in our sample the correlation between the autocracy dummy and Gini index is negative; hence, autocratic countries do not automatically present income inequality.

9
H3: The interaction between the Gini index and the autocracy dummy is positively
related to FPI flows.
2.3. Sovereign Wealth Funds
If large concentrations of wealth within a country lead to unique patterns of cross-border
equity flows, then clearly countries with Sovereign Wealth Funds (SWF) should be included in
our analysis. Since 2000, the rapid increase in the size and activity of SWFs has changed the
international landscape of FPI flows. Because the funds are typically designed to provide savings
for future generations and also to limit the effects of resource export revenues (especially those
attributable to commodity price booms) on the domestic economy, SWFs frequently invest
abroad the majority of taxes and royalties arising from resource sales.4 This gives rise to large
unidirectional cross-border equity flows. They tend to have longer term investment horizons,
which makes them a stable source of cross-border liquidity. However, their quasi-public nature
exposes them to political pressures that may lead to investments for non-economic reasons,
contrary to long-term wealth maximization. In fact, Bernstein et al. (2013) show that the greater
the political involvement in the management of the SWF, the greater the deviation from
maximization of long-run returns. These contradictory motives are difficult to identify.
Aizenman and Glick (2007, 2009) find that countries with SWFs tend to have relatively lower
scores on democracy indices than industrialized, developed countries, but higher than less
developed countries. At the same time, they also have lower effective governance scores than
developed countries, but higher than that of less developed economies. Consequently, as a group
they tend to be unique – occupying a middle range in between developed and less developed
4 See Kemme (2012) for details.

10
countries on democracy and government effectiveness scales.5 With combined assets of about
USD 7.4 trillion, these funds certainly have the wherewithal to affect cross-border equity flows.6
Most of these economies are relatively small in the sense that non-oil GDP is small and, thus,
sophisticated and wealthy individual investors are few. Therefore, we would expect most FPI to
be channeled through the SWF rather than individual investors. They are not immune, however,
from the actions of a kleptocratic class of investors. Because national wealth is concentrated in
the fund and the objective is to move it out of the country, we would expect FPI to be higher than
in countries with comparable GDP and GDP per capita. Thus, we test the following hypothesis:
H4: The relationship between countries with SWFs and FPI is positive.
It should be noted that SWF countries are not identical in their purpose, investment
objectives, legal status or institutional policies.7 Their performance and the ability to monitor
their activities also varies. Truman (2010) compares the transparency scores he calculates across
subgroups and some clear conclusions emerge.8 Three findings that are relevant for our analysis
can be summarized as: “1) for non-pension SWFs, those from OECD countries have Truman
transparency scores much higher than non-OECD countries; 2) of non-OECD SWFs, the non-
Middle East SWFs score higher than the Middle East SWFs; 3) of the non-OECD SWFs Asian
SWFs score higher than non-Asian SWFs” (Kemme, 2012). If autocracies are associated with a
lack of transparency (Eldredge, 2016), we should expect some distinction between the behavior
of FPI flows from SWF countries that are autocratic and those that are not.9 The autocracy
dummy may pick up an important difference in the behavior, or even purpose, of the SWF.
5 For detailed analysis of SWF transparency, which sheds some light on the motives of funds, see Truman (2010). 6 Sovereign Wealth Fund Institute, https://www.swfinstitute.org/sovereign-wealth-fund-rankings/ 7 See Alsweilem et al. (2015a, 2015b) for profiles of 12 large SWFs and wealth management policies that guide them. 8 See Truman (2010) Table 5.2, among others. 9 Note that Aggarwal and Goodell (2018) show that the governance component of the Truman transparency score is also influenced by national cultural characteristics based on Hofstede et al. (2010).

11
While some countries might truly use SFWs as an investment for the benefit of future
generations (Beck and Fidora, 2008; Truman, 2007; inter alia), authoritarian regimes might use
the funds to ameliorate social discontent or prevent possible revolutions against the country’s
political leadership (Ross, 2015; Bueno de Mesquita and Smith, 2010). If resources must be used
to maintain the support of citizens now and avoid a collapse of the autocratic political regime,
fewer resources are available to invest abroad compared to democratic countries with SWFs. As
a result, FPI flows from autocratic SWF countries would be lower than for SWF countries in
general. Thus, we isolate autocracies with SWFs by constructing an interaction variable that is
the product of the autocracy and SWF dummies to test the following hypothesis:
H5: The interaction of the autocracy dummy and the SWF dummy is negatively related
to FPI flows.
Similarly, income inequality and SWFs may be interrelated and have an effect on FPI
flows. They are both hypothesized to have a positive effect on FPI flows, and here the
interaction should be complementary. While there may be high inequality now, as evidenced by
a high Gini index, leading to higher FPI flows, the intent of SWF managers might be to provide
future income from the higher current FPI outflows. These future incomes are presumably for the
benefit of the currently “disadvantaged” in a society with great income inequality. If both
individual effects are positive, the interaction should be positive as well, adding even more to
FPI flows from countries that have both high income inequality (perhaps kleptocratic) and
SWFs. Thus, we test the following hypothesis:
H6: The interaction between the SWF dummy and the Gini index is positively related to
FPI flows.
12
2.4. Tax havens and tax evasion
Our analysis naturally lends itself to extending the tax evasion literature by considering
how the newly evaluated country determinants of FPI might change if funds flow into a tax
haven host country. Previous studies show that more FPI flows into tax havens than non-tax
havens (Hanlon et al., 2015; Kemme et al., 2017). Hence, the host country tax status is
important. At the same time, if more FPI comes from countries with higher income inequality
(greater Gini index), then these funds originate from a select few investors with possibly enough
“personal power” not to be concerned about taxes in their home country. However, if income is
more equally distributed among a larger body of average citizens with less “personal power,”
they are likely to be more scrutinized by the tax authorities and have a greater incentive to shift
their wealth into tax havens. Thus, we test
H7: The interaction between a country’s Gini index and the tax haven dummy is
negatively related to FPI flows.
If indeed autocratic regimes put stricter capital controls on equity outflows of their
citizens (Li, 2006), it becomes harder for individuals to invest overseas. In this situation, the
motivation for sending funds to tax havens would more likely be based on risk diversification
than tax savings. Therefore, to send money out of a restrictive economy against official
directives, citizens would likely select tax havens as host countries to maintain anonymity, avoid
the sharing of tax information and, hence, their detection of illegal activates. Thus, we test the
following hypothesis:
H8: The interaction between the source country autocratic dummy and the tax haven
dummy is positively related to FPI flows.

13
In a final test, we explore if the existence of a SWF in a country is related to FPI through
tax havens. Because the FPI is originating mainly from the SWF, rather than individual
investors, there would also be little incentive for tax evasion strategies.10 Thus, we would
expect there to be less FPI through tax havens than otherwise, or perhaps no statistically
significant flows. Our final hypothesis is:
H9: The interaction between the SWF dummy and the tax haven dummy is either
negatively related to FPI or insignificant.
3. Data and Methodology
We focus on the impact of a source country’s level of income inequality, political regime,
and sovereign wealth fund status on foreign portfolio equity flows. The dependent variable is
Log (FPI), the natural logarithm of foreign portfolio investment a host country receives from
each foreign source country in our sample in each year. We obtain foreign portfolio investment
(FPI) flows from the IMF Coordinated Portfolio Investment Survey Database (CPIS). Our final
sample consists of 16,339 FPI flows from 158 source countries into 34 OECD host countries
between 2002 and 2013. We retain country pairs with at least three observations and equity flows
of a minimum of USD 1 million (Kemme et al., 2017).
We use the Source Gini index to determine the impact of source countries’ level of income
inequality on FPI. This data is obtained from the World Bank database. The Gini index measures
the extent to which the distribution of income (or, in some cases, consumption expenditure)
among individuals or households within an economy deviates from a perfectly equal distribution.
A Gini index of 0 represents perfect equality, while an index of 100 implies perfect inequality.
10 This is an overstatement of course, as in nearly all SWF countries there is a segment of society of very high income individuals who have accumulated significant wealth and may also invest in tax havens. The SWF flows would dominate though.

14
Since this data is not available for all source countries, our final sample consists of 8,669
observations when we test the impact of income inequality on FPI flows.
In order to better understand the impact of the political regime in a source country on FPI
flows, we create a Source Autocratic Country Dummy based on Polity Scores provided by the
Center for Systematic Peace (CSP). Autocracy is defined as a political system that lacks
regularized political competition. CSP provides an 11-point score that measures competitiveness
of political participation, the regulation of participation, the openness and competitiveness of
executive recruitments and constraints on the chief executive of the main political party.11 Our
source autocratic country dummy takes the value of 1 when autocratic scores are greater than or
equal to 4, and 0 otherwise. Autocratic scores greater than or equal to 4 represent the 90th
percentile observations for our sample. Autocratic scores are unavailable for some source
countries in our sample; hence our final sample drops to 15,033 observations when we test the
impact of autocracy on FPI flows.
To test the impact of sovereign wealth funds (SWF) on FPI flows, we create a Sovereign
Wealth Fund Dummy, which takes the value of 1 when a source country has a SWF, and 0
otherwise. We obtain this data from Bagnall and Truman (2013) for each source country, and our
dataset contains 16,639 observations when we examine the impact of SWF on FPI. Table A1 in
the appendix lists the host countries, source countries, autocratic source countries, source
countries with SWFs, and host countries with developed capital markets.
In the analysis that follows, we also include well-established determinants of FPI flows. Log
(Distance) is the natural logarithm of the distance in kilometers between the source and host
country, and we expect a negative coefficient for this variable to account for the home bias
11 Autocracy Scores and details may be found at the Polity Project (http://www.systemicpeace.org/inscr/p4manualv2016.pdf)

15
(Aggarwal et al. 2012, inter alia).12 Identical Language is a dummy variable equal to 1 if the
source and host country speak the same official language, and 0 otherwise. Since familiarity with
the language in the host country increases foreign investments (Aggarwal et al. 2012, inter alia),
we expect a positive coefficient for this variable. Distance data are obtained from Mayer and
Zignago (2011) and Language data are obtained from Melitz and Toubal (2014). Because
investor protection is found to be greater in common law legal systems relative to civil law
systems, we construct a Common Law dummy variable equal to 1 if the host country has a
common law legal system, and 0 otherwise. Legal family data are obtained from La Porta et al.
(1998), and we expect the coefficient for this variable to be positive since more equity flows into
countries with a common law legal system that protects investors better than the civil law legal
system (La Porta et al., 2000; Globerman and Shapiro, 2002). We further control for the size of
the economy since the level of development and population size also influence FPI flows. Alfaro
et al. (2004) and Amaya and Rowland (2004) find foreign direct investments tend to move to
large and developed markets and we expect FPI to do the same; hence, we expect positive
coefficients for the Log (Host Country GDP per Capita) variable. Similarly, we expect a positive
coefficient for the Log (Source Country GDP per Capita) variable since FPI should increase with
wealth in the source country (Kristjánsdóttir, 2005; Duade and Fratzcher, 2008). GDP and
population data are obtained from the World Bank database.
The characteristics of the equity market, the actual exchanges, are emphasized in Thapa and
Poshkawale (2010), highlighting the importance of transaction costs, and Thapa and Poshkwale
(2012), showing that investors prefer larger, more developed economies where the capital market
12 As an alternative distance measure, Hellmanzik and Schmitz (2017) show that virtual proximity, captured by bilateral internet hyperlinks, impacts bilateral portfolio investment. Due to the nature of our variables of interest and focus on tax havens, we use the traditional geographic distance variables.

16
is more liquid and more efficient. Thus, we include Log (Host Country Market Capitalization) as
a measure of the depth and development of the financial markets in the host country. In line with
Aggarwal et al. (2012) we expect the coefficient of this variable to be positive. Withholding Tax
Rate (%) is the tax rate for foreign investors on dividend income. This rate depends on whether
the host and source country have signed and ratified a bilateral double taxation treaty. We obtain
this data from the American Enterprise Institute (AEI) International Tax Database and KPMG
Individual Tax Rate Survey.13 Countries with a lower tax burden will attract higher foreign
investment; hence, we expect the coefficient for Withholding Tax Rates (%) to be negative.
Lastly, we control for a host country’s tax haven status using a Host Tax Haven Dummy, which
is equal to 1 if the host country is considered a tax haven, and 0 otherwise. Following Kemme at
al. (2017), we classify a country as a tax haven if it was included in the Harmful Tax
Competition Report (OECD, 1998) or in the classification based on Hines and Rice (1994), and
we expect the coefficient to be positive. We provide variable names, definitions and sources for
all variables in Table A2 of the appendix.
Table 1 reports the descriptive statistics of the variables used in the study. The average
equity flow between the host and source country in our sample is approximately USD 6.9 billion.
Forty percent of the source country sample has a sovereign wealth fund. In general, the mean
market capitalization of listed companies for all host countries in our sample is USD 1.6 trillion,
with a maximum of USD 19.94 trillion for companies listed in the US. The average distance
between two capital cities is 6,023 km, with a minimum of 160 km (Austria- Netherlands) and a
maximum of 19,516 km (New Zealand- Spain). Fifteen percent of the country pairs share an
identical language and 23 percent have a common-law legal system. Three percent of the host
13 To verify data accuracy, we compare similar tax rate data from other accounting firm publications and find that our tax rates are consistent across these publications.

17
countries in our sample are tax havens. Since our sample consists of inflows into OECD
countries, the average GDP per capita for host countries (USD 42,989) is greater than the
average GDP per capita for source countries (USD 24,839). Approximately ten percent of source
countries are autocracies. The average source country Gini index is 35.6 %, with a minimum of
23.7% for Slovenia and a maximum of 64.8 % for South Africa. Table 2 provides the correlation
table for the variables we employ. There are no unusually high correlations between independent
variables. Consequently, we do not find multi-collinearity in the regression analysis below.
Insert Tables 1 and 2 about here.
4. Model and Empirical Analysis
4.1 Model specification
Our basic model is a gravity equation derived from Martin and Rey (2004). The initial
specification is designed to identify the effects of income inequality, autocracy and SWFs on FPI
flows. The dependent variable is the log of equity flows from source to host country, Log (FPI).
The main independent variables of interest are the Source Gini Index, Source Country Autocracy
Dummy and Source Sovereign Wealth Fund Dummy. We expect positive signs for source
country Gini index and SWF dummy, and a negative coefficient for the autocracy dummy. The
basic regression model and variants may be written as:
𝐿𝐿𝐿𝐿𝐿𝐿 (𝐹𝐹𝐹𝐹𝐹𝐹)𝑖𝑖𝑖𝑖,𝑡𝑡 = 𝛽𝛽1 �𝑆𝑆𝐿𝐿𝑆𝑆𝑆𝑆𝑆𝑆𝑆𝑆 𝐺𝐺𝑖𝑖𝐺𝐺𝑖𝑖 𝐹𝐹𝐺𝐺𝐼𝐼𝑆𝑆𝐼𝐼𝑖𝑖
𝑆𝑆𝐿𝐿𝑆𝑆𝑆𝑆𝑆𝑆𝑆𝑆 𝐶𝐶𝐿𝐿𝑆𝑆𝐺𝐺𝑡𝑡𝑆𝑆𝐶𝐶𝐶𝐶𝑆𝑆𝑡𝑡𝐿𝐿𝑆𝑆𝑆𝑆𝐶𝐶𝑡𝑡𝑖𝑖𝑆𝑆 𝐷𝐷𝑆𝑆𝐷𝐷𝐷𝐷𝐶𝐶𝑖𝑖𝑆𝑆𝐿𝐿𝑆𝑆𝑆𝑆𝑆𝑆𝑆𝑆 𝑆𝑆𝐿𝐿𝑆𝑆𝑆𝑆𝑆𝑆𝑆𝑆𝑖𝑖𝐿𝐿𝐺𝐺 𝑊𝑊𝑆𝑆𝐶𝐶𝑊𝑊𝑡𝑡ℎ 𝐹𝐹𝑆𝑆𝐺𝐺𝐼𝐼 𝐷𝐷𝑆𝑆𝐷𝐷𝐷𝐷𝐶𝐶𝑖𝑖,𝑡𝑡
� + 𝛽𝛽𝑘𝑘𝑋𝑋𝑖𝑖,𝑖𝑖,𝑡𝑡 + 𝑌𝑌𝑆𝑆𝐶𝐶𝑆𝑆 𝐹𝐹𝑖𝑖𝐼𝐼𝑆𝑆𝐼𝐼 𝐸𝐸𝐸𝐸𝐸𝐸𝑆𝑆𝑆𝑆𝑡𝑡𝐸𝐸𝑡𝑡 +∈𝑖𝑖𝑖𝑖,𝑡𝑡…
(1)
where β1 is a three-element row vector and all variables are as defined in the previous section.
Xi,j,t is a vector of other determinants of FPI flows, including Log (Distance), Log (Host GDP

18
per Capita), Log (Source GDP per capita), withholding tax rate (%), Identical Language
dummy, Common Law dummy, Host Tax Haven dummy, and the various interactions discussed
as hypotheses above. Collectively, these variables effectively control for home bias and country
specific characteristics such as equity market features and transactions costs. βk is a vector of
the corresponding coefficients of the variables in Xi,j. We add year fixed effects to account for
unmeasured determinants that vary over time. We estimate using clustered standard errors, by
host country and year, to provide consistent standard errors and appropriate coefficient test
statistics.14
4.2 Empirical Analysis
To determine the effects of inequality, autocracy and SWFs on FPI flows, we estimate
equation 1 and several variants thereof. In each variant, we keep year fixed effects and cluster
standard errors by host country and year.15 The baseline model results are reported in Table 3.
We find that in the baseline model, and all specifications in later tables, the conventional
determinants of FPI flows have the correct signs and are statistically significant. Specifically,
proxies for market opportunities and characteristics (Log (Source Country GDP per capita), Log
(Host Country GDP per capita) and Log (Host Country Market Cap)) all have positive and
statistically significant coefficients, and proxies reflecting information costs also have the
appropriate negative (Log (Distance)) and positive (Identical Language and Common Law)
signs. Withholding Tax Rates (%) is negative and significant, indicating that international tax
policies, such as double taxation agreements, which reduce overall taxation for foreign investors,
14 Clustered standard errors in the panel data setting yield unbiased and asymptotically (in the number of cross sections) efficient standard errors (Peterson, 2009; Thompson, 2011). 15 Both host and source fixed effects were dominated by the control variables in the model, which effectively picked up all of the country specific characteristics.

19
play an important role. These results are very robust and orthogonal to our core variables and all
of the interactions that are of interest. In this sense, we confirm the findings in the literature for
these determinants in our sample, which is more expansive than past studies, and now focus on
the main hypotheses in turn.
If income inequality in the source country is positively related to FPI flows (H1), 𝛽𝛽11 in
equation (1) above must be positive. The baseline model result in Table 3 Model II confirms our
first hypothesis. The coefficient for income inequality (Source Gini index) remains positive and
statistically significant in every model estimated with this variable included (Tables 4 and 5),
thus providing strong evidence that income inequality in the source country leads to greater FPI
outflows, ceteris paribus.
Insert Table 3 about here.
The coefficient for source autocratic country dummy, 𝛽𝛽12, shows the predicted negative and
statistically significant sign in Model III of Table 3. Hence, we confirm our hypothesis H2 that
autocratic source countries send less FPI than democratic source countries. Again, this
coefficient remains negative and statistically significant in all other models (see Tables 4 and 5),
hence providing strong evidence that a country’s political regime has a significantly negative
impact on FPI flows. This finding supports the claims that autocratic countries impose stricter
capital controls on their citizens’ outflows to prevent capital flight.
Table 3, Model IV tests if SWF countries have higher FPI outflows than other countries
of comparable size. As expected, the coefficient for the SWF Dummy, β13, is positive and
statistically significant. The coefficient remains positive and is statistically significant in all but
one of the additional models in Tables 4 and 5. Therefore, we support H4 and can conclude that

20
countries with SWFs are investing abroad at higher rates than comparable countries without
SWFs.
The base line models and those that follow provide strong evidence to not reject H1, H2, and
H4, indicating the importance of inequality, autocracy and sovereign wealth funds. However,
these characteristics are not mutually exclusive, and countries that exhibit a combination of these
characteristics may behave differently. Thus, the next hypotheses look more closely at country
characteristics and their interactions. Three models in Table 4 report the interaction results to
test H3, H5 and H6, and the models in Table 5 add tax haven and additional interactions to the
baseline model to test hypotheses H7, H8 and H9.
Insert Table 4 about here.
Model I in Table 4 confirms that the coefficient of the interaction between autocracy and
income inequality is positive and significant. In support of H3, this result suggests that higher
inequality in autocratic source countries is related to higher FPI flows. While foreign investment
is often discouraged for the general public in autocracies to prevent capital flight, countries with
great income inequality have a small group in the upper echelons of society with both personal
power and wealth. This group, therefore, has the means and likely the ability to invest abroad.
Hence, FPI flows are positively impacted when funds are generated in autocratic countries with
great income inequality.
For hypothesis H5 we examine whether autocratic countries with SWFs engage in less FPI
than SWF countries in general. We argue this could be the case if autocracies need to use part of
their national savings to maintain domestic order. If part of the SWF must be used to maintain
high levels of employment and civil order, fewer funds are available to invest overseas. As

21
predicted, the coefficient on the interaction term is negative and statistically significant in Table
4, Model II, supporting H5.
We test hypothesis H6 in Model III, Table 4. The coefficient for the interaction variable
identifying countries with SWFs and high income inequality is positive and statistically
significant. Hence, countries that currently experience more unequal income distribution seem
more inclined to save for future generations via SWFs than countries with more equal income
distribution, confirming hypothesis H6.
In Table 5 we detail the role of tax havens and their influence on how income inequality,
autocracy and SWFs effect FPI flows. Model I examines hypothesis H7, the interaction between
income inequality and tax havens; Model II focuses on hypothesis H8, the interaction between
sovereign wealth finds and tax havens; and Model III tests hypothesis H9, the interaction
between autocracy and tax havens. In all specifications, we find that the coefficient on the host
tax haven dummy is positive and statistically significant. This implies that the benefits of
investing in tax havens, providing a highly beneficial tax regime and relative anonymity, are
clear to foreign investors with such preferences.
Insert Table 5 about here.
Table 5, Model I, reports that the coefficient for this interaction between the Gini index and
tax haven is negative and statistically significant, supporting H7. Here, we argue that if the
majority of a country’s wealth is residing with a select few, those individuals typically enjoy
sufficient “personal power” such that they are not subjected to probes by tax authorities and do
not require tax havens to shelter their funds. However, if income is more evenly distributed, and
more individuals have an incentive to conserve their wealth, the typical individual has less
“personal power” and tax authorities are more likely to investigate suspicions of tax evasion.

22
Hence, investors have a greater incentive to use tax havens in countries with more equal income
distribution.
Investors from autocratic countries are expected to be interested specifically in anonymity,
especially if the country’s regime imposes strict capital controls on outflows to prevent capital
flight. If individuals in those countries illegally invest overseas, they would want the protection
of anonymity and prefer investing into tax havens. Thus, the coefficient on the interaction term
between the tax haven and autocracy dummies should be positive. Table 5, Model III, confirms
hypothesis H8.
Hypothesis H9 identifies the flows from countries with SWFs into tax havens. In these
countries, we would expect investors, mainly the SWF itself, to invest without regard to tax
haven benefits since they are a state entity to begin with. Model II in Table 5 reports that the
coefficient on this interaction term is insignificant, confirming hypothesis H9. This result
indicates that investors from these countries are not focused on tax savings or anonymity. FPI
flows are driven by more traditional determinants of foreign portfolio flows (GDP, language,
distance, etc.).
4.3 Robustness Tests
Finally, to check the robustness of the results for all of the models above we re-run the basic
models using different sub-samples. Our original sample includes the global recession, 2008 –
2009, which altered international financial flows. To ensure the results are unaffected by this
unusual period, we re-run the models excluding observations from 2008 and 2009. These results
are presented in Panel A of appendix Tables A3, A4 and A5 and are comparable to results
23
presented in Tables 3, 4 and 5. The magnitudes and statistical significance of the coefficients for
the variables of interest are similar.
Because the US market capitalization is about 40% of total global market capitalization, the
magnitude of FPI flows into the US could have a large influence on the estimation results. To
determine if the US flows overly influence the estimation results, we re-run the models removing
the US from our host country sample. The results are presented in panel B of appendix Tables
A3, A4 and A5. Again, the results are comparable in magnitude and statistical significance to
those of Tables 3, 4 and 5.
Lastly, we acknowledge the preference for making investments in well-developed capital
markets (Thapa and Poshakwale, 2012). Therefore, we test if our results hold for this important
sub-sample. Specifically, we use the MSCI Capital Market classifications developed, emerging,
frontier and stand-alone capital market indexes.16 The new sub-sample excludes thirteen OECD
countries that are not classified as ones with a developed capital market. The results in Panel C
of appendix Table A3, A4 and A5 indicate that all hypotheses, H1 through H9, are again
confirmed. Thus, the results are robust across all of our sub-samples and specifications.
5. Conclusion
We find that income inequality, political regime (autocracy vs. democracy) and existence of
a sovereign wealth fund (SWF) are important determinants of cross-border equity flows. We also
confirm that determinants commonly referenced in the literature hold as well and complement
our findings. The results provide meaningful feedback to policy makers, especially in host
countries, and also contribute to the investment and tax evasion literature. The new determinants
16 https://www.msci.com/market-classification

24
we identify provide additional guidance for potential host country authorities’ efforts to attract
funds from specific countries or regions. Some source countries, for example those with a SWF,
may provide a stable source of funds and be an attractive investor with a long-term view, and do
provide a larger flow of foreign portfolio investment (FPI) than countries otherwise comparable.
However, other source countries, with unequal distribution of income, have been identified as
providing more FPI than otherwise comparable countries, but they may be less desirable if
source country stability is negatively affected by income inequality. Further, autocracies may be
a less likely source of incoming FPI and might require closer attention by host country
authorities as these flows are likely to be determined by a fewer number of potential investors.
Source countries that have high income inequality and have a sovereign wealth fund or are
autocratic countries experience higher equity outflows. On the other hand, source countries that
have a sovereign wealth fund and also have an autocratic regime experience lower equity
outflows. We also find that countries with sovereign wealth funds or high income inequality do
not invest in tax havens, but autocratic countries invest in tax havens to maintain anonymity.
Host country authorities promoting local investment opportunities should be aware of these
differences. Future research at a more disaggregated level or with micro level data may be
informative in examining the cross-border equity flows of these source countries.
25
References
Acemoglu, D. and Robinson, J.A., 2002. “The political economy of the Kuznets curve,” Review
of development economics, 6,2: 183-203.
Adam, A., Delis, M.D. and Kammas, P., 2011 “Are democratic governments more
efficient?” European Journal ofPolitical Economy, 27(1): 75-86.
Aggarwal, R., and Goodell, J., 2018. “Sovereign Wealth Fund Governance and National
Culture,” International Business Review, 27: 78-92.
Aggarwal, R, Kearney, C., and Lucey, B., 2012. “Gravity and culture in foreign portfolio
investment,” Journal of Banking and Finance 36, 2: 525-538.
Aggarwal, R., Klapper, L., and Wysocki, P., 2005 “Portfolio preferences of foreign institutional
investors” Journal of Banking and Finance, 29: 2919-2946
Aizenman, J. and R. Glick (2007), “Sovereign Wealth Funds: Stumbling Blocks or Stepping
Stones to Financial Globalization? FRBSF Economic Letter, No 2007-38.
Aizenman, Joshua and Reuven Glick (2009) “Sovereign Wealth Funds: Stylized Facts about
their Determinants and Governance,” International Finance 12,3: 351-386.
Aizenman, J. and Noy, I., 2009. “Endogenous financial and trade openness,” Review of
Development Economics, 13, 2: 175-189.

26
Alstadsaeter, A.,, Johannesen N., and Zucman G.,2017a. “Tax Evasion and Inequality,”
NBER Working Paper 23772, September, 2017. http://www.nber.org/papers/w23772
Alstadsaeter, A.,, Johannesen N., and Zucman G.,2017b. “Who owns Wealth in Tax Havens?
Macro Evidence and Implications for Global Inequality,” NBER Working Paper 23805,
September, 2017. http://www.nber.org/papers/w23805
Alsweilem, K A., Cummine, A., Rietveld, M., and Tweedie, K., 2015a).A Comparative
Study of Sovereign Investor Models: Institutions and Policies for Managing Sovereign Wealth,
Joint Report of the Center for International Development and the Belfer Center for Science
and International Affairs, Harvard Kennedy School.
Alsweilem, K A., Cummine, A., Rietveld, M., and Tweedie, K., 2015b. A Comparative
Study of Sovereign Investor Models: Sovereign Fund Profiles, Joint Report of the Center
for International Development and the Belfer Center for Science and International Affairs,
Harvard Kennedy School.
Beck, R. and Fidora, M., 2008. “The impact of sovereign wealth funds on global financial
markets,”. Intereconomics, 43,6: 349-358.

27
Bernstein, Shai, Josh Lerner, and Antoinette Schoar (2013) "The Investment
Strategies of Sovereign Wealth Funds," Journal of Economic Perspectives, 27(2):
219-38. DOI: 10.1257/jep.27.2.219
Bloomquist, Kim 2003a. “US Income Inequality and Tax Evasion: A Synthesis,” Tax Notes
International, 31,4: 347-367.
Bloomquist, Kim 2003b. “Tax Evasion, Income Inequality and Opportunity Costs of
Compliance,” Proceedings. Annual Conference on Taxation and Minutes of the Annual
Meeting of the National Tax Association, 96: 91-104.
http://www.jstor.org.ezproxy.memphis.edu/stable/41954396
Brada, J.C., Kutan, A.M. and Vukšić, G., 2011. “The costs of moving money across borders and
the volume of capital flight: the case of Russia and other CIS countries,” Review of world
economics, 147,4: 717-744.
Bueno de Mesquita B, Smith A., 2010. “Leader survival, revolutions, and the nature of
government finance,” American Political Science Review 54,4: 936–50
Doukas, J., 1985. “Determinants of Foreign Portfolio Investment: Another Approach,”.Canadian
Journal of Administrative Sciences/Revue Canadienne des Sciences de
l'Administration, 2,2: 264-277.

28
Duade, C., and Fratzcher M., 2008. “The pecking order of cross border investment”, Journal of
International Economics, 74: 94-119
Eldredge, C.D., 2016. The Political Determinants of Sovereign Wealth Funds.
Garg, R. and Dua, P., 2014 Foreign portfolio investment flows to India: determinants and
analysis. World Development, 59, pp.16-28.
Ghosh, M.,, 2016 What’s In a Name? That Which We Call Capital Controls. International
Monetary Fund.
Giofré, M., 2014. Domestic investor protection and foreign portfolio investment. Journal of
Banking & Finance, 46: 355-371.
Globerman, S., Shapiro, D., 2002. “Global foreign direct investment flows: The role of
governance infrastructure,” World Development, 30(11): 1899–1919.
Gravelle, J. G., 2015. Tax havens: International tax avoidance and evasion. Washington, DC:
Congressional Research Service.
Goldstein, I. and Razin, A., 2006. “An information-based trade-off between foreign direct
investment and foreign portfolio investment,” Journal of International Economics, 70,1:
271-295.

29
Graham, J.R., Harvey, C.R. and Huang, H., (2009.) Investor competence, trading frequency, and
home bias. Management Science, 55(7): 1094-1106.
Greenblatt, Mark and Matti Keloharju (2001) “How Distance, Language and Culture Influence
Stockholdings and Trades,” Journal of Finance 56,3: 1053-1073.
Hanlon, M., Maydew, E. L. and Thornock, J. R., 2015. ‘Taking the long way home: US tax
evasion and offshore investments in US equity and debt markets’, The Journal of
Finance, 70: 257–87.
Harms, P., 2002. Political risk and equity investment in developing countries. Applied
Economics Letters, 9(6): 377-380.
Hellmanzik, C. and Schmitz, M., 2017. Taking gravity online: the role of virtual proximity in
international finance. Journal of International Money and Finance, 77: 164-179.
Hofstede, G., Hofstede, G. J., & Minkov, M., 2010. Cultures and organizations: Software of
the mind. New York: McGraw-Hill.
Jaumotte, F., Lall, S., and Papageorgiou, C., 2013 “Rising Income Inequality: Technology,
or Trade and Financial Globalization?” IMF Economic Review 61,2: 271- 309. doi:
10.1057/imfer.2013.7

30
Johannesen, N., and Zucman, G., 2014. “The End of Bank Secrecy? An Evaluation
of the G20 Tax Haven Crackdown,” American Economic Journal: Economic Policy,
6(1): 65–91.
Kemme, David, Sovereign Wealth Fund Issues and The National Fund(s) of Kazakhstan , 2012.
William Davidson Institute Working Paper No. 1036. Available at SSRN:
https://ssrn.com/abstract=2188391 or http://dx.doi.org/10.2139/ssrn.2188391
Kemme, David M., Bhavik Parikh and Tanja Steigner 2017. “Tax Havens, Tax Evasion and Tax
Information Exchange Agreements in the OECD,” European Financial Management,
23,3: 519-543.
Kho, B.C., Stulz, R.M. and Warnock, F.E., 2009. “Financial globalization, governance, and the
evolution of the home bias,” Journal of Accounting Research, 47,2: 597-635.
Krusell, P., Ohanian, L.E., Ríos‐Rull, J.V. and Violante, G.L., 2000. “Capital‐skill
complementarity and inequality: A macroeconomic analysis,” Econometrica, 68,5: 1029-
1053.
La Porta, R., Lopez-de-Silanes, F., Shleifer, A. and Vishny, R. W., 1998. “Law and finance’,
Journal of Political Economy,” 106: 1113-55.

31
La Porta, R., Lopez-de-Silanes, F., Shleifer, A., and Vishny, R.W., 2000. Investor protection and
corporate governance. Journal of Financial Economics, 58(1): 3–27.
Ledyaeva, S., Karhunen, P. and Kosonen, R., 2013. “Birds of a feather: Evidence on
commonality of corruption and democracy in the origin and location of foreign
investment in Russian regions,” European Journal of Political Economy, 32: 1-25.
Li, Q., 2006. “Democarcy , Autocracy and Tax incentives to Foreign Direct Investors: A cross
national Analysis,” The Journal of Politics, 1: 62-74.
Mayer, T. and Zignago, S., 2011. ‘Notes on CEPII's distances measures: the GeoDist Database’,
CEPII Working Paper 2011–25, 2011.
Martin, Philippe and Rey, H., 2004. “Financial Supermarkets: size matters for asset trade,”
Journal of International Economics 64: 335-361.
Melitz, J., and Toubal, F., 2014. “Native language, spoken language, transition and trade,”
Journal of International Economics, 92,2: 351–63.
Marshall, M., Gurr, T., and Jaggers K., 2017. “Political Regime Characteristics and Transitions,
1800-2016”, POLITY IV Project, Center for Systemic Peace,
http://www.systemicpeace.org/inscr/p4manualv2016.pdf

32
O'Donnell, G., 1988. “Bureaucratic Authoritarianism : Argentina, 1966-1973,” Comparative
Perspective. Berkeley : University of California Press.
Olson, M., 1993. “Dictatorship, democracy, and development,” American political science
review, 87(3): 567-576.
Portes, R,i and Rey, H., Rey (2005) “The Determinants of Cross-Border Equity Flows,”
Journal of International Economics, 65: 269-296.
Portes, R., Rey, H.,., and Yonghyup, O., 2002. “Information and Capital Flows: The
determinants of transactions in financial assets,” European Economic Review, 45: 783-
796.
Ross, M.L., 2015. “What have we learned about the resource curse?,” Annual Review of Political
Science, 18: 239-259.
Saward, M., 1994. “Democratic theory and indices of democratization,” SAGE MODERN
POLITICS SERIES, 36: 6-6.

33
Sun, Q., Tong, W. and Yu, Q., 2002. Determinants of foreign direct investment across
China. Journal of international money and finance, 21(1): 79-113.
Thapa, C. and Poshakwale, S.S., 2010 International equity portfolio allocations and transaction
costs. Journal of Banking & Finance, 34(11): 2627-2638.
Thapa, C. and Poshakwale, S.S., 2012. Country-specific equity market characteristics and
foreign equity portfolio allocation. Journal of International Money and Finance, 31(2):
189-211.
Truman, E.M., 2007. Sovereign wealth funds: the need for greater transparency and
accountability (No. PB07-6). Washington, DC: Peterson Institute for International
Economics.
Truman, E. M., 2010 Sovereign Wealth Funds: Threat or Salvation? (Washington, D.C.:
Peterson Institute for International Economics, 2010).
Wolf, C., 1951. “Political Effects of Economic Development,” Far Eastern Survey, 20,9: 81-87.
Zucman, G., 2014. “Tax Evasion on Offshore Profits and Wealth,” Journal of Economic
Perspectives, 28(4): 121–148.

34
Table 1: Descriptive Statistics
This table presents descriptive statistics for all variables. Equity Flows (million$) is total inflows received by the host country from a source country in each year. Sovereign Wealth Fund Dummy is a binary variable taking the value 1 when a source country has a Sovereign Wealth Fund; 0 otherwise. Withholding Taxes (%) is the withholding tax rate applied by the host country on the source country dividend income based on existing double taxation agreement. Host Country Market Cap (billion $) measures the market capitalization of all listed companies in the host country. Distance (KM) is the distance between two capital cities in kilometers. Identical Language is a dummy variable taking the value 1 when host and source share a common language; 0 otherwise. Common Law is a dummy variable taking the value 1 when the host country has a common law legal system; 0 otherwise. Host Country GDP per Capita ($) is the GDP per capita of the host country for a given year in USD. Source Country GDP per Capita ($) is the GDP per capita of the source country for a given year in USD. Host Tax Haven is a dummy variable taking the value 1 when the host country is classified as a Tax Haven; 0 otherwise. Source Autocratic Country Dummy is a binary variable taking the value 1 when a source country has autocratic scores greater than 4; 0 otherwise. Source Gini Index (%) measures income inequality of the source country. See Table A2 of the Appendix for sources. N is the number of observations. Std Dev is the standard deviation of each variable.
Variable N Mean Std Dev Minimum Maximum
Equity Flows ($ MN) 16639 6994.73 31205.94 1.00 758411.00 Sovereign Wealth Fund Dummy 16639 0.40 - 0.00 1.00 Withholding Taxes (%) 16639 16.46 6.72 0.00 47.00 Host Country Market Cap ($ BN) 16639 1675.81 3764.98 1.13 19947.28 Distance (KM) 16639 6023.84 4578.26 160.93 19516.56 Identical Language 16639 0.15 - 0.00 1.00 Common Law 16639 0.23 - 0.00 1.00 Host Country GDP Per Capita ($) 16639 42989.55 21117.88 3576.23 113738.73 Source Country GDP per Capita ($) 16639 24839.52 22906.83 130.91 112028.57 Host Tax Haven 16639 0.03 - 0.00 1.00 Source Autocratic Country Dummy 15033 0.10 - 0.00 1.00 Source Gini Index (%) 8689 35.56 8.41 23.70 64.80

35
Table 2: Correlation Table This table presents the Pearson correlation between each pair of variables. All variables are as defined in Table A2 of the Appendix. ***, **, * indicate statistical significance at 1%, 5% and 10% respectively
Variable
Sovereign Wealth Funds
Dummy Withholding Taxes (%)
Host Market Cap ($BN)
Distance (KM)
Identical Language
Common Law
Host Country GDP per Capita
($)
Source Country GDP
per Capita Host Tax
Haven
Source Autocratic Dummy
Source Gini index(%)
Sovereign Wealth Funds
Dummy 1 Withholding Taxes (%) -0.0566*** 1
Host Market Cap ($BN) -0.0394*** 0.1762*** 1
Distance (KM) 0.3183*** 0.2019*** 0.1952*** 1 Identical Language -0.0337*** 0.1085*** 0.2561*** 0.0811*** 1
Common Law -0.0009 0.0109 0.5010*** 0.2390*** 0.3856*** 1 Host Country
GDP per capita ($) -0.0106 0.0346*** 0.0269*** 0.0042 -0.0173** -0.0273*** 1
Source Country GDP per Capita
($) 0.0406*** -0.0885*** -0.0891*** -0.1945*** -0.0019 -0.0250*** -0.0975*** 1 Host Tax
Haven 0.0013 -0.1044*** -0.0763*** -0.0078 0.0890*** 0.3366*** 0.0513*** -0.0006 1 Source
Autocratic Dummy 0.1828*** -0.0120 0.0285*** 0.0604*** 0.0491*** 0.0124 0.0769*** -0.1296*** -0.0149* 1
Source Gini index (%) 0.3527*** 0.2545*** 0.0516*** 0.4976*** 0.0862*** 0.0333*** 0.0209** -0.4965*** 0.0193* -0.0281*** 1

36
Table 3: Baseline Model Results
This table presents OLS results with year fixed effects and standard errors clustered by host country and year. The dependent variable is Log (Equity Flows) the logarithm of portfolio equity inflows from source country to a host country for each year. All variables are as defined as in Table 1 above and in Table XY of the Appendix. Model I presents the base line results. Specification II includes the Sovereign Wealth Fund Dummy Variable with the base model. In specification III Source Autocratic Dummy variable is included and in specification IV we have included Source Gini Index. ***, **, * indicate statistical significance at 1%, 5 % and 10 % level respectively.
Parameters I II III IV
Source Gini Index 0.0856*** (0.004) Source Autocratic Country Dummy -0.9903*** (0.072) Sovereign Wealth Fund Dummy 0.7370***
(0.030) Host Tax Haven 1.5436*** 1.3926*** 1.3811*** 1.5178***
(0.217) (0.215) (0.215) (0.220) Withholding Taxes (%) -0.0331*** -0.0452*** -0.0456*** -0.0274***
(0.004) (0.005) (0.005) (0.004) Log(Source Country GDP per Capita) 0.8121*** 1.4522*** 1.0132*** 0.7552***
(0.018) (0.033) (0.021) (0.017) Log(Host Country GDP per Capita) 1.3945*** 1.4962*** 1.5413*** 1.3809***
(0.094) (0.110) (0.101) (0.095) Log(Host Country Market Cap) 0.4609*** 0.5065*** 0.4896*** 0.4696***
(0.021) (0.028) (0.024) (0.022) Log(Distance) -0.2058*** -0.4258*** -0.1551*** -0.3584***
(0.025) (0.037) (0.027) (0.025) Identical Language 0.7196*** 1.0179*** 0.8715*** 0.7109***
(0.052) (0.086) (0.052) (0.053) Common Law 0.1381 0.2584* 0.1446 0.2170**
(0.107) (0.148) (0.116) (0.107)
Year Fixed Effects Yes Yes Yes Yes No of Observation 16639 8689 15033 16639 R Square 0.9847 0.9884 0.9869 0.9850

37
Table 4: Baseline model with interactions
This table presents OLS results with year fixed effects and standard errors clustered by host country and year. The dependent variable is Log(Equity Flows) the logarithm of portfolio equity inflows from source country to a host country for each year. In specification I, we introduce Source Gini index, Sovereign Wealth Fund Dummy variable and their interaction with control variables from baseline model in Table 2 specification 1. In specification II, we introduce Source Gini Index, Sovereign Autocratic Dummy variable and their interaction with control variables from baseline model in Table 2 specification 1. In specification III, we introduce Sovereign Wealth Fund Dummy, Sovereign Autocratic Dummy variable and their interaction with control variables from baseline model in Table 2 specification 1. All variables are as defined in Table A2 of the Appendix. ***, **, * represent statistical significance at 1%, 5 % and 10 % level respectively.
Parameters I II III
Source Gini index 0.0811*** 0.0659***
(0.004) (0.006) Source Autocratic Country Dummy -3.7428*** -1.0034*** (0.716) (0.092) Sovereign Wealth Fund Dummy 0.9063*** 0.0182
(0.026) (0.235) Source Gini index * Source Autocratic Dummy 0.1263*** (0.022) Source Autocratic Country Dummy * Sovereign Wealth Fund Dummy -0.3368*** (0.119) Source Gini Index * Sovereign Wealth Fund Dummy 0.0135**
(0.007) Host Tax Haven 1.3263*** 1.3284*** 1.3869***
(0.217) (0.217) (0.218) Withholding Taxes (%) -0.0430*** -0.0416*** -0.0431***
(0.005) (0.005) (0.005) Log(Source Country GDP per Capita) 1.5284*** 0.9415*** 1.4102***
(0.038) (0.020) (0.033) Log(Host Country GDP per Capita) 1.5435*** 1.5259*** 1.4842***
(0.104) (0.103) (0.111) Log(Host Country Market Cap) 0.5114*** 0.5026*** 0.5147***
(0.029) (0.025) (0.029) Log(Distance) -0.4284*** -0.3402*** -0.5097***
(0.037) (0.027) (0.038) Identical Language 0.9423*** 0.8465*** 1.0570***
(0.089) (0.054) (0.085) Common Law 0.2790* 0.2573** 0.3055**
(0.154) (0.116) (0.179)
Year Fixed Effects Yes Yes Yes No of Observation 8513 15033 8689 R Square 0.9890 0.9873 0.9883

38
Table 5: Baseline with Tax Haven Results
This table presents OLS results with year fixed effects and standard errors clustered by host country and year. The dependent variable is Log (Equity Flows) the logarithm of portfolio equity inflows from source country to a host country for each year. All variables are as defined in Table 2 of the Appendix. Model 1 presents the results including host tax haven dummy and source Gini index along with their interaction. Model 2 presents the results including host tax haven and Sovereign Wealth Fund dummies along with their interactions. Model 3 presents the results including host tax haven and Source Autocratic dummies along with their interaction. Model 4 has host tax haven, Sovereign Wealth Fund and Source Autocratic dummies and source Gini Index along with their interactions. In each model we have the base model from Table 2 Model 1 which includes control variables. ***, **, * represent statistical significance at 1%, 5 % and 10 % level respectively.
Parameters I II III
Source Gini index 0.0864*** (0.004) Sovereign Wealth Fund Dummy 0.7374*** (0.031) Source Autocratic Country Dummy -1.0101***
(0.073) Source Gini index * Host Tax Haven -0.0291** (0.015) Sovereign Wealth Fund Dummy * Host Tax Haven -0.0141 (0.105) Source Autocratic Country Dummy * Host Tax Haven 0.7826***
(0.228) Host Tax Haven 2.4522*** 1.5235*** 1.3205***
(0.515) (0.219) (0.215) Withholding Taxes (%) -0.0449*** -0.0274*** -0.0457***
(0.005) (0.004) (0.005) Log(Source Country GDP per Capita) 1.4520*** 0.7552*** 1.0137***
(0.033) (0.017) (0.021) Log(Host Country GDP per Capita) 1.4956*** 1.3809*** 1.5422***
(0.110) (0.095) (0.102) Log(Host Country Market Cap) 0.5056*** 0.4696*** 0.4900***
(0.028) (0.022) (0.024) Log(Distance) -0.4345*** -0.3584*** -0.1553***
(0.037) (0.025) (0.027) Identical Language 1.0181*** 0.7109*** 0.8675***
(0.087) (0.053) (0.052) Common Law 0.2584** 0.2171** 0.1455
(0.148) (0.107) (0.116)
Year Fixed Effects Yes Yes Yes No of Observation 8689 16639 15033 R Square 0.9884 0.9850 0.9869

39
Appendix
Table A1: Host countries, source countries, autocracies, SWF countries and tax haven
countries
Host Countries Australia, Austria, Belgium, Canada, Chile, Czech Republic, Denmark,
Estonia, Finland, France, Germany, Greece, Hungary, Iceland, Ireland, Israel, Italy, Japan, South Korea, Luxembourg, Mexico, Netherlands, New Zealand, Norway, Poland, Portugal, Slovak Republic, Slovenia, Spain, Sweden, Switzerland, Turkey, United Kingdom, United States
Source Countries Afghanistan, Albania, Algeria, , Angola, Anguilla, Antigua and Barbuda, Argentina, Armenia, Australia, Austria, Azerbaijan, Bahamas, Bahrain, Bangladesh, Barbados, Belarus, Belgium, Belize, Bermuda, Bolivia, Bosnia and Herzegovina, Botswana, Brazil, Bulgaria, Burkina Faso, Cape Verde, Cambodia, Cameroon, Canada, Cayman Islands, Chile, Hong Kong, China, Colombia, Democratic Republic of Congo, Republic of Congo, Costa Rica, Cote d’Ivoire, Croatia, , Cyprus, Czech Republic, Denmark, Dominica, Dominican Republic, Ecuador, Egypt, El Salvador, Equator Guinea, Estonia, Ethiopia, Finland, France, Gabon, Gambia, Georgia, Germany, Ghana, Greece, Grenada, Guatemala, Guinea, Guinea – Bissau, Guyana, Hungary, Iceland, India, Indonesia, Iran, Iraq, Ireland, Israel, Italy, Jamaica, Japan, Jordan, Kazakhstan, Kenya, South Korea, Kuwait, Republic of Kyrgyz, Laos, Latvia, Lebanon, Lesotho, Liberia, Libya, Lithuania, Luxembourg, Macedonia, Madagascar, Malawi, Malaysia, Maldives, Mali, Malta, Mauritania, Mauritius, Mexico, Moldova, Mongolia, Montenegro, Morocco, Mozambique, Namibia, Nepal, Netherlands, New Zealand, Nicaragua, Niger, Nigeria, Norway, Oman, Pakistan, Panama, Papua New Guinea, Paraguay, Peru, Philippines, Poland, Portugal, Puerto Rico, Qatar, Romania, Russia Federation, Rwanda, Saudi Arabia, Senegal, Serbia, Seychelles, Sierra Leone, Singapore, Slovak Republic, Slovenia, South Africa, Spain, Sri Lanka, St Kitts and Nevis, St Vincent and Grenadines, Swaziland, Sweden, Switzerland, Taiwan, Tanzania, Thailand, Togo, Trinidad and Tobago, Tunisia, Turkey, Uganda, Ukraine, United Arab Emirates, United Kingdom, United States, Uruguay, , Venezuela, Vietnam, Yemen, Zambia, Zimbabwe
Source Countries with Sovereign Wealth Fund
Algeria, Angola, Australia, Azerbaijan, Bahrain, Brazil, Canada, Chile, Hong Kong, China, Colombia, Equator Guinea, France, Gabon, Ghana, Iceland, Indonesia, Iran, Ireland, Japan, Kazakhstan, Korea, Kuwait, Latvia, Libya, Malaysia, Mauritania, Mexico, Mongolia, Netherlands, New Zealand, Nigeria, Norway, Oman, Panama, Peru, Qatar, Russia, Singapore, Thailand, Trinidad and Tobago, Uganda, United Arab Emirates, United States, Venezuela, Vietnam
Autocratic Source Countries
Algeria, Angola, Azerbaijan, Bahrain, Bangladesh, Belarus, Cameroon, China, Republic of Congo, Egypt, Equatorial Guinea, Ethiopia, Gabon, Gambia, Iran, Jordan, Kazakhstan, Kuwait, Laps, Morocco, Nepal, Oman, Pakistan, Qatar, Rwanda, Saudi Arabia, Singapore, Swaziland, Thailand, Togo, Uganda, United Arab Emirates, Venezuela, Vietnam, Zimbabwe
Host Countries with Developed Capital Markets as per MSCI
Australia, Austria, Belgium, Canada, Denmark, Finland, France, Germany, Ireland, Israel, Italy, Japan, Netherlands, New Zealand, Norway, Portugal, Spain, Sweden, Switzerland, United Kingdom, United States

40
Table A2: Description of Variables and Sources Variable Description Source Ln (Equity Flows) Logarithm of equity flow from source country,
which is the country of origin, to a host country, which is the intended destination. It is in millions of USD.
IMF-CPIS
Identical Language Dummy variable taking the value 1 when both host and source countries share a common language, and 0 otherwise.
CEPII
Common Law Dummy variable taking the value 1 when host country follows a common legal practices, and 0 otherwise
La Porta et al. (1998,)
Distance Distance between two capital cities or two financial centers measured in km.
CEPII
Host GDP Per Capita ($) The ratio of GDP in USD of the host country divided by the population of the host country
WorldBank
Source GDP per Capita The ratio of GDP in USD of the source country divided by the population of the source country
WorldBank
Host Market Capitalization ($) Market Capitalization of all the listed companies in USD
WorldBank
Sovereign Wealth Fund Dummy Dummy Variable taking the value 1 when a source country has a sovereign wealth fund and 0 otherwise
Bagnall and Truman (2013)
Source Gini Index This measure the income inequality in the source country with score from 0 -100 with a higher score indicating higher income inequality
WorldBank
Source Autocratic Dummy Dummy variable taking the value 1 if autocratic scores greater than 3 or 0 otherwise
Center for Systemic Peace
Host Tax Haven Dummy variable taking the value of 1 if country of reception of flows is considered as a tax haven, and 0 otherwise.
Hines and Rice (1994) and Harmful Tax Competition report (OECD, 1998)

41
Table A3: Robustness Results- Base Models This tables presents the robustness results with specifications similar to Table 3. In panel A we remove the recession years (2008, 2009) from the sample. In Panel B we remove USA as host country from the sample. In Panel C we have a sample of host countries which are classified as developed capital markets by MSCI. The dependent variable is Log (Equity Flows) the logarithm of portfolio equity inflows from source country to a host country for each year. All variables are as defined in Table A2 of the Appendix. ***, **, * represent statistical significance at 1%, 5 % and 10 % level respectively.
Panel A: Non Recession Year Sample Parameters I II III IV
Source Gini index 0.0845*** (0.004) Source Autocratic Country Dummy -0.9558*** (0.085) Sovereign Wealth Fund Dummy 0.7522***
(0.033) Host Tax Haven 1.3760*** 1.2114*** 1.2107*** 1.3475***
(0.236) (0.236) (0.233) (0.238) Withholding Taxes (%) -0.0342*** -0.0442*** -0.0471*** -0.0284***
(0.004) (0.005) (0.005) (0.004) Log(Source Country GDP per Capita) 0.8090*** 1.4334*** 1.0124*** 0.7508***
(0.019) (0.036) (0.023) (0.019) Log(Host Country GDP per Capita) 1.4575*** 1.5493*** 1.6077*** 1.4426***
(0.094) (0.116) (0.104) (0.095) Log(Host Country Market Cap) 0.4573*** 0.4985*** 0.4841*** 0.4664***
(0.024) (0.033) (0.027) (0.025) Log(Distance) -0.2309*** -0.4819*** -0.1825*** -0.3873***
(0.026) (0.041) (0.029) (0.027) Identical Language 0.6724*** 0.9415*** 0.8132*** 0.6619***
(0.057) (0.088) (0.054) (0.058) Common Law 0.2192* 0.3574** 0.2263* 0.3000**
(0.113) (0.158) (0.124) (0.113)
Year Fixed Effects Yes Yes Yes Yes No of Observation 13048 6788 12090 13048 R Square 0.9849 0.9884 0.9871 0.9852

42
Panel B: Non USA host country Sample Parameters I II III IV
Source Gini index 0.0916*** (0.004) Source Autocratic Country Dummy -0.1037*** (0.072) Sovereign Wealth Fund Dummy 0.7097***
(0.030) Host Tax Haven 1.5721*** 1.4712*** 1.4421*** 1.5544***
(0.224) (0.221) (0.220) (0.225) Withholding Taxes (%) -0.0257*** -0.0393*** -0.0385*** -0.0202***
(0.004) (0.005) (0.005) (0.004) Log(Source Country GDP per Capita) 0.7821*** 1.4327*** 0.9810*** 0.7263***
(0.017) (0.034) (0.019) (0.016) Log(Host Country GDP per Capita) 1.3878*** 1.4911*** 1.5357*** 1.3748***
(0.093) (0.108) (0.099) (0.094) Log(Host Country Market Cap) 0.4502*** 0.4848*** 0.4716*** 0.4566***
(0.022) (0.028) (0.024) (0.022) Log(Distance) -0.2333*** -0.4900*** -0.1791*** -0.3823***
(0.024) (0.036) (0.027) (0.025) Identical Language 0.8256*** 1.1804*** 0.9608*** 0.8327***
(0.057) (0.080) (0.053) (0.051) Common Law 0.1042 0.1699 0.0768 0.1679
(0.119) (0.161) (0.127) (0.119)
Year Fixed Effects Yes Yes Yes Yes No of Observation 15663 8218 14171 15663 R Square 0.9854 0.9889 0.9874 0.9856

43
Panel C: MSCI Developed Host Country Capital Markets Parameters I II III IV
Source Gini index 0.0904*** (0.004) Source Autocratic Country Dummy -0.9878*** (0.078) Sovereign Wealth Fund Dummy 0.7657***
(0.035) Host Tax Haven 1.7244*** 1.8903*** 1.6258*** 1.7217***
(0.227) (0.231) (0.225) (0.230) Withholding Taxes (%) -0.0391*** -0.0513*** -0.0549*** -0.0332***
(0.005) (0.006) (0.005) (0.004) Log (Source Country GDP per Capita) 0.8724*** 1.6103*** 1.0781*** 0.8156***
(0.018) (0.033) (0.023) (0.018) Log(Host Country GDP per Capita) 1.2513*** 1.3543*** 1.4625*** 1.2142***
(0.139) (0.181) (0.150) (0.142) Log(Host Country Market Cap) 0.5148*** 0.6495*** 0.5726*** 0.5288***
(0.031) (0.040) (0.032) (0.031) Log(Distance) -0.1751*** -0.3797*** -0.1233*** -0.3306***
(0.027) (0.042) (0.030) (0.027) Identical Language 0.6889*** 0.9581*** 0.8293*** 0.6836***
(0.054) (0.092) (0.052) (0.056) Common Law 0.0948 0.0924 0.0817 0.1681
(0.113) (0.150) (0.119) (0.113)
Year Fixed Effects Yes Yes Yes Yes No of Observation 13167 6614 11837 13167 R Square 0.9849 0.9889 0.9874 0.9852

44
Table A4: Robustness Results- Interaction Model This tables presents the robustness results with specifications similar to Table 4. In panel A we remove the recession years (2008, 2009) from the sample. In Panel B we remove USA as host country from the sample. In Panel C we have a sample of host countries which are classified as developed capital markets by MSCI. The dependent variable is Log (Equity Flows) the logarithm of portfolio equity inflows from source country to a host country for each year. All variables are as defined in Table A2 of the Appendix. ***, **, * represent statistical significance at 1%, 5 % and 10 % level respectively.
Panel A: Non-Recession Year Sample Parameters I II III
Source Gini index 0.0783*** 0.0617***
(0.004) (0.006) Source Autocratic Country Dummy -2.8453*** -1.0207*** (0.850) (0.101) Sovereign Wealth Fund Dummy 0.9131*** 0.0540
(0.029) (0.246) Source Gini index * Source Autocratic Dummy 0.0979*** (0.026) Source Autocratic Country Dummy * Sovereign Wealth Fund Dummy -0.2680*** (0.128) Source Gini index * Sovereign Wealth Fund Dummy 0.0177**
(0.007) Host Tax Haven 1.1344*** 1.1536*** 1.1967***
(0.236) (0.234) (0.239) Withholding Taxes (%) -0.0424*** -0.0428*** -0.0419***
(0.005) (0.005) (0.005) Log(Source Country GDP per Capita) 1.5030*** 0.9380*** 1.3836***
(0.042) (0.022) (0.037) Log(Host Country GDP per Capita) 1.6011*** 1.5936*** 1.5401***
(0.114) (0.105) (0.117) Log(Host Country Market Cap) 0.5017*** 0.4973*** 0.5072***
(0.034) (0.028) (0.033) Log(Distance) -0.4709*** -0.3714*** -0.5588***
(0.042) (0.029) (0.043) Identical Language 0.8641*** 0.7898*** 0.9768***
(0.090) (0.057) (0.089) Common Law 0.3837* 0.3427** 0.4052**
(0.161) (0.123) (0.159)
Year Fixed Effects Yes Yes Yes No of Observation 6633 12090 6788 R Square 0.9890 0.9875 0.9887
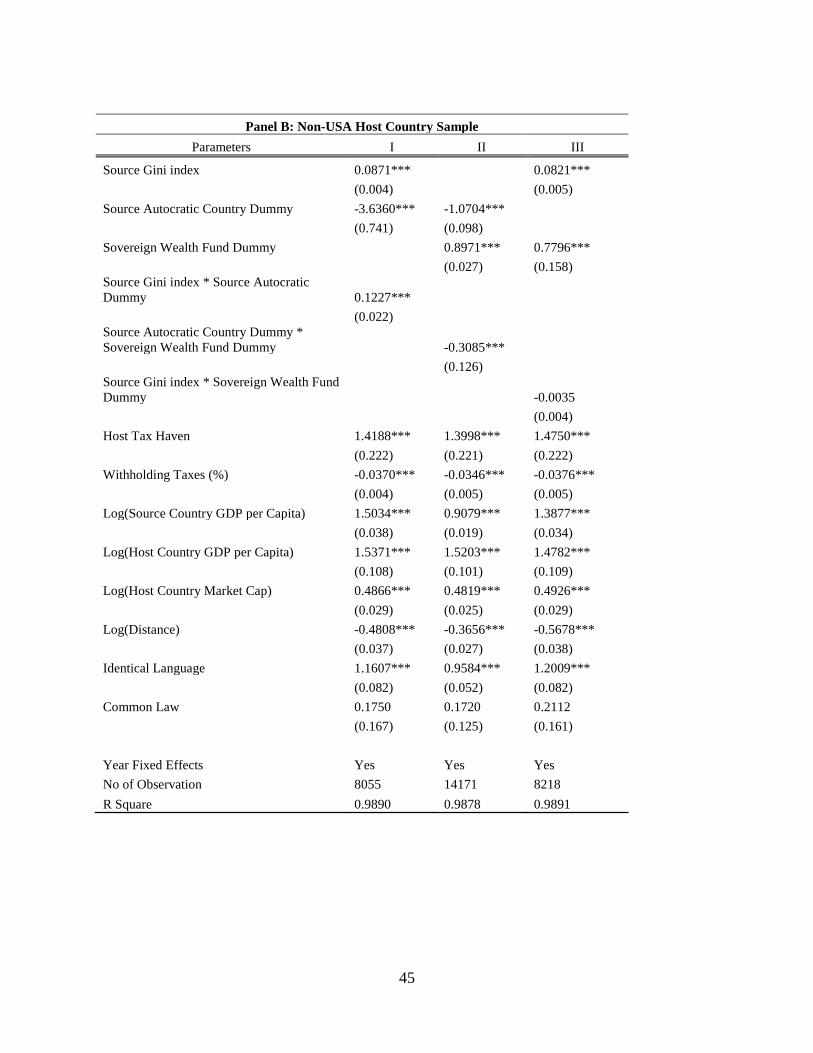
45
Panel B: Non-USA Host Country Sample
Parameters I II III
Source Gini index 0.0871*** 0.0821***
(0.004) (0.005) Source Autocratic Country Dummy -3.6360*** -1.0704*** (0.741) (0.098) Sovereign Wealth Fund Dummy 0.8971*** 0.7796***
(0.027) (0.158) Source Gini index * Source Autocratic Dummy 0.1227*** (0.022) Source Autocratic Country Dummy * Sovereign Wealth Fund Dummy -0.3085*** (0.126) Source Gini index * Sovereign Wealth Fund Dummy -0.0035
(0.004) Host Tax Haven 1.4188*** 1.3998*** 1.4750***
(0.222) (0.221) (0.222) Withholding Taxes (%) -0.0370*** -0.0346*** -0.0376***
(0.004) (0.005) (0.005) Log(Source Country GDP per Capita) 1.5034*** 0.9079*** 1.3877***
(0.038) (0.019) (0.034) Log(Host Country GDP per Capita) 1.5371*** 1.5203*** 1.4782***
(0.108) (0.101) (0.109) Log(Host Country Market Cap) 0.4866*** 0.4819*** 0.4926***
(0.029) (0.025) (0.029) Log(Distance) -0.4808*** -0.3656*** -0.5678***
(0.037) (0.027) (0.038) Identical Language 1.1607*** 0.9584*** 1.2009***
(0.082) (0.052) (0.082) Common Law 0.1750 0.1720 0.2112
(0.167) (0.125) (0.161)
Year Fixed Effects Yes Yes Yes No of Observation 8055 14171 8218 R Square 0.9890 0.9878 0.9891
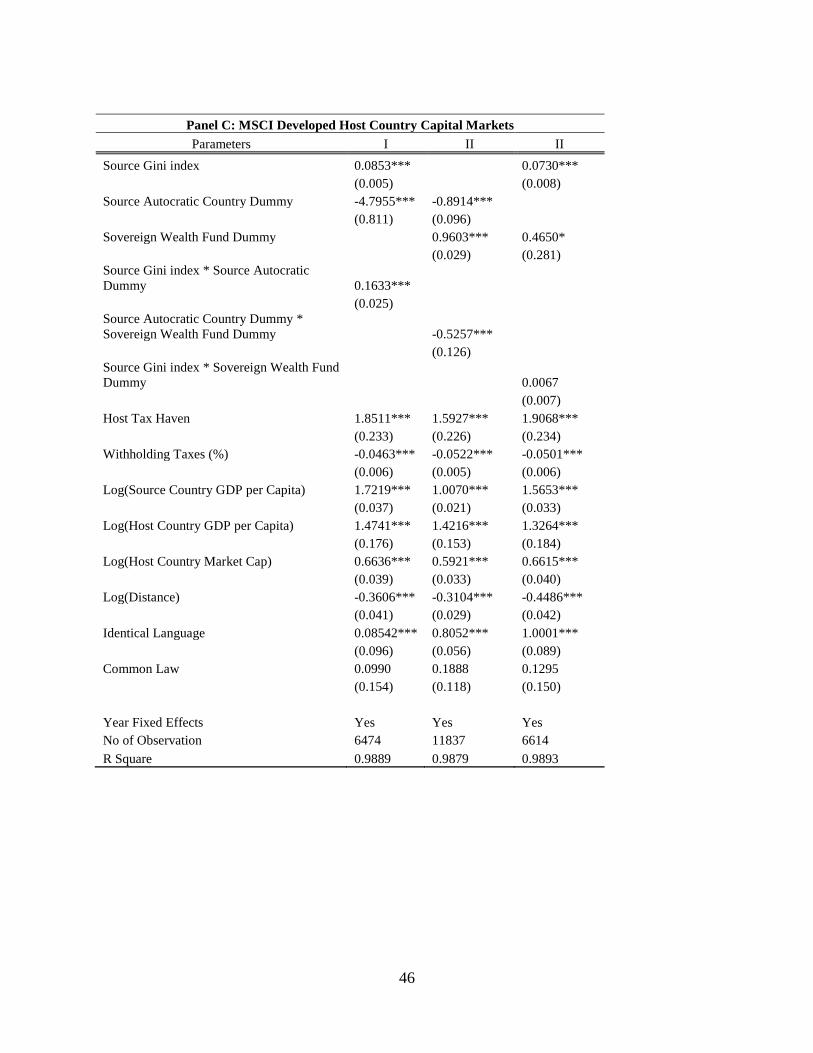
46
Panel C: MSCI Developed Host Country Capital Markets Parameters I II II
Source Gini index 0.0853*** 0.0730*** (0.005) (0.008) Source Autocratic Country Dummy -4.7955*** -0.8914*** (0.811) (0.096) Sovereign Wealth Fund Dummy 0.9603*** 0.4650* (0.029) (0.281) Source Gini index * Source Autocratic Dummy 0.1633*** (0.025) Source Autocratic Country Dummy * Sovereign Wealth Fund Dummy -0.5257*** (0.126) Source Gini index * Sovereign Wealth Fund Dummy 0.0067 (0.007) Host Tax Haven 1.8511*** 1.5927*** 1.9068*** (0.233) (0.226) (0.234) Withholding Taxes (%) -0.0463*** -0.0522*** -0.0501*** (0.006) (0.005) (0.006) Log(Source Country GDP per Capita) 1.7219*** 1.0070*** 1.5653*** (0.037) (0.021) (0.033) Log(Host Country GDP per Capita) 1.4741*** 1.4216*** 1.3264*** (0.176) (0.153) (0.184) Log(Host Country Market Cap) 0.6636*** 0.5921*** 0.6615*** (0.039) (0.033) (0.040) Log(Distance) -0.3606*** -0.3104*** -0.4486*** (0.041) (0.029) (0.042) Identical Language 0.08542*** 0.8052*** 1.0001*** (0.096) (0.056) (0.089) Common Law 0.0990 0.1888 0.1295 (0.154) (0.118) (0.150) Year Fixed Effects Yes Yes Yes No of Observation 6474 11837 6614 R Square 0.9889 0.9879 0.9893

47
Table A5: Robustness Results - Tax Havens Model This tables presents the robustness results with specifications similar to Table 5. In panel A we remove the recession years (2008, 2009) from the sample. In Panel B we remove USA as host country from the sample. In Panel C we have a sample of host countries which are classified as developed capital markets by MSCI. The dependent variable is Log (Equity Flows) the logarithm of portfolio equity inflows from source country to a host country for each year. All variables are as defined in Table A2 of the Appendix. ***, **, * represent statistical significance at 1%, 5 % and 10 % level respectively.
Panel A: Non-Recession Year Sample Parameters I II III
Source Gini index 0.0855*** (0.004) Sovereign Wealth Fund Dummy 0.7517*** (0.033) Source Autocratic Country Dummy -0.9780*** (0.087) Source Gini index * Host Tax Haven -0.0335** (0.014) Sovereign Wealth Fund Dummy * Host Tax Haven -0.0150 (0.102) Source Autocratic Country Dummy * Host Tax Haven 0.7662*** (0.250) Host Tax Haven 2.4479*** 1.3413*** 1.1495*** (0.521) (0.237) (0.233) Withholding Taxes (%) -0.0437*** -0.0284*** -0.0471*** (0.005) (0.004) (0.005) Log(Source Country GDP per Capita) 1.4331*** 0.7508*** 1.0128*** (0.036) (0.019) (0.023) Log(Host Country GDP per Capita) 1.5485*** 1.4426*** 1.6087*** (0.115) (0.095) (0.103) Log(Host Country Market Cap) 0.4974*** 0.4664*** 0.4845*** (0.033) (0.095) (0.027) Log(Distance) -0.4804*** -0.3873*** -0.1827*** (0.042) (0.026) (0.029) Identical Language 0.9409*** 0.6619*** 0.8088*** (0.089) (0.058) (0.054) Common Law 0.3580** 0.3001*** 0.2273* (0.158) (0.113) (0.124) Year Fixed Effects Yes Yes Yes No of Observation 6788 13048 12090 R Square 0.9884 0.9852 0.9869

48
Panel B: Non-USA Host Country Sample Parameters I II III
Source Gini index 0.0927*** (0.004) Sovereign Wealth Fund Dummy 0.7082*** (0.031) Source Autocratic Country Dummy -1.0585*** (0.074) Source Gini index * Host Tax Haven -0.0354** (0.014) Sovereign Wealth Fund Dummy * Host Tax Haven -0.0476 (0.108) Source Autocratic Country Dummy * Host Tax Haven 0.7739*** (0.221) Host Tax Haven 2.7622*** 1.5351*** 1.3822***
(0.512) (0.225) (0.219) Withholding Taxes (%) -0.0387*** -0.0202*** -0.0386***
(0.005) (0.004) (0.005) Log(Source Country GDP per Capita) 1.4320*** 0.7263*** 0.9815*** (0.034) (0.016) (0.019) Log(Host Country GDP per Capita) 1.4901*** 1.3748*** 1.5366***
(0.108) (0.094) (0.100) Log(Host Country Market Cap) 0.4838*** 0.4566*** 0.4720***
(0.028) (0.022) (0.024) Log(Distance) -0.4890*** -0.3823*** -0.1792*** (0.037) (0.025) (0.027) Identical Language 1.1831*** 0.8326*** 0.9532***
(0.080) (0.051) (0.053) Common Law 0.1709 0.1680 0.0778
(0.161) (0.119) (0.127)
Year Fixed Effects Yes Yes Yes No of Observation 8218 15663 14171 R Square 0.9889 0.9856 0.9874

49
Panel C: MSCI Developed Host Country Capital Markets Parameters I II III
Source Gini index 0.0912*** (0.004) Sovereign Wealth Fund Dummy 0.7690*** (0.036) Source Autocratic Country Dummy -1.0137***
(0.080) Source Gini index * Host Tax Haven -0.0244* (0.015) Sovereign Wealth Fund Dummy * Host Tax Haven -0.0867 (0.106) Source Autocratic Country Dummy * Host Tax Haven 0.8608***
(0.240) Host Tax Haven 2.7807*** 1.7570*** 1.5598***
(0.532) (0.231) (0.225) Withholding Taxes (%) -0.0510*** -0.0332*** -0.0549***
(0.006) (0.004) (0.005) Log(Source Country GDP per Capita) 1.6102*** 0.8156*** 1.0786***
(0.033) (0.018) (0.023) Log(Host Country GDP per Capita) 1.3539*** 1.2145*** 1.4622***
(0.181) (0.143) (0.149) Log(Host Country Market Cap) 0.6488*** 0.5287*** 0.5732***
(0.040) (0.031) (0.032) Log(Distance) -0.3781*** -0.3303*** -0.1238***
(0.042) (0.027) (0.030) Identical Language 0.9587*** 0.6838*** 0.8242***
(0.092) (0.056) (0.052) Common Law 0.0918 0.1678 0.0828
(0.150) (0.113) (0.119)
Year Fixed Effects Yes Yes Yes No of Observation 6614 13167 11837 R Square 0.9891` 0.9852 0.9874