Industry Top Trends 2020 · 2019-11-20 · Industry Top Trends 2020: Oil and Gas S&P Global Ratings...
14
S&P Global Ratings 1 Industry Top Trends 2020 Oil and Gas Default risks grow, while IMO 2020 is the short-term focus What’s changed? Growing concerns about 2020 oil demand. Slowing economic expansion is crimping demand growth for crude oil, although it's likely to grow around 1.2% or 1.2 million barrels a day (MMbbl/d) in 2020. OPEC continues to constrain supply even as overall production keeps rising, possibly ahead of consumption in 2020. Low natural gas prices. Most regions have an oversupply, if not an adequate amount of, gas. Even with a seasonal uptick in winter in consumption, high storage levels with muted demand mean price upside is likely limited. Climate change populism. We see the potential for step changes in the operating environment and more aggressive regulation as policies evolve. Policies and popular opinion haven’t reconciled the twin realities of growing global energy demand and greenhouse gas levels What to look for in the sector in 2020? IMO's new regulations. Oil product markets face massive changes as global shipping dramatically cuts its use of high sulfur fuel oil in response to IMO 2020. A hike in demand for middle distillates will likely boost prices. Sour higher-sulfur crude oils are likely to be less attractive to refiners. Will OPEC continue with supply cuts, set to expire in March 2020? Without production cuts from OPEC and Russia, oil prices would be well below their current levels. However, we remain concerned about the resolve to do so indefinitely. What are the key medium-term credit drivers? On average in 2020, Brent oil prices above $55 and WTI above $50. For most producers that we rate, especially in the high yield space, a sustained price below $50 for WTI and $55 for Brent probably means a rapid deterioration in credit quality. As such, sub-investment-grade companies would likely experience downgrades. Restructuring risk. We anticipate another wave of defaults and bankruptcies, particularly in North America owing to a heavy preponderance of highly speculative issuers with limited access to capital markets. Low bond prices raise the specter of distressed exchanges. November 20, 2019 Authors Thomas Watters New York +1 212 438 7818 thomas.watters @spglobal.com Simon Redmond London +44 20 7176 3683 simon.redmond @spglobal.com Michael Grande New York +1 212 438 2242 michael.grande @spglobal.com
Transcript of Industry Top Trends 2020 · 2019-11-20 · Industry Top Trends 2020: Oil and Gas S&P Global Ratings...
S&P Global Ratings 1
Industry Top Trends 2020 Oil and Gas Default risks grow, while IMO 2020 is the short-term focus
What’s changed? Growing concerns about 2020 oil demand. Slowing economic expansion is crimping demand growth for crude oil, although it's likely to grow around 1.2% or 1.2 million barrels a day (MMbbl/d) in 2020. OPEC continues to constrain supply even as overall production keeps rising, possibly ahead of consumption in 2020.
Low natural gas prices. Most regions have an oversupply, if not an adequate amount of, gas. Even with a seasonal uptick in winter in consumption, high storage levels with muted demand mean price upside is likely limited.
Climate change populism. We see the potential for step changes in the operating environment and more aggressive regulation as policies evolve. Policies and popular opinion haven’t reconciled the twin realities of growing global energy demand and greenhouse gas levels
What to look for in the sector in 2020? IMO's new regulations. Oil product markets face massive changes as global shipping dramatically cuts its use of high sulfur fuel oil in response to IMO 2020. A hike in demand for middle distillates will likely boost prices. Sour higher-sulfur crude oils are likely to be less attractive to refiners.
Will OPEC continue with supply cuts, set to expire in March 2020? Without production cuts from OPEC and Russia, oil prices would be well below their current levels. However, we remain concerned about the resolve to do so indefinitely.
What are the key medium-term credit drivers?
On average in 2020, Brent oil prices above $55 and WTI above $50. For most producers that we rate, especially in the high yield space, a sustained price below $50 for WTI and $55 for Brent probably means a rapid deterioration in credit quality. As such, sub-investment-grade companies would likely experience downgrades.
Restructuring risk. We anticipate another wave of defaults and bankruptcies, particularly in North America owing to a heavy preponderance of highly speculative issuers with limited access to capital markets. Low bond prices raise the specter of distressed exchanges.
November 20, 2019
Authors Thomas Watters New York +1 212 438 7818 thomas.watters @spglobal.com Simon Redmond London +44 20 7176 3683 simon.redmond @spglobal.com Michael Grande New York +1 212 438 2242 michael.grande @spglobal.com

Industry Top Trends 2020: Oil and Gas
S&P Global Ratings November 20, 2019 2
Ratings Trends and Outlook Global Oil and Gas (ex Midstream) Chart 1 Chart 2
Ratings distribution by region Ratings distribution by subsector
Chart 3 Chart 4
Ratings outlooks Ratings outlooks by subsector
Chart 5 Chart 6
Ratings outlook net bias Ratings net outlook bias by subsector
Source: S&P Global Ratings. Ratings data measured at quarter end. Data for fourth-quarter 2019 is end October 2019.
Our negative outlook bias signals that the sector as a whole is not healthy, specifically for high-yield credits and many oilfield service companies and drillers. In contrast, large investment-grade players and most refiners have been able to rebuild or consolidate rating headroom in recent years. This dichotomy is partly due to the success of the upstream players, especially the majors, in controlling costs and spending after the 2014-2016 oil price crash. The flip side is that the suppliers to the producing companies remain under varying degrees of pressure. Still, many smaller upstream companies in North America are also feeling the heat. Financial--as well as operational--restructurings are therefore unlikely to be confined to the service companies and drillers, as we’ve already seen in 2019. And all this even without a U.S. or global recession.

Industry Top Trends 2020: Oil and Gas
S&P Global Ratings November 20, 2019 3
Exploration and Production Key assumptions
1. Oil prices
Our base case deck for average Brent and WTI prices is relatively flat mirroring the futures curve. Our price deck assumes Brent and WTI prices, per barrel (bbl) and respectively, of $60 and $50 for 2020, $55 and $55 for 2021, 2022, and beyond. Oil fundamentals remain reasonably supportive of credit quality. Barring a recession, we expect oil prices to remain between $50 and $60 on average. We assume the 1.2MMbbl/d of production cuts from OPEC and several other nations, as well as ongoing sanctions against Iran will continue. In addition, we do not expect Venezuela will increase production, but rather that the likelihood of further cuts in production remaining high. Also, U.S. producers, yielding to investor sentiment, are curtailing aggressive spending and production, opting to operate within cash flows, which curbs rampant production growth. A sustained oil price below $50 would not be good for overall credit quality for both the E&P and oilfield service sectors.
2. Natural gas prices
Natural gas prices tumbled in 2019. In the U.S., our current Henry Hub natural gas prices for the remainder of 2019, 2020, 2021, and 2022 and the long term are, respectively, $2.25, $2.50, $2.75, and $3.00. For AECO, we assume $1.25 for the remainder of 2019 and 2020, and $1.50 for 2021 and the long-term deck. Inventory levels, while having increased rapidly, are within the five-year average heading into the heating season. A cold winter could quickly pull levels down and push prices up. However, if the winter is mild, we could see natural gas prices dip below $2.00. We remain concerned about bi-product natural gas coming out of the Permian Basin in particular, which could continue no matter what the price of gas is. Furthermore, a recession could further weaken demand for gas.
3. Regional price differentials, especially in North America
Regional differentials, which we factor into our credit analysis, are typically more problematic for oil and gas producers in North America than in other regions. The price for oil on the Western Canadian Select, the Canadian oil benchmark, is trading markedly below WTI due to takeout capacity limitations. However, it’s difficult at this juncture to ascertain when this will subside because of ongoing Canadian regulatory and court battles that have delayed or cancelled pipeline additions. For natural gas, the Waha gas hub in Texas had rebounded meaningfully with the construction of the Gulf Coast Express Pipeline. But the pipeline quickly filled to capacity, triggering another sharp drop for Waha and it is now trading well below the Henry Hub. Moreover, the Permian Highway pipeline project was delayed until early 2021 due to regulatory hurdles. Permian gas is finding its way into the Denver-Julesburg basin and has caused differentials there to widen as well. Additionally, the price for natural gas at the AECO storage facility in Alberta, Canada is trading well below Henry Hub due to the lack of takeout capacity basically from the NOVA Gas Transmission System.
Brewing concerns about 2020 oil demand. It’s been some time since we've been concerned about the demand for oil, with oversupply being the main trouble area. That’s not to say supply is no longer a concern. Rather, we're seeing that the demand side of the equation has reared its head. Trade wars and increasing concerns about the global economy slowing down have led to declining oil prices over the past year. The U.S. Energy Information Administration, for example, has lowered its demand growth outlook for 2019 from 1.5 million bpd at the beginning of the year to 760,000 bpd. While the International
Industry Top Trends 2020: Oil and Gas
S&P Global Ratings November 20, 2019 4
Energy Agency (IEA) demand outlook for 2020 is likely to be around 1.2% or 1.2 MMbbl/d, this estimate could be lower if global economic growth continues to weaken. These revised demand expectations ring true, for example in the failure of oil prices to rise higher--and for longer--after the attacks and outage in Saudi Arabia, even if supply disruption was also avoided. OPEC continues to constrain exports even as overall production keeps growing, ahead of possibly weaker consumption in 2020.
Low natural gas prices. Natural gas in most regions is oversupplied, particularly in North America. Entering the 2019 injection season, at the end of last year, prices were high, natural gas directed rigs were at their lowest levels since November 2017 and inventory levels stood below the one-year and five year averages, setting up what should have been a robust year for natural gas prices. However, gas prices have dropped this year due to:
– Concern amongst traders given record increases in gas injection rates; – Completion of the Gulf Coast Express pipeline, which alleviated trapped gas in the
Permian; – LNG-related regulatory delays in the Gulf of Mexico and low global LNG prices that
have caused buildout construction delays and made attracting capital difficult to build facilities; and
– Bi-product natural gas continues to be responsible for approximately half of U.S. natural gas production and thus, does not behave to the laws of supply and demand for gas alone.
A mild Asian winter in 2018-2019 meant LNG volumes from well-supplied markets there arrived in an already well-stocked Europe, putting pressure on European benchmarks, just as U.S. LNG exports have also been ramping up.
Industry Top Trends 2020: Oil and Gas
S&P Global Ratings November 20, 2019 5
Key risks and opportunities
1. Capital market access
One of the major sector risks is the debt maturity wall facing speculative-grade companies and their ability to meet maturities. The unsecured debt markets have practically dried up for most of the high-yield issuers looking to secure financing to meet maturities, as long as they have sufficient PV-10 valuations and room under secured covenant tests to secure obligations. Preliminarily, with the bank revolver redetermination season in full cycle, it looks like revolver borrowing bases could be reduced by an average of 10%-12%, more so for some of the companies that rely more on gas.
2. Global recession
A sharp downturn in the global economy would clearly result in a pronounced decline in demand and therefore in oil and natural gas prices. Recent history suggests oil prices could drop severely in a recession. During the industry trough of 2015-2016, the price per barrel of WTI and Brent averaged $43.15 and $43.55, respectively. Trading actually saw both Brent and WTI fall from more than $100/bbl to below $30/bbl in early 2016, although prices didn’t stay there very long. In the previous industry downturn in 2008, oil prices retreated from a high of more than $145/bbl to $32/bbl due to the financial crisis, a stronger U.S. dollar, and lower global demand. Predicting oil prices through a recession is difficult, but just as difficult as projecting how long oil prices will stay low. In 2009, we saw a rapid rebound in prices. Given this swift increase, few oil and gas companies defaulted because they were able to weather the brief downturn. However, with shale production increasing materially since then and production continuing to grow while marginally barrels remain profitable, the recent downturn lasted more than two years, resulting in a significant number of bankruptcies and defaults. If the recent downturn in oil prices is any indication of what oil prices could look like and for how long during a 2020 recession, there could be another significant wave of bankruptcies.
3. Increasing defaults
With the E&P portfolio so highly weighted to the lower end of the high yield universe, especially in the U.S., anticipating an increasing wave of defaults and bankruptcies is a normal reaction. We are expecting it. In fact, we already saw in 2019. Given where current bond prices are trading and where industry yields are, alongside the inability to finance upcoming maturities, it's highly likely that companies will negotiate with bond holders and conduct what we view to be distressed exchanges, where the bond holders are getting less than the original promise of the indenture.
IMO 2020. On Jan. 1, 2020, the IMO's regulations to reduce sulfur content to 0.5% from 3.5% in marine fuel will have dramatic implications for oil product markets. We expect complex refineries that have the ability to process what will likely be lower-priced, high sulfur crude into higher margin distillate and marine gas oil, will benefit. This will trigger a spike in demand for middle distillates, prompting price increases in respective products. The price of sour, higher-sulfur crudes will likely decline. While most refineries we rate should benefit, especially those in the Gulf of Mexico, we do not anticipate positive rating actions since we assume any windfall will be used to improve shareholder returns.
Producers who can produce sweet (low in sulfur) oil should realize higher prices, as refineries that lack the necessary complexity (equipment) to process sour crudes into light distillate/low-sulfur fuel oil--a product that will be demanded by shipping companies to comply with the new regulation--will increase demand for sweeter crude. Producers in the U.S., North Sea, and West Coast of Africa that produce light/sweet crude
Industry Top Trends 2020: Oil and Gas
S&P Global Ratings November 20, 2019 6
stand to benefit from higher prices. Producers of heavy/sour-based crudes, such as producers in Canada, the Middle East, and Mexico, will likely see an immediate drop in prices for their crude as lower demand from refineries hurts pricing.
Will OPEC continue with supply cuts, set to expire in March 2020? One thing is clear: Without the production cuts from OPEC and Russia, oil prices would be well below their current levels. OPEC and Russia have continued to do what it takes to support oil prices. Still, we remain concerned about how long this will carry on. Saudi Arabia, which has a big influence on OPEC’s decisions, is preparing the IPO of Saudi Aramco, and it makes sense to keep production cuts and support the oil price until at least the IPO is completed. Moreover, in light of the recent attacks on the Saudi Abqaiq oil processing facility, allegedly by Iranian backed Houthi militia, Saudi Arabia could conceivably consider driving down the price of oil to affect Iran’s ability to fund political instability in the region. Saudi Arabia still has deep pocketed sovereign wealth funds and could withstand a prolonged period of low crude prices while maintaining and funding its socio-economic programs.
When do investors come back to oil and gas? Not any time soon. It’s been approximately two years since equity investors forced oil and gas companies to operate at a minimum, live within their cash flow, stop the rampant production growth, and focus more on return of capital to shareholders either through dividends or share repurchases. This has driven E&P companies to undergo major strategic transformations. E&Ps revamped their portfolios, selling off non-core, high-cost assets to focus on high-return core properties and improve returns. They have embraced fiscal discipline by cutting capital spending to live within cash flow while prioritizing shareholder returns by instituting dividends and stock repurchase programs. Lower capital spending and higher production have been the rule in 2019, and there are early indications that 2020 will not be all that different.
Industry Top Trends 2020: Oil and Gas
S&P Global Ratings November 20, 2019 7
Oilfield Services and Offshore Contract Drillers Key assumptions
1. Capital spending
We expect E&P capital spending growth to be muted in 2020, consistent with moderating oil prices and lower natural gas prices.
2. Rig count/utilization
The global rig count currently stands at 2,141, approximately 4.6% less than the end of last year. We believe that, at current prices, rig count will, at best, remain at or near present levels due to capital budget restraints.
3. Margins
It’s unlikely oilfield services (OFS) companies will see bigger margins in 2020, not with the expectation of oil and gas prices remaining at or near where they are now and with spending declining in the last few months of the year.
Capital spending
We expect E&P capital spending growth to be muted in 2020, consistent with moderating oil prices and lower natural gas prices. Lower capital spending and higher production seem to have set the tone in 2019, especially toward the end of the year as budgets have been met and prices have declined. We're already seeing that 2020 may usher in similar conditions. It’s possible that at a $60/bbl Brent, overall global spending in the oil field service patch could actually decline to about 5% in 2020. Shale could see more than that. U.S. companies will remain sensitive to investor aversion to outspending cash flow and focus on return of capital to shareholders. We also expect efficiency gains, while slowing, will allow drillers to be more productive with less money. International spending will likely strengthen incrementally, driven by the major and international oil companies’ need to improve reserve replacement and a modest increase in offshore activity.
Rig count/utilization
The global rig count currently stands at 2,141, approximately 4.6% less than the end of last year, largely driven by declining rig counts in the U.S. International markets tend to be less volatile on both the downside and upside, incorporating the influence of national oil companies and lack of short-cycle development, which is typical of shale. Venezuela continues to be a drag on the total rig count because of financial distress, while the U.S rig count, for both oil and natural gas, has declined over 2019, primarily due to lower oil, LNG, and gas prices. Also, drilling and unforeseen geological issues in the SCOOP/STACK play has led to meaningful declines in rigs in the basin. We believe at current prices, rig count will, at best, remain at or near these levels due to capital budget restraints.
We believe the deepwater offshore market has stabilized but at extremely low levels. Utilization remains depressed and there are still too many rigs that are warm stacked and able to very quickly come on the market. Some are still being built. We believe that, without an increase in oil prices, operators will need to cold stack more rigs but that this will continue slowly due to the cost and charges incurred. Although we expect utilization for floaters to slightly improve in 2020, we don’t expect it to reach 85%--typically the level at which day rates begin rising--until the back half of 2021.

Industry Top Trends 2020: Oil and Gas
S&P Global Ratings November 20, 2019 8
Margins
It’s unlikely that oilfield services (OFS) companies will see bigger margins in 2020, not with the expectation of oil and gas prices remaining at or near where they are now and with spending declining in the last few months of the year. Pretty much across the board and product lines, OFS companies are seeing declining prices. The outlook for proppant prices, which are very low, is that they will remain relatively flat over the next several years. There remains too much supply from in basin sands to be able to push through any increases while pressure pumping prices are expected to recover nominally from trough levels as operators continue to lay down and cold stack rigs. We believe the OFS industry has been fundamentally altered due to spending constraints at the E&P level and permanent efficiencies that have reduced the need for equipment and services. Indeed, the oil rig count in the U.S. is roughly half of what it was at the end of 2014, but oil production is at an all-time high.
Key risks and opportunities
1. Hydrocarbon prices
We view a sudden drop in commodity prices as the main risk to the credit quality of OFS companies. Under our assumptions, development levels will either remain broadly unchanged or drop in 2020. We believe a sustained price below $50 would restrain already tight E&P spending budgets and would be detrimental to the overall credit quality of the sector.
2. Increasing defaults
Given very high yields and the lack of capital market access to meet maturing debt, the entire sector faces an elevated risk of increasing defaults. Most of the OFS companies we rate have very low ratings and will most likely default in the coming years without financing options. All of the exclusively offshore drillers are in our 'CCC' category given unsustainable leverage and concerns about access to capital.
Industry Top Trends 2020: Oil and Gas
S&P Global Ratings November 20, 2019 9
Refining Key assumptions
1. Stricter low-sulfur marine fuel requirements from IMO 2020
IMO 2020 presents a risk for low-complexity refineries with limited crude and product flexibility, but an opportunity for complex refiners, particularly U.S.-based refiners. We believe crude and product markets will accommodate these shifts during the first half of 2020, but that pricing, especially in local markets, could be very volatile as supply and demand balances across the product slate adjust.
2. Refining margins
Our working assumption is that average 2020 refining margins are above 2019 levels. Refiners—and traders—are likely to capture stronger profits per barrel as purchasers lock in supplies of IMO 2020 compliant and other fuels.
3. Distillate and gasoline demand
Since middle distillates are a key substitute for HSFO, we believe they will benefit from a step-up in demand from late 2019 and early 2020. More broadly, emerging economies, especially China and India, will likely continue to drive global gasoline demand growth, as well as for other oil products. Aside from IMO 2020 effects, demand from OECD members is likely to be flattish in 2020.
Stricter low-sulfur marine fuel requirements from IMO 2020
In general, IMO 2020 presents a risk for low-complexity refineries with limited crude and product flexibility, but an opportunity for complex refiners, particularly U.S.-based refiners. The IMO is further tightening the limit on sulfur emissions in bunker fuel for ships. As a result, from late 2019, we anticipate a drop in demand for HSFO and a hike in demand for middle distillates. This is material for the product markets and represents a swing in oil product demand of about 3.0-3.5 MMbbl/d. We believe crude and product markets will accommodate these shifts during the first half of 2020, but that pricing, especially in local markets, could be very volatile as supply and demand balances across the product slate adjust. We believe U.S. refiners will be the most profitable given their flexibility to optimize their crude slate to the most profitable crudes (heavy, sour crudes) and process it into higher-value-added products. Refiners located in Africa, South America, Russia, parts of Europe, and some Asian countries that have limited coking or hydrocracking ability and yield more low-value fuel oil will most likely have to transition into to lighter/sweeter (but more expensive) crude slates and could see some pressure on profitability and cash flows.
Refining margins
Our working assumption is that average 2020 refining margins are above 2019 levels. Refiners—and traders—are likely to capture stronger profits per barrel as purchasers lock in supplies of IMO 2020 compliant and other fuels. Still, because the IMO disruption works out of the global system, we see conflicting drivers for refining margins in most regions globally emerging in the latter part of the year. As the anticipated supportive impact of IMO 2020 changes for diesel cracks and refining margins fades, capacity additions and refinery runs could outstrip softening product demand. We expect that distillate refining margins will be robust in 2020, not just from shipper demand for pure distillate or diesel but from bunker suppliers looking to blend with HSFO. Blending residual fuels with more distillate to improve compliance will likely further increase

Industry Top Trends 2020: Oil and Gas
S&P Global Ratings November 20, 2019 10
demand and the price for distillates. Prices and cracks for low sulfur fuel oil (LSFO) and distillates are expected to rise sharply. Gasoline margins should increase as well due to the shift in utilization of distillate production and thus reduced production of gasoline.
Distillate and gasoline demand
Since middle distillates are a key substitute for HSFO, we believe they will benefit from a step-up in demand from late 2019 and early 2020. More broadly, emerging economies, especially China and India, will likely continue to drive global gasoline demand growth, as well as for other oil products. In contrast, beyond IMO 2020 impacts, demand from the Organization for Economic Cooperation and Development (OECD) members is likely to be flattish in 2020 given ongoing efficiencies and our base-case view that global and OECD GDP growth will continue, albeit at a slowing rate. The U.S. will likely see steady demand for gasoline and distillates, but a decelerating economy could dampen domestic growth. Most U.S. Gulf Coast refiners will continue to have the flexibility to export product, mainly to Latin America.
Key risks and opportunities
1. IMO 2020
The upcoming rollout of new IMO regulations has engendered significant uncertainty: The implications for marine fuel product demand patterns; the flexibility of refiners and traders to produce and supply necessary volumes; and the consequences for pricing.
2. A sharp downturn in the global economy in 2020
A significant deviation from our base-case view of global GDP growth would be likely to affect our assumptions for oil product demand.
3. Increased global refining capacity
The trend of high refinery utilization of recent years in North America and Europe could change as competing capacity continues to ramp up in 2020.
IMO 2020
The upcoming rollout of new IMO regulations has engendered significant uncertainty: The implications for marine fuel product demand patterns particularly in early 2020; the flexibility of refiners and traders to produce and supply the necessary volumes of these products; and the consequences for pricing of both products and different crude feedstock grades. Heavier crudes tend to have a higher sulfur content and yield a higher proportion of HSFO through the refining process. Some of the highest sulfur-content crudes (like those from Canadian producers that produce the heavy bitumen Western Canadian Select [WCS], and Mexico's Maya, as well as grades from Middle Eastern producers) will see some of the widest discounts given their high sulfur content and heavy gravity. There are risks that at times over last weeks of 2019 and in 2020, some refiners misjudge the short-term demand and trade flows for products in particular. This could hinder actual performance, for example compared with indicative regional benchmarks.
A sharp downturn in the global economy in 2020
A significant deviation from our base-case view of global GDP growth would be likely to affect our assumptions for oil product demand. Crude and product prices in local currencies also have a bearing on demand. However, S&P Global Platts, a division of S&P Global, as is S&P Global Ratings, has noted from historical correlations that shifts in GDP
Industry Top Trends 2020: Oil and Gas
S&P Global Ratings November 20, 2019 11
growth can have a more material impact. A more severe downward revision in demand expectations, due to tariffs and trade wars, for example, even if accompanied by a downward move in crude prices, could have an adverse impact on refining margins, especially if capacity continues to increase and utilization levels decline.
Increased global refining capacity
We note that global net refining capacity additions in 2019 of above 2MMbbl/d have been the greatest since 2009, according to the IEA and S&P Global Platts. These were mostly in non-OECD countries, half in China, and most of the rest in Saudi Arabia, Brunei, and Malaysia. Some of this capacity in Asia is focused on petrochemicals, a key driver of oil demand outside transport. Nonetheless, the trend of high refinery utilization of recent years in North America and Europe (with declines in Latin America and Africa) could change as competing capacity continues to ramp up in 2020. Or, margins could come under some pressure.
Related Research – European Gas Producers: Do Lower Gas Prices Mean Lower Ratings?, Oct. 28, 2019 – IMO 2020: The Coming Storm, Oct. 7, 2019 – S&P Global Ratings Lowered Its Henry Hub Natural Gas Price Assumption For The Rest
Of 2019 And For 2020, 2021; Long-Term U.S. Natural Gas, Canadian AECO, And Crude Oil Price Assumptions Unchanged, July 30, 2019
– ESG Industry Report Card: Oil And Gas, June 3, 2019 – Reports Rank Global Oil And Gas Companies' Relative Risks, May 15, 2019
This report does not constitute a rating action.
Industry Top Trends 2020: Oil and Gas
S&P Global Ratings November 20, 2019 12
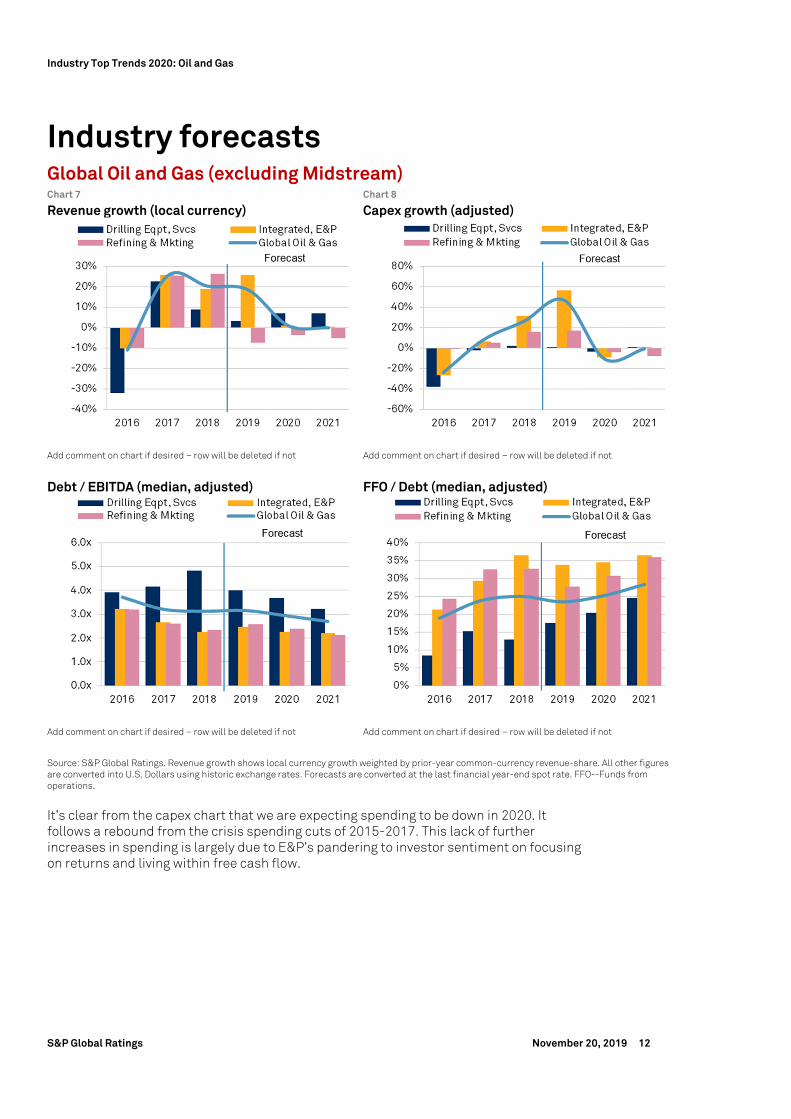
Industry forecasts Global Oil and Gas (excluding Midstream) Chart 7 Chart 8
Revenue growth (local currency) Capex growth (adjusted)
Add comment on chart if desired – row will be deleted if not Add comment on chart if desired – row will be deleted if not
Debt / EBITDA (median, adjusted) FFO / Debt (median, adjusted)
Add comment on chart if desired – row will be deleted if not Add comment on chart if desired – row will be deleted if not
Source: S&P Global Ratings. Revenue growth shows local currency growth weighted by prior-year common-currency revenue-share. All other figures are converted into U.S. Dollars using historic exchange rates. Forecasts are converted at the last financial year-end spot rate. FFO--Funds from operations.
It’s clear from the capex chart that we are expecting spending to be down in 2020. It follows a rebound from the crisis spending cuts of 2015-2017. This lack of further increases in spending is largely due to E&P’s pandering to investor sentiment on focusing on returns and living within free cash flow.

Industry Top Trends 2020: Oil and Gas
S&P Global Ratings November 20, 2019 13
Cash, debt, and returns Global Oil and Gas Chart 9 Chart 10
Cash flow and primary uses Return on capital employed
Chart 11 Chart 12
Fixed versus variable rate exposure Long term debt term structure
Chart 13 Chart 14
Cash and equivalents / Total assets Total debt / Total assets
Source: S&P Global Market Intelligence, S&P Global Ratings calculations
-200
0
200
400
600
800
1,000
1,200
2007 2009 2011 2013 2015 2017 LTM
$ Bn
Capex Dividends
Net Acquisitions Share Buybacks
Operating CF
0
2
4
6
8
10
12
14
16
2007 2009 2011 2013 2015 2017 LTM
Global Oil & Gas - Return On Capital (%)
0
1
2
3
4
5
6
7
8
9
2007 2009 2011 2013 2015 2017 LTM
Global Oil & Gas - Cash & Equivalents/Total Assets(%)
0
5
10
15
20
25
30
2007 2009 2011 2013 2015 2017 LTM
Global Oil & Gas - Total Debt / Total Assets (%)

No content (including ratings, credit-related analyses and data, valuations, model, software or other application or output therefrom) or any part thereof (Content) may be modified, reverse engineered, reproduced or distributed in any form by any means, or stored in a database or retrieval system, without the prior written permission of Standard & Poor’s Financial Services LLC or its affiliates (collectively, S&P). The Content shall not be used for any unlawful or unauthorized purposes. S&P and any third-party providers, as well as their directors, officers, shareholders, employees or agents (collectively S&P Parties) do not guarantee the accuracy, completeness, timeliness or availability of the Content. S&P Parties are not responsible for any errors or omissions (negligent or otherwise), regardless of the cause, for the results obtained from the use of the Content, or for the security or maintenance of any data input by the user. The Content is provided on an “as is” basis. S&P PARTIES DISCLAIM ANY AND ALL EXPRESS OR IMPLIED WARRANTIES, INCLUDING, BUT NOT LIMITED TO, ANY WARRANTIES OF MERCHANTABILITY OR FITNESS FOR A PARTICULAR PURPOSE OR USE, FREEDOM FROM BUGS, SOFTWARE ERRORS OR DEFECTS, THAT THE CONTENT’S FUNCTIONING WILL BE UNINTERRUPTED, OR THAT THE CONTENT WILL OPERATE WITH ANY SOFTWARE OR HARDWARE CONFIGURATION. In no event shall S&P Parties be liable to any party for any direct, indirect, incidental, exemplary, compensatory, punitive, special or consequential damages, costs, expenses, legal fees, or losses (including, without limitation, lost income or lost profits and opportunity costs or losses caused by negligence) in connection with any use of the Content even if advised of the possibility of such damages. Credit-related and other analyses, including ratings, and statements in the Content are statements of opinion as of the date they are expressed and not statements of fact. S&P’s opinions, analyses, and rating acknowledgment decisions (described below) are not recommendations to purchase, hold, or sell any securities or to make any investment decisions, and do not address the suitability of any security. S&P assumes no obligation to update the Content following publication in any form or format. The Content should not be relied on and is not a substitute for the skill, judgment and experience of the user, its management, employees, advisors and/or clients when making investment and other business decisions. S&P does not act as a fiduciary or an investment advisor except where registered as such. While S&P has obtained information from sources it believes to be reliable, S&P does not perform an audit and undertakes no duty of due diligence or independent verification of any information it receives. To the extent that regulatory authorities allow a rating agency to acknowledge in one jurisdiction a rating issued in another jurisdiction for certain regulatory purposes, S&P reserves the right to assign, withdraw, or suspend such acknowledgement at any time and in its sole discretion. S&P Parties disclaim any duty whatsoever arising out of the assignment, withdrawal, or suspension of an acknowledgment as well as any liability for any damage alleged to have been suffered on account thereof. S&P keeps certain activities of its business units separate from each other in order to preserve the independence and objectivity of their respective activities. As a result, certain business units of S&P may have information that is not available to other S&P business units. S&P has established policies and procedures to maintain the confidentiality of certain nonpublic information received in connection with each analytical process. S&P may receive compensation for its ratings and certain analyses, normally from issuers or underwriters of securities or from obligors. S&P reserves the right to disseminate its opinions and analyses. S&P’s public ratings and analyses are made available on its Web sites, www.standardandpoors.com (free of charge), and www.ratingsdirect.com and www.globalcreditportal.com (subscription) and www.spcapitaliq.com (subscription) and may be distributed through other means, including via S&P publications and third-party redistributors. Additional information about our ratings fees is available at Copyright © 2019 by Standard & Poor’s Financial Services LLC. All rights reserved. STANDARD & POOR'S, S&P and RATINGSDIRECT are registered trademarks of Standard & Poor's Financial Services LLC.
spglobal.com/ratings