Industry Progress Report: ENVIRONMENT,...
16
ENVIRONMENT, ENERGY & SAFETY Industry Progress Report:
Transcript of Industry Progress Report: ENVIRONMENT,...

ENVIRONMENT,ENERGY & SAFETY
Industry Progress Report:


INTRODUCTION The American Wood Council (AWC) is the voice of North American wood prod-ucts manufacturing, representing over 75 percent of an industry that provides approximately 400,000 men and women with family-wage jobs. AWC members make products that are essential to everyday life from a renewable resource that absorbs and sequesters carbon.
On behalf of the industry it represents, AWC is committed to ensuring a dura-ble, safe, and sustainably built environment. To achieve these objectives, AWC contributes to the development of sound public policies, codes, and regulations which allow for the appropriate and responsible manufacture and use of wood products. We support the utilization of wood products by developing and dis-seminating consensus standards, comprehensive technical guidelines, and tools for wood design and construction, as well as providing education regarding their application.
AWC members are very proud of their energy management and efficiency, re-cord of mill safety, and protection of the environment while producing products that are central to the lives and homes of all Americans.
As part of this commitment, the industry has been publicly reporting its per-formance across a number of environment, energy and safety measures. This Industry Progress Report, our second, shows that there have been significant im-provements over the last decade in the areas of environment, energy and safety, despite the economic downturn that caused a drop in wood products manufac-turing in 2009. The Report also provides some economic and employment data for the last decade.
In reviewing our progress, it is important to note that many factors influence individual parameters so looking at longer term trends rather than focusing on changes between years is encouraged.

KEY FINDINGSn The broad forest products industry is the
largest producer and user of bioenergy of any industrial sector. AWC member compa-nies have met over 75 percent of their energy needs, on average, from biomass over the last decade.
n Using biomass from manufacturing residuals displaces fossil fuel use and is a carbon-neu-tral, renewable fuel source.
n The 10-year trend has shown significant re-ductions in chemical releases, which includes formaldehyde and methanol.
n Energy intensity has improved significantly since the 2008-09 recession and has dropped slightly below pre-recession levels.
n Worker safety has improved between 2004 and 2014 for member companies, and the two reported safety metrics are consistently lower than all manufacturing during the same period.
ENVIRONMENTAL PROFILEChemical Releases Formaldehyde - Formaldehyde emissions intensity of reporting AWC members, expressed in pounds per thousand cubic feet of products produced, has been declining continuously since 2006. The emissions intensity for 2014 is 57 percent lower than that for 2006. The significant declines are likely due to a combination of required state and federal air pollution controls and product reformulation efforts to reduce formaldehyde in resins. The leveling off of emissions in 2014 is indicative of AWC members’ having met these regulatory obligations and main-taining strict compliance.
CHART 1: Formaldehyde Release Intensity
Methanol - Methanol emissions intensity, expressed in pounds per thousand cubic feet of wood products produced of AWC member companies, remained essentially flat during 2003-2008. Subsequently, the intensity has declined from 4.2 pounds/MCF in 2008 to 2.8 pounds/MCF in 2014, a reduction of 34 percent.
0
1
2
3
4Pounds per 1,000 Cubic feet of production
201420122010200820062003Source: EPA (for facilities reporting to AWC/AF&PA Surveys)
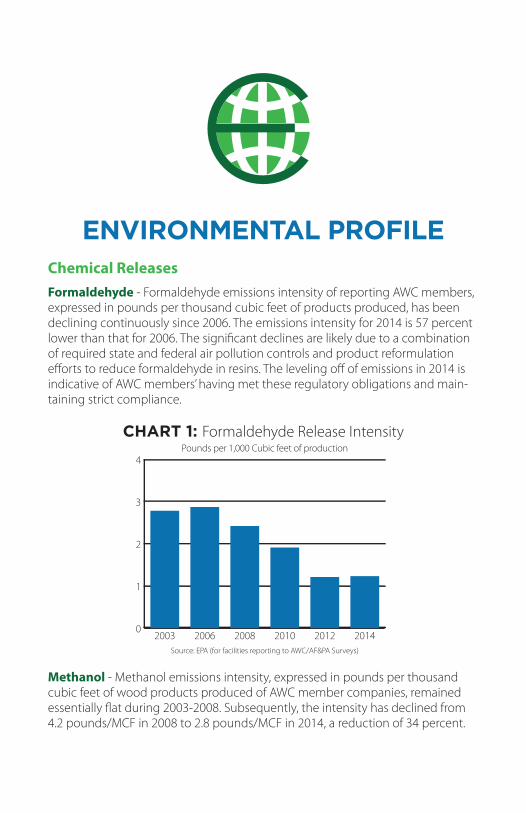
Improvements in methanol emissions are likely associated with clean air require-ments to capture and destroy methanol from various presses, dryers and other process equipment that went into effect in 2008.
CHART 2: Methanol Release Intensity
Toxic Release Inventory - The following chart tracks total Toxic Release Inven-tory (TRI) releases per thousand cubic feet of wood products production for AWC member companies that reported to the AWC survey. These data, as well as the formaldehyde and methanol emissions data, were obtained from EPA’s TRI database.
Total TRI releases intensity has been trending downward since 2003. Between 2003 and 2014, the intensity decreased 40 percent.
CHART 3: Total TRI Release Intensity
0
1
2
3
4
5Pounds per 1,000 Cubic feet of production
201420122010200820062003Source: EPA (for facilities reporting to AWC/AF&PA Surveys)
0
2
4
6
8Pounds per 1,000 Cubic feet of production
201420122010200820062003Source: EPA (for facilities reporting to AWC/AF&PA Surveys)
LIFE CYCLE PERFORMANCE
Wood is the perfect green building material be-cause it is renewable, stores carbon that reduces greenhouse gases, and is energy efficient. This is why it’s important to tell the positive story of wood’s advantages, especially in comparison to alternative building materials.
The North American wood products industry is committed to sustainability in its products and their use. In support of this commitment, and as a way to stimulate product improvement, the industry undertook to prepare and pub-lish third-party verified Environmental Product Declarations (EPDs) and Transparency Briefs that capture and describe the environmental perfor-mance of many of the products that we produce.
As noted, all North American wood industry EPDs have been independently third-party veri-fied by UL Environment (ULE), a business unit of Underwriters Laboratories. ULE verifies that EPDs conform to the requirements of ISO 14025, the global standard governing EPDs. ULE’s review looks at both the underlying life-cycle assess-ments as well as the data reported in the EPDs.
In 2016, EPDs for cellulosic fiberboard and lam-inated strand lumber (LSL) have been added to the inventory, bringing the total available EPDs to 12.
EPDs for the wood products industry can be found at awc.org/greenbuilding/epd.
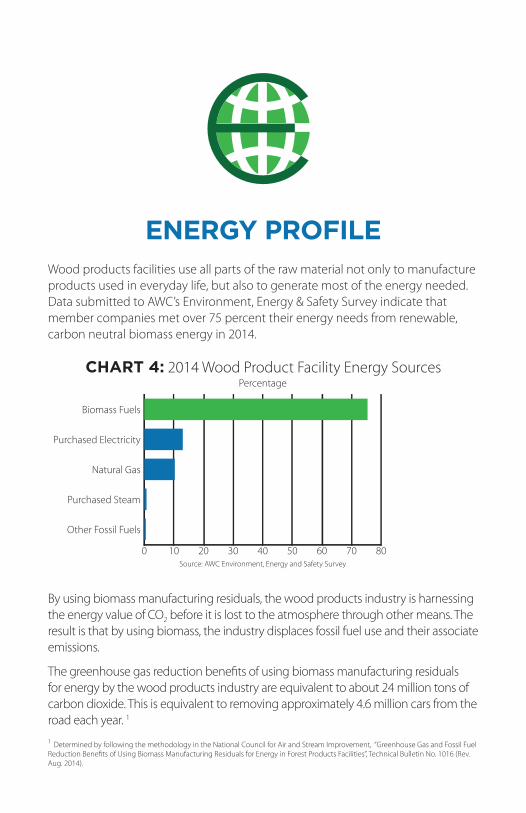
ENERGY PROFILEWood products facilities use all parts of the raw material not only to manufacture products used in everyday life, but also to generate most of the energy needed. Data submitted to AWC’s Environment, Energy & Safety Survey indicate that member companies met over 75 percent their energy needs from renewable, carbon neutral biomass energy in 2014.
CHART 4: 2014 Wood Product Facility Energy Sources
By using biomass manufacturing residuals, the wood products industry is harnessing the energy value of CO2 before it is lost to the atmosphere through other means. The result is that by using biomass, the industry displaces fossil fuel use and their associate emissions.
The greenhouse gas reduction benefits of using biomass manufacturing residuals for energy by the wood products industry are equivalent to about 24 million tons of carbon dioxide. This is equivalent to removing approximately 4.6 million cars from the road each year. 1
1 Determined by following the methodology in the National Council for Air and Stream Improvement, “Greenhouse Gas and Fossil Fuel Reduction Benefits of Using Biomass Manufacturing Residuals for Energy in Forest Products Facilities”, Technical Bulletin No. 1016 (Rev. Aug. 2014).
0 10 20 30 40 50 60 70 80
Percentage
Other Fossil Fuels
Purchased Steam
Natural Gas
Purchased Electricity
Biomass Fuels
Source: AWC Environment, Energy and Safety Survey
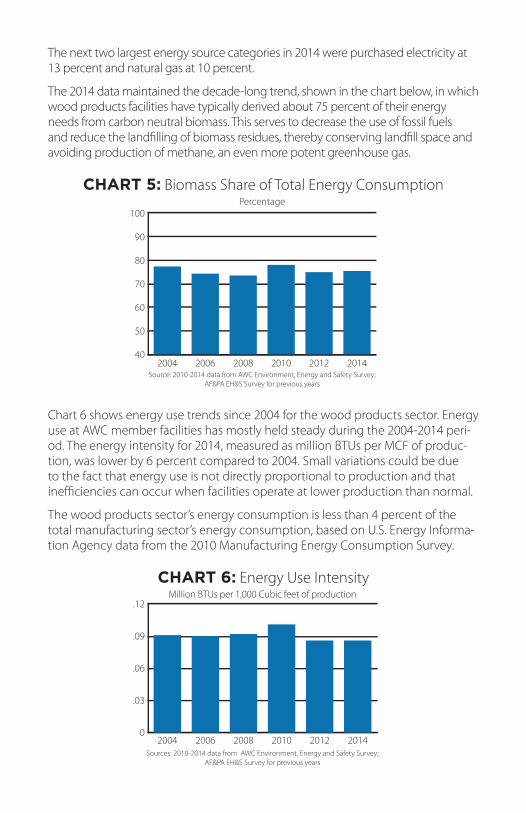
The next two largest energy source categories in 2014 were purchased electricity at 13 percent and natural gas at 10 percent.
The 2014 data maintained the decade-long trend, shown in the chart below, in which wood products facilities have typically derived about 75 percent of their energy needs from carbon neutral biomass. This serves to decrease the use of fossil fuels and reduce the landfilling of biomass residues, thereby conserving landfill space and avoiding production of methane, an even more potent greenhouse gas.
CHART 5: Biomass Share of Total Energy Consumption
Chart 6 shows energy use trends since 2004 for the wood products sector. Energy use at AWC member facilities has mostly held steady during the 2004-2014 peri-od. The energy intensity for 2014, measured as million BTUs per MCF of produc-tion, was lower by 6 percent compared to 2004. Small variations could be due to the fact that energy use is not directly proportional to production and that inefficiencies can occur when facilities operate at lower production than normal.
The wood products sector’s energy consumption is less than 4 percent of the total manufacturing sector’s energy consumption, based on U.S. Energy Informa-tion Agency data from the 2010 Manufacturing Energy Consumption Survey.
CHART 6: Energy Use Intensity
0
.03
.06
.09
.12Million BTUs per 1,000 Cubic feet of production
201420122010200820062004Sources: 2010-2014 data from AWC Environment, Energy and Safety Survey;
AF&PA EH&S Survey for previous years
40
50
60
70
80
90
100Percentage
201420122010200820062004Source: 2010-2014 data from AWC Environment, Energy and Safety Survey;
AF&PA EH&S Survey for previous years

SAFETY PROFILEOver the last decade, safety at member wood products manufacturing mills as reported by OSHA recordable cases has improved by almost 20 percent. The OSHA recordable case rate dropped from 3.4 in 2004 to 2.8 in 2014. This is calcu-lated as the number of recordable cases per 100 full time employees working 40 hours a week and 50 weeks in a year.
While still an improvement from the high in 2004, the incidence rate has been slowly rising since 2008. The rate for 2014 is about 40 percent more than that of 2008.
CHART 7: OSHA Recordable Case Rate Comparison
Data reported by AWC members indicates a 2014 incidence rate of 2.8. This is lower than the 4.0 rate for all manufacturing and 6.8 for all wood products manu-facturing as reported by the Bureau of Labor Statistics (BLS).
0
2
4
6
8
10
12
All Manufacturing
All Wood Product FacilitiesAWC Reporters
201420122010200820062004Sources: 2010-2014 data from AWC Environment, Energy and Safety Survey;
AF&PA EH&S Survey for previous years; U.S. Department of Labor
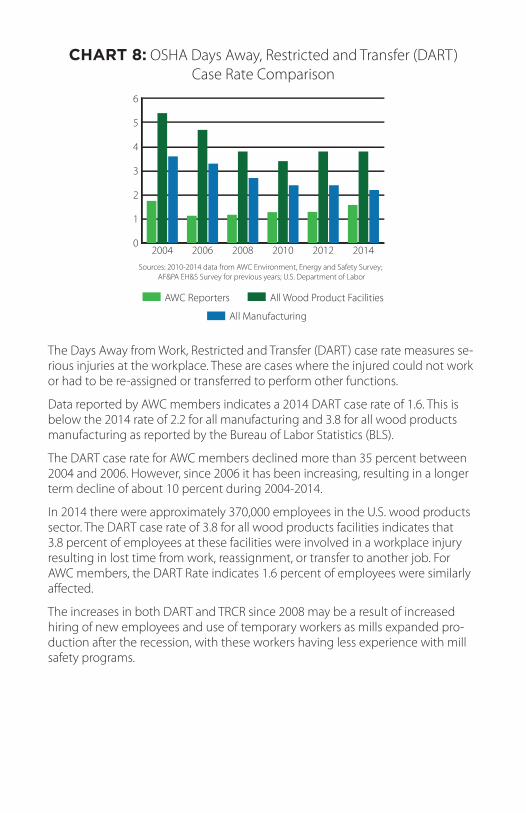
CHART 8: OSHA Days Away, Restricted and Transfer (DART) Case Rate Comparison
The Days Away from Work, Restricted and Transfer (DART) case rate measures se-rious injuries at the workplace. These are cases where the injured could not work or had to be re-assigned or transferred to perform other functions.
Data reported by AWC members indicates a 2014 DART case rate of 1.6. This is below the 2014 rate of 2.2 for all manufacturing and 3.8 for all wood products manufacturing as reported by the Bureau of Labor Statistics (BLS).
The DART case rate for AWC members declined more than 35 percent between 2004 and 2006. However, since 2006 it has been increasing, resulting in a longer term decline of about 10 percent during 2004-2014.
In 2014 there were approximately 370,000 employees in the U.S. wood products sector. The DART case rate of 3.8 for all wood products facilities indicates that 3.8 percent of employees at these facilities were involved in a workplace injury resulting in lost time from work, reassignment, or transfer to another job. For AWC members, the DART Rate indicates 1.6 percent of employees were similarly affected.
The increases in both DART and TRCR since 2008 may be a result of increased hiring of new employees and use of temporary workers as mills expanded pro-duction after the recession, with these workers having less experience with mill safety programs.
0
1
2
3
4
5
6
All Manufacturing
All Wood Product FacilitiesAWC Reporters
201420122010200820062004Sources: 2010-2014 data from AWC Environment, Energy and Safety Survey;
AF&PA EH&S Survey for previous years; U.S. Department of Labor
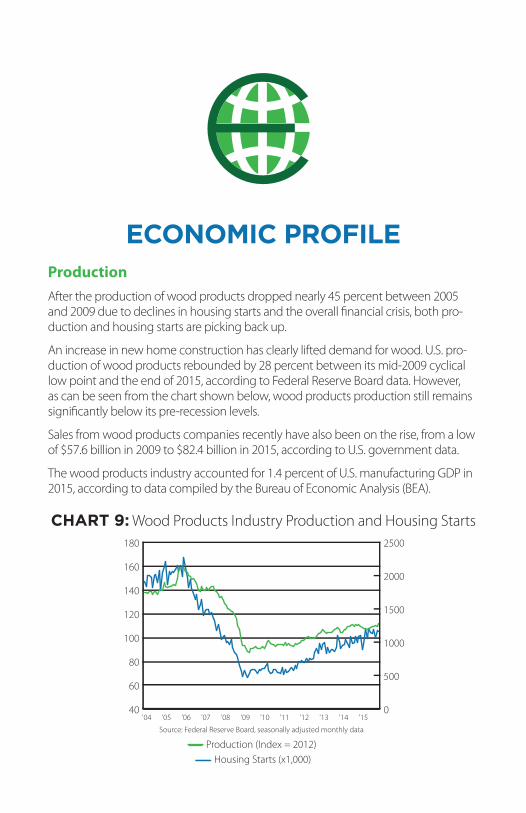
ECONOMIC PROFILEProductionAfter the production of wood products dropped nearly 45 percent between 2005 and 2009 due to declines in housing starts and the overall financial crisis, both pro-duction and housing starts are picking back up.
An increase in new home construction has clearly lifted demand for wood. U.S. pro-duction of wood products rebounded by 28 percent between its mid-2009 cyclical low point and the end of 2015, according to Federal Reserve Board data. However, as can be seen from the chart shown below, wood products production still remains significantly below its pre-recession levels.
Sales from wood products companies recently have also been on the rise, from a low of $57.6 billion in 2009 to $82.4 billion in 2015, according to U.S. government data.
The wood products industry accounted for 1.4 percent of U.S. manufacturing GDP in 2015, according to data compiled by the Bureau of Economic Analysis (BEA).
CHART 9: Wood Products Industry Production and Housing Starts
Source: Federal Reserve Board, seasonally adjusted monthly data
0
500
1000
1500
2000
2500
40
60
80
100
120
140
160
180
'15'14'13'12'11'10'09'08'07'06'05'04
Production (Index = 2012)Housing Starts (x1,000)

Capital SpendingAs shown in Chart 10, the wood products industry spent nearly $4.0 billion on capital improvements in 2014. That level of spending is nearly 2.5 times the reces-sion-period spending low of $1.6 billion in 2009. Only $0.7 billion of the industry’s 2014 capital expenditures went for structures, while $3.3 billion was used for equipment.
CHART 10: Wood Products Industry Capital Spending
EmploymentAccording to U.S. Bureau of Labor Statistics data, wood products employment bottomed out at 337,100 workers in 2011 and has been trending higher during recent years as housing starts and industry production recover. Wood prod-ucts industry employment rose 5.6 percent in 2014 and 2.2 percent in 2015, to 379,800.
CHART 11: Wood Products Industry Employment
0
1
2
3
4
5Billion Dollars
20142013201220112010200920082007Source: Annual Capital Expenditures Survey, U.S. Census Bureau
100
200
300
400
500
600x 1,000 Workers
201520142013201220112010200920082007200620052004
Source: Bureau of Labor Statistics
Almond Bros. LumberAnthony Forest ProductsBoise CascadeCanadian Wood CouncilCanfor USA/New SouthCharles Ingram LumberCollins CompaniesCollum’s LumberColumbia VistaDeltic TimberGeorgia-PacificGilman Building ProductsGreen Bay PackagingHampton ResourcesHancock LumberHarrigan LumberHigh Cascade/WKOHood IndustriesHuber Engineered WoodsHull-Oakes LumberHumboldt Redwood CompanyH.W. Culp LumberIdaho Forest GroupIdaho TimberInterfor U.S. Inc.Interstate Resources
Jordan Lumber & SupplyKapstone Paper & PackagingLampe & MalphrusLPMasoniteMcShan LumberMendocino Forest ProductsMt. Hood Forest ProductsNorbordNordic StructuresPotlatchRex/North FloridaRobbins LumberRoseburg Forest ProductsScotch Gulf LumberSeneca Sawmill CompanyShuqualak LumberSierra PacificStimson LumberSwift LumberT.R. Miller Mill CompanyVaagen BrothersWest FraserWesterveltWestRockWeyerhaeuser
2016 AWC MEMBERS
METHODOLOGYThe American Wood Council (AWC) is both one of the youngest and one of the oldest major trade groups in the nation, having had its start in 1902. AWC was re-chartered in June 2010, evolving from a number of predecessor groups. Before that the wood products industry was represent-ed on these issues by the American Forest & Paper Association (AF&PA).
AWC Member Data for 2010, 2012 and 2014 are from the survey responses to AWC’s Environ-ment, Energy and Safety Survey. For prior years, the data is from a similar survey conducted by AF&PA for its members with wood products operations.
Note that survey responses are collected in the following year and the sample set of respon-dents varies from one survey year to another.
When data is used from other sources, such as from the Environmental Protection Agency (EPA), it has been otherwise noted in the document.

222 Catoctin Circle SE | Suite 201 | Leesburg, VA 201751101 K Street NW | Suite 700 | Washington, DC 20005
Phone: (202) 463-2766 | Fax: (202) 463-2791www.awc.org
December 2016 (detailing data up to 2014)