Industry and M&A Update - Sheshunoff Consulting and M&A Update. CEO Affiliation. Fall 2010....
47
Industry and M&A Update CEO Affiliation Fall 2010 Sheshunoff & Co Investment Banking Curtis Carpenter Sheshunoff &Co. Investment Banking
Transcript of Industry and M&A Update - Sheshunoff Consulting and M&A Update. CEO Affiliation. Fall 2010....

Industry and M&A Update
CEO AffiliationFall 2010
Sheshunoff & Co Investment Banking
Curtis CarpenterSheshunoff &Co. Investment Banking

I. The Industry Landscape Today
II. Merger Activity and What it Means
IV. What is Next?
Session Outline

I.The Industry Landscape Today

Asset Distribution
June 30, 2010 Data Consolidated by HCExcludes any bank larger than $1 billion in assets with a deposits to assets ratio of less than 10%
$0
$1
$2
$3
$4
$5
$6
$7
$8
$9
JPMorgan Chase & Co.
$2.01 Trillion
Bank of America$2.36 Trillion
Citigroup$1.94 Trillion
$7.5 Trillion (54%)
Top 4 Banks
Asset Size
$100MM - $1B
$0 - $100MM
430 Institutions -$1.11 Trillion
3,391 Institutions $1.00 Trillion
2,322 Institutions $130 Billion
$2.2 Trillion (16%)
$1B - $10B
67 Institutions -$4.2 Trillion
Banks > $10B
$ 4.2 Trillion (30%)
$ Tr
illio
ns
Wells Fargo$1.23 Trillion
Total Industry Assets = $14.0 Trillion
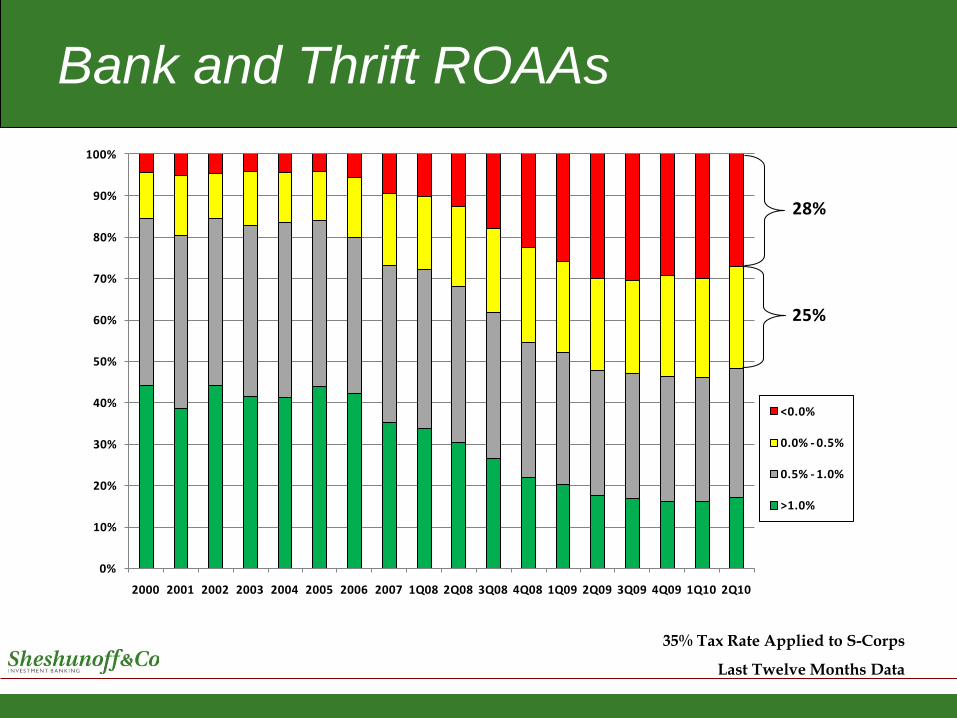
Bank and Thrift ROAAs
35% Tax Rate Applied to S-Corps
Last Twelve Months Data
0%
10%
20%
30%
40%
50%
60%
70%
80%
90%
100%
2000 2001 2002 2003 2004 2005 2006 2007 1Q08 2Q08 3Q08 4Q08 1Q09 2Q09 3Q09 4Q09 1Q10 2Q10
<0.0%
0.0% - 0.5%
0.5% - 1.0%
>1.0%
28%
25%
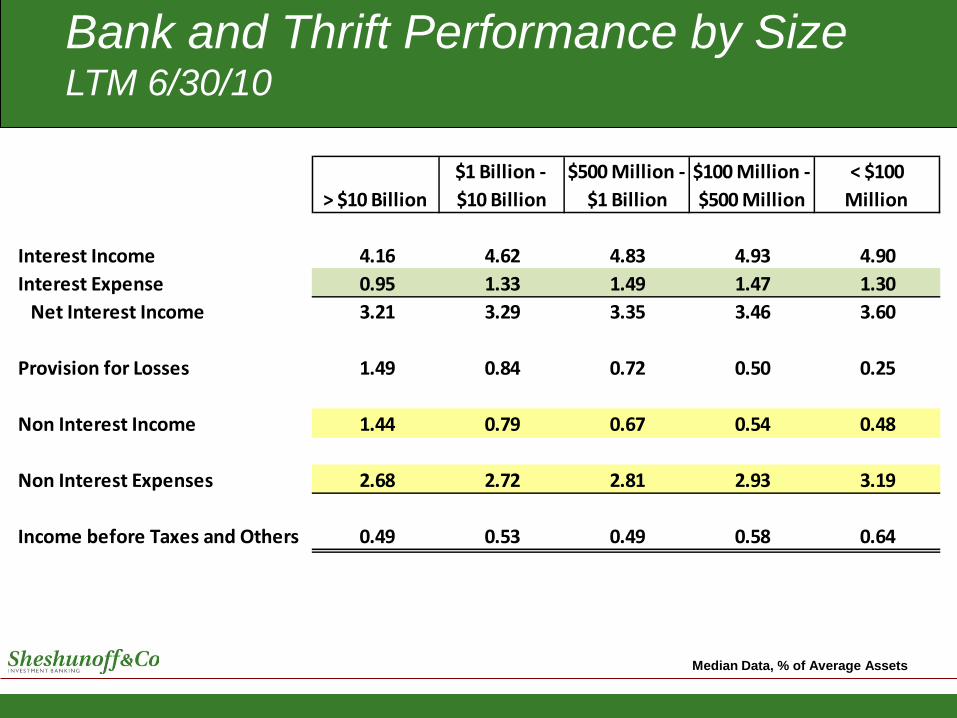
> $10 Billion$1 Billion - $10 Billion
$500 Million - $1 Billion
$100 Million - $500 Million
< $100 Million
Interest Income 4.16 4.62 4.83 4.93 4.90 Interest Expense 0.95 1.33 1.49 1.47 1.30 Net Interest Income 3.21 3.29 3.35 3.46 3.60
Provision for Losses 1.49 0.84 0.72 0.50 0.25
Non Interest Income 1.44 0.79 0.67 0.54 0.48
Non Interest Expenses 2.68 2.72 2.81 2.93 3.19
Income before Taxes and Others 0.49 0.53 0.49 0.58 0.64
Bank and Thrift Performance by Size LTM 6/30/10
Median Data, % of Average Assets

Cost of Deposits by Quarter
0.50
1.00
1.50
2.00
2.50
3.00
3.50
> $10B $1B - $10B $500MM - $1B $100MM -$500MM
$0 - $100MM
Cost of Interest Bearing Deposits by Size
2008Q3 2008Q4 2009Q1 2009Q2 2009Q3 2009Q4 2010Q1 2010Q2

> $10 Billion$1 Billion - $10 Billion
$500 Million - $1 Billion
$100 Million - $500 Million
< $100 Million
Non Interest Income 1.44 0.79 0.67 0.54 0.48 Non Interest Expenses 2.68 2.72 2.81 2.93 3.19
Net Noninterest Expense 1.24 1.92 2.14 2.38 2.71
Net Noninterest Expense by SizeLTM 6/30/10
Median Data, % of Average Assets

0.00
0.50
1.00
1.50
2.00
2.50
3.00
> $10 Billion $1 Billion -$10 Billion
$500 Million - $1
Billion
$100 Million -
$500 Million
< $100 Million
Net Noninterest Expense by SizeLTM 6/30/10
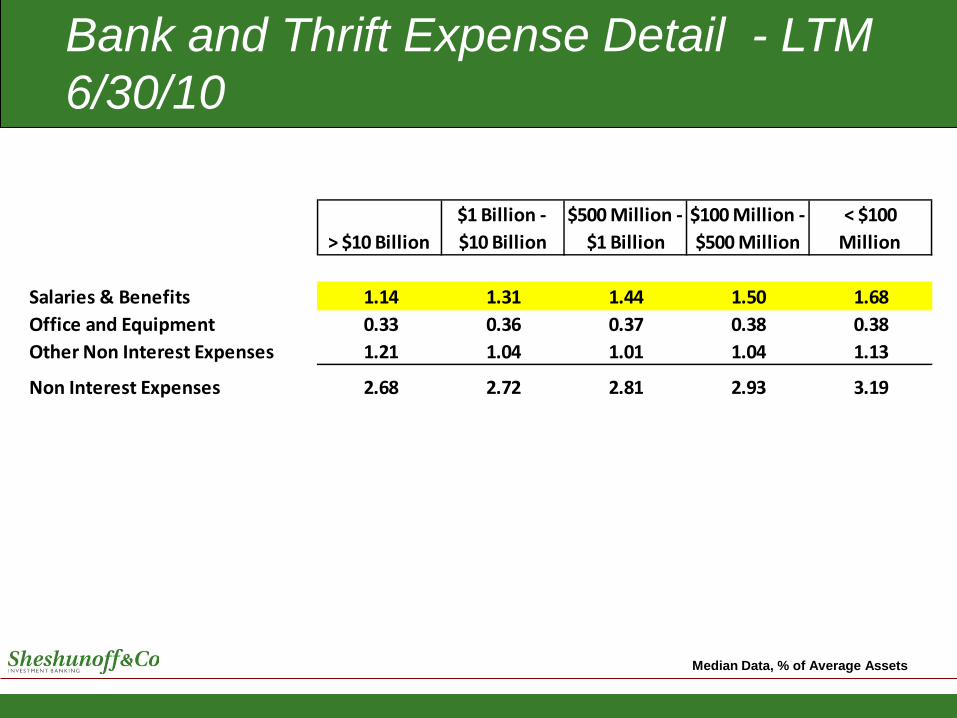
Bank and Thrift Expense Detail - LTM 6/30/10
Median Data, % of Average Assets
> $10 Billion$1 Billion - $10 Billion
$500 Million - $1 Billion
$100 Million - $500 Million
< $100 Million
Salaries & Benefits 1.14 1.31 1.44 1.50 1.68 Office and Equipment 0.33 0.36 0.37 0.38 0.38 Other Non Interest Expenses 1.21 1.04 1.01 1.04 1.13
Non Interest Expenses 2.68 2.72 2.81 2.93 3.19
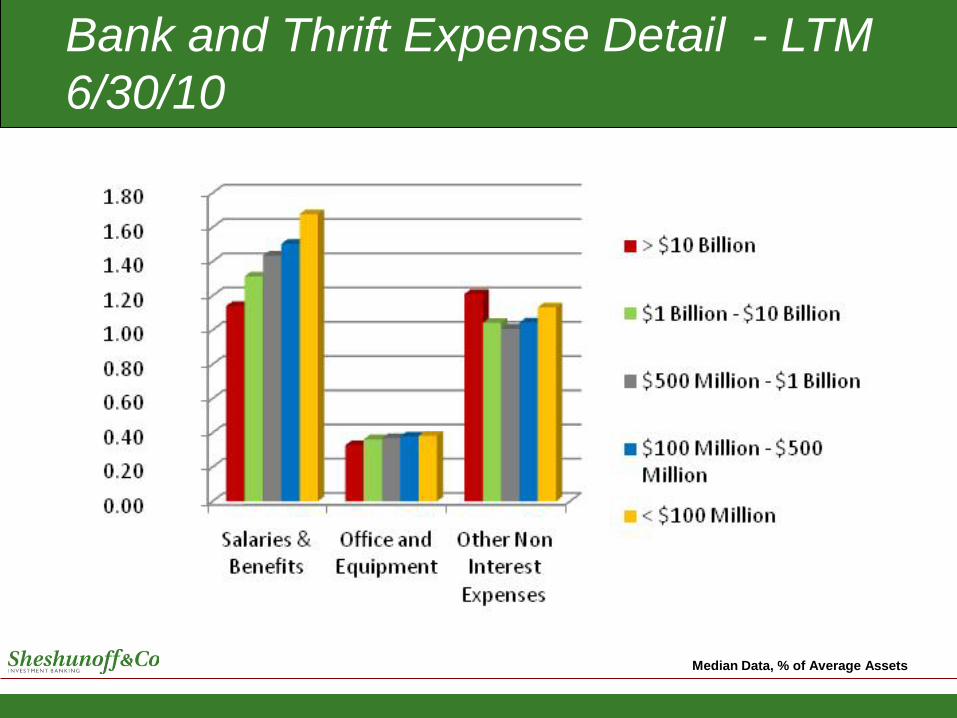
Bank and Thrift Expense Detail - LTM 6/30/10
Median Data, % of Average Assets
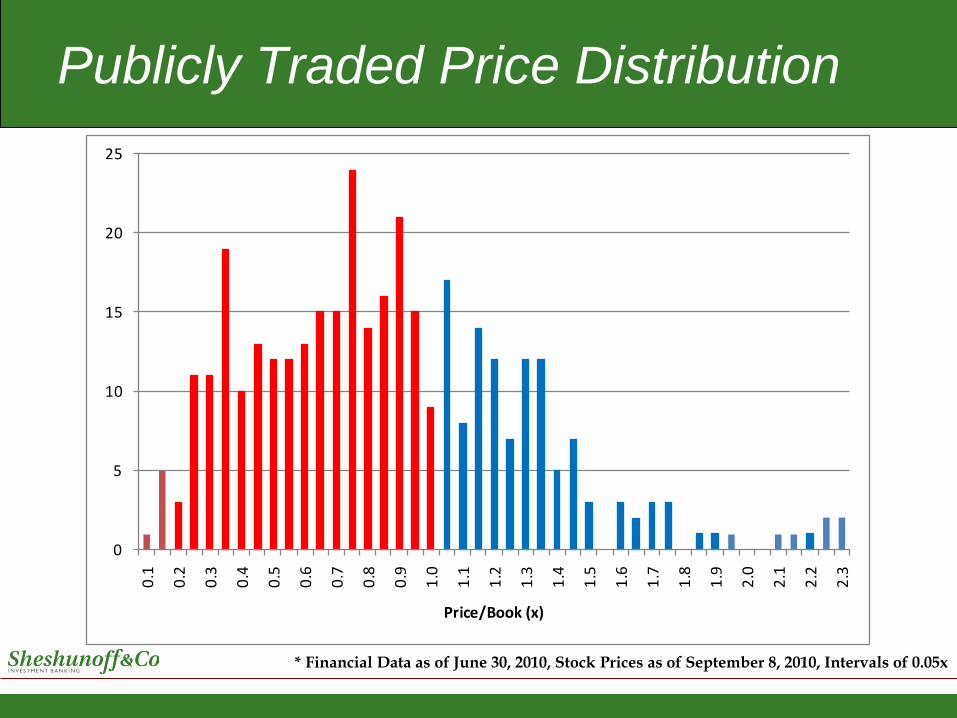
Publicly Traded Price Distribution
* Financial Data as of June 30, 2010, Stock Prices as of September 8, 2010, Intervals of 0.05x
0
5
10
15
20
250.
1
0.2
0.3
0.4
0.5
0.6
0.7
0.8
0.9
1.0
1.1
1.2
1.3
1.4
1.5
1.6
1.7
1.8
1.9
2.0
2.1
2.2
2.3
Price/Book (x)

Publicly Traded Banks and Thrifts>2B and < $100B in Assets
Price to Tangible Book as of September 9, 2010
11
101
39
140
20
40
60
80
100
120
> 2.0x >1.0x < 2.0x >0.5x < 1.0x < 0.5x

Comparison of Median ROA, NPA’s and Dividend Yield
Price to Tangible Book
Publicly Traded Banks and Thrifts>2B and < $100B in Assets
As of September 9, 2010
1.34%0.59%
-0.48%
-2.23%
0.93%
1.87%
3.72%
9.72%
3.50%
2.52%
0.39%0.00%
-4.00%
-2.00%
0.00%
2.00%
4.00%
6.00%
8.00%
10.00%
12.00%
> 2.0x >1.0x < 2.0x >0.5x < 1.0x < 0.5x
ROAANPA'sDividend

Publicly Traded Banks and ThriftsPrice-to-Tangible Book > 2.0x
As of September 9, 2010

Bank and Thrift NPAs / Assets
0%
10%
20%
30%
40%
50%
60%
70%
80%
90%
100%
2001 2002 2003 2004 2005 2006 2007 1Q08 2Q08 3Q08 4Q08 1Q09 2Q09 3Q09 4Q09 1Q10 2Q10
> 4.0%
2.0% - 4.0%
1.0% - 2.0%
0.5% - 1.0%
< 0.5%

Non-Performing Assets / AssetsNumber of Banks and Thrifts
1,755
700840
1,767
753
1,034
1,763
794
1,123
1,809
790
1,183
1,767
868
1,169
0
200
400
600
800
1,000
1,200
1,400
1,600
1,800
2,000
2% - 4% 4% - 6% > 6%
2009Q2 2009Q3 2009Q4 2010Q1 2010Q2

Texas Ratio Definition
Texas Ratio = Loans 90+ Days Past Due + Non Accrual Loans + OREO
Tangible Equity + Loan Loss Reserves

Texas Ratio – Quarterly Trend
0
100
200
300
400
500
600
700
50% - 75% 75% - 100% 100% - 150% 150% - 200% >200%
Texas Ratio Breakdown by Number of Institutions
2009Q1 2009Q2 2009Q3 2009Q4 2010Q1 2010Q2

Institutions With Texas Ratio Above 200%
11
June 30, 2010 Data
114
63
1
19
43
113
2
2
1
2
33
33
13
1
1
1
1
11
1 1
5
1

Institutions With Texas Ratio 100%-200%States with more than three institutions
3
June 30, 2010 Data
8
633
1211
40
36
436
3
7
10
26
15
6
8
3
8
4
3
5
78
10
6 6
16
9

Number of Institutions with Texas Ratio > 100%Metro Areas With Five or More
June 30, 2010 Data
Denovo = Established since 1/1/2000
Metro Area Total Banks DenovosChicago, IL 50 9Atlanta, GA 42 20Minneapolis-St. Paul, MN 22 6Seattle-Tacoma, WA 17 4Miami, FL 15 5Kansas City, MO-KS 11 3Dallas-Fort Worth, TX 9 1New York, NY 9 3Tampa-St.Petersburg, FL 8 3Philadelphia, PA 8 3Saint Louis, MO 8 4Detroit, MI 7 0Las Vegas, NV 6 6Phoenix, AZ 6 3Jacksonville, FL 6 1Washington, DC 6 1

2009 and 2010 Bank Failures
*As of July 28, 2010
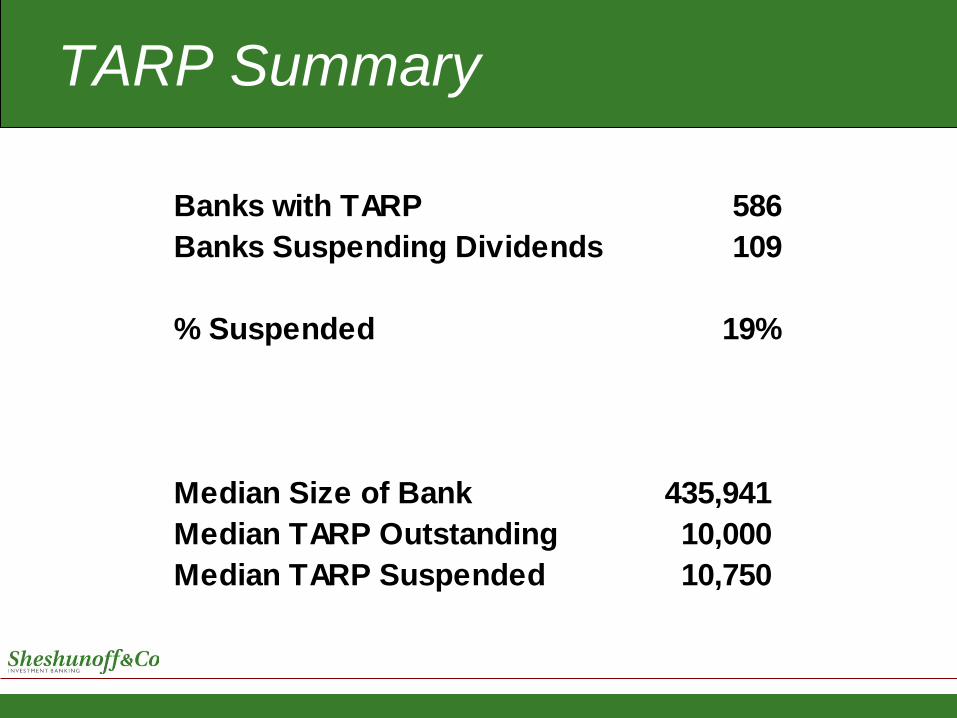
TARP Summary
Banks with TARP 586Banks Suspending Dividends 109
% Suspended 19%
Median Size of Bank 435,941 Median TARP Outstanding 10,000 Median TARP Suspended 10,750

III.Merger Activity and What it Means

Recapitalizations in 2010 (Change of control between 50% and 85%)

11
2010 Recapitalizations

Recapitalizations – Common Terms
• New money establishes its own terms
• Often results in a change-in-control
• Very dilutive to existing shareholders
• Typically from existing shareholder base
• Frequently in form of convertible debt or preferred
• Preserving existing NOL’s can be tricky
• Even though dilutive – often the best alternative

38 37
24 24
34
22
34
22
40
32
53
28
0
10
20
30
40
50
60
2Q 3Q 4Q 1Q 2Q 3Q*
Bank & Thrift Transaction Volume Analysis
2008 201020092010200920102009200920082009200820092008
*As of September 1, 2010

National Bank Acquisition PricingDeal Volume & Price / Book
34 22 40 32 53 28
1.16
0.90
1.10
1.00
1.261.23
0
10
20
30
40
50
60
70
80
2Q09 3Q09 4Q09 1Q10 2Q10 3Q10*0.00
0.20
0.40
0.60
0.80
1.00
1.20
1.40
Deal Volume Price/Book (x)
*As of September 1, 2010

2010 Deal Activity Map
*As of September 1, 2010
0.00
0.50
1.00
1.50
2.00
2.50
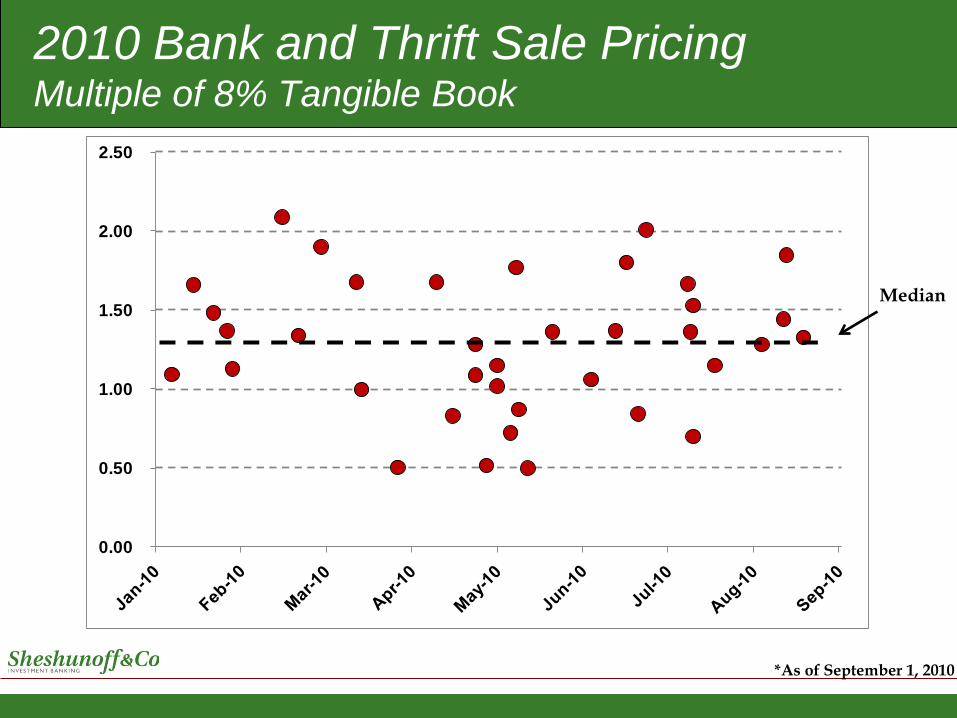
2010 Bank and Thrift Sale PricingMultiple of 8% Tangible Book
Median
*As of September 1, 2010

Buyer Seller
Total Assets 905,609 153,957
T. Equity to T. Assets 9.70 8.48
NPA's/Total Assets 1.58 2.79
2010 Median Characteristics of Buyers and Sellers (excludes charter acquisitions)
Through August 25, 2010

Common Deal Terms in Acquisitions
• Pricing based upon “adjusted” book value
• Cash is most common
• Seeing some non-liquid stock
• Escrows, carve-outs, and/or write downs are common
• Carve-outs provide upside to sellers and entice buyers
• Some survival of representations and warranties
• Buyer’s ability to close is major consideration

51,33327,164
3.40
4.48
0
10,000
20,000
30,000
40,000
50,000
60,000
2009 2010*0.0
1.0
2.0
3.0
4.0
5.0
Deposits Transferred ($000) Franchise Premium/ Deposits (%)
Recent Branch Sale Summary
*As of July 28, 2010**Not all Deals Reported Franchise Premiums

Historical Premiums to Deposits
8.0%
5.8% 5.6%
6.7%
6.0%
7.3%7.0%
4.6%5.0%
3.4%
4.5%
0.0%
1.0%
2.0%
3.0%
4.0%
5.0%
6.0%
7.0%
8.0%
9.0%
2000 2001 2002 2003 2004 2005 2006 2007 2008 2009 2010
Median Deposit Premiums
*As of July 28, 2010

Historical Branch Transaction Volume
2007 2008 2008 2008 2008 2009 2009200820092009118 150 165 132 234 236 187 246 179 167 140 211 150 126 112 86 106 72 64 82
697
269194
157
240190
300
185
525408
441
554
875
463316
776 757
832
1020948
0
50
100
150
200
250
300
1990 1991 1992 1993 1994 1995 1996 1997 1998 1999 2000 2001 2002 2003 2004 2005 2006 2007 2008 20090
200
400
600
800
1000
1200
Number of Branch Sales Number of Branches Sold

III.What is Next?

New regulations surrounding home mortgages are too complex for small banks
Declining interchange fee income with few choices to replace it (i.e. limited menu of fee-based products)
Standardization of banking products favors the larger, low-cost distributors
Higher capital requirements favor larger banks who have more access to capital
Increased regulatory burden favors larger banks who can spread the cost over more assets
Challenges Facing Smaller Banks

Pressure on Deal Prices
Publicly-traded banks have depressed currency
Regulatory pressure on capital ratios
Number of problem banks creates expectations of bargains among directors
Lower earnings and growth projections translate into lower enterprise value
Weak economic growth and pervasive asset quality challenges produce a downward pull on pricing

Expecting More Deal Volume
Perception of having tapped the bottom
Regulatory reform is intensifying the need and/or desire for size
Hundreds of banks have been waiting to sell for the past two years – now they may finally have the opportunity
Many bankers feel they will not earn more in future years
Exasperation threshold with the regulatory climate
Increasing number of serious buyers

or both?
Are you a buyer? a seller?

“Life is a shipwreck, but we must not forget to sing on the life boats.”
Voltaire

Opportunities abound…

Five deals in the past 4 months
Page 45

Questions?
Thank You!
Updated Slides are available at:
www.Sheshunoffib.com

Contact Information
Sheshunoff & Co. Investment BankingAustin, Texas
800-279-2241
Curtis CarpenterManaging Director
John AdamsDirector of Mergers and Acquisitions
www.Sheshunoffib.com


![Investment banking []](https://static.fdocuments.us/doc/165x107/55a493e51a28ab131b8b45a1/investment-banking-wwwlearnerareablogspotcom.jpg)