Industry and Indoor Factory Noise Propagation
15
Industry and Indoor Factory Noise Propagation The above screen capture was taken from our WINCITY demo project. It depicts a petrol filling station with a built in car-wash as an example of an industrial noise problem in a residential neighborhood. Sources are in the open area under a roof (modeled as a floating screen) and inside the car wash. Noise from inside the building can be modeled or measured with the transmission through the outer walls defined as part of the industrial building. You can start the modeling process any place in the process. With SoundPLAN's new transparency of objects (tab 3D Graphics of the object setup), you can make any object transparent. In our example, the walls of the shop and the car wash are transparent, as well as the roof of the petrol station. Examples: SoundPLAN can be successfully used for industrial projects small to huge. The scope can be diverse it can be for environmental noise or to establish the 85 dB line where workers need hearing protection or it can be to get a base line for the background noise levels for alarm systems. Source Types of Point, Line, Area Sources and Industrial Buildings For industrial noise calculations, SoundPLAN offers point, line and area sources and an industrial building. Line and area sources can have any location and orientation in space. Area sources are triangulated for calculations, and each of the pagina 1 van 15 SoundPLAN Info #1 19-2-2013 http://www.soundplan.com/industry_noise.htm
Transcript of Industry and Indoor Factory Noise Propagation

Industry and Indoor Factory Noise Propagation
The above screen capture was taken from our WINCITY demo project. It depicts a petrol filling station with a built in car-wash as an example of an industrial noise problem in a residential neighborhood. Sources are in the open area under a roof (modeled as a floating screen) and inside the car wash. Noise from inside the building can be modeled or measured with the transmission through the outer walls defined as part of the industrial building. You can start the modeling process any place in the process.
With SoundPLAN's new transparency of objects (tab 3D Graphics of the object setup), you can make any object transparent. In our example, the walls of the shop and the car wash are transparent, as well as the roof of the petrol station.
Examples:
SoundPLAN can be successfully used for industrial projects small to huge. The scope can be diverse it can be for environmental noise or to establish the 85 dB line where workers need hearing protection or it can be to get a base line for the background noise levels for alarm systems.
Source Types of Point, Line, Area Sources and Industrial Buildings
For industrial noise calculations, SoundPLAN offers point, line and area sources and an industrial building. Line and area sources can have any location and orientation in space. Area sources are triangulated for calculations, and each of the
pagina 1 van 15SoundPLAN Info #1
19-2-2013http://www.soundplan.com/industry_noise.htm

triangles is calculated as a partial source. You cannot directly influence the triangulation, so you must ensure each area source forms a plain surface by itself, except when the source is set to follow the ground, which can be requested by activating a flag for it.
Sources can be mid frequency or octave bands or third octave bands. The ranges can be between 25 Hz and 20 kHz. The industrial building allows for the simulation inside as well as the transmission through the outside walls.
Full Integration of Indoor Noise, Transmission and Propagation
Industrial buildings have a roof and walls, and most of the time extra weak areas on the facade such as windows and doors. In our sample, there is also an opening where cars drive out of the car wash. The noise level on the inside of the building is the same for the "normal" walls and for the open door, the difference is the transmission index. For normal walls, the transmission index for concrete walls was chosen. For the open door, a transmission index with 0.0 dB loss was chosen.
The sound power radiated by the building is calculate for each square meter of the facade. The formula for is: . Lw=Li-6-Transmission loss. The noise level indoors can come from a simulation, or, as in this case, from a measurement.
Depending on the scope of the study and the available data, you can enter the "stream" at many different locations. If a full simulation of the noise levels indoors is the basis of your investigation, the program will generate receivers 1 meter inside the outer walls and calculate the noise levels for it. The noise levels are hosted in the emissions library.
Sources not active 24/7?
If sources are continuously active, then the measured sound power does not have to be corrected. If the source is active only part of the time, the noise levels need to be adjusted. The sound power needs to be reduced by 10*log(#of_seconds/3600). SoundPLAN also allows the entry of the minutes per hour or the number of noise events per hour. For noise events per hour, the entered sound power must already be the value for one cycle referenced for the entire hour.
The Time history is hosted in the SoundPLAN library. You can create and select any time history. For each of the hours of the day, the number of seconds can be entered that the source is active. The program adjusts the sound power internally.
pagina 2 van 15SoundPLAN Info #1
19-2-2013http://www.soundplan.com/industry_noise.htm
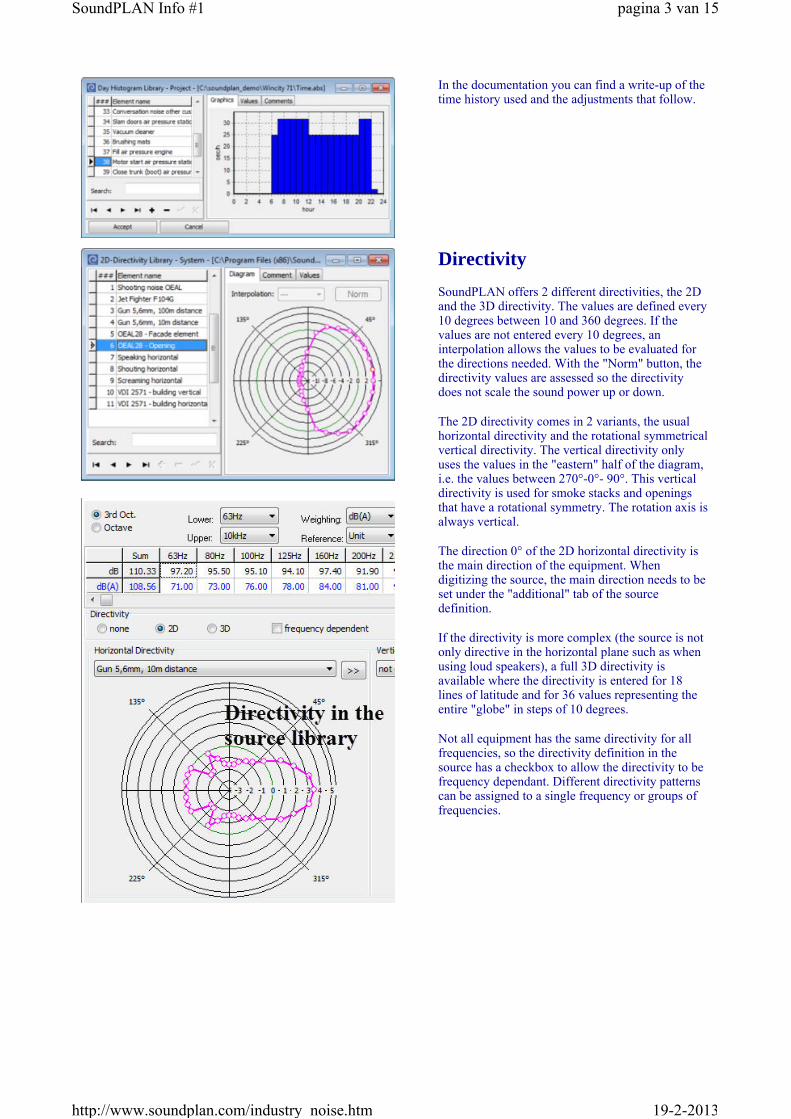
In the documentation you can find a write-up of the time history used and the adjustments that follow.
Directivity
SoundPLAN offers 2 different directivities, the 2D and the 3D directivity. The values are defined every 10 degrees between 10 and 360 degrees. If the values are not entered every 10 degrees, an interpolation allows the values to be evaluated for the directions needed. With the "Norm" button, the directivity values are assessed so the directivity does not scale the sound power up or down.
The 2D directivity comes in 2 variants, the usual horizontal directivity and the rotational symmetrical vertical directivity. The vertical directivity only uses the values in the "eastern" half of the diagram, i.e. the values between 270°-0°- 90°. This vertical directivity is used for smoke stacks and openings that have a rotational symmetry. The rotation axis is always vertical.
The direction 0° of the 2D horizontal directivity is the main direction of the equipment. When digitizing the source, the main direction needs to be set under the "additional" tab of the source definition.
If the directivity is more complex (the source is not only directive in the horizontal plane such as when using loud speakers), a full 3D directivity is available where the directivity is entered for 18 lines of latitude and for 36 values representing the entire "globe" in steps of 10 degrees.
Not all equipment has the same directivity for all frequencies, so the directivity definition in the source has a checkbox to allow the directivity to be frequency dependant. Different directivity patterns can be assigned to a single frequency or groups of frequencies.
pagina 3 van 15SoundPLAN Info #1
19-2-2013http://www.soundplan.com/industry_noise.htm

Sources on Roofs
Loud sources such as air conditioning and vents are often on roofs of other structures. This can be accurately modeled in SoundPLAN. Some understanding of the problems the standards impose on such calculations help with interpreting the results.
The ISO 9613 defines the ground effect with 3 different zones, the source zone, the middle zone and the receiver zone. If the source and receiver zones are big enough, the middle zone does not exist. The standard requires both the source zone and the receiver zone have the length of 30 x the height of source/receiver above the reflection plane. This is the extent of the explanation in the the standard.
If the source is on a plane surface in front of the building, it is clear what the source zone is, it is 30 times the height of the source above the ground. But what is happening when the source is on a roof like in the picture to the left? Where is the reflection plane? Is the reflection plane on the roof itself or on surface where the main building stands?
So far, the reflection plane in the ISO 9613 is calculated as the difference between the source position and the ground at the source as taken from the DGM. In other standards, such as the Scandinavian General Prediction Model for Industrial Plants, the reflection plane is evaluated by assuming different reflection planes (the ground and the roof of the building) and finding which one has the best fit.
Complex Geometry
What can be done? Why does it increas the calculation time so much?
Floating Screens are the construction elements that allow the user to model complex structures. In the picture to the left, the floating screen was simply a roof attached to the building. In past SoundPLAN versions, floating screens had to be evaluated one by one, it was not possible to construct more
pagina 4 van 15SoundPLAN Info #1
19-2-2013http://www.soundplan.com/industry_noise.htm

complex shapes from multiple floating screens. With SoundPLAN 7.0 and newer versions, it is possible to have multiple floating screens connect to each other and still calculate the noise levels correctly.
The lower picture contains 3 buildings and 4 different floating screens. Unfortunately, the price to pay for the higher computational versatility is a higher calculation time.
The lowest picture depicts the capabilities of the new calculation core. The shortest distance between source and receiver is found and screening with restrictions on top and bottom will be applied. As the program only evaluates the shortest path (usually over the obstacle) and 2 paths for side diffraction, the results are only approximations.
Screening not only over the Object, but also around compound Objects
Screening for industry noise (mostly relevant for point sources) occurs not only over the obstacles, but also around them. If multiple objects create a compound path, SoundPLAN will find the path
pagina 5 van 15SoundPLAN Info #1
19-2-2013http://www.soundplan.com/industry_noise.htm

even if the objects are not of the same type. If a wall is attached to a building, the path around the objects is found.
Maximum Noise Levels for Industry
For train noise, the maximum noise level describes what could be measured with the setting peak hold on a sound level meter. With industry noise, this is not possible. It is impossible to define which of the non-stationary sources are active simultaneously. Therefore the maximum noise level for industry noise only delivers answers for individual sources. Because the sound power usually fluctuates, you can enter a separate value for the Lmax that is usually higher than the Leq value. In the picture to the left, the source strictly follows the definition from the library ("use library definition").
"Total sound power located in one point" allows the program to locate the place on the line/area causing the highest maximum noise level (worst case scenario). This is important for a moving point source, for example, where one wants to find the position of the point source resulting in the highest noise level (this is usually the position closest to the receiver)
Sound Pressure - Sound Power
The SoundPLAN library contains settings to reference the Lw per unit/meter/level. The GeoDatabase only has the selection of unit/meter. Why?
The entry for "level" is reserved to set the noise levels inside an industrial building to a defined noise level or to define a regular source with the sound pressure level and later on convert it to the sound power level. For the industrial building, the transmission and a formula for the conversion will define the sound power for the outside shell of the building. Sound power per meter is only sensible for line and area sources where a meter/square meter of the source radiates the defined sound power. If the definition is per unit, the entire source shares the sound power. An example of this is would be a fork lifter that has a defined sound power but will travel on the line source so the sound power per meter of the line is reduced 10log(length of source line).
pagina 6 van 15SoundPLAN Info #1
19-2-2013http://www.soundplan.com/industry_noise.htm

SoundPLAN always uses the sound power to define a source, so when you have only sound pressure measurement data, you need to convert the sound pressure measurement into sound power. There are build-in facilities for this in SoundPLAN. If the reference in the Library is set to "Level", you can right click on the data and select "Convert sound pressure to sound power".
The program offers 4 different standard models to convert the sound pressure into sound power (spherical, half spherical, box and half box). To the left you can see the entry for the full sphere. The entry is fully guided.
Mean Frequency
When a single value is entered for the source as sound power, it can be assumed that the source still has a frequency spectrum but the exact spectrum could not be measured or was not available. Therefore it would be unrealistic to calculate the ground effect for this very frequency. For the ISO 9613, SoundPLAN calculates the ground effect with the alternative formula that is not frequency dependent. In case you really have a single frequency and want to have the ground calculated for this very frequency, you must define a spectrum in the emissions library that reflects your selection of frequencies.
Frequency Filters
Spectra in the Library can be entered as a linear spectrum or in any of the weightings. If you change from dB(A) to dB(linear) for example, the program asks if you want to recalculate the weighting or just change the label. This protects your data in case you had forgotten to enter the correct weighting before you entered the data. If your data were measured as dB(A) and you wanted to change it to linear, answer with "Yes". If the data was a linear spectrum but while you entered the data the weighting was set to dB(A), you need to answer "No" so only the label is changed.
For the calculations, it is irrelevant which frequency weighting was selected. In the spectral result Documentation you can switch between the different weightings after the propagation calculation.
pagina 7 van 15SoundPLAN Info #1
19-2-2013http://www.soundplan.com/industry_noise.htm

Impulse, Tonality Addition
Psychoacoustics tells us that steady noise levels are less annoying than impulse type noise levels and broad distribution of frequencies is less annoying than noise with a strong tonal component. Normally these factors should be evaluated at the receiver, not at the source. However, with noise modeling we lack the resolution to make this decision at the receiver, so it needs to be done with a definition at the source.
Correction Factors for the Location of the Source (k_omega)
If a source is in the free field high above the ground (i.e. a chimney), no spatial corrections apply. If the source is located in a position where it transmits only into half the sphere, an addition of 3 dB needs to be applied. If the source is in the corner restricted by 2 walls, the free sector is increased by 6 dB.
In SoundPLAN, the spatial corrections are split between the correction for the floor and for the walls. There is a simple reason for this. Most standards explicitly calculate the K_Floor as part of the ground effect. For these standards (i.e. ISO 9613) the K_Floor is ignored. The value is calculated explicitly instead of simply being stated.
Standards for Industry Noise
SoundPLAN offers many standards. If you are interested in a standard for your noise propagation of industrial sources that is not listed to the left, please let us know. We may be able to help with the implementation.
If you click on the double arrow next to the standard label in the SoundPLAN settings or the Calculation, you open the pre-settings for the standard. Most standards allow you to explicitly set the maximum values for single and multiple diffractions. The default settings are defined in the standard itself. With the ISO 9613 you can see there are selections for equations of the interaction of screening and ground effect. Extra tabs are available for the dissection (next discussion slot), the temperature and humidity under environment, the air absorption method and ground definitions under standard and the meteorological corrections under Cmet.
Dissection of Sources
Line and area sources cannot always be represented accurately by a single point source. At first it appears that the finer the web of point sources the higher the accuracy. The problem with this is that the calculation time would become unsustainable. It also must be stated that a fixed break down of line and area sources into point sources that satisfies the
pagina 8 van 15SoundPLAN Info #1
19-2-2013http://www.soundplan.com/industry_noise.htm

near field is much too detailed for the far field. Therefore some rules are made to achieve high accuracy while maintain a good level of performance.
Distance to diameter factor is the prime rule to split line and area sources into point sources. If the distance between the receiver and a potential point source multiplied by the factor is greater than the distance within the source, then the source must be sub-.divided. Typically the factor is 4 to 10.
Max. Difference Gnd+Scr[dB] refers to a maximum tension within the source. For all corners of the source and the representing point source, the screening and the ground effect is evaluated. If the difference in these factors is bigger than the value entered, the source must be sub-divided. This is an iterative process and can be carried out to the number defined in Max. No of Iterations.
Too high numbers will result in excessive calculation time!
Minimal Distance [m] refers to the minimum distance between a receiver and a source. If the distance would be 0.0, the result would be infinity! It also would not be practical because the receiver would be inside the source. If a Grid Noise Map is calculated with 25 meter grid spacing the minimal distance can easily be 5 meters.
pagina 9 van 15SoundPLAN Info #1
19-2-2013http://www.soundplan.com/industry_noise.htm

Tolerance
If a Grid Noise Map is calculated, speed is paramount. If single receivers are calculated, maximum accuracy counts. In SoundPLAN you can guide the program to create the correct balance between speed and accuracy. The selector for tolerance is the place for this determination. For a Grid Noise Map, a tolerance of 0.5 dB will greatly speed up the application. For single receivers in industry noise, 0.001 will achieve the highest accuracy, especially if you set the tolerance for each source contribution.
The SoundPLAN 7.0 calculation core changed from an angle by angle approach to a procedure where the calculation is source by source. The sources are ranked by their free field contribution. All sources with big contributions are calculated right away, all minor contributions are grouped in a list to be estimated ("estimate list"). If all sources in the "estimate list" would not increase the overall noise level by more than the value of the tolerance, all sources in the "estimate list" will be estimated with correct spreading but average ground effect, screening, air absorption etc. If the tolerance is exceeded, the next sources with the highest contribution levels in the "estimate list" are calculated and the test of the tolerance conditions is done again. Under the topic, "dissection of sources", you find reasons why some sources are calculated piece by piece. If this is the case, the tolerance can be set to apply to these partial sources.
Be aware that setting the tolerance very restrictive and only for "each source contribution level" will drastically increase the calculation time!
Problems with CONCAWE
The CONCAWE standard has one advantage in that it is one of the few standards that allows wind and stability to be used in the calculation. The picture to the left shows the same scenario, one time calculated with wind from 70° and one time with the wind from 230°.
The CONCAWE standard has three big shortcomings. One is that the formulae for the ground effect and the meteorological correction are only valid from distances of greater than 100 meters. What if the source is closer to the receiver? In this case, SoundPLAN takes the value for the 100 meter calculation and extrapolates the effect between the 100 meter mark and 0.0 dB. This is certainly not correct, but what is? It is not defined in the standard.
Another shortcoming is that the standard does not have any formula for screening, it just states to use the approach from Maekawa....
The third shortcoming is the missing definition concerning how to modify the ground effect when significant screening is present.
pagina 10 van 15SoundPLAN Info #1
19-2-2013http://www.soundplan.com/industry_noise.htm
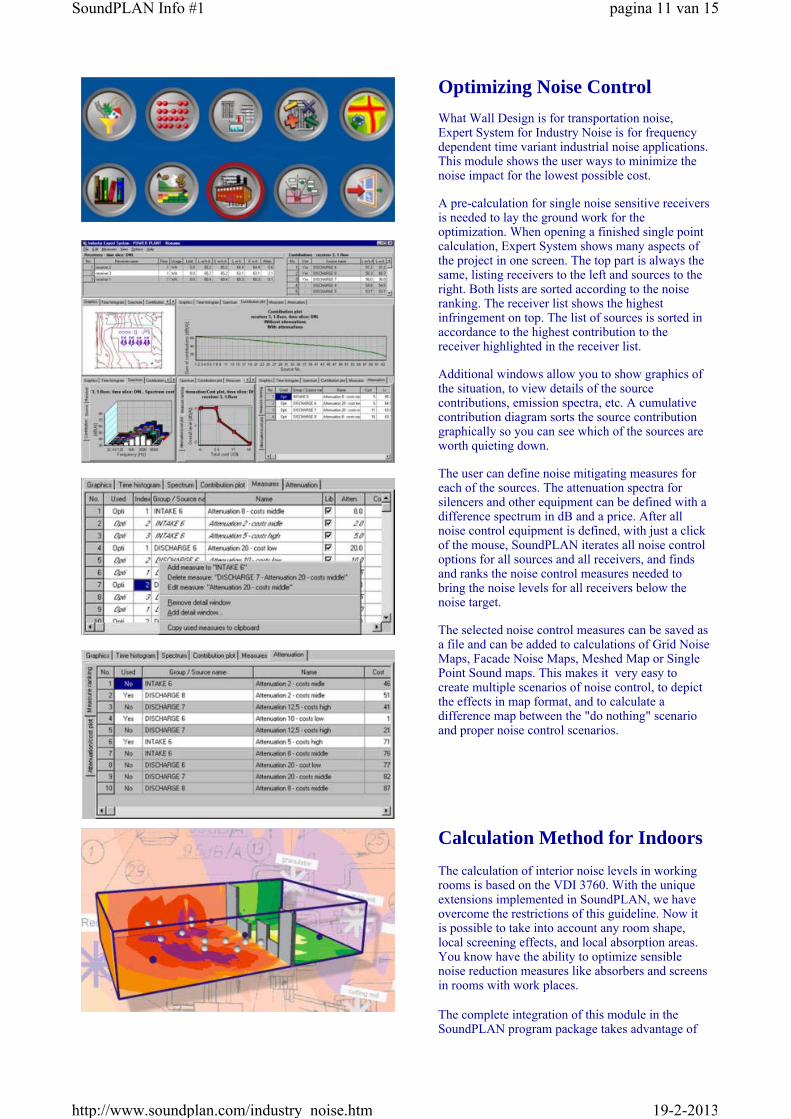
Optimizing Noise Control
What Wall Design is for transportation noise, Expert System for Industry Noise is for frequency dependent time variant industrial noise applications. This module shows the user ways to minimize the noise impact for the lowest possible cost.
A pre-calculation for single noise sensitive receivers is needed to lay the ground work for the optimization. When opening a finished single point calculation, Expert System shows many aspects of the project in one screen. The top part is always the same, listing receivers to the left and sources to the right. Both lists are sorted according to the noise ranking. The receiver list shows the highest infringement on top. The list of sources is sorted in accordance to the highest contribution to the receiver highlighted in the receiver list.
Additional windows allow you to show graphics of the situation, to view details of the source contributions, emission spectra, etc. A cumulative contribution diagram sorts the source contribution graphically so you can see which of the sources are worth quieting down.
The user can define noise mitigating measures for each of the sources. The attenuation spectra for silencers and other equipment can be defined with a difference spectrum in dB and a price. After all noise control equipment is defined, with just a click of the mouse, SoundPLAN iterates all noise control options for all sources and all receivers, and finds and ranks the noise control measures needed to bring the noise levels for all receivers below the noise target.
The selected noise control measures can be saved as a file and can be added to calculations of Grid Noise Maps, Facade Noise Maps, Meshed Map or Single Point Sound maps. This makes it very easy to create multiple scenarios of noise control, to depict the effects in map format, and to calculate a difference map between the "do nothing" scenario and proper noise control scenarios.
Calculation Method for Indoors
The calculation of interior noise levels in working rooms is based on the VDI 3760. With the unique extensions implemented in SoundPLAN, we have overcome the restrictions of this guideline. Now it is possible to take into account any room shape, local screening effects, and local absorption areas. You know have the ability to optimize sensible noise reduction measures like absorbers and screens in rooms with work places.
The complete integration of this module in the SoundPLAN program package takes advantage of
pagina 11 van 15SoundPLAN Info #1
19-2-2013http://www.soundplan.com/industry_noise.htm

The basic equations defined in the VDI 3760 are describing the direct sound:
and the scattered sound:
The overall energy is the sum of the direct and the scattered sound from the original source and all mirror sources.
the existing and easy to use input and output capabilities. This gives you the possibility to create and compare different variants in the most convenient way. The acoustical input data (emission and absorption) can be organized in the well-structured libraries already containing hundreds of elements in octave or even in third octave bands.
The computed results can be single values at working places, sound decay curves (Sound Propagation Curve), reverberation times (based on Sabine / Ering) and horizontal and vertical noise maps.
All calculations are carried out with the fast and most advanced SoundPLAN calculation core using the full power of your computer with the multi-threading technique.The integrated concept of the interior noise calculations and the superb definition of the surrounding building facades give you the ability to use the calculated indoor levels directly for your environmental noise assessment study in the surrounding of your industrial site. There is no other software offering this complete linkage and ease of use - saving your time and money.
The equations on the left use the abbreviations:
P = acoustic power of the source q = scattering object densityc = speed of soundr = distance between source & receiverm = air absorption coefficientρ = reflection coefficient (covers the absorption of the reflecting boundary plane)
The basic equations of the VDI 3760 foresaw a model of the factory building that resembles a shoe carton, all walls perpendicular to one another with floor and ceiling parallel to each other. SoundPLAN extended the concept by allowing any floor plan, but kept the restriction of floor and ceiling being parallel. Further extensions to the concept allow partitions in the room and full and half height walls. The concept of the transmission from one room section to another can be seen to the left. For the direct transmission, the screening is evaluated with the screening function. For the scattered part, the ratio of open to blocked space is relevant.
The validation:The presented calculation method was tested in two ways:
• comparison with available test series• comparison with other calculation methods
The diagram to the left shows the red dotted line in a sample industrial building as the SoundPLAN 7.0 simulation. The black series is the measurement series.
Indoor Factory Demo Model
This is a factory where some quiet areas are needed.
pagina 12 van 15SoundPLAN Info #1
19-2-2013http://www.soundplan.com/industry_noise.htm
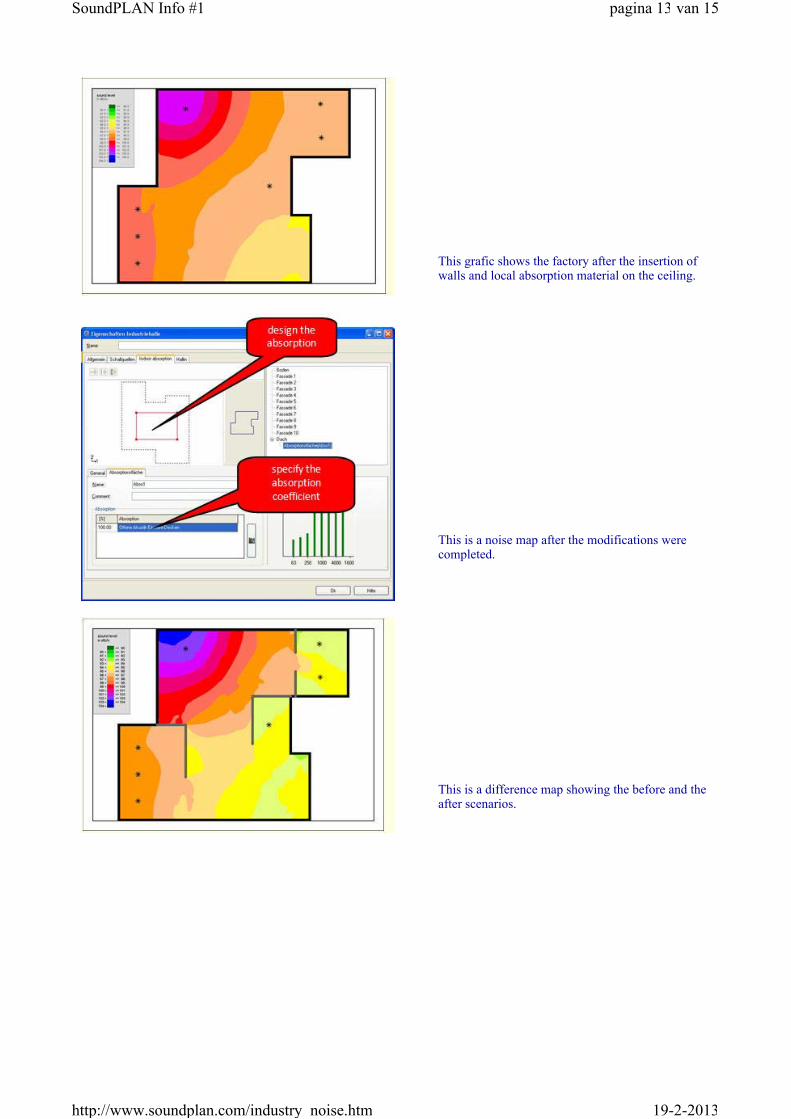
This grafic shows the factory after the insertion of walls and local absorption material on the ceiling.
This is a noise map after the modifications were completed.
This is a difference map showing the before and the after scenarios.
pagina 13 van 15SoundPLAN Info #1
19-2-2013http://www.soundplan.com/industry_noise.htm

This is an Indoor Factory Model with half height walls and Cross-sectional Noise Maps
Documentation. What is this about?
The Documentation in the Result Tables contains a host of information about the spectrum at the receiver for all time slots, the distribution of noise over the course of the day, the individual contribution of each partial source, the 24 hour breakdown of the source contribution and diagrams for spectral and time history information. This information is available for every receiver.
The documentation has provisions to format the tables into a nice report with headers, footers and many pre-defined text components.
pagina 14 van 15SoundPLAN Info #1
19-2-2013http://www.soundplan.com/industry_noise.htm

Copyright 2012 SoundPLAN international LLC, Shelton, WA 98584, USA
pagina 15 van 15SoundPLAN Info #1
19-2-2013http://www.soundplan.com/industry_noise.htm