INDUSTRIAL MARKET BEAT - Whitebox Real...
43
Q2 2019 INDUSTRIAL MARKET BEAT
Transcript of INDUSTRIAL MARKET BEAT - Whitebox Real...

Q2 2019 INDUSTRIAL
MARKET BEAT

The market terms, definitions, and statistics in this report are based on CoStar Group, Inc. office statistics. The information contained is gathered from multiple sources considered to be reliable. No warranty or representation, express or implied, is made to the accuracy or completeness of the information contained herein, and same is submitted subject to errors, omissions, change of price,
rental or other conditions, withdrawal without notice, and to any special listing conditions imposed by our principals. © 2017 Whitebox Real Estate, LLC | Data from CoStar, Inc
1 DFW INDUSTRIAL MARKET OVERVIEW
Industrial Market Overview Industrial Market Statistics
2 DFW AIRPORT
W DFW Airport/Grapevine E DFW Airport/Las Colinas
3 EAST DALLAS
Central Dallas East Dallas/Mesquite
4 GREAT SW/ARLINGTON
Lower Great Southwest Upper Great Southwest
Arlington
5 NORTH FT WORTH/ALLIANCE
NE Tarrant/Alliance Meacham Field/Fossil Creek
6 NORTHEAST DALLAS
Allen/McKinney Plano
Richardson NE Dallas/Garland
7 VALWOOD/LEWISVILLE
Lewisville N Stemmons/Valwood
Metropolitan/Addison
8 SOUTH DALLAS
Redbird Airport SW Dallas/US 67
SE Dallas/I-45 • Outlying Ellis County
9 SOUTH FT WORTH
East Ft Worth North Central Ft Worth
South Central Ft Worth South Central Tarrant County
10 PINNACLE / TURNPIKE / LONESTAR / DESIGN / DISTRICT
Western Lonestar/Turnpike Eastern Lonestar/Turnpike
North Trinity
MARKET BEAT
TABLE OF CONTENTS

DFWIndustrialMarketOverview
1 - DFW Airport
Legend
2 - East Dallas Ind
3 - Great SW/Arlington Ind
4 - North Ft. Worth/Alliance
5 - Northeast Dallas
6 - Valwood/Lewisville
7 - NW Dallas Outlying Ind
8 - South Dallas Ind
9 - South Ft Worth Ind
10 - Pinnacle
DFW Airport
NLove Field
Alliance Airport
183
35W 35E
30
35E
45
175
20
10
6
1
5
2
8
Union PacificIntermodal
3
7
4
9
635/LBJ
75/CentralExpressway
121/Sam Rayburn
Tollway
DallasNorth
Tollway
380
PresidentGeorge Bush
Turnpike
360
Loop12820
20
377
67
287
287
114
BNSFIntermodal

The market terms, definitions, and statistics in this report are based on CoStar Group, Inc. office statistics. The information contained is gathered from multiple sources considered to be reliable. No warranty or representation, express or implied, is made to the accuracy or completeness of the information contained herein, and same is submitted subject to errors, omissions, change of price,
rental or other conditions, withdrawal without notice, and to any special listing conditions imposed by our principals. © 2017 Whitebox Real Estate, LLC | Data from CoStar, Inc
MARKET BEAT
INDUSTRIAL OVERVIEW
INDUSTRIAL OVERVIEW | Q2 2019
-
5,000
10,000
15,000
Q22018
Q32018
Q42018
Q12019
Q22019
Thou
sand
s
Net Absorption
$5.60$5.80$6.00$6.20$6.40$6.60$6.80
Q22018
Q32018
Q42018
Q12019
Q22019
LEASING ACTIVITY
4.5%5.0%5.5%6.0%6.5%
$5.50
$6.00
$6.50
$7.00
Q22018
Q32018
Q42018
Q12019
Q22019
Vacancy Vs Rental Rate
Vacancy Rental Rate
400 S Record Street Suite 1100
Dallas, TX 75202
(214) 380-4540 [email protected]
201 Main Street Suite 600
Fort Worth, TX 76102
(817) 502-1518
5830 Granite Parkway Suite 100
Plano, TX 75024
(214) 380-4540
Economic Overview The Texas economy continued to grow for yet another quarter, and June marked the 110th consecutive month for positive growth of nonfarm employment in the State of Texas, according to the Texas Workforce Commission. 10 of 11 major industries are experiencing positive annual growth. The private sector continues to be a growth engine for the state, and the growth rate has risen to 2.9% (from 2.5% a year ago). Unemployment for the State of Texas held relatively dropped to 3.4% (down 0.4% from the previous quarter). This is the lowest unemployment rate since 1976 (when the date series began). The United States unemployment rate decreased by 0.1% to 3.7%. Texas has outperformed the US unemployment rate for the last seven months. The Dallas Federal Reserve reported, “mixed” outlooks and “moderate” expansion. The Fed had positive news regarding the greater economy noting, “moderate expansion.” The news continues to be more positive than the end of last year. Employment has continued to expand in spite of labor shortages. The Dallas-Fort Worth (DFW) labor market grew by 3.2% by adding 116,800 jobs over the last 12 months (320 per day). The unemployment rate for DFW has held relatively flat at 3.2%. Dallas-Plano-Irving continues to stay in the top three for fastest growing MSA in the state (on a percentage basis at 3.7% -- 95,900 jobs added over the last 12 months).
Tenant Outlook Net absorption for the first quarter totaled 6,033,648 square feet (SF) for warehouse and flex product combined, up slightly from the previous quarter. Warehouse absorption comprised almost all of it at 5,538,777 SF. The average rental rate for Industrial product decreased $0.03 per square foot from the previous quarter to $6.56 per square foot per year at the end of the second quarter of 2019. Average warehouse rates rose 0.7% from the previous quarter to $5.42 per square foot per year. The vacancy rate in DFW decreased to 6.1%, down slightly from 6.2% the previous quarter. Warehouse vacancy decreased to 6.2% from 6.3% the previous quarter. Total Industrial sublease vacancy continued to increase this quarter by 36.6% from the first quarter of 2019 to

The market terms, definitions, and statistics in this report are based on CoStar Group, Inc. office statistics. The information contained is gathered from multiple sources considered to be reliable. No warranty or representation, express or implied, is made to the accuracy or completeness of the information contained herein, and same is submitted subject to errors, omissions, change of price,
rental or other conditions, withdrawal without notice, and to any special listing conditions imposed by our principals. © 2017 Whitebox Real Estate, LLC | Data from CoStar, Inc
400 S Record Street Suite 1100
Dallas, TX 75202
(214) 380-4540 [email protected]
201 Main Street Suite 600
Fort Worth, TX 76102
(817) 502-1518
5830 Granite Parkway Suite 100
Plano, TX 75024
(214) 380-4540
MARKET BEAT
INDUSTRIAL OVERVIEW
2,769,159 SF. Warehouse sublease vacancy only increased 3.3% to a total of 2,235,311 SF at the end of the second quarter. 6,452,685 SF of new industrial space was delivered in the second quarter of 2019 for a total of 25 buildings. 32,658,397 SF of new industrial space was under construction by the end of the second quarter of 2019, of which warehouse new construction comprises 31,494,813 SF. The largest projects under are the 1,500,000 SF Home Depot Facility (Western Lonestar / Turnpike Industrial Submarket) delivering in late 2019 and Hillwood’s 1,200,536 SF Westport 11 speculative development (NE Tarrant/Alliance Industrial Submarket) delivering in December 2019. Investor Outlook Industrial building sales activity has increased in DFW over the last 10 years. The first half of 2019 was cyclically slow, but a strong finish to 2019 is expected. 1,319 industrial building sales have been recorded in the last 12 months at an average of $80.00/SF and a 6.1% cap rate (this rate is continuing to compress). One of the most notable sales over the past 12 months has been the sale of the 822,550 square foot 201 Sunridge Blvd facility in Wilmer, TX (South East Dallas/I-45 Industrial Submarket). The building was sold for $99,898,425 or $121/SF (6.2% cap rate). Looking Forward At the halfway mark, 2019 has been better than expected. DFW growth has accelerated since the end of the first quarter. DFW still struggles to find labor, and that is the biggest strain on the economy at the present time. There is a true war for talent, and we continue to monitor this closely. Trade tariffs and slowed Oil & Gas activity continue to be a concern; however, there is enormous interest from coastal markets on the relocation front and the investment from (New York, Boston, Los Angeles, San Francisco), the economy continues to grow, and we feel the fundamentals for Dallas-Fort Worth continue to be positive and the outlook for 2019 is positive.

The market terms, definitions, and statistics in this report are based on CoStar Group, Inc. office statistics. The information contained is gathered from multiple sources considered to be reliable. No warranty or representation, express or implied, is made to the accuracy or completeness of the information contained herein, and same is submitted subject to errors, omissions, change of price,
rental or other conditions, withdrawal without notice, and to any special listing conditions imposed by our principals. © 2017 Whitebox Real Estate, LLC | Data from CoStar, Inc
400 S Record Street Suite 1100
Dallas, TX 75202
(214) 380-4540 [email protected]
201 Main Street Suite 600
Fort Worth, TX 76102
(817) 502-1518
5830 Granite Parkway Suite 100
Plano, TX 75024
(214) 380-4540
MARKET BEAT
TOTAL INDUSTRIAL STATISTICS
YTD Net YTD Under QuotedMarket # Blds Total RBA Direct SF Total SF Vac % Absorption Deliveries Const SF RatesAllen/McKinney Ind 298 13,185,928 584,359 780,102 5.9% (92,493) 72,000 186,404 $8.00 Arlington Ind 655 24,055,225 1,316,241 1,318,241 5.5% 122,654 310,794 933,431 $6.72 Central East Dallas . 949 19,910,764 429,035 473,860 2.4% 22,833 0 0 $6.62 Delta County Ind 5 147,519 0 0 0.0% 5,620 0 0 $0.00 Denton Ind 370 13,191,667 384,145 425,355 3.2% 119,375 192,629 114,000 $6.34 E DFW Air/Las Colina. 452 61,765,942 5,513,430 5,673,422 9.2% 1,941,178 2,617,047 2,338,465 $7.42 East Brookhollow Ind 299 9,453,143 272,527 272,527 2.9% (2,372) 0 0 $13.16 East Dallas/Mesquite. 633 23,305,453 1,627,259 1,627,259 7.0% 1,122,188 1,022,130 1,070,452 $5.93 East Ft Worth Ind 1,036 26,208,540 1,006,450 1,006,450 3.8% 4,742 0 27,356 $6.27 East Hines North Ind 926 22,211,931 476,022 523,510 2.4% 99,019 0 0 $6.61 Eastern Lonestar/Tpk. 537 26,595,727 1,928,141 1,950,841 7.3% (88,549) 12,000 1,281,714 $4.14 Forney/Terrll/Kauf C. 370 9,296,726 140,080 186,605 2.0% 104,005 0 1,200,000 $4.80 Henderson County Ind 125 1,699,914 60,734 60,734 3.6% 12,232 0 0 $3.60 Hood County Ind 133 1,154,857 46,765 46,765 4.0% 3,165 0 0 $7.37 Hunt County Ind 176 7,383,755 367,659 367,659 5.0% 125,357 6,250 450,000 $9.18 Johnson County Ind 500 10,810,062 293,096 293,096 2.7% (43,487) 43,500 260,000 $6.96 Lewisville Ind 424 28,087,195 912,632 965,109 3.4% 1,157,278 634,564 1,408,939 $10.40 Lower Great Southwes. 600 39,591,263 1,227,985 1,305,695 3.3% 1,954,452 2,328,173 190,730 $5.47 Mansfield Ind 182 5,579,607 10,960 10,960 0.2% 21,164 0 173,603 $7.23 Meacham Fld/Fossil C. 649 44,181,409 2,080,622 2,107,622 4.8% 878,222 638,029 2,343,477 $5.07 Metropolitan/Addison. 515 21,688,840 1,274,546 1,302,038 6.0% 233,713 0 10,800 $8.11 N Central Ft Worth I. 507 11,469,833 285,838 287,374 2.5% 89,381 0 0 $8.50 N Stemmons/Valwood I. 819 51,758,106 1,971,800 2,180,294 4.2% (58,873) 151,176 674,414 $5.87 NE Dallas/Garland In. 1,500 53,046,772 2,509,668 3,109,383 5.9% 388,350 249,166 763,132 $5.07 NE Tarrant/Alliance . 469 48,786,613 4,365,112 4,563,777 9.4% 1,524,122 1,655,676 8,834,683 $5.85 North Trinity Ind 949 13,506,584 886,745 889,213 6.6% (90,820) 0 0 $12.59 NW Dallas Outlying I. 160 3,057,510 153,858 161,858 5.3% (49,683) 9,000 38,050 $7.16 Outlying Collin Cnty. 102 1,534,099 172,814 172,814 11.3% 38,045 42,000 2,000 $11.51 Outlying Ellis Cnty . 380 12,597,426 508,203 508,203 4.0% (128,939) 0 0 $4.35 Outlying Kaufman Cnt. 47 607,515 104,081 104,081 17.1% 14,401 0 0 $4.18 Parker County Ind 292 4,011,246 116,001 116,001 2.9% 88,965 2,400 34,995 $7.08 Plano Ind 554 23,889,546 1,659,476 1,789,338 7.5% (190,724) 321,516 483,656 $10.62 Redbird Airport Ind 268 20,480,870 468,731 468,731 2.3% (82,915) 0 0 $3.85 Richardson Ind 412 19,007,671 1,462,508 1,508,969 7.9% (34,427) 434,640 205,812 $9.17 Rockwall Ind 162 4,905,276 79,692 82,365 1.7% 624,877 650,000 0 $9.19 S Cen.Tarrant Cnty I. 450 24,823,928 1,922,792 1,922,792 7.7% 10,646 766,145 0 $7.88 S Central Ft Worth I. 542 10,801,389 179,815 190,873 1.8% (7,842) 0 0 $5.51 SE Dallas/I-45 Ind 526 42,125,221 8,442,134 8,442,134 20.0% 640,578 404,175 3,443,266 $3.76 Southwest Tarrant In. 196 3,054,130 317,994 336,134 11.0% 138,335 30,577 12,000 $7.88 SW Dallas/US 67 Ind 553 31,066,201 2,805,938 2,805,938 9.0% (61,892) 0 1,387,404 $4.27 Upper Great Southwes. 602 53,688,101 2,853,277 2,864,316 5.3% 836,025 465,117 1,591,112 $6.46 W DFW Air/Grapevine . 488 20,180,776 1,062,685 1,124,853 5.6% 98,643 79,973 0 $7.40 West Brookhollow Ind 1,440 42,378,375 1,279,870 1,328,834 3.1% (244,352) 0 0 $6.39 West Hines North Ind 368 7,645,739 295,889 297,839 3.9% (142,956) 0 388,822 $6.76 West Tarrant Ind 154 4,896,534 105,059 105,059 2.1% 49,911 25,000 0 $9.89 Western Lonestar/Tpk. 227 7,760,466 534,113 534,113 6.9% 551,755 8,200 2,789,680 $5.14 Wise County Ind 144 2,071,160 133,181 133,181 6.4% (23,315) 0 20,000 $5.87 Totals 22,145 928,656,554 54,629,962 56,726,317 6.1% 11,677,592 13,171,877 32,658,397 $6.56
Existing Inventory Vacancy

W DFW AirportGrapevine Ind
Legend
E DFW AirportLas Colinas Ind
DFWAirportIndustrialMarket
N
DFWAirport
PresidentGeorge Bush
Turnpike
114
114
635/LBJ
121
121
360
183

The market terms, definitions, and statistics in this report are based on CoStar Group, Inc. office statistics. The information contained is gathered from multiple sources considered to be reliable. No warranty or representation, express or implied, is made to the accuracy or completeness of the information contained herein, and same is submitted subject to errors, omissions, change of price,
rental or other conditions, withdrawal without notice, and to any special listing conditions imposed by our principals. © 2017 Whitebox Real Estate, LLC | Data from Costar, Inc
Market Snapshot Rental Rates Vacancy
Under Construction Inventory
Market Statistics
Inventory Total Vacancy SF
Vacancy Rate
YTD Net Absorption
YTD Deliveries
Under Construction
Rates - All Classes
W DFW Airport/ Grapevine 20,180,776 SF 1,124,853 SF 5.57% 98,643 SF 79,973 SF 0 SF $7.40/SF
Dallas/Fort Worth Total 928,656,554 SF 56,726,317 SF 6.11% 11,677,592 SF 13,171,877 SF 32,658,397 SF $6.56/SF
MARKET BEAT
INDUSTRIAL SUBMARKET REPORT
Market Insights: The W DFW Airport/Grapevine Submarket ended the second quarter of 2019 with a vacancy rate of 5.57%. The vacancy rate increased from the previous quarter, with a YTD net absorption of 98,643 SF to finish Q2 2019. Rental rates ended the second quarter at $7.40/SF across all classes, increasing from $7.11/SF in the previous quarter. New construction deliveries increased from 37,223 SF to 79,973 SF, and there is currently 0 SF under construction in the submarket. West DFW Airport/Grapevine has performed well as of late. Vacancies have remained below the metro average due to steady absorption in existing inventory and strong leasing for new speculative projects. Rents are pricier than nearby submarkets, but rent growth remains well above historical norms. Sales activity is usually tepid, but the submarket usually sees a few big trades occur per year.
W DFW Airport/Grapevine | Q2 2019
400 S Record Street Suite 1100
Dallas, TX 75202
(214) 380-4540 [email protected]
201 Main Street Suite 600
Fort Worth, TX 76102
(817) 502-1518
5830 Granite Parkway Suite 100
Plano, TX 75024
(214) 380-4540
-
100,000
200,000
300,000
400,000
500,000
Q22018
Q32018
Q42018
Q12019
Q22019
Net Absorption
$6.50
$7.00
$7.50
$8.00
$8.50
Q22018
Q32018
Q42018
Q12019
Q22019
Gross Asking Rents/SF
0.0%
2.0%
4.0%
6.0%
$6.50$7.00$7.50$8.00$8.50
Q22018
Q32018
Q42018
Q12019
Q22019
Vacancy Vs Rental Rate
Rental Rate Vacancy2

The market terms, definitions, and statistics in this report are based on CoStar Group, Inc. office statistics. The information contained is gathered from multiple sources considered to be reliable. No warranty or representation, express or implied, is made to the accuracy or completeness of the information contained herein, and same is submitted subject to errors, omissions, change of price,
rental or other conditions, withdrawal without notice, and to any special listing conditions imposed by our principals. © 2017 Whitebox Real Estate, LLC | Data from Costar, Inc
Market Snapshot Rental Rates Vacancy
Under Construction Inventory
Market Statistics
Inventory Total Vacancy SF
Vacancy Rate
YTD Net Absorption
YTD Deliveries
Under Construction
Rates - All Classes
E DFW Airport/ Las Colinas 61,765,942 SF 5,673,422 SF 9.19% 1,941,178 SF 2,617,047 SF 2,338,465 SF $7.42/SF
Dallas/Fort Worth Total 928,656,554 SF 56,726,317 SF 6.11% 11,677,592 SF 13,171,877 SF 32,658,397 SF $6.56/SF
MARKET BEAT
INDUSTRIAL SUBMARKET REPORT
Market Insights: The E DFW Airport/Las Colinas Submarket ended the second quarter of 2019 with a vacancy rate of 9.19%. The vacancy rate decreased from the previous quarter, with a YTD net absorption of 1,941,178 SF to finish Q2 2019. Rental rates ended the second quarter at $7.42/SF across all classes, increasing from $7.27/SF in the previous quarter. New construction deliveries increased from 517,887 SF to 2,617,047 SF, and there is currently 2,338,465 SF under construction in the submarket. Despite ranking among the most supply-heavy submarkets in the metroplex this cycle, fundamentals in East DFW Airport/Las Colinas have remained healthy over the past few years. Due to land constraints, virtually all current and future construction will take place on land owned by Dallas/Fort Worth International Airport. Rent growth continues to move in the right direction, and with vacancies below the submarket's historical average, growth could remain strong in the near term.
E DFW Airport/Las Colinas | Q2 2019
400 S Record Street Suite 1100
Dallas, TX 75202
(214) 380-4540 [email protected]
201 Main Street Suite 600
Fort Worth, TX 76102
(817) 502-1518
5830 Granite Parkway Suite 100
Plano, TX 75024
(214) 380-4540
(500,000) -
500,000 1,000,000 1,500,000 2,000,000 2,500,000
Q22018
Q32018
Q42018
Q12019
Q22019
Net Absorption
$0.00
$2.00
$4.00
$6.00
$8.00
Q22018
Q32018
Q42018
Q12019
Q22019
Gross Asking Rents/SF
0.0%
5.0%
10.0%
$0.00$2.00$4.00$6.00$8.00
Q22018
Q32018
Q42018
Q12019
Q22019
Vacancy Vs Rental Rate
Rental Rate Vacancy2

East Dallas Mesquite Ind
Legend
Central East Dallas Ind
EastDallasIndustrialMarket
N
Loop12
75
30
80
635
20
30
175
45
35E DallasNorth
Tollway
WoodallRodgersFreeway

The market terms, definitions, and statistics in this report are based on CoStar Group, Inc. office statistics. The information contained is gathered from multiple sources considered to be reliable. No warranty or representation, express or implied, is made to the accuracy or completeness of the information contained herein, and same is submitted subject to errors, omissions, change of price,
rental or other conditions, withdrawal without notice, and to any special listing conditions imposed by our principals. © 2017 Whitebox Real Estate, LLC | Data from Costar, Inc
Market Snapshot Rental Rates Vacancy
Under Construction Inventory
Market Statistics
Inventory Total Vacancy SF
Vacancy Rate
YTD Net Absorption
YTD Deliveries
Under Construction
Rates - All Classes
Central East Dallas 19,910,764 SF 473,860 SF 2.38% 22,833 SF 0 SF 0 SF $6.62/SF
Dallas/Fort Worth Total 928,656,554 SF 56,726,317 SF 6.11% 11,677,592 SF 13,171,877 SF 32,658,397 SF $6.56/SF
MARKET BEAT
INDUSTRIAL SUBMARKET REPORT
Market Insights: The Central East Dallas Submarket ended the second quarter of 2019 with a vacancy rate of 2.38%. The vacancy rate decreased from the previous quarter, with a YTD net absorption of 22,833 SF to finish Q2 2019. Rental rates ended the second quarter at $6.62/SF across all classes, increasing from $6.55/SF in the previous quarter. As with the previous quarter, there were no new deliveries in Q2 2019, and there is currently 0 SF under construction in the submarket. Vacancies are tight, and there usually isn't much tenant movement in or out of this submarket. Construction is rare, and the only large-scale building added this cycle was a 90,000 SF expansion to the Schepps Dairy facility east of Fair Park. If anything, the submarket is more likely to see a reduction of inventory in the coming years, as developers continue to eye older or obsolete industrial facilities in the urban core for potential office or apartment conversions.
Central East Dallas | Q2 2019
400 S Record Street Suite 1100
Dallas, TX 75202
(214) 380-4540 [email protected]
201 Main Street Suite 600
Fort Worth, TX 76102
(817) 502-1518
5830 Granite Parkway Suite 100
Plano, TX 75024
(214) 380-4540
(40,000) (30,000) (20,000) (10,000)
- 10,000 20,000 30,000
Q22018
Q32018
Q42018
Q12019
Q22019
Net Absorption
$- $2.00 $4.00 $6.00 $8.00
$10.00
Q22018
Q32018
Q42018
Q12019
Q22019
Gross Asking Rents/SF
2.0%2.1%2.2%2.3%2.4%2.5%
$0.00
$5.00
$10.00
Q22018
Q32018
Q42018
Q12019
Q22019
Vacancy Vs Rental Rate
Rental Rate Vacancy2

The market terms, definitions, and statistics in this report are based on CoStar Group, Inc. office statistics. The information contained is gathered from multiple sources considered to be reliable. No warranty or representation, express or implied, is made to the accuracy or completeness of the information contained herein, and same is submitted subject to errors, omissions, change of price,
rental or other conditions, withdrawal without notice, and to any special listing conditions imposed by our principals. © 2017 Whitebox Real Estate, LLC | Data from Costar, Inc
Market Snapshot Rental Rates Vacancy
Under Construction Inventory
Market Statistics
Inventory Total Vacancy SF
Vacancy Rate
YTD Net Absorption
YTD Deliveries
Under Construction
Rates - All Classes
East Dallas/ Mesquite 23,305,453 SF 1,627,259 SF 6.98% 1,122,188 SF 1,022,130 SF 1,070,452 SF $5.93/SF
Dallas/Fort Worth Total 928,656,554 SF 56,726,317 SF 6.11% 11,677,592 SF 13,171,877 SF 32,658,397 SF $6.56/SF
MARKET BEAT
INDUSTRIAL SUBMARKET REPORT
Market Insights: The East Dallas/Mesquite Submarket ended the second quarter of 2019 with a vacancy rate of 6.98%. The vacancy rate decreased from the previous quarter, with a YTD net absorption of 1,122,188 SF to finish Q2 2019. Rental rates ended the second quarter at $5.93/SF across all classes, decreasing from $6.34/SF in the previous quarter. New construction deliveries increased from 877,230 SF to 1,022,130 SF, and there is currently 1,070,452 SF under construction in the submarket. Vacancies in East Dallas/Mesquite have remained above the metro average this cycle but now closely align with the submarket's historical average. A large portion of recent new-builds were build-to-suits, including a 352,000-SF facility for FedEx Ground and a 877,000-SF facility for Ashley Furniture. In Q2 2018, Exeter Property Group broke ground on a four-building industrial park just west of the intermodal, totaling more than 1 million SF. All of the buildings were speculative, and the project is scheduled to complete in mid-2019.
East Dallas/Mesquite | Q2 2019
400 S Record Street Suite 1100
Dallas, TX 75202
(214) 380-4540 [email protected]
201 Main Street Suite 600
Fort Worth, TX 76102
(817) 502-1518
5830 Granite Parkway Suite 100
Plano, TX 75024
(214) 380-4540
(500,000)
-
500,000
1,000,000
1,500,000
Q22018
Q32018
Q42018
Q12019
Q22019
Net Absorption
$5.40 $5.60 $5.80 $6.00 $6.20 $6.40 $6.60 $6.80
Q22018
Q32018
Q42018
Q12019
Q22019
Gross Asking Rents/SF
0.0%
5.0%
10.0%
$5.50
$6.00
$6.50
$7.00
Q22018
Q32018
Q42018
Q12019
Q22019
Vacancy Vs Rental Rate
Rental Rate Vacancy2

Lower Great Southwest Ind
Arlington Ind
Legend
Upper Great Southwest Ind
Great SWArlingtonIndustrialMarket
N
30W
183
360
161
20
287

The market terms, definitions, and statistics in this report are based on CoStar Group, Inc. office statistics. The information contained is gathered from multiple sources considered to be reliable. No warranty or representation, express or implied, is made to the accuracy or completeness of the information contained herein, and same is submitted subject to errors, omissions, change of price,
rental or other conditions, withdrawal without notice, and to any special listing conditions imposed by our principals. © 2017 Whitebox Real Estate, LLC | Data from Costar, Inc
Market Snapshot Rental Rates Vacancy
Under Construction Inventory
Market Statistics
Inventory Total Vacancy SF
Vacancy Rate
YTD Net Absorption
YTD Deliveries
Under Construction
Rates - All Classes
Lower Great Southwest 39,591,263 SF 1,305,695 SF 3.30% 1,954,452 SF 2,328,173 SF 190,730 SF $5.47/SF
Dallas/Fort Worth Total 928,656,554 SF 56,726,317 SF 6.11% 11,677,592 SF 13,171,877 SF 32,658,397 SF $6.56/SF
MARKET BEAT
INDUSTRIAL SUBMARKET REPORT
Market Insights: The Lower Great Southwest Submarket ended the second quarter of 2019 with a vacancy rate of 3.30%. The vacancy rate increased from the previous quarter, with a YTD net absorption of 1,954,452 SF to finish Q2 2019. Rental rates ended the second quarter at $5.47/SF across all classes, decreasing from $5.67/SF in the previous quarter. New construction deliveries increased from 1,200,000 SF to 2,328,173 SF, and there is currently 190,730 SF under construction in the submarket. Vacancies in Lower Great Southwest are well below the submarket's historical average and have leveled off in recent years after compressing dramatically early this cycle. The submarket hasn't seen as much new supply as the Upper Great Southwest, but a handful of major projects have delivered in recent years. Rents are below the metro average but rent growth has continued to outperform historical norms. Roughly 80% of Lower Great Southwest’s total inventory was built prior to 1990.
Lower Great Southwest | Q2 2019
400 S Record Street Suite 1100
Dallas, TX 75202
(214) 380-4540 [email protected]
201 Main Street Suite 600
Fort Worth, TX 76102
(817) 502-1518
5830 Granite Parkway Suite 100
Plano, TX 75024
(214) 380-4540
(1,500,000) (1,000,000)
(500,000) -
500,000 1,000,000 1,500,000 2,000,000 2,500,000
Q22018
Q32018
Q42018
Q12019
Q22019
Net Absorption
$5.20$5.40$5.60$5.80$6.00$6.20
Q22018
Q32018
Q42018
Q12019
Q22019
Gross Asking Rents/SF
0.00%
2.00%
4.00%
6.00%
500.0%
550.0%
600.0%
650.0%
Q22018
Q32018
Q42018
Q12019
Q22019
Vacancy Vs Rental Rate
Rental Rate Vacancy2

The market terms, definitions, and statistics in this report are based on CoStar Group, Inc. office statistics. The information contained is gathered from multiple sources considered to be reliable. No warranty or representation, express or implied, is made to the accuracy or completeness of the information contained herein, and same is submitted subject to errors, omissions, change of price,
rental or other conditions, withdrawal without notice, and to any special listing conditions imposed by our principals. © 2017 Whitebox Real Estate, LLC | Data from Costar, Inc
Market Snapshot Rental Rates Vacancy
Under Construction Inventory
Market Statistics
Inventory Total Vacancy SF
Vacancy Rate
YTD Net Absorption
YTD Deliveries
Under Construction
Rates - All Classes
Upper Great Southwest 53,688,101 SF 2,864,316 SF 5.34% 836,025 SF 465,117 SF 1,591,112 SF $6.46/SF
Dallas/Fort Worth Total 928,656,554 SF 56,726,317 SF 6.11% 11,677,592 SF 13,171,877 SF 32,658,397 SF $6.56/SF
MARKET BEAT
INDUSTRIAL SUBMARKET REPORT
Market Insights: The Upper Great Southwest Submarket ended the second quarter of 2019 with a vacancy rate of 5.34%. The vacancy rate decreased from the previous quarter, with a YTD net absorption of 836,025 SF to finish Q2 2019. Rental rates ended the second quarter at $6.46/SF across all classes, increasing from $5.88/SF in the previous quarter. New construction deliveries increased from 352,617 SF to 465,117 SF, and there is currently 1,591,112 SF under construction in the submarket. The Upper Great Southwest is one of the largest industrial submarkets in the metroplex and is often a hotspot for speculative supply. Though occupancies have recovered from the most recent supply wave, with 1.5 M SF under construction, another round of spec projects is set to deliver over the next few quarters. Fundamentals are likely to take another hit, at least temporarily. However, rent growth has remained robust, hovering around 6%, even through the latest vacancy expansion.
Upper Great Southwest | Q2 2019
400 S Record Street Suite 1100
Dallas, TX 75202
(214) 380-4540 [email protected]
201 Main Street Suite 600
Fort Worth, TX 76102
(817) 502-1518
5830 Granite Parkway Suite 100
Plano, TX 75024
(214) 380-4540
-
1,000,000
2,000,000
3,000,000
4,000,000
5,000,000
Q22018
Q32018
Q42018
Q12019
Q22019
Net Absorption
$-
$2.00
$4.00
$6.00
$8.00
Q22018
Q32018
Q42018
Q12019
Q22019
Gross Asking Rents/SF
0.0%
5.0%
10.0%
$0.00$2.00$4.00$6.00$8.00
Q22018
Q32018
Q42018
Q12019
Q22019
Vacancy Vs Rental Rate
Rental Rate Vacancy2

The market terms, definitions, and statistics in this report are based on CoStar Group, Inc. office statistics. The information contained is gathered from multiple sources considered to be reliable. No warranty or representation, express or implied, is made to the accuracy or completeness of the information contained herein, and same is submitted subject to errors, omissions, change of price,
rental or other conditions, withdrawal without notice, and to any special listing conditions imposed by our principals. © 2017 Whitebox Real Estate, LLC | Data from Costar, Inc
Market Snapshot Rental Rates Vacancy
Under Construction Inventory
Market Statistics
Inventory Total Vacancy SF
Vacancy Rate
YTD Net Absorption
YTD Deliveries
Under Construction
Rates - All Classes
Arlington 24,055,225 SF 1,318,241 SF 5.48% 122,654 SF 310,794 SF 933,431 SF $6.72/SF
Dallas/Fort Worth Total 928,656,554 SF 56,726,317 SF 6.11% 11,677,592 SF 13,171,877 SF 32,658,397 SF $6.56/SF
MARKET BEAT
INDUSTRIAL SUBMARKET REPORT
Market Insights: The Arlington Submarket ended the second quarter of 2019 with a vacancy rate of 5.48%. The vacancy rate decreased from the previous quarter, with a YTD net absorption of 122,654 SF to finish Q2 2019. Rental rates ended the second quarter at $6.72/SF across all classes, decreasing from $7.90/SF in the previous quarter. New construction deliveries increased from 271,794 SF to 310,794 SF, and there is currently 933,431 SF under construction in the submarket. After a supply-driven vacancy spike in 2017, occupancies have recovered in recent quarters due to several major leases. A large chunk of the space that delivered in 2017 was taken by large, single-tenant users like Summit Racing Equipment (750,000 SF in Q3 2017) and UPS (1 million SF in Q4 2017). Supply has slowed dramatically since then as well. About 500,000 SF delivered in 2018 and 933,431 SF is under construction.
Arlington | Q2 2019
400 S Record Street Suite 1100
Dallas, TX 75202
(214) 380-4540 [email protected]
201 Main Street Suite 600
Fort Worth, TX 76102
(817) 502-1518
5830 Granite Parkway Suite 100
Plano, TX 75024
(214) 380-4540
(500,000) -
500,000 1,000,000 1,500,000 2,000,000 2,500,000
Q22018
Q32018
Q42018
Q12019
Q22019
Net Absorption
$0.00$2.00$4.00$6.00$8.00
$10.00
Q22018
Q32018
Q42018
Q12019
Q22019
Gross Asking Rents/SF
0.00%2.00%4.00%6.00%8.00%
$3.00
$5.00
$7.00
$9.00
Q22018
Q32018
Q42018
Q12019
Q22019
Vacancy Vs Rental Rate
Rental Rate Vacancy2

NE Tarrant/Alliance Ind
Legend
Meacham Fld/Fossil Cr Ind
N FTW &AllianceIndustrialMarket
N
35W
114
377
170
820
AllianceAirport
BNSFINTERMODAL

The market terms, definitions, and statistics in this report are based on CoStar Group, Inc. office statistics. The information contained is gathered from multiple sources considered to be reliable. No warranty or representation, express or implied, is made to the accuracy or completeness of the information contained herein, and same is submitted subject to errors, omissions, change of price,
rental or other conditions, withdrawal without notice, and to any special listing conditions imposed by our principals. © 2017 Whitebox Real Estate, LLC | Data from Costar, Inc
Market Snapshot Rental Rates Vacancy
Under Construction Inventory
Market Statistics
Inventory Total Vacancy SF
Vacancy Rate
YTD Net Absorption
YTD Deliveries
Under Construction
Rates - All Classes
NE Tarrant/ Alliance 48,786,613 SF 4,563,777 SF 9.35% 1,524,122 SF 1,655,676 SF 8,834,683 SF $5.85/SF
Dallas/Fort Worth Total 928,656,554 SF 56,726,317 SF 6.11% 11,677,592 SF 13,171,877 SF 32,658,397 SF $6.56/SF
MARKET BEAT
INDUSTRIAL SUBMARKET REPORT
Market Insights: The NE Tarrant/Alliance Submarket ended the second quarter of 2019 with a vacancy rate of 9.35%. The vacancy rate decreased from the previous quarter, with a YTD net absorption of 1,524,122 SF to finish Q2 2019. Rental rates ended the second quarter at $5.85/SF across all classes, decreasing from $7.21/SF in the previous quarter. New construction deliveries increased from 1,234,876 SF to 1,655,676 SF, and there is currently 8,834,683 SF under construction in the submarket. This submarket has been one of the most active in the metroplex in terms of new supply this cycle. Due to spec construction, vacancies generally trend above the metro average, even when net absorption continues to outperform historical norms. Like the metro as a whole, year-over-year rent growth averages just about 6%. The high proportion of big-box inventory in NE Tarrant/Alliance makes the submarket attractive to institutional investors, and buildings often change hands as part of national or multi-market portfolio sales.
NE Tarrant/Alliance | Q2 2019
400 S Record Street Suite 1100
Dallas, TX 75202
(214) 380-4540 [email protected]
201 Main Street Suite 600
Fort Worth, TX 76102
(817) 502-1518
5830 Granite Parkway Suite 100
Plano, TX 75024
(214) 380-4540
-
500,000
1,000,000
1,500,000
2,000,000
2,500,000
Q22018
Q32018
Q42018
Q12019
Q22019
Net Absorption
$-
$2.00
$4.00
$6.00
$8.00
Q22018
Q32018
Q42018
Q12019
Q22019
Gross Asking Rents/SF
0.0%
5.0%
10.0%
$0.00$2.00$4.00$6.00$8.00
Q22018
Q32018
Q42018
Q12019
Q22019
Vacancy Vs Rental Rate
Rental Rate Vacancy2

The market terms, definitions, and statistics in this report are based on CoStar Group, Inc. office statistics. The information contained is gathered from multiple sources considered to be reliable. No warranty or representation, express or implied, is made to the accuracy or completeness of the information contained herein, and same is submitted subject to errors, omissions, change of price,
rental or other conditions, withdrawal without notice, and to any special listing conditions imposed by our principals. © 2017 Whitebox Real Estate, LLC | Data from Costar, Inc
Market Snapshot Rental Rates Vacancy
Under Construction Inventory
Market Statistics
Inventory Total Vacancy SF
Vacancy Rate
YTD Net Absorption
YTD Deliveries
Under Construction
Rates - All Classes
Meacham Field/ Fossil Creek 44,181,409 SF 2,107,622 SF 4.77% 878,222 SF 638,029 SF 2,343,477 SF $5.07/SF
Dallas/Fort Worth Total 928,656,554 SF 56,726,317 SF 6.11% 11,677,592 SF 13,171,877 SF 32,658,397 SF $6.56/SF
MARKET BEAT
INDUSTRIAL SUBMARKET REPORT
Market Insights: The Meacham Field/Fossil Creek Submarket ended the second quarter of 2019 with a vacancy rate of 4.77%. The vacancy rate decreased from the previous quarter, with a YTD net absorption of 878,222 SF to finish Q2 2019. Rental rates ended the second quarter at $5.07/SF across all classes, decreasing from $5.31/SF in the previous quarter. New construction deliveries remained steady at 638,029 SF, and there is currently 2,343,477 SF under construction in the submarket. The submarket saw a massive supply spike in 2016, but fundamentals have recovered since then. Vacancies have trended below the metro average in recent years and rent growth continues to well outperform historical norms. Meacham Field/Fossil Creek is one of the more liquid submarkets in the metroplex, as roughly 10% of the submarket's inventory has changed hands on average annually in recent years.
Meacham Field/Fossil Creek | Q2 2019
400 S Record Street Suite 1100
Dallas, TX 75202
(214) 380-4540 [email protected]
201 Main Street Suite 600
Fort Worth, TX 76102
(817) 502-1518
5830 Granite Parkway Suite 100
Plano, TX 75024
(214) 380-4540
-
200,000
400,000
600,000
800,000
1,000,000
Q22018
Q32018
Q42018
Q12019
Q22019
Net Absorption
$4.50
$5.00
$5.50
$6.00
$6.50
Q22018
Q32018
Q42018
Q12019
Q22019
Gross Asking Rents/SF
0.00%
2.00%
4.00%
6.00%
$4.50 $5.00 $5.50 $6.00 $6.50
Q22018
Q32018
Q42018
Q12019
Q22019
Vacancy Vs Rental Rate
Rental Rate Vacancy2

Plano Ind
Allen/McKinney Ind
NE Dallas/Garland Ind
Legend
Richardson Ind
NortheastDallasIndustrialMarket
N
30E
380
635/LBJ
PresidentGeorge Bush
Turnpike
121/Sam Rayburn
Tollway
DallasNorth
Tollway
75/CentralExpressway

The market terms, definitions, and statistics in this report are based on CoStar Group, Inc. office statistics. The information contained is gathered from multiple sources considered to be reliable. No warranty or representation, express or implied, is made to the accuracy or completeness of the information contained herein, and same is submitted subject to errors, omissions, change of price,
rental or other conditions, withdrawal without notice, and to any special listing conditions imposed by our principals. © 2017 Whitebox Real Estate, LLC | Data from Costar, Inc
Market Snapshot Rental Rates Vacancy
Under Construction Inventory
Market Statistics
Inventory Total Vacancy SF
Vacancy Rate
YTD Net Absorption
YTD Deliveries
Under Construction
Rates - All Classes
Allen/McKinney 13,185,928 SF 780,102 SF 5.92% -92,493 SF 72,000 SF 186,404 SF $8.00/SF
Dallas/Fort Worth Total 928,656,554 SF 56,726,317 SF 6.11% 11,677,592 SF 13,171,877 SF 32,658,397 SF $6.56/SF
MARKET BEAT
INDUSTRIAL SUBMARKET REPORT
Market Insights: The Allen/McKinney Submarket ended the second quarter of 2019 with a vacancy rate of 5.92%. The vacancy rate increased from the previous quarter, with a YTD net absorption of -92,493 SF to finish Q2 2019. Rental rates ended the second quarter at $8.00/SF across all classes, increasing from $7.90/SF in the previous quarter. New construction deliveries increased from 0 SF to 72,000 SF, and there is currently 186,404 SF under construction in the submarket. As the demographic growth in the metroplex continues to push northward, industrial tenants have gobbled up virtually all available space here. Most supply has come either in the form of build-to-suits for companies like KONE and WatchGuard, or are data centers. However, a few large speculative projects have delivered in recent quarters, and even more is under construction or proposed. Asking rents are some of the highest in all of D-FW and are about 35% above where they were prerecession.
Allen/McKinney | Q2 2019
400 S Record Street Suite 1100
Dallas, TX 75202
(214) 380-4540 [email protected]
201 Main Street Suite 600
Fort Worth, TX 76102
(817) 502-1518
5830 Granite Parkway Suite 100
Plano, TX 75024
(214) 380-4540
(200,000)
-
200,000
400,000
600,000
800,000
Q22018
Q32018
Q42018
Q12019
Q22019
Net Absorption
$7.40
$7.60
$7.80
$8.00
$8.20
Q22018
Q32018
Q42018
Q12019
Q22019
Gross Asking Rents/SF
0.0%2.0%4.0%6.0%8.0%
$7.40$7.60$7.80$8.00$8.20
Q22018
Q32018
Q42018
Q12019
Q22019
Vacancy Vs Rental Rate
Rental Rate Vacancy2

The market terms, definitions, and statistics in this report are based on CoStar Group, Inc. office statistics. The information contained is gathered from multiple sources considered to be reliable. No warranty or representation, express or implied, is made to the accuracy or completeness of the information contained herein, and same is submitted subject to errors, omissions, change of price,
rental or other conditions, withdrawal without notice, and to any special listing conditions imposed by our principals. © 2017 Whitebox Real Estate, LLC | Data from Costar, Inc
Market Snapshot Rental Rates Vacancy
Under Construction Inventory
Market Statistics
Inventory Total Vacancy SF
Vacancy Rate
YTD Net Absorption
YTD Deliveries
Under Construction
Rates - All Classes
Plano 23,889,546 SF 1,789,338 SF 7.49% -190,724 SF 321,516 SF 483,656 SF $10.62/SF
Dallas/Fort Worth Total 928,656,554 SF 56,726,317 SF 6.11% 11,677,592 SF 13,171,877 SF 32,658,397 SF $6.56/SF
MARKET BEAT
INDUSTRIAL SUBMARKET REPORT
Market Insights: The Plano Submarket ended the second quarter of 2019 with a vacancy rate of 7.49%. The vacancy rate increased from the previous quarter, with a YTD net absorption of -190,724 SF to finish Q2 2019. Rental rates ended the second quarter at $10.62/SF across all classes, increasing from $10.53/SF in the previous quarter. New construction deliveries increased from 248,515 SF to 321,516 SF, and there is currently 483,656 SF under construction in the submarket. Plano’s location in the heart of the affluent northern Dallas suburbs also makes it ideal for tenants seeking space for last-mile distribution. Fundamentals in Plano are strong, with vacancies hovering around the metro average for the past few years. Due to rising land costs, rents are some of the highest in the metro, and rent growth has performed well this cycle. Plano industrial has been heavily traded this cycle, with inventory turnover routinely eclipsing 10% annually.
Plano | Q2 2019
400 S Record Street Suite 1100
Dallas, TX 75202
(214) 380-4540 [email protected]
201 Main Street Suite 600
Fort Worth, TX 76102
(817) 502-1518
5830 Granite Parkway Suite 100
Plano, TX 75024
(214) 380-4540
(400,000) (200,000)
- 200,000 400,000 600,000 800,000
Q22018
Q32018
Q42018
Q12019
Q22019
Net Absorption
$10.40
$10.50
$10.60
$10.70
$10.80
Q22018
Q32018
Q42018
Q12019
Q22019
Gross Asking Rents/SF
0.00%2.00%4.00%6.00%8.00%
$10.40 $10.50 $10.60 $10.70 $10.80
Q22018
Q32018
Q42018
Q12019
Q22019
Vacancy Vs Rental Rate
Rental Rate Vacancy2

The market terms, definitions, and statistics in this report are based on CoStar Group, Inc. office statistics. The information contained is gathered from multiple sources considered to be reliable. No warranty or representation, express or implied, is made to the accuracy or completeness of the information contained herein, and same is submitted subject to errors, omissions, change of price,
rental or other conditions, withdrawal without notice, and to any special listing conditions imposed by our principals. © 2017 Whitebox Real Estate, LLC | Data from Costar, Inc
Market Snapshot Rental Rates Vacancy
Under Construction Inventory
Market Statistics
Inventory Total Vacancy SF
Vacancy Rate
YTD Net Absorption
YTD Deliveries
Under Construction
Rates - All Classes
Richardson 19,007,671 SF 1,508,969 SF 7.94% -34,427 SF 434,640 SF 205,812 SF $9.17/SF
Dallas/Fort Worth Total 928,656,554 SF 56,726,317 SF 6.11% 11,677,592 SF 13,171,877 SF 32,658,397 SF $6.56/SF
MARKET BEAT
INDUSTRIAL SUBMARKET REPORT
Market Insights: The Richardson Submarket ended the second quarter of 2019 with a vacancy rate of 7.94%. The vacancy rate decreased from the previous quarter, with a YTD net absorption of -34,427 SF to finish Q2 2019. Rental rates ended the second quarter at $9.17/SF across all classes, increasing from $8.72/SF in the previous quarter. New construction deliveries remained steady at 434,640 SF, and there is currently 205,812 SF under construction in the submarket. Richardson, home to the Telecom Corridor, serves as a primary suburban office submarket. While it is not much of a warehouse/distribution node, it does hold abundant specialized industrial and flex space. Data centers have accounted for virtually all new construction since 2010, but there are a few smaller speculative non-data center projects that opened in recent quarters. Due to the flex-heavy inventory, rents are some of the highest in the metroplex. Vacancies are now back above metro average, but large blocks of space are rare.
Richardson | Q2 2019
400 S Record Street Suite 1100
Dallas, TX 75202
(214) 380-4540 [email protected]
201 Main Street Suite 600
Fort Worth, TX 76102
(817) 502-1518
5830 Granite Parkway Suite 100
Plano, TX 75024
(214) 380-4540
(100,000)
(50,000)
-
50,000
100,000
150,000
Q22018
Q32018
Q42018
Q12019
Q22019
Net Absorption
$8.20$8.40$8.60$8.80$9.00$9.20$9.40
Q22018
Q32018
Q42018
Q12019
Q22019
Gross Asking Rents/SF
0.0%
5.0%
10.0%
$8.00
$8.50
$9.00
$9.50
Q22018
Q32018
Q42018
Q12019
Q22019
Vacancy Vs Rental Rate
Rental Rate Vacancy2

The market terms, definitions, and statistics in this report are based on CoStar Group, Inc. office statistics. The information contained is gathered from multiple sources considered to be reliable. No warranty or representation, express or implied, is made to the accuracy or completeness of the information contained herein, and same is submitted subject to errors, omissions, change of price,
rental or other conditions, withdrawal without notice, and to any special listing conditions imposed by our principals. © 2017 Whitebox Real Estate, LLC | Data from Costar, Inc
Market Snapshot Rental Rates Vacancy
Under Construction Inventory
Market Statistics
Inventory Total Vacancy SF
Vacancy Rate
YTD Net Absorption
YTD Deliveries
Under Construction
Rates - All Classes
NE Dallas/ Garland 53,046,772 SF 3,109,383 SF 5.86% 388,350 SF 249,166 SF 763,132 SF $5.07/SF
Dallas/Fort Worth Total 928,656,554 SF 56,726,317 SF 6.11% 11,677,592 SF 13,171,877 SF 32,658,397 SF $6.56/SF
MARKET BEAT
INDUSTRIAL SUBMARKET REPORT
Market Insights: The NE Dallas/Garland Submarket ended the second quarter of 2019 with a vacancy rate of 5.86%. The vacancy rate decreased from the previous quarter, with a YTD net absorption of 388,350 SF to finish Q2 2019. Rental rates ended the second quarter at $5.07/SF across all classes, decreasing from $5.63/SF in the previous quarter. New construction deliveries remained steady at 249,166 SF, and there is currently 763,132 SF under construction in the submarket. Fundamentals in NE Dallas/Garland are in a solid position, with vacancies staying below the submarket's historical average for the past few years. Despite near record supply levels over the past few years, vacancies have hardly budged. Furthermore, leasing on new and under-construction inventory has been strong, which should keep vacancies well below the submarket's historical average in the near term.
NE Dallas/Garland | Q2 2019
400 S Record Street Suite 1100
Dallas, TX 75202
(214) 380-4540 [email protected]
201 Main Street Suite 600
Fort Worth, TX 76102
(817) 502-1518
5830 Granite Parkway Suite 100
Plano, TX 75024
(214) 380-4540
- 200,000 400,000 600,000 800,000
1,000,000 1,200,000 1,400,000
Q22018
Q32018
Q42018
Q12019
Q22019
Net Absorption
$4.50
$5.00
$5.50
$6.00
Q22018
Q32018
Q42018
Q12019
Q22019
Gross Asking Rents/SF
5.40%5.60%5.80%6.00%6.20%6.40%
$4.50
$5.00
$5.50
$6.00
Q22018
Q32018
Q42018
Q12019
Q22019
Vacancy Vs Rental Rate
Rental Rate Vacancy2

Lewisville Ind
Metropolitan/Addison Ind
Legend
N Stemmons/Valwood Ind
Valwood/LewisvilleIndustrialMarket
N
35E
121
377
635/LBJ
PresidentGeorge Bush
Turnpike
CrossTimbers
Road
121/Sam Rayburn
Tollway
DallasNorth
Tollway

The market terms, definitions, and statistics in this report are based on CoStar Group, Inc. office statistics. The information contained is gathered from multiple sources considered to be reliable. No warranty or representation, express or implied, is made to the accuracy or completeness of the information contained herein, and same is submitted subject to errors, omissions, change of price,
rental or other conditions, withdrawal without notice, and to any special listing conditions imposed by our principals. © 2017 Whitebox Real Estate, LLC | Data from Costar, Inc
Market Snapshot Rental Rates Vacancy
Under Construction Inventory
Market Statistics
Inventory Total Vacancy SF
Vacancy Rate
YTD Net Absorption
YTD Deliveries
Under Construction
Rates - All Classes
Lewisville 28,087,195 SF 965,109 SF 3.44% 1,157,278 SF 634,564 SF 1,408,939 SF $10.40/SF
Dallas/Fort Worth Total 928,656,554 SF 56,726,317 SF 6.11% 11,677,592 SF 13,171,877 SF 32,658,397 SF $6.56/SF
MARKET BEAT
INDUSTRIAL SUBMARKET REPORT
Market Insights: The Lewisville Submarket ended the second quarter of 2019 with a vacancy rate of 3.44%. The vacancy rate increased from the previous quarter, with a YTD net absorption of 1,157,278 SF to finish Q2 2019. Rental rates ended the second quarter at $10.40/SF across all classes, increasing from $8.34/SF in the previous quarter. New construction deliveries increased from 0 SF to 634,564 SF, and there is currently 1,408,939 SF under construction in the submarket. Fundamentals in Lewisville are strong, and vacancies are less than half the submarket's historical average. New projects have leased quickly: roughly 7 million SF delivered from 2010-18, and nearly all of that was accounted for by the start of 2019. In major upcoming moves, Thirty-One Gifts moved into a 651,500 SF asset in early 2019, and PPG Paints is taking 449,000 SF in Q2 2019.
Lewisville | Q2 2019
400 S Record Street Suite 1100
Dallas, TX 75202
(214) 380-4540 [email protected]
201 Main Street Suite 600
Fort Worth, TX 76102
(817) 502-1518
5830 Granite Parkway Suite 100
Plano, TX 75024
(214) 380-4540
(500,000)
-
500,000
1,000,000
1,500,000
Q22018
Q32018
Q42018
Q12019
Q22019
Net Absorption
$- $2.00 $4.00 $6.00 $8.00
$10.00 $12.00
Q22018
Q32018
Q42018
Q12019
Q22019
Gross Asking Rents/SF
0.0%
2.0%
4.0%
6.0%
$0.00
$5.00
$10.00
$15.00
Q22018
Q32018
Q42018
Q12019
Q22019
Vacancy Vs Rental Rate
Rental Rate Vacancy2

The market terms, definitions, and statistics in this report are based on CoStar Group, Inc. office statistics. The information contained is gathered from multiple sources considered to be reliable. No warranty or representation, express or implied, is made to the accuracy or completeness of the information contained herein, and same is submitted subject to errors, omissions, change of price,
rental or other conditions, withdrawal without notice, and to any special listing conditions imposed by our principals. © 2017 Whitebox Real Estate, LLC | Data from Costar, Inc
Market Snapshot Rental Rates Vacancy
Under Construction Inventory
Market Statistics
Inventory Total Vacancy SF
Vacancy Rate
YTD Net Absorption
YTD Deliveries
Under Construction
Rates - All Classes
N Stemmons/ Valwood 51,758,106 SF 2,180,294 SF 4.21% -58,873 SF 151,176 SF 674,414 SF $5.87/SF
Dallas/Fort Worth Total 928,656,554 SF 56,726,317 SF 6.11% 11,677,592 SF 13,171,877 SF 32,658,397 SF $6.56/SF
MARKET BEAT
INDUSTRIAL SUBMARKET REPORT
Market Insights: The N Stemmons/Valwood Submarket ended the second quarter of 2019 with a vacancy rate of 4.21%. The vacancy rate decreased from the previous quarter, with a YTD net absorption of -58,873 SF to finish Q2 2019. Rental rates ended the second quarter at $5.87/SF across all classes, increasing from $5.85/SF in the previous quarter. YTD new construction deliveries have remained steady at 151,176 SF, and there is currently 674,414 SF under construction in the submarket. Fundamentals in North Stemmons/Valwood are strong, as tenants have gobbled up nearly all large blocks of space. Though new supply has picked up in recent years, demand continues to keep pace with new deliveries, which should keep vacancies below the metro and historical averages in the near term. Although sales volume has slowed in recent years, North Stemmons/Valwood is still one of the most actively traded submarkets in the metro, and many deals involve national or institutional buyers and sellers.
N Stemmons/Valwood | Q2 2019
400 S Record Street Suite 1100
Dallas, TX 75202
(214) 380-4540 [email protected]
201 Main Street Suite 600
Fort Worth, TX 76102
(817) 502-1518
5830 Granite Parkway Suite 100
Plano, TX 75024
(214) 380-4540
(400,000) (200,000)
- 200,000 400,000 600,000 800,000
Q22018
Q32018
Q42018
Q12019
Q22019
Net Absorption
$5.40$5.50$5.60$5.70$5.80$5.90
Q22018
Q32018
Q42018
Q12019
Q22019
Gross Asking Rents/SF
0.00%
2.00%
4.00%
6.00%
$5.40
$5.60
$5.80
$6.00
Q22018
Q32018
Q42018
Q12019
Q22019
Vacancy Vs Rental Rate
Rental Rate Vacancy2

The market terms, definitions, and statistics in this report are based on CoStar Group, Inc. office statistics. The information contained is gathered from multiple sources considered to be reliable. No warranty or representation, express or implied, is made to the accuracy or completeness of the information contained herein, and same is submitted subject to errors, omissions, change of price,
rental or other conditions, withdrawal without notice, and to any special listing conditions imposed by our principals. © 2017 Whitebox Real Estate, LLC | Data from Costar, Inc
Market Snapshot Rental Rates Vacancy
Under Construction Inventory
Market Statistics
Inventory Total Vacancy SF
Vacancy Rate
YTD Net Absorption
YTD Deliveries
Under Construction
Rates - All Classes
Metropolitan/ Addison 21,688,840 SF 1,302,038 SF 6. 0% 233,713 SF 0 SF 10,800 SF $8.11/SF
Dallas/Fort Worth Total 928,656,554 SF 56,726,317 SF 6.11% 11,677,592 SF 13,171,877 SF 32,658,397 SF $6.56/SF
MARKET BEAT
INDUSTRIAL SUBMARKET REPORT
Market Insights: The Metropolitan/Addison Submarket ended the second quarter of 2019 with a vacancy rate of 6. 0%. The vacancy rate decreased from the previous quarter, with a YTD net absorption of 233,713 SF to finish Q2 2019. Rental rates ended the second quarter at $8.11/SF across all classes, decreasing from $8.26/SF in the previous quarter. As with the previous quarter, there were no new deliveries in Q2 2019, and there is currently 10,800 SF under construction in the submarket. Metropolitan/Addison is largely built out, and only a few buildings have been constructed since 2000. Due to strong demand and a complete lack of new supply this cycle, vacancies in Metropolitan/Addison are below the submarket's historical average. However, absorption was negative in 2018 and not showing any movement in the right direction through the first half of 2019. With nothing in the pipeline and a lack of available, industrial-zoned land, vacancies may improve in the near term.
Metropolitan/Addison | Q2 2019
400 S Record Street Suite 1100
Dallas, TX 75202
(214) 380-4540 [email protected]
201 Main Street Suite 600
Fort Worth, TX 76102
(817) 502-1518
5830 Granite Parkway Suite 100
Plano, TX 75024
(214) 380-4540
(800,000) (600,000) (400,000) (200,000)
- 200,000 400,000
Q12018
Q22018
Q32018
Q42018
Q22019
Net Absorption
$7.00
$7.50
$8.00
$8.50
Q12018
Q22018
Q32018
Q42018
Q22019
Gross Asking Rents/SF
0.0%
5.0%
10.0%
$7.00
$7.50
$8.00
$8.50
Q12018
Q22018
Q32018
Q42018
Q22019
Vacancy Vs Rental Rate
Rental Rate Vacancy2

SW Dallas/US 67 Ind
Redbird Airport Ind
Outlying Ellis County Ind
Legend
SE Dallas/I-45 Ind
SouthDallasIndustrialMarket
N
20
35E
45
175
34
67
287
UNION PACIFICINTERMODAL

The market terms, definitions, and statistics in this report are based on CoStar Group, Inc. office statistics. The information contained is gathered from multiple sources considered to be reliable. No warranty or representation, express or implied, is made to the accuracy or completeness of the information contained herein, and same is submitted subject to errors, omissions, change of price,
rental or other conditions, withdrawal without notice, and to any special listing conditions imposed by our principals. © 2017 Whitebox Real Estate, LLC | Data from Costar, Inc
Market Snapshot Rental Rates Vacancy
Under Construction Inventory
Market Statistics
Inventory Total Vacancy SF
Vacancy Rate
YTD Net Absorption
YTD Deliveries
Under Construction
Rates - All Classes
Redbird Airport 20,480,870 SF 468,731 SF 2.29% -82,915 SF 0 SF 0 SF $3.85/SF
Dallas/Fort Worth Total 928,656,554 SF 56,726,317 SF 6.11% 11,677,592 SF 13,171,877 SF 32,658,397 SF $6.56/SF
MARKET BEAT
INDUSTRIAL SUBMARKET REPORT
Market Insights: The Redbird Airport Submarket ended the second quarter of 2019 with a vacancy rate of 2.29%. The vacancy rate increased from the previous quarter, with a YTD net absorption of -82,915 SF to finish Q2 2019. Rental rates ended the second quarter at $3.85/SF across all classes, decreasing from $3.87/SF in the previous quarter. As with the previous quarter, there were no new deliveries in Q2 2019, and there is currently 0 SF under construction in the submarket. Aside from a few supply-driven spikes, vacancies have trended well below the metro average over the past few years. Most new construction has occurred on the western side of the submarket, in the Mountain Creek Business Park, and that area has added some large users. While construction has tapered off in recent quarters, there are plans for a few more large distribution facilities at Mountain Creek, which could break ground in the near future.
Redbird Airport | Q2 2019
400 S Record Street Suite 1100
Dallas, TX 75202
(214) 380-4540 [email protected]
201 Main Street Suite 600
Fort Worth, TX 76102
(817) 502-1518
5830 Granite Parkway Suite 100
Plano, TX 75024
(214) 380-4540
(400,000)
(300,000)
(200,000)
(100,000)
-
100,000
Q22018
Q32018
Q42018
Q12019
Q22019
Net Absorption
$3.60
$3.80
$4.00
$4.20
$4.40
Q22018
Q32018
Q42018
Q12019
Q22019
Gross Asking Rents/SF
0.0%1.0%2.0%3.0%4.0%
$3.60$3.80$4.00$4.20$4.40
Q22018
Q32018
Q42018
Q12019
Q22019
Vacancy Vs Rental Rate
Rental Rate Vacancy2

The market terms, definitions, and statistics in this report are based on CoStar Group, Inc. office statistics. The information contained is gathered from multiple sources considered to be reliable. No warranty or representation, express or implied, is made to the accuracy or completeness of the information contained herein, and same is submitted subject to errors, omissions, change of price,
rental or other conditions, withdrawal without notice, and to any special listing conditions imposed by our principals. © 2017 Whitebox Real Estate, LLC | Data from Costar, Inc
Market Snapshot Rental Rates Vacancy
Under Construction Inventory
Market Statistics
Inventory Total Vacancy SF
Vacancy Rate
YTD Net Absorption
YTD Deliveries
Under Construction
Rates - All Classes
SW Dallas/US 67 31,066,201 SF 2,805,938 SF 9.03% -61,892 SF 0 SF 1,387,404 SF $4.27/SF
Dallas/Fort Worth Total 928,656,554 SF 56,726,317 SF 6.11% 11,677,592 SF 13,171,877 SF 32,658,397 SF $6.56/SF
MARKET BEAT
INDUSTRIAL SUBMARKET REPORT
Market Insights: The SW Dallas/US 67 Submarket ended the second quarter of 2019 with a vacancy rate of 9.03%. The vacancy rate increased from the previous quarter, with a YTD net absorption of -61,892 SF to finish Q2 2019. Rental rates ended the second quarter at $4.27/SF across all classes, increasing from $4.20/SF in the previous quarter. As with the previous quarter, there were no new deliveries in Q2 2019, and there is currently 1,387,404 SF under construction in the submarket. Vacancies have trended above the metro average over the past few years due to speculative construction. However, due to a few major move-ins, most notably by Kohler (1.3 million SF), vacancies are now as low as they've been since 2014. First Industrial Realty Trust recently broke ground on the 863,200/SF First Mountain Creek Distribution Center, located on the southeast the quadrant of Mountain Creek Parkway and I-20. The entire spec property has been preleased by HD Supply and is expected to deliver in late 2019
SW Dallas/US 67 | Q2 2019
400 S Record Street Suite 1100
Dallas, TX 75202
(214) 380-4540 [email protected]
201 Main Street Suite 600
Fort Worth, TX 76102
(817) 502-1518
5830 Granite Parkway Suite 100
Plano, TX 75024
(214) 380-4540
(500,000) -
500,000 1,000,000 1,500,000 2,000,000 2,500,000
Q22018
Q32018
Q42018
Q12019
Q22019
Net Absorption
$3.70$3.80$3.90$4.00$4.10$4.20$4.30
Q22018
Q32018
Q42018
Q12019
Q22019
Gross Asking Rents/SF
0.0%
5.0%
10.0%
15.0%
$3.60$3.80$4.00$4.20$4.40
Q22018
Q32018
Q42018
Q12019
Q22019
Vacancy Vs Rental Rate
Rental Rate Vacancy2

The market terms, definitions, and statistics in this report are based on CoStar Group, Inc. office statistics. The information contained is gathered from multiple sources considered to be reliable. No warranty or representation, express or implied, is made to the accuracy or completeness of the information contained herein, and same is submitted subject to errors, omissions, change of price,
rental or other conditions, withdrawal without notice, and to any special listing conditions imposed by our principals. © 2017 Whitebox Real Estate, LLC | Data from Costar, Inc
Market Snapshot Rental Rates Vacancy
Under Construction Inventory
Market Statistics
Inventory Total Vacancy SF
Vacancy Rate
YTD Net Absorption
YTD Deliveries
Under Construction
Rates - All Classes
SE Dallas/I-45 42,125,221 SF 8,442,134 SF 20.04% 640,578 SF 404,175 SF 3,443,266 SF $3.76/SF
Dallas/Fort Worth Total 928,656,554 SF 56,726,317 SF 6.11% 11,677,592 SF 13,171,877 SF 32,658,397 SF $6.56/SF
MARKET BEAT
INDUSTRIAL SUBMARKET REPORT
Market Insights: The SE Dallas/I-45 Submarket ended the second quarter of 2019 with a vacancy rate of 20.04%. The vacancy rate decreased from the previous quarter, with a YTD net absorption of 640,578 SF to finish Q2 2019. Rental rates ended the second quarter at $3.76/SF across all classes, decreasing from $3.78/SF in the previous quarter. New construction deliveries increased from 0 SF to 404,175 SF, and there is currently 3,443,266 SF under construction in the submarket. The SE Dallas/I-45 Submarket has received an incredible amount of supply over the past few years, more than doubling its inventory since 2013. As a result, vacancies shot up and have remained high. Since a large portion of the under-construction and recently delivered supply is speculative, vacancies should remain elevated even if absorption continues to perform at or near record levels.
SE Dallas/I-45 | Q2 2019
400 S Record Street Suite 1100
Dallas, TX 75202
(214) 380-4540 [email protected]
201 Main Street Suite 600
Fort Worth, TX 76102
(817) 502-1518
5830 Granite Parkway Suite 100
Plano, TX 75024
(214) 380-4540
(1,000,000)
-
1,000,000
2,000,000
3,000,000
4,000,000
Q22018
Q32018
Q42018
Q12019
Q22019
Net Absorption
$3.70$3.72$3.74$3.76$3.78$3.80
Q22018
Q32018
Q42018
Q12019
Q22019
Gross Asking Rents/SF
0.0%
10.0%
20.0%
30.0%
$3.70$3.72$3.74$3.76$3.78$3.80
Q22018
Q32018
Q42018
Q12019
Q22019
Vacancy Vs Rental Rate
Rental Rate Vacancy2

The market terms, definitions, and statistics in this report are based on CoStar Group, Inc. office statistics. The information contained is gathered from multiple sources considered to be reliable. No warranty or representation, express or implied, is made to the accuracy or completeness of the information contained herein, and same is submitted subject to errors, omissions, change of price,
rental or other conditions, withdrawal without notice, and to any special listing conditions imposed by our principals. © 2017 Whitebox Real Estate, LLC | Data from Costar, Inc
Market Snapshot Rental Rates Vacancy
Under Construction Inventory
Market Statistics
Inventory Total Vacancy SF
Vacancy Rate
YTD Net Absorption
YTD Deliveries
Under Construction
Rates - All Classes
Outlying Ellis County 12,597,426 SF 508,203 SF 4.03% -128,939 SF 0 SF 0 SF $4.35/SF
Dallas/Fort Worth Total 928,656,554 SF 56,726,317 SF 6.11% 11,677,592 SF 13,171,877 SF 32,658,397 SF $6.56/SF
MARKET BEAT
INDUSTRIAL SUBMARKET REPORT
Market Insights: The Outlying Ellis County Submarket ended the second quarter of 2019 with a vacancy rate of 4.03%. The vacancy rate increased from the previous quarter, with a YTD net absorption of -128,939 SF to finish Q2 2019. Rental rates ended the second quarter at $4.35/SF across all classes, decreasing from $4.45/SF in the previous quarter. As with the previous quarter, there were no new deliveries in Q2 2019, and there is currently 0 SF under construction in the submarket. Located on the southern fringe of the Dallas-Fort Worth metroplex, Outlying Ellis County has abundant flat, buildable land and boasts direct highway access to both Houston and Mexico, via I-45 and I-35E respectively. Activity in this area of the metro is concentrated in the booming SE Dallas/I-45 Submarket to the north. That submarket contains the Union Pacific intermodal in Wilmer, has better east-west highway access via I-20, is closer to major population centers in Dallas, and is still far from being fully built out.
Outlying Ellis County | Q2 2019
400 S Record Street Suite 1100
Dallas, TX 75202
(214) 380-4540 [email protected]
201 Main Street Suite 600
Fort Worth, TX 76102
(817) 502-1518
5830 Granite Parkway Suite 100
Plano, TX 75024
(214) 380-4540
(400,000)
(300,000)
(200,000)
(100,000)
-
Q22018
Q32018
Q42018
Q12019
Q22019
Net Absorption
$4.25$4.30$4.35$4.40$4.45$4.50
Q22018
Q32018
Q42018
Q12019
Q22019
Gross Asking Rents/SF
0.0%
2.0%
4.0%
6.0%
$4.25$4.30$4.35$4.40$4.45$4.50
Q22018
Q32018
Q42018
Q12019
Q22019
Vacancy Vs Rental Rate
Rental Rate Vacancy2

N Central Ft Worth Ind
East Ft Worth Ind
S Central Tarrant Cnty Ind
Legend
S Central Ft Worth Ind
SouthFt WorthIndustrialMarket
N
30
20
820
820
35WChisolmTrail
Parkway
121
287
199

The market terms, definitions, and statistics in this report are based on CoStar Group, Inc. office statistics. The information contained is gathered from multiple sources considered to be reliable. No warranty or representation, express or implied, is made to the accuracy or completeness of the information contained herein, and same is submitted subject to errors, omissions, change of price,
rental or other conditions, withdrawal without notice, and to any special listing conditions imposed by our principals. © 2017 Whitebox Real Estate, LLC | Data from Costar, Inc
Market Snapshot Rental Rates Vacancy
Under Construction Inventory
Market Statistics
Inventory Total Vacancy SF
Vacancy Rate
YTD Net Absorption
YTD Deliveries
Under Construction
Rates - All Classes
East Fort Worth 26,208,540 SF 1,006,450 SF 3.84% 4,742 SF 0 SF 27,356 SF $6.27/SF
Dallas/Fort Worth Total 928,656,554 SF 56,726,317 SF 6.11% 11,677,592 SF 13,171,877 SF 32,658,397 SF $6.56/SF
MARKET BEAT
INDUSTRIAL SUBMARKET REPORT
Market Insights: The East Fort Worth Submarket ended the second quarter of 2019 with a vacancy rate of 3.84%. The vacancy rate increased from the previous quarter, with a YTD net absorption of 4,742 SF to finish Q2 2019. Rental rates ended the second quarter at $6.27/SF across all classes, increasing from $5.83/SF in the previous quarter. As with the previous quarter, there were no new deliveries in Q2 2019, and there is currently 27,356 SF under construction in the submarket. East Fort Worth shares some of the same attributes as other submarkets in the Mid-Cities, namely good east-west highway access and proximity to the D/FW International Airport. Most of the submarket's inventory is located along either Highway 121 or I-820. The tenant base is made up of a mix of manufacturers and local retail/food distributors. Nearly all East Fort Worth’s stock is made up of lower-functioning assets with clear heights below 32 feet. Most properties are either smaller than 100,000 SF or were built before 1995.
East Fort Worth | Q2 2019
400 S Record Street Suite 1100
Dallas, TX 75202
(214) 380-4540 [email protected]
201 Main Street Suite 600
Fort Worth, TX 76102
(817) 502-1518
5830 Granite Parkway Suite 100
Plano, TX 75024
(214) 380-4540
(200,000) (150,000) (100,000) (50,000)
- 50,000
100,000 150,000
Q22018
Q32018
Q42018
Q12019
Q22019
Net Absorption
$5.40$5.60$5.80$6.00$6.20$6.40$6.60
Q22018
Q32018
Q42018
Q12019
Q22019
Gross Asking Rents/SF
0.0%2.0%4.0%6.0%8.0%
$5.00$5.50$6.00$6.50$7.00
Q22018
Q32018
Q42018
Q12019
Q22019
Vacancy Vs Rental Rate
Rental Rate Vacancy2

The market terms, definitions, and statistics in this report are based on CoStar Group, Inc. office statistics. The information contained is gathered from multiple sources considered to be reliable. No warranty or representation, express or implied, is made to the accuracy or completeness of the information contained herein, and same is submitted subject to errors, omissions, change of price,
rental or other conditions, withdrawal without notice, and to any special listing conditions imposed by our principals. © 2017 Whitebox Real Estate, LLC | Data from Costar, Inc
Market Snapshot Rental Rates Vacancy
Under Construction Inventory
Market Statistics
Inventory Total Vacancy SF
Vacancy Rate
YTD Net Absorption
YTD Deliveries
Under Construction
Rates - All Classes
N Central Fort Worth 11,469,833 SF 287,374 SF 2.51% 89,381 SF 0 SF 0 SF $8.50/SF
Dallas/Fort Worth Total 928,656,554 SF 56,726,317 SF 6.11% 11,677,592 SF 13,171,877 SF 32,658,397 SF $6.56/SF
MARKET BEAT
INDUSTRIAL SUBMARKET REPORT
Market Insights: The N Central Fort Worth Submarket ended the second quarter of 2019 with a vacancy rate of 2.51%. The vacancy rate increased from the previous quarter, with a YTD net absorption of 89,381 SF to finish Q2 2019. Rental rates ended the second quarter at $8.50/SF across all classes, increasing from $7.67/SF in the previous quarter. As with the previous quarter, there were no new deliveries in Q2 2019, and there is currently 0 SF under construction in the submarket. The submarket contains very few large or highly functional industrial buildings. Fewer than 10 assets are larger than 100,000 SF, and no properties were built this cycle. Vacancies in North Central Fort Worth are tight and likely to stay that way due to the lack of expected supply. One potential trend here is the repurposing of industrial space for office or residential uses, especially in and around Downtown Fort Worth, as the city has a number of TIF districts set up to incentivize growth in these neighborhoods.
N Central Fort Worth | Q2 2019
400 S Record Street Suite 1100
Dallas, TX 75202
(214) 380-4540 [email protected]
201 Main Street Suite 600
Fort Worth, TX 76102
(817) 502-1518
5830 Granite Parkway Suite 100
Plano, TX 75024
(214) 380-4540
(250,000) (200,000) (150,000) (100,000) (50,000)
- 50,000
100,000 150,000
Q22018
Q32018
Q42018
Q12019
Q22019
Net Absorption
$0.00$2.00$4.00$6.00$8.00
$10.00
Q22018
Q32018
Q42018
Q12019
Q22019
Gross Asking Rents/SF
0.0%1.0%2.0%3.0%4.0%
$0.00
$5.00
$10.00
Q22018
Q32018
Q42018
Q12019
Q22019
Vacancy Vs Rental Rate
Rental Rate Vacancy2

The market terms, definitions, and statistics in this report are based on CoStar Group, Inc. office statistics. The information contained is gathered from multiple sources considered to be reliable. No warranty or representation, express or implied, is made to the accuracy or completeness of the information contained herein, and same is submitted subject to errors, omissions, change of price,
rental or other conditions, withdrawal without notice, and to any special listing conditions imposed by our principals. © 2017 Whitebox Real Estate, LLC | Data from Costar, Inc
Market Snapshot Rental Rates Vacancy
Under Construction Inventory
Market Statistics
Inventory Total Vacancy SF
Vacancy Rate
YTD Net Absorption
YTD Deliveries
Under Construction
Rates - All Classes
S Central Fort Worth 10,801,389 SF 190,873 SF 1.77% -7,842 SF 0 SF 0 SF $5.51/SF
Dallas/Fort Worth Total 928,656,554 SF 56,726,317 SF 6.11% 11,677,592 SF 13,171,877 SF 32,658,397 SF $6.56/SF
MARKET BEAT
INDUSTRIAL SUBMARKET REPORT
Market Insights: The S Central Fort Worth Submarket ended the second quarter of 2019 with a vacancy rate of 1.77%. The vacancy rate decreased from the previous quarter, with a YTD net absorption of -7,842 SF to finish Q2 2019. Rental rates ended the second quarter at $5.51/SF across all classes, decreasing from $6.40/SF in the previous quarter. As with the previous quarter, there were no new deliveries in Q2 2019, and there is currently 0 SF under construction in the submarket. South Central Fort Worth contains the primarily residential areas south and west of the Fort Worth CBD, and most of the commercial activity here is in the office and multifamily sectors. Most of the industrial inventory in this submarket is located along I-35W and in the Near Southside neighborhood adjacent to Downtown Fort Worth. The submarket has a high concentration of older stock, with 75% of the inventory built prior to 1970. Vacancies usually trend below the metro average, and tenant movement is rare.
S Central Fort Worth | Q2 2019
400 S Record Street Suite 1100
Dallas, TX 75202
(214) 380-4540 [email protected]
201 Main Street Suite 600
Fort Worth, TX 76102
(817) 502-1518
5830 Granite Parkway Suite 100
Plano, TX 75024
(214) 380-4540
(80,000) (60,000) (40,000) (20,000)
- 20,000 40,000 60,000
Q22018
Q32018
Q42018
Q12019
Q22019
Net Absorption
$0.00
$2.00
$4.00
$6.00
$8.00
Q22018
Q32018
Q42018
Q12019
Q22019
Gross Asking Rents/SF
0.0%
1.0%
2.0%
3.0%
$0.00$2.00$4.00$6.00$8.00
Q22018
Q32018
Q42018
Q12019
Q22019
Vacancy Vs Rental Rate
Rental Rate Vacancy2

The market terms, definitions, and statistics in this report are based on CoStar Group, Inc. office statistics. The information contained is gathered from multiple sources considered to be reliable. No warranty or representation, express or implied, is made to the accuracy or completeness of the information contained herein, and same is submitted subject to errors, omissions, change of price,
rental or other conditions, withdrawal without notice, and to any special listing conditions imposed by our principals. © 2017 Whitebox Real Estate, LLC | Data from Costar, Inc
Market Snapshot Rental Rates Vacancy
Under Construction Inventory
Market Statistics
Inventory Total Vacancy SF
Vacancy Rate
YTD Net Absorption
YTD Deliveries
Under Construction
Rates - All Classes
S Central Tarrant County 24,823,928 SF 1,922,792 SF 7.75% 10,646 SF 766,145 SF 0 SF $7.88/SF
Dallas/Fort Worth Total 928,656,554 SF 56,726,317 SF 6.11% 11,677,592 SF 13,171,877 SF 32,658,397 SF $6.56/SF
MARKET BEAT
INDUSTRIAL SUBMARKET REPORT
Market Insights: The S Central Tarrant County Submarket ended the second quarter of 2019 with a vacancy rate of 7.75%. The vacancy rate increased from the previous quarter, with a YTD net absorption of 10,646 SF to finish Q2 2019. Rental rates ended the second quarter at $7.88/SF across all classes, decreasing from $8.12/SF in the previous quarter. New construction deliveries increased from 457,745 SF to 766,145 SF, and there is currently 0 SF under construction in the submarket. Occupancies took a major hit in late 2017 when Associated Wholesale Grocers moved out of more than one million SF at the Provender Logistics Center. Fundamentals have improved in recent quarters though, and vacancies are back below the submarket's historical average. The submarket had not seen much in terms of construction for nearly a decade until two buildings, totaling nearly 500,000 SF, delivered at the Carter Industrial Park in Q4 2017. Both assets broke ground as purely speculative plays and delivered completely vacant.
S Central Tarrant County | Q2 2019
400 S Record Street Suite 1100
Dallas, TX 75202
(214) 380-4540 [email protected]
201 Main Street Suite 600
Fort Worth, TX 76102
(817) 502-1518
5830 Granite Parkway Suite 100
Plano, TX 75024
(214) 380-4540
(500,000)
-
500,000
1,000,000
1,500,000
Q22018
Q32018
Q42018
Q12019
Q22019
Net Absorption
$0.00$2.00$4.00$6.00$8.00
$10.00
Q22018
Q32018
Q42018
Q12019
Q22019
Gross Asking Rents/SF
0.0%
5.0%
10.0%
$0.00
$5.00
$10.00
Q22018
Q32018
Q42018
Q12019
Q22019
Vacancy Vs Rental Rate
Rental Rate Vacancy2

Western Lonestar/Turnpike Ind
North Trinity Ind
Legend
Eastern Lonestar/Turnpike Ind
Pinnacle - TurnpikeLonestar - DesignDistrict IndustrialMarket
N
30
35E
35E
180/DavisStreet
SingletonBlvd
Loop12
WoodallRodgersFreeway
Dallas Love Field

The market terms, definitions, and statistics in this report are based on CoStar Group, Inc. office statistics. The information contained is gathered from multiple sources considered to be reliable. No warranty or representation, express or implied, is made to the accuracy or completeness of the information contained herein, and same is submitted subject to errors, omissions, change of price,
rental or other conditions, withdrawal without notice, and to any special listing conditions imposed by our principals. © 2017 Whitebox Real Estate, LLC | Data from Costar, Inc
Market Snapshot Rental Rates Vacancy
Under Construction Inventory
Market Statistics
Inventory Total Vacancy SF
Vacancy Rate
YTD Net Absorption
YTD Deliveries
Under Construction
Rates - All Classes
Western Lonestar/ PGB Turnpike 7,760,466 SF 534,113 SF 6.88% 551,755 SF 8,200 SF 2,789,680 SF $5.14/SF
Dallas/Fort Worth Total 928,656,554 SF 56,726,317 SF 6.11% 11,677,592 SF 13,171,877 SF 32,658,397 SF $6.56/SF
MARKET BEAT
INDUSTRIAL SUBMARKET REPORT
Market Insights: The Western Lonestar/PGB Turnpike Submarket ended the second quarter of 2019 with a vacancy rate of 6.88%. The vacancy rate decreased from the previous quarter, with a YTD net absorption of 551,755 SF to finish Q2 2019. Rental rates ended the second quarter at $5.14/SF across all classes, decreasing from $7.84/SF in the previous quarter. New construction deliveries increased from 0 SF to 8,200 SF, and there is currently 2,789,680 SF under construction in the submarket. The submarket underwent a building boom from 2006–09, adding nearly 2 million SF. Construction has picked up in recent years. Most recently, Cherryman Industries took 189,000 SF at the newly built Grand Lakes 4053 in Q2 2019 The bulk of pending supply in the submarket is located at the Dallas Global Industrial Center, where Home Depot recently signed on for 2.3 million SF across two facilities that are currently under construction.
Western Lonestar/PGB Turnpike | Q2 2019
400 S Record Street Suite 1100
Dallas, TX 75202
(214) 380-4540 [email protected]
201 Main Street Suite 600
Fort Worth, TX 76102
(817) 502-1518
5830 Granite Parkway Suite 100
Plano, TX 75024
(214) 380-4540
(600,000) (400,000) (200,000)
- 200,000 400,000 600,000
Q22018
Q32018
Q42018
Q12019
Q22019
Net Absorption
$0.00$2.00$4.00$6.00$8.00
$10.00
Q22018
Q32018
Q42018
Q12019
Q22019
Gross Asking Rents/SF
0.0%5.0%10.0%15.0%20.0%
$0.00
$5.00
$10.00
Q22018
Q32018
Q42018
Q12019
Q22019
Vacancy Vs Rental Rate
Rental Rate Vacancy2

The market terms, definitions, and statistics in this report are based on CoStar Group, Inc. office statistics. The information contained is gathered from multiple sources considered to be reliable. No warranty or representation, express or implied, is made to the accuracy or completeness of the information contained herein, and same is submitted subject to errors, omissions, change of price,
rental or other conditions, withdrawal without notice, and to any special listing conditions imposed by our principals. © 2017 Whitebox Real Estate, LLC | Data from Costar, Inc
Market Snapshot Rental Rates Vacancy
Under Construction Inventory
Market Statistics
Inventory Total Vacancy SF
Vacancy Rate
YTD Net Absorption
YTD Deliveries
Under Construction
Rates - All Classes
Eastern Lonestar/ PGB Turnpike 26,595,727 SF 1,950,841 SF 7.34% -88,549 SF 12,000 SF 1,281,714 SF $4.14/SF
Dallas/Fort Worth Total 928,656,554 SF 56,726,317 SF 6.11% 11,677,592 SF 13,171,877 SF 32,658,397 SF $6.56/SF
MARKET BEAT
INDUSTRIAL SUBMARKET REPORT
Market Insights: The Eastern Lonestar/PGB Turnpike Submarket ended the second quarter of 2019 with a vacancy rate of 7.34%. The vacancy rate decreased from the previous quarter, with a YTD net absorption of -88,549 SF to finish Q2 2019. Rental rates ended the second quarter at $4.14/SF across all classes, decreasing from $5.17/SF in the previous quarter. YTD new construction deliveries have held steady at 12,000 SF, and there is currently 1,281,714 SF under construction in the submarket. Despite the submarket’s in-town location, asking rents are relatively low. One contributing factor may the number of older buildings found in the submarket. Those rents are comparable with those in South Dallas, as opposed to rents in land-constrained submarkets near the. Following the metro trend, rent growth has remained robust in this cycle, and rents are now about 35% above their prerecession peak.
Eastern Lonestar/PGB Turnpike | Q2 2019
400 S Record Street Suite 1100
Dallas, TX 75202
(214) 380-4540 [email protected]
201 Main Street Suite 600
Fort Worth, TX 76102
(817) 502-1518
5830 Granite Parkway Suite 100
Plano, TX 75024
(214) 380-4540
(800,000)
(600,000)
(400,000)
(200,000)
-
Q22018
Q32018
Q42018
Q12019
Q22019
Net Absorption
$0.00$1.00$2.00$3.00$4.00$5.00$6.00
Q22018
Q32018
Q42018
Q12019
Q22019
Gross Asking Rents/SF
0.0%
5.0%
10.0%
$0.00
$2.00
$4.00
$6.00
Q22018
Q32018
Q42018
Q12019
Q22019
Vacancy Vs Rental Rate
Rental Rate Vacancy2
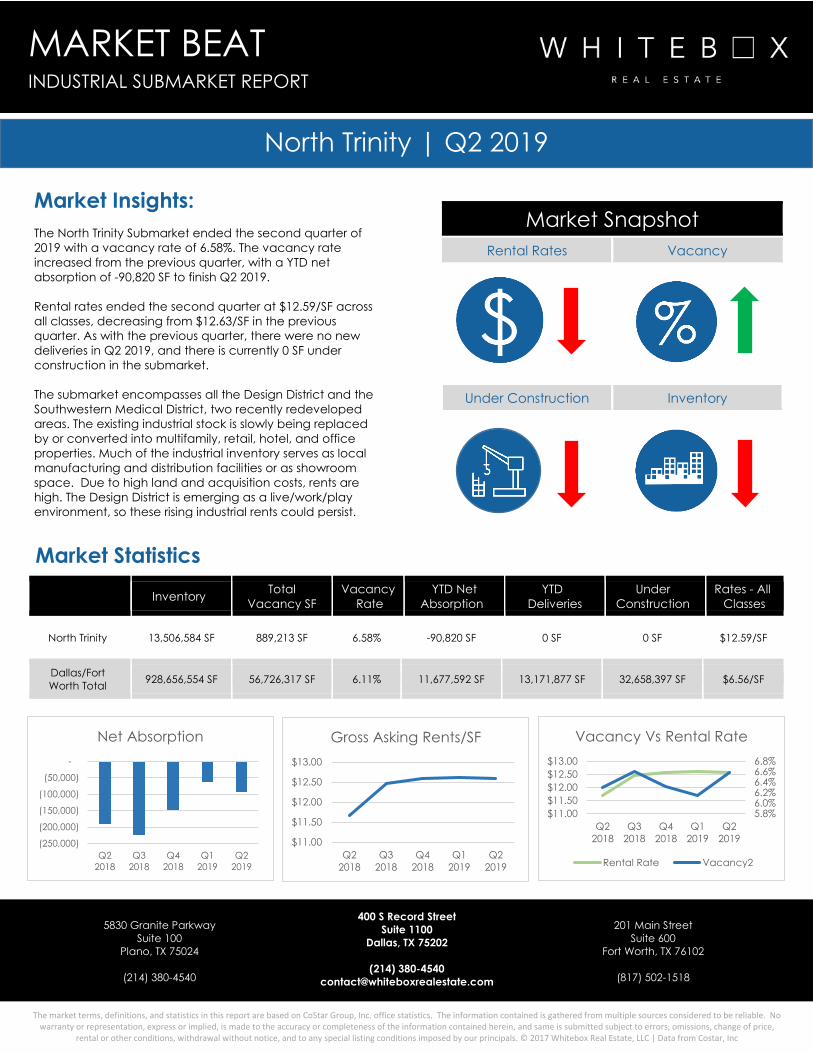
The market terms, definitions, and statistics in this report are based on CoStar Group, Inc. office statistics. The information contained is gathered from multiple sources considered to be reliable. No warranty or representation, express or implied, is made to the accuracy or completeness of the information contained herein, and same is submitted subject to errors, omissions, change of price,
rental or other conditions, withdrawal without notice, and to any special listing conditions imposed by our principals. © 2017 Whitebox Real Estate, LLC | Data from Costar, Inc
Market Snapshot Rental Rates Vacancy
Under Construction Inventory
Market Statistics
Inventory Total Vacancy SF
Vacancy Rate
YTD Net Absorption
YTD Deliveries
Under Construction
Rates - All Classes
North Trinity 13,506,584 SF 889,213 SF 6.58% -90,820 SF 0 SF 0 SF $12.59/SF
Dallas/Fort Worth Total 928,656,554 SF 56,726,317 SF 6.11% 11,677,592 SF 13,171,877 SF 32,658,397 SF $6.56/SF
MARKET BEAT
INDUSTRIAL SUBMARKET REPORT
Market Insights: The North Trinity Submarket ended the second quarter of 2019 with a vacancy rate of 6.58%. The vacancy rate increased from the previous quarter, with a YTD net absorption of -90,820 SF to finish Q2 2019. Rental rates ended the second quarter at $12.59/SF across all classes, decreasing from $12.63/SF in the previous quarter. As with the previous quarter, there were no new deliveries in Q2 2019, and there is currently 0 SF under construction in the submarket. The submarket encompasses all the Design District and the Southwestern Medical District, two recently redeveloped areas. The existing industrial stock is slowly being replaced by or converted into multifamily, retail, hotel, and office properties. Much of the industrial inventory serves as local manufacturing and distribution facilities or as showroom space. Due to high land and acquisition costs, rents are high. The Design District is emerging as a live/work/play environment, so these rising industrial rents could persist.
North Trinity | Q2 2019
400 S Record Street Suite 1100
Dallas, TX 75202
(214) 380-4540 [email protected]
201 Main Street Suite 600
Fort Worth, TX 76102
(817) 502-1518
5830 Granite Parkway Suite 100
Plano, TX 75024
(214) 380-4540
(250,000)
(200,000)
(150,000)
(100,000)
(50,000)
-
Q22018
Q32018
Q42018
Q12019
Q22019
Net Absorption
$11.00
$11.50
$12.00
$12.50
$13.00
Q22018
Q32018
Q42018
Q12019
Q22019
Gross Asking Rents/SF
5.8%6.0%6.2%6.4%6.6%6.8%
$11.00$11.50$12.00$12.50$13.00
Q22018
Q32018
Q42018
Q12019
Q22019
Vacancy Vs Rental Rate
Rental Rate Vacancy2

5830 Granite ParkwaySuite 100
Plano, TX 75024
(214) 380-4540www.whiteboxrealestate.com
400 S Record StreetSuite 1100
Dallas, TX 75202
(214) 380-4540www.whiteboxrealestate.com
201 Main StreetSuite 600
Fort Worth, TX 76102
(817) 502-1518www.whiteboxrealestate.com