Industrial Manufacturing M&A Insights 3Q 2016 -FINAL …€¦ · · 2016-11-16The following is an...
6
Global industrial manufacturing deal activity significantly outpaced that of most other sectors in Q3 2016. This may suggest deal makers’ economic and geopolitical concerns in certain sectors have begun to subside. Executivesummary The following is an analysis of Global Industrial Manufacturing deals with disclosed value greater than $50 million. Global Industrial Manufacturing M&A deal value for the first nine months of 2016 decreased 10% compared to the first nine months of 2015. This was driven by a 22% decrease in volume period over period. When comparing Q3 2016 vs. Q2 2016 there was double digit growth in both deal value and volume. The current quarter was highlighted by 58 deals announced with a total disclosed value of $20.3 billion compared to 49 deals announced with total disclosed value of $12.3 billion in Q2, resulting in an 18% and 65% increase, respectively. The largest deal announced in Q3 2016 was the deal between Emerson and Pentair PLC-Valves & Controls Business ($3.2 billion). In Q3 2016, financial investor participation rates decreased to levels not seen since late 2013, with a deal value participation rate of 17% and deal volume participation rate of 21%. The improvement in deal activity in Q3 2016 may be a sign that deal makers’ economic and geopolitical concerns, both in the US and globally, have begun to subside. We are cautiously optimistic that Q4 2016 and fiscal 2017 will continue to be a good environment for deal makers. • Deal value for the first nine months of 2016 vs. the same period of 2015 was $64.8 billion and $72.4 billion, respectively, a 10% decline. • Deal volume for the first nine months of 2016 saw 155 deals compared to 199 in the same period of 2015, a 22% decline. • Deal value increased in Q3 2016 to $20.3 billion, a 65% increase from Q2 2016. • There were five large deals ($1 to $5 billion) in Q3 2016 with total aggregate deal value of $9.9 billion, representing 45% of total deal value for the period. • Q3 2016 deal activity was highlighted by the Emerson Electrics’ acquisition of Pentair PLC- Valves & Controls Business ($3.2 billion) and Gree Electric Appliances’ acquisition of Zhuhai Yinlong Energy ($2.4 billion). • For Q3 2016 Industrial Machinery and Fabricated Metal Products sub-sectors continue to account for the bulk of total deal value with $6.8 billion and $4.4 billion of deal value, respectively. • Deal activity in Q3 2016 was dominated by strategic investors, as they drove 83% and 79% of transactions in both deal value and volume, respectively. Key trends/highlights — Paul Elie, US Industrial Manufacturing Deals Leader PwC Deals Global Industrial Manufacturing M&A Deals Insights Q3 2016 Optimize deals Source: Thomson Reuters 24% 18% Optimize Deals Global Industrial Manufacturing Deals Insights Q3 2016 update 1 Value by the numbers Increase in deal value versus Q2 2016 10% Decrease in deal value versus YTD Sept. 15 $64.8B 65% Volume by the numbers Increase in deal volume versus Q2 2016 155 Decrease in deal volume versus YTD Sept. 15 22% 18%
Transcript of Industrial Manufacturing M&A Insights 3Q 2016 -FINAL …€¦ · · 2016-11-16The following is an...
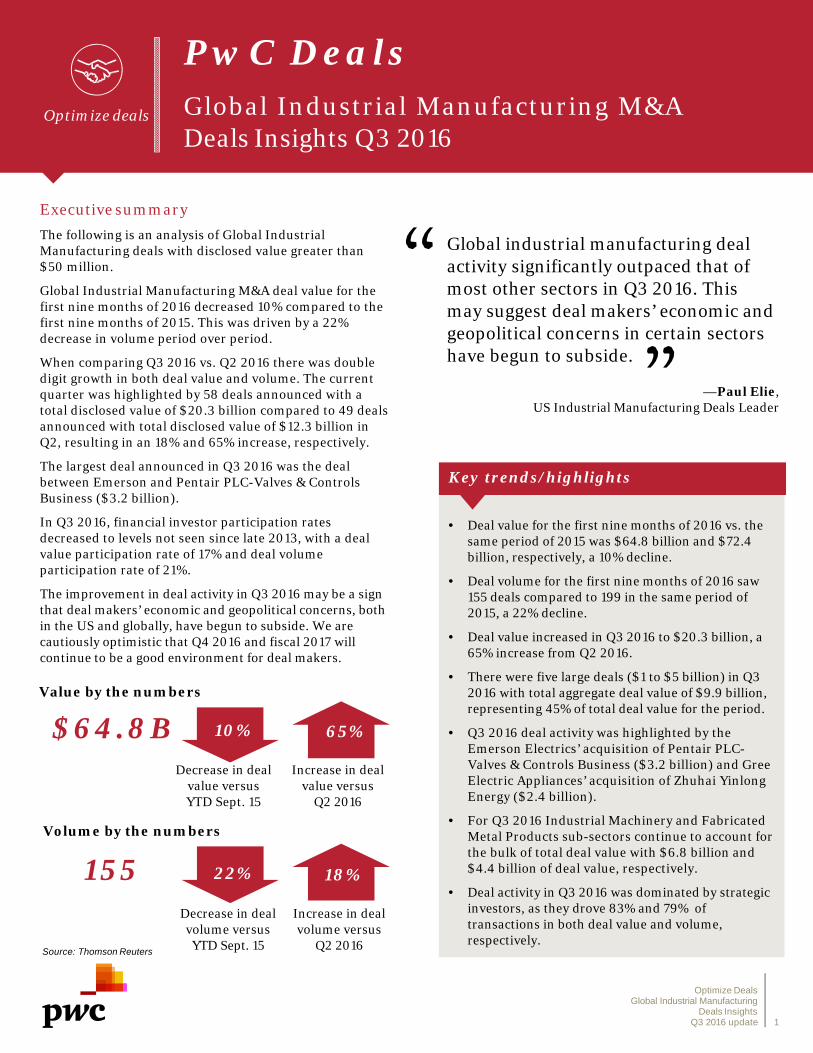
Global industrial manufacturing deal activity significantly outpaced that of most other sectors in Q3 2016. This may suggest deal makers’ economic and geopolitical concerns in certain sectors have begun to subside.
Executive summary
The following is an analysis of Global Industrial Manufacturing deals with disclosed value greater than $50 million.
Global Industrial Manufacturing M&A deal value for the first nine months of 2016 decreased 10% compared to the first nine months of 2015. This was driven by a 22% decrease in volume period over period.
When comparing Q3 2016 vs. Q2 2016 there was double digit growth in both deal value and volume. The current quarter was highlighted by 58 deals announced with a total disclosed value of $20.3 billion compared to 49 deals announced with total disclosed value of $12.3 billion in Q2, resulting in an 18% and 65% increase, respectively.
The largest deal announced in Q3 2016 was the deal between Emerson and Pentair PLC-Valves & Controls Business ($3.2 billion).
In Q3 2016, financial investor participation rates decreased to levels not seen since late 2013, with a deal value participation rate of 17% and deal volume participation rate of 21%.
The improvement in deal activity in Q3 2016 may be a sign that deal makers’ economic and geopolitical concerns, both in the US and globally, have begun to subside. We are cautiously optimistic that Q4 2016 and fiscal 2017 will continue to be a good environment for deal makers.
Optimize deals
• Deal value for the first nine months of 2016 vs. the same period of 2015 was $64.8 billion and $72.4billion, respectively, a 10% decline.
• Deal volume for the first nine months of 2016 saw 155 deals compared to 199 in the same period of 2015, a 22% decline.
• Deal value increased in Q3 2016 to $20.3 billion, a 65% increase from Q2 2016.
• There were five large deals ($1 to $5 billion) in Q3 2016 with total aggregate deal value of $9.9 billion, representing 45% of total deal value for the period.
• Q3 2016 deal activity was highlighted by the Emerson Electrics’ acquisition of Pentair PLC-Valves & Controls Business ($3.2 billion) and Gree Electric Appliances’ acquisition of Zhuhai Yinlong Energy ($2.4 billion).
• For Q3 2016 Industrial Machinery and Fabricated Metal Products sub-sectors continue to account for the bulk of total deal value with $6.8 billion and $4.4 billion of deal value, respectively.
• Deal activity in Q3 2016 was dominated by strategic investors, as they drove 83% and 79% of transactions in both deal value and volume, respectively.
Key trends/highlights
— Paul Elie,US Industrial Manufacturing Deals Leader
PwC DealsGlobal Industrial Manufacturing M&ADeals Insights Q3 2016
Optimize deals
Source: Thomson Reuters
24%18%
Optimize DealsGlobal Industrial Manufacturing
Deals InsightsQ3 2016 update 1
Value by the numbers
Increase in deal value versus
Q2 2016
10%
Decrease in deal value versus YTD Sept. 15
$64.8B 65%
Volume by the numbers
Increase in deal volume versus
Q2 2016
155Decrease in deal volume versusYTD Sept. 15
22% 18%
Optimize deals
$11 $15 $53 $29 $28 $23 $29 $21 $21 $32 $12 $20
4236
57 59
73
6367 69
74
48 4958
0
10
20
30
40
50
60
70
80
0
10
20
30
40
50
60
4Q13
1Q14
2Q14
3Q14
4Q14
1Q15
2Q15
3Q15
4Q15
1Q16
2Q16
3Q16
De
al V
olu
me
Dis
clo
sed
De
al V
alu
e (
$b
n)
Disclosed Deal Value Deal Volume (R-Axis)Source: Thomson Reuters and other publicly available sources
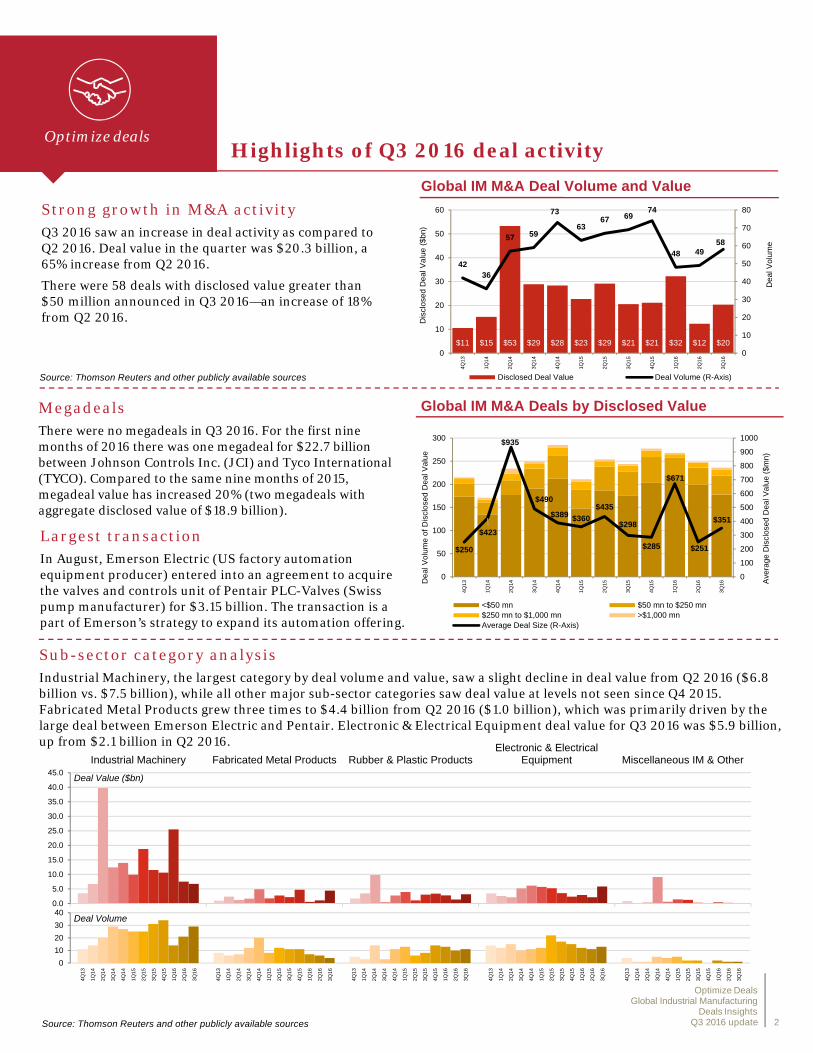
Largest transactionIn August, Emerson Electric (US factory automation equipment producer) entered into an agreement to acquire the valves and controls unit of Pentair PLC-Valves (Swiss pump manufacturer) for $3.15 billion. The transaction is a part of Emerson’s strategy to expand its automation offering.
Strong growth in M&A activityQ3 2016 saw an increase in deal activity as compared to Q2 2016. Deal value in the quarter was $20.3 billion, a 65% increase from Q2 2016.
There were 58 deals with disclosed value greater than $50 million announced in Q3 2016—an increase of 18% from Q2 2016.
Highlights of Q3 2016 deal activity
MegadealsThere were no megadeals in Q3 2016. For the first nine months of 2016 there was one megadeal for $22.7 billion between Johnson Controls Inc. (JCI) and Tyco International (TYCO). Compared to the same nine months of 2015, megadeal value has increased 20% (two megadeals with aggregate disclosed value of $18.9 billion).
Source: Thomson Reuters and other publicly available sources
Sub-sector category analysisIndustrial Machinery, the largest category by deal volume and value, saw a slight decline in deal value from Q2 2016 ($6.8 billion vs. $7.5 billion), while all other major sub-sector categories saw deal value at levels not seen since Q4 2015. Fabricated Metal Products grew three times to $4.4 billion from Q2 2016 ($1.0 billion), which was primarily driven by the large deal between Emerson Electric and Pentair. Electronic & Electrical Equipment deal value for Q3 2016 was $5.9 billion, up from $2.1 billion in Q2 2016.
Global IM M&A Deal Volume and Value
Global IM M&A Deals by Disclosed Value
$250
$423
$935
$490
$389 $360
$435
$298
$285
$671
$251
$351
0
100
200
300
400
500
600
700
800
900
1000
0
50
100
150
200
250
300
4Q13
1Q14
2Q14
3Q14
4Q14
1Q15
2Q15
3Q15
4Q15
1Q16
2Q16
3Q16 A
vera
ge D
iscl
ose
d D
ea
l Va
lue
($
mn
)
De
al V
olu
me
of D
iscl
ose
d D
ea
l Va
lue
<$50 mn $50 mn to $250 mn$250 mn to $1,000 mn >$1,000 mnAverage Deal Size (R-Axis)
Industrial Machinery Fabricated Metal Products Rubber & Plastic ProductsElectronic & Electrical
Equipment Miscellaneous IM & Other
0.0
5.0
10.0
15.0
20.0
25.0
30.0
35.0
40.0
45.0
0
10
20
30
40
Deal Value ($bn)
Deal Volume
Optimize DealsGlobal Industrial Manufacturing
Deals InsightsQ3 2016 update 2
4Q13
1Q14
2Q14
3Q14
4Q14
1Q15
2Q15
3Q15
4Q15
1Q16
2Q16
3Q16
4Q13
1Q14
2Q14
3Q14
4Q14
1Q15
2Q15
3Q15
4Q15
1Q16
2Q16
3Q16
4Q13
1Q14
2Q14
3Q14
4Q14
1Q15
2Q15
3Q15
4Q15
1Q16
2Q16
3Q16
4Q13
1Q14
2Q14
3Q14
4Q14
1Q15
2Q15
3Q15
4Q15
1Q16
2Q16
3Q16
1Q14
4Q14
3Q15
2Q16
3Q14
2Q15
1Q16
4Q13
3Q16
2Q14
1Q15
4Q15
Optimize deals
3Q
14
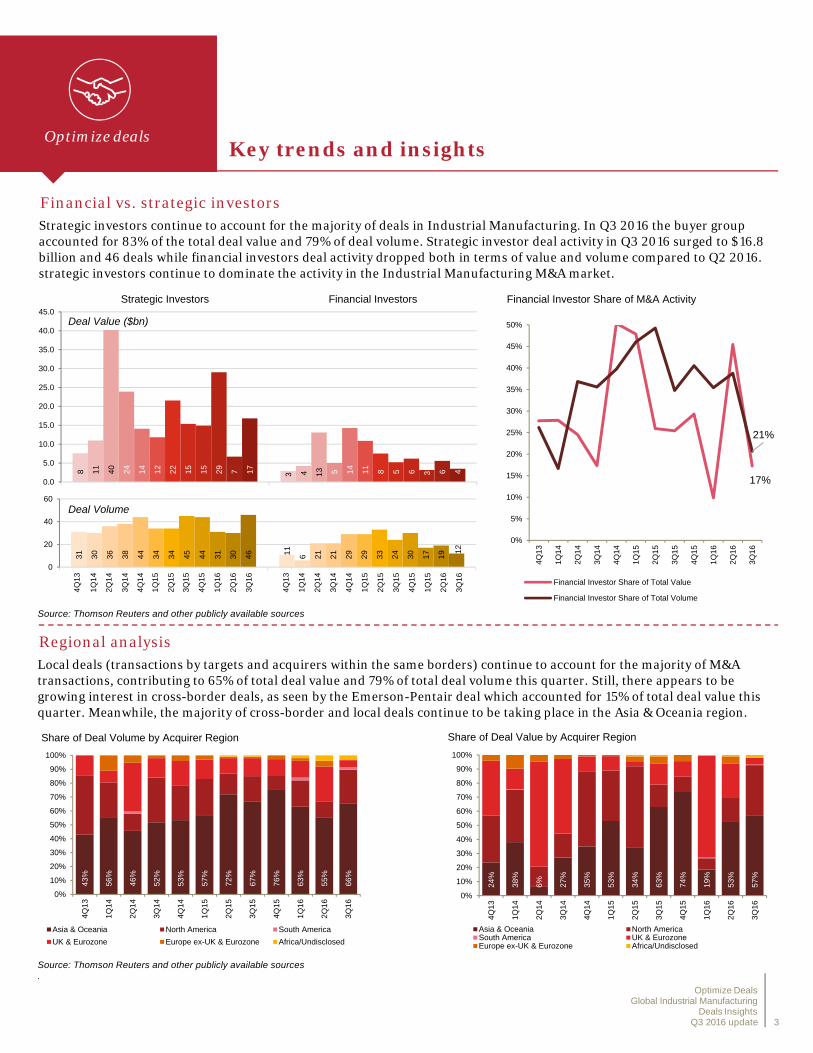
Key trends and insights
Financial vs. strategic investorsStrategic investors continue to account for the majority of deals in Industrial Manufacturing. In Q3 2016 the buyer group accounted for 83% of the total deal value and 79% of deal volume. Strategic investor deal activity in Q3 2016 surged to $16.8 billion and 46 deals while financial investors deal activity dropped both in terms of value and volume compared to Q2 2016. strategic investors continue to dominate the activity in the Industrial Manufacturing M&A market.
Regional analysisLocal deals (transactions by targets and acquirers within the same borders) continue to account for the majority of M&A transactions, contributing to 65% of total deal value and 79% of total deal volume this quarter. Still, there appears to be growing interest in cross-border deals, as seen by the Emerson-Pentair deal which accounted for 15% of total deal value this quarter. Meanwhile, the majority of cross-border and local deals continue to be taking place in the Asia & Oceania region.
Source: Thomson Reuters and other publicly available sources.
Source: Thomson Reuters and other publicly available sources
17%
21%
0%
5%
10%
15%
20%
25%
30%
35%
40%
45%
50%
4Q
13
1Q
14
2Q
14
3Q
14
4Q
14
1Q
15
2Q
15
3Q
15
4Q
15
1Q
16
2Q
16
3Q
16
Financial Investor Share of M&A Activity
Financial Investor Share of Total Value
Financial Investor Share of Total Volume
8 311
440
1324 514
14
12
11
22 815 515 629
37 617 4
Strategic Investors Financial Investors
0.0
5.0
10.0
15.0
20.0
25.0
30.0
35.0
40.0
45.0
4Q
13
1Q
14
2Q
14
3Q
14
4Q
14
1Q
15
2Q
15
3Q
15
4Q
15
1Q
16
2Q
16
3Q
16
4Q
13
1Q
14
2Q
14
4Q
14
1Q
15
2Q
15
3Q
15
4Q
15
1Q
15
2Q
16
3Q
16
31 11
30 636
21
38
21
44
29
34
29
34
33
45
24
44
30
31
17
30
19
46 1
2
0
20
40
60
Deal Value ($bn)
Deal Volume
43
%
56
%
46
%
52
%
53
%
57
%
72
%
67
%
76
%
63
%
55
%
66
%
0%
10%
20%
30%
40%
50%
60%
70%
80%
90%
100%
4Q
13
1Q
14
2Q
14
3Q
14
4Q
14
1Q
15
2Q
15
3Q
15
4Q
15
1Q
16
2Q
16
3Q
16
Share of Deal Volume by Acquirer Region
Asia & Oceania North America South America
UK & Eurozone Europe ex-UK & Eurozone Africa/Undisclosed
24
%
38
%
6%
27
%
35
%
53
%
34
%
63
%
74
%
19
%
53
%
57
%
0%
10%
20%
30%
40%
50%
60%
70%
80%
90%
100%
4Q
13
1Q
14
2Q
14
3Q
14
4Q
14
1Q
15
2Q
15
3Q
15
4Q
15
1Q
16
2Q
16
3Q
16
Share of Deal Value by Acquirer Region
Asia & Oceania North AmericaSouth America UK & EurozoneEurope ex-UK & Eurozone Africa/Undisclosed
Optimize DealsGlobal Industrial Manufacturing
Deals InsightsQ3 2016 update 3
Optimize dealsKey trends and insights
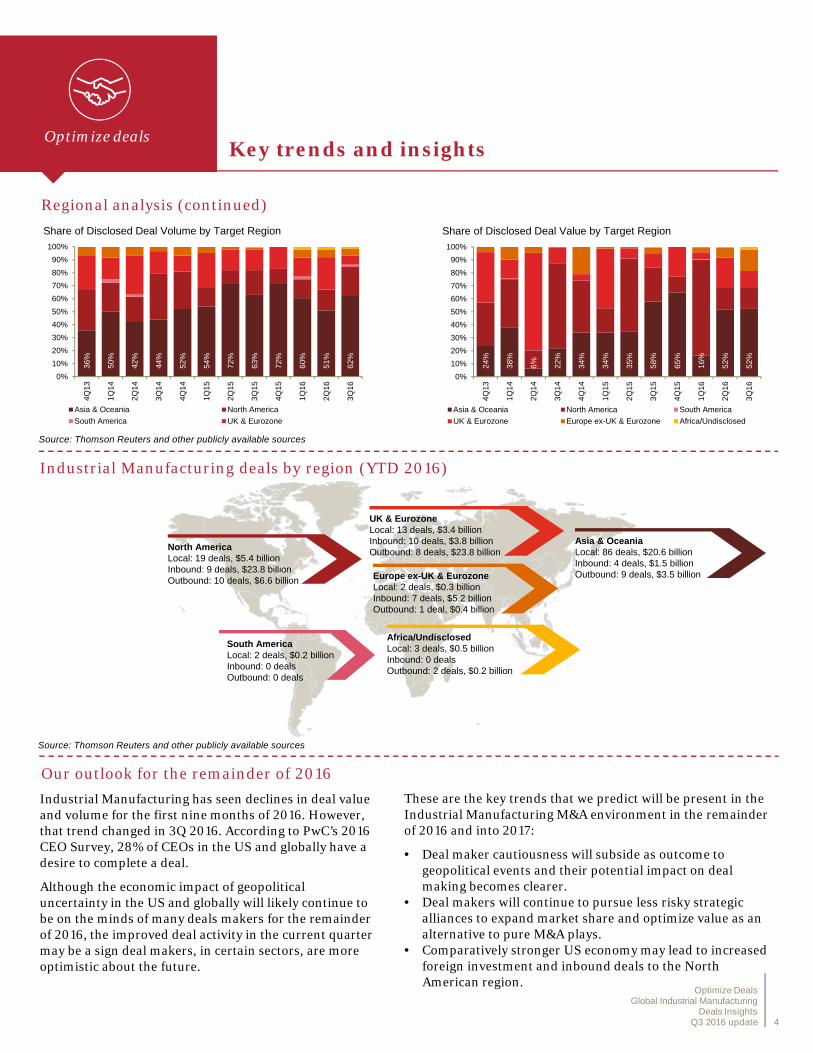
Regional analysis (continued)
Industrial Manufacturing deals by region (YTD 2016)
Source: Thomson Reuters and other publicly available sources
Europe ex-UK & EurozoneLocal: 2 deals, $0.3 billionInbound: 7 deals, $5.2 billionOutbound: 1 deal, $0.4 billion
South AmericaLocal: 2 deals, $0.2 billion Inbound: 0 dealsOutbound: 0 deals
UK & EurozoneLocal: 13 deals, $3.4 billionInbound: 10 deals, $3.8 billionOutbound: 8 deals, $23.8 billion
Asia & OceaniaLocal: 86 deals, $20.6 billionInbound: 4 deals, $1.5 billionOutbound: 9 deals, $3.5 billion
North AmericaLocal: 19 deals, $5.4 billionInbound: 9 deals, $23.8 billionOutbound: 10 deals, $6.6 billion
Africa/UndisclosedLocal: 3 deals, $0.5 billionInbound: 0 dealsOutbound: 2 deals, $0.2 billion
36
%
50
%
42
%
44
%
52
%
54
%
72
%
63
%
72
%
60
%
51
%
62
%
0%
10%
20%
30%
40%
50%
60%
70%
80%
90%
100%
4Q
13
1Q
14
2Q
14
3Q
14
4Q
14
1Q
15
2Q
15
3Q
15
4Q
15
1Q
16
2Q
16
3Q
16
Share of Disclosed Deal Volume by Target Region
Asia & Oceania North America
South America UK & Eurozone
24
%
38
%
6%
22
%
34
%
34
%
35
%
58
%
65
%
16
%
52
%
52
%
0%
10%
20%
30%
40%
50%
60%
70%
80%
90%
100%
4Q
13
1Q
14
2Q
14
3Q
14
4Q
14
1Q
15
2Q
15
3Q
15
4Q
15
1Q
16
2Q
16
3Q
16
Share of Disclosed Deal Value by Target Region
Asia & Oceania North America South America
UK & Eurozone Europe ex-UK & Eurozone Africa/Undisclosed
Source: Thomson Reuters and other publicly available sources
Optimize DealsGlobal Industrial Manufacturing
Deals InsightsQ3 2016 update 4
Our outlook for the remainder of 2016
Industrial Manufacturing has seen declines in deal value and volume for the first nine months of 2016. However, that trend changed in 3Q 2016. According to PwC’s 2016 CEO Survey, 28% of CEOs in the US and globally have a desire to complete a deal.
Although the economic impact of geopolitical uncertainty in the US and globally will likely continue to be on the minds of many deals makers for the remainder of 2016, the improved deal activity in the current quarter may be a sign deal makers, in certain sectors, are more optimistic about the future.
These are the key trends that we predict will be present in the Industrial Manufacturing M&A environment in the remainder of 2016 and into 2017:
• Deal maker cautiousness will subside as outcome to geopolitical events and their potential impact on deal making becomes clearer.
• Deal makers will continue to pursue less risky strategic alliances to expand market share and optimize value as an alternative to pure M&A plays.
• Comparatively stronger US economy may lead to increased foreign investment and inbound deals to the North American region.

Optimize deals
Announced Target name Target nation Acquirer name Acquirer nation Status Deal value* Category
05/13/15 Pall Corp. United States Danaher Corp. United States Completed 13,700 Industrial Machinery
09/01/15 China Shipbuilding Industry Corp.-Assets China Fengfan Stock Co. Ltd. China Completed 5,189 Industrial Machinery
03/31/15Koninklijke Philips Electronics NV-LED Components & Automotive Lighting Businesses
Netherlands Investor Group China Withdrawn 2,900 Electronic & Electrical Equipment
10/15/15 Shandong Iron & Steel Co. Ltd.-Jinan Branch Assets China Shandong Iron & Steel Group Co. Ltd. China Pending 2,020 Fabricated Metal Products
01/29/15 The Manitowoc Co. Inc.-Foodservice Business United States Shareholders United States Completed 1,890 Industrial Machinery
12/03/15 China Railway Group Ltd.-Assets China China Railway Erju Co. Ltd. China Pending 1,843 Fabricated Metal Products
12/21/15 Hussmann Parent Inc. United States Panasonic Corp. Japan Completed 1,545 Industrial Machinery
03/11/15 Domino Printing Sciences PLC United Kingdom Brother Industries Ltd. Japan Completed 1,539 Industrial Machinery
07/13/15 Waddington Group Inc. United States Jarden Corp. United States Completed 1,350 Rubber & Plastic Products
06/23/15 Zoje Resources Investment Co. Ltd. China Investor Group China Pending 1,320 Industrial Machinery
Announced Target name Target nation Acquirer name Acquirer nation Status Deal value* Category
01/25/16 Johnson Controls Inc. United States Tyco International PLC Ireland-Rep Completed 22,660 Industrial Machinery
08/18/16 Pentair PLC-Valves & Controls Business Switzerland Emerson Electric Co. United States Pending 3,150 Fabricated Metal Products
06/16/16 Hermes Microvision Inc. Taiwan Ai Pu Ssu Lung Co. Ltd. Taiwan Pending 3,093 Industrial Machinery
08/19/16 Zhuhai Yinlong Energy Co. Ltd. China Gree Electric Appliances Inc. of Zhuhai China Pending 2,421 Electronic & Electrical Equipment
09/19/16China High Speed Transmission Equipment Group Co. Ltd.
Hong Kong Five Seasons XVI Ltd. Hong Kong Intended 2,098 Industrial Machinery
08/02/16 Leroy-Somer Holding SA France Nidec Corp. Japan Pending 1,200 Electronic & Electrical Equipment
01/25/16 Icopal A/S Denmark GAF Corp. United States Completed 1,080 Rubber & Plastic Products
09/12/16 Samsung Electronics Co. Ltd.-Printer Business South Korea HP Inc. United States Pending 1,050 Industrial Machinery
05/09/16 Saft Groupe SA France Total SA France Completed 1,014 Electronic & Electrical Equipment
01/11/16 Kraussmaffei Group GmbH Germany Investor Group China Completed 1,012 Industrial Machinery
Key trends and insights
Top 10 Industrial Manufacturing deals 2016 (YTD)
Top 10 Industrial Manufacturing deals 2015
Top 10 Industrial Manufacturing deals 2014Announced Target name Target nation Acquirer name Acquirer nation Status Deal value* Category
04/30/14 Alstom SA-Energy Businesses France General Electric Co.-Energy Assets United States Completed 10,702 Industrial Machinery
09/21/14 Dresser-Rand Group Inc. United States Siemens AG Germany Completed 6,687 Industrial Machinery
04/01/14 Metso Oyj Finland Weir Group PLC United Kingdom Withdrawn 6,218 Industrial Machinery
07/16/14 International Game Technology United States GTECH SpA Italy Completed 6,156 Miscellaneous IM & Other
04/27/14 Alstom SA-Gas Business France Siemens AG Germany Withdrawn 5,850 Industrial Machinery
04/04/14 Gates Corp. United States Blackstone Group LP United States Completed 5,400 Rubber & Plastic Products
04/27/14 Alstom SA-Steam & Nuclear Business France Mitsubishi Heavy Industries Ltd. Japan Withdrawn 5,306 Industrial Machinery
10/24/14 Duracell International Inc. United States Berkshire Hathaway Inc. United States Completed 4,700 Electronic & Electrical Equipment
11/24/14 SIG Combibloc Group AG Switzerland Investor Group Canada Completed 4,666 Industrial Machinery
12/17/14 Halla Visteon Climate Control Corp. South Korea Investor Group South Korea Completed 3,540 Industrial Machinery
Optimize DealsGlobal Industrial Manufacturing
Deals InsightsQ3 2016 update 5
* In $US millionsSource: Thomson Reuters and other publicly available sources
Optimize deals
Authors
Paul ElieUS Industrial Manufacturing Deals LeaderDetroit, [email protected](313) 394 3517
Bobby BonoUS Industrial Manufacturing LeaderCharlotte, North [email protected](704) 350 7993
Barry MisthalGlobal Industrial Manufacturing LeaderLausanne, [email protected]+41 58 792 8239
About PwC
© 2016 PwC. All rights reserved. “PwC” and “PwC US” refer to PricewaterhouseCoopers LLP, a Delaware limited liability partnership, which is a member firm of PricewaterhouseCoopers International Limited, each member firm of which is a separate legal entity. This document is for general information purposes only, and should not be used as a substitute for consultation with professional advisors 148535-2016 vc
About thedataThe information presented in this report is an analysis of deals in the global industrial manufacturing. Deal information was sourced from Thomson Reuters and includes sector deals for which targets have an SIC code that falls into one of the 111 industrial manufacturing industry groups. Certain adjustments have been made to the information to exclude transactions which are not specific to industrial manufacturing or incorporate relevant transactions that were omitted from the SIC industry codes.
This analysis includes all individual mergers, acquisitions, and divestitures for disclosed or undisclosed values, leveraged buyouts, privatizations, minority stake purchases, and acquisitions of remaining interest announced between January 1, 2013 and September 30, 2016, with a deal status of completed, intended, partially completed, pending, pending regulatory, pending completion, withdrawn, and unconditional (i.e., initial conditions set forth by the buyer have been met but deal has not been withdrawn and excludes all rumors and seeking buyers). Additionally, transactions that are spin-offs through distribution to existing shareholders are included.
Percentages and values are rounded to the nearest whole number which may result in minor differences when summing totals.
Smart deal makers are perceptive enough to see value others have missed, flexible enough to adjust for the unexpected, aggressive enough to win favorable terms in a competitive environment, and circumspect enough to envision the challenges they will face from the moment the contract is signed. But in a business environment where information can quickly overwhelm, the smartest deal makers look to experienced advisors to help them fashion a deal that works.
PwC’s Deals group can advise industrial manufacturing companies and industrial manufacturing-focused private equity firms on key M&A decisions, from identifying acquisition or divestiture candidates and performing detailed buy-side diligence, to developing strategies for capturing post-deal profits and exiting a deal through a sale, carve-out, or IPO. With more than 9,800 deals professionals in 75 countries, we can deploy seasoned teams that combine industrial manufacturing industry skills with local market knowledge virtually anywhere and everywhere your company operates or executes transactions.
Although every deal is unique, most will benefit from the broad experience we bring to delivering strategic M&A advice, due diligence, transaction structuring, M&A tax, merger integration, valuation, and post-deal services.
In short, we offer integrated solutions, tailored to your particular deal situation and designed to help you extract peak value within your risk profile. Whether your focus is deploying capital through an acquisition or joint venture, raising capital through an IPO or private placement, or harvesting an investment through the divesture process, we can help.
For more information about M&A and related services in the global industrial manufacturing industry, please visit www.pwc.com/us/deals or www.pwc.com/us